Article

The Fate of Nitrogen in Dredged Material Used for Tidal Marsh Restoration

by
Lorie W. Staver
1,*,
Jeffrey C. Cornwell
1,
Nicholas J. Nidzieko
2,
Kenneth W. Staver
3,
J. Court Stevenson
1,
Michael Owens
1,
Walter Boynton
4 and
Leysa Lopez-Gonzalez
5
1
Horn Point Laboratory, Center for Environmental Science, University of Maryland, Cambridge, MD 21613, USA
2
Department of Geography, University of California, Santa Barbara, CA 93016, USA
3
Wye Research and Agriculture Center, University of Maryland, Queenstown, MD 21658, USA
4
Chesapeake Biological Laboratory, Center for Environmental Science, University of Maryland, Solomons, MD 20688, USA
5
Marine Sciences Department, University of Puerto Rico Mayaguez, Mayaguez 00681, Puerto Rico
*
Author to whom correspondence should be addressed.
J. Mar. Sci. Eng. 2021, 9(8), 849; https://doi.org/10.3390/jmse9080849
Submission received: 24 June 2021 / Revised: 29 July 2021 / Accepted: 3 August 2021 / Published: 6 August 2021

Abstract

:
Tidal marsh restoration using dredged material is being undertaken in many coastal areas to replace lost habitat and ecosystem services due to tidal marsh loss. The fate of high levels of nitrogen (N) in fine-grained dredged material used as a substrate for marsh restoration is uncertain, but if exported tidally may cause subtidal habitat degradation. In this study, a mass balance was developed to characterize N fluxes in a two-year-old restored tidal marsh constructed with fine-grained dredged material at Poplar Island, MD, in Chesapeake Bay, and to evaluate the potential impact on the adjacent submersed aquatic vegetation (SAV) habitat. Denitrification and N accumulation in Spartina organic matter were identified as the major sinks (21.31 and 28.5 mg N m−2 d−1, respectively), while tidal export of TN was more modest (9.4 mg N m−2 d−1) and inorganic N export was low (1.59 mg N m−2 d−1). Internal cycling helped retain N within the marsh. Mineralization of N associated with labile organic matter in the dredged material was likely a large, but unquantified, source of N supporting robust plant growth and N exports. Exceedances of SAV water quality habitat requirements in the subtidal region adjacent to the marsh were driven by elevated Chesapeake Bay concentrations rather than enrichment by the marsh.

1. Introduction

Global wetland losses during the last century are estimated to be in excess of 50% [1], with losses of many valuable ecosystem services such as provision of habitat, protection of coastal infrastructure, and nutrient and carbon transformation and sequestration [2]. In Chesapeake Bay, USA, many of these losses have occurred in fringing marshes on islands, hundreds of which have partially or completely eroded since colonial times [3]. Replacing lost habitats and associated ecosystem services is the goal of several current and planned projects utilizing material dredged from navigation channels in the upper Chesapeake Bay. This fine-grained dredged material is rich in nutrients [4], but there are outstanding questions regarding the potential tradeoffs in the beneficial use of fine-grained dredged material for restoring wetlands. While high nutrients may promote the establishment and development of ecosystem functions, there may be negative impacts to the surrounding environment if these nutrients are released from the restoration site.
Eutrophication from anthropogenic inputs of nitrogen (N) and phosphorus (P) has caused profound changes in coastal ecosystems globally [5] and has been identified as the driver behind losses of submersed aquatic vegetation (SAV) [6], often an important ecosystem component of shallow subtidal areas. Efforts to reduce nutrient inputs have become the centerpiece of restoration efforts in many impaired coastal systems, including Chesapeake Bay, where eutrophication has been identified as a key driver of ecosystem change [7] and nutrient reduction is the primary restoration strategy [8].
Nutrients are buried in upper Chesapeake Bay in association with fine-grained terrestrial sediment and labile organic matter that accumulates in deep navigation channels [4]. The use of nutrient-rich dredged material for tidal marsh restoration may contribute to SAV habitat degradation if these nutrients are mobilized and exported via tidal exchange. Although nutrient and organic matter exchange between natural marshes and adjacent coastal areas has been the subject of extensive study [9,10,11], exchanges from restored and created marshes have received much less attention.
Young marshes, which are often nutrient limited, have been hypothesized to accumulate nutrients in the form of organic matter and trapped inorganic sediment, while older marshes reach a steady state with respect to nutrient inputs and exports [12]. This appears to be the case in marshes created with low nutrient substrates, where years to decades may be required for organic matter and nutrients to accumulate to sufficient levels to support heterotrophic processes [13]. These ideas may not apply to young marshes created with a nutrient rich substrate, however, a unique situation resulting from the convergence of eutrophication and modern beneficial use practices. While remobilization and export of nutrients from these restored tidal marshes to the estuary may represent a small fraction of the nutrient budget for a system as large as Chesapeake Bay, the potential for local degradation of subtidal habitat for SAV, which itself is a target of restoration efforts in Chesapeake Bay [14], is more significant.
Nutrient mass balance studies in marshes have helped characterize nutrient fluxes and identify important ecosystem functions [11,15]. The goal of the study presented here was to assess the suitability of fine-grained dredged material as a substrate for tidal marsh restoration through an examination of the N mass balance. The study was conducted in a constructed tidal marsh at the Paul S. Sarbanes Ecosystem Restoration Project at Poplar Island (Poplar Island) in mid-Chesapeake Bay, where the restoration of over 300 hectares (ha) of tidal marsh is underway using nutrient rich, fine-grained dredged sediment from the navigation channels approaching Baltimore Harbor, MD [16]. Previous work has shown that the abundant nutrients support rapid development of marsh vegetation and organic matter accumulation, and robust rates of vertical accretion [17]. As part of the ongoing assessment of the suitability of this material for tidal marsh restoration, we examined the wetland N balance through estimation of the soil N reservoir, standing stocks, and key N fluxes. Data obtained from the extensive Poplar Island monitoring program (sediment characterization, macrophyte biomass, vertical accretion) was combined with targeted studies (e.g., N2-fixation, denitrification) and some off-site data (atmospheric deposition) to assess the fate of N imported with the Upper Bay dredged material. The potential impact on adjacent SAV habitat was also assessed through comparison of key water quality parameters in the tidal water leaving the marsh with SAV habitat requirements in the mesohaline portion of Chesapeake Bay [14].
The abundant N contained in fine-grained dredged material, which promotes the production of marsh vegetation and rapid accumulation of organic matter, also enhances biogeochemical cycling, including denitrification, which can take many years to reach equivalency with natural tidal marshes [18]. The major N fluxes reported here are within the ranges reported for mature natural marshes, suggesting that chronological age is not the best predictor of ecosystem function in restored marshes. While there is some enrichment of the water quality constituents that define SAV habitat requirements in this region of Chesapeake Bay, exceedances appear to be driven by estuarine concentrations rather than tidal export from the marsh. As the marsh matures, it is expected to export less dissolved inorganic N (DIN), potentially providing water quality improvements. Thus, it appears from this study that the restored marshes at Poplar Island are not likely to pose a threat to water quality in the local estuarine habitat.

2. Materials and Methods

2.1. Site Description

Poplar Island, located in mid-Chesapeake Bay, is a large scale remote island habitat restoration project that serves as a placement site for non-contaminated dredged material [19] from the navigation channels approaching Baltimore Harbor and the Chesapeake and Delaware Canal in upper Chesapeake Bay (Figure 1). At completion, the island will have an area of 694 ha, including 314 ha of tidal marsh habitat, subdivided into 12–20 ha parcels (referred to as “cells”). The tides are semi-diurnal, with a mean tide range of 0.34 m [20], and the mean annual surface salinity range (1985–2018) is 10.1–12.5 [21]. The focus of this study was a young marsh, Cell 1B (Figure 1 inset), a 12.4 ha tidal marsh segment developed in 2012. The marsh has a tidal inlet consisting of two adjacent 1.8 m × 1.8 m concrete box culverts and connections to adjacent marshes (Cells 1A and 1C) via shallow channels which facilitate fish passage. Less than 5% of the tidal volume is exchanged via these connecting channels [22]. The marsh area is comprised of 2.51 ha of high marsh (HM), planted with Sporobolus pumilus (syn. Spartina patens), 6.92 ha of low marsh (LM), planted with Spartina alterniflora (syn Sporobolus alterniflorus), 1.79 ha of tidal creek, and a 1.19 ha upland-island, intended to provide habitat for ground nesting birds. The unvegetated habitat island was constructed with a sand substrate to an elevation of 2 m, covered with gravel and shell, and is excluded from the biogeochemical rate calculations presented here, so the total marsh area was considered to be 11.22 ha.

2.2. Nitrogen Standing Stocks and Reservoir

Nitrogen standing stocks were estimated for macrophytic vegetation and the water column in the tidal creeks. For vegetation, annual macrophyte production was estimated in Cell 1B by harvesting aboveground (AG) and belowground (BG) biomass samples at the conclusion of the growing season (October) in 2014. AG biomass was sorted into live and standing dead, with only live biomass considered to contribute to annual production. Live and dead BG biomass were not separated, but very little dead BG biomass had accumulated in this young marsh. Six HM and six LM sites distributed throughout Cell 1B were sampled. Aboveground biomass samples were harvested from 0.25 m2 quadrats. Samples were separated into dead and living biomass prior to drying at 60 °C in a forced draft oven to constant weight. Belowground biomass samples consisted of a single sediment core collected from each of the AG biomass quadrats using a specially fabricated 7.5 cm diameter stainless steel piston corer. Sediment cores were washed free of sediment over a 1 mm mesh sieve, then dried and weighed as described above. Prior to nutrient analyses all samples were ground in a Wiley Mill equipped with a 1 mm mesh screen. Whole shoot samples and root/rhizome samples were analyzed for N content by combustion in pure O2 using an Exeter Analytical, Inc. CE-440 Elemental Analyzer according to standard protocols [23]. Standing stock computations were made using the mean of the 2014 total AG and BG biomass for HM and LM vegetation, and adjusted based on area.
The water column N inventory was estimated using the area of the tidal creeks determined by digitization of aerial imagery obtained in October 2014 (1.79 ha), an average water depth of 1 m, and an average annual total N (TN) concentration on ebb tides obtained in the tidal exchange study described below (45.67 µmol N L−1).
The sediment N reservoir was determined for the marsh platform (9.43 ha) and was partitioned into the root zone (0–15 cm, based on root distribution in the Poplar Island marshes [24] and other studies [25]) and deep (15–200 cm) pools. Total N was calculated for each zone using the mean (±sd) TN concentration of 18 sediment near-surface (0–10 cm depth) samples from Cell 1B collected in 2015 (2.84 ± 0.54 mg N g−1), and a soil density of 1.1 g cm−3 obtained during a 2009 soil density survey [26].

2.3. Mass Balance Terms

Potential nutrient inputs to Cell 1B included atmospheric deposition, tidal exchange, diffusion into the root zone from the deep soil pool, and gaseous exchange with the atmosphere (N only, as N2 fixation). Export terms were tidal exchange, soil accumulation, and gaseous N2 losses (denitrification and possibly anaerobic ammonium oxidation, ANAMOX). Groundwater inputs were considered negligible due to the highly consolidated nature of the dredged material substrate, and the near absence of a watershed draining into the marsh, which minimizes surface runoff inputs. Transfers of N via fauna were not considered as part of this study.

2.3.1. Tidal Exchange

Tidal exchange of N and other dissolved and particulate constituents on an annual basis was estimated from a tidal flux study [17]. In brief, water velocity measurements were made over a period of one to four weeks each season using a Nortek Aquadopp acoustic Doppler profiler (ADP) mounted on a weighted PVC plate and placed in the center of one of the concrete box culverts, equidistant from the open ends and sidewalls. The velocity was determined 45 cm above the current profiler (the location of the first valid measurement) and was presumed to be representative of the mean velocity, without adjustment for any vertical or lateral shear associated with drag from the bottom or sidewalls. Velocities were recorded every ten minutes as an average of two minutes of observations.
Discrete one-liter water samples were collected hourly during two tidal cycles during each ADP deployment using an ISCO model 2700 automatic water sampler positioned above the culvert. The sampling intake was located approximately 30–40 cm above the bottom of the culvert. Subsamples were vacuum filtered using 4.7 cm Whatman GFF glass fiber filters, which were used for total suspended solids (TSS) determination (USEPA Method 160.2, [27]. The filtrate was analyzed for nitrite (NO2) plus nitrate (NO3), NO2, NH4, total dissolved N (TDN), and soluble reactive phosphorus (SRP); unfiltered subsamples were analyzed for TN. Total and dissolved N and P were analyzed colorimetrically on an automated analyzer following USEPA methods [27]. Separate subsamples filtered through Whatman 2.5 cm GFF filters were analyzed colorimetrically for particulate N (PN) on an Exeter Analytical CE-440 Elemental Analyzer, and chlorophyll a fluorometrically following acetone extraction [28]. Volume-weighted concentrations were multiplied by the average tidal prism for each 24 h monitoring period (Table A1) to obtain the flux (q) for each flood or ebb period [17]. The difference between flood and ebb provides the net tidal flux that is relevant for the mass balance, and a total marsh area of 11.22 ha was used to normalize fluxes.

2.3.2. Atmospheric Deposition

To estimate atmospheric N deposition for the Poplar Island study site, TN deposition data from the US EPA Clean Air Status and Trends Network (CASTNET) Site BWR139 located 42 km southeast of Poplar Island was obtained (https://java.epa.gov/castnet/downloadprogress.do, accessed on 1 April 2021). Total N deposition estimates for CASTNET sites are derived from interpolated wet deposition data [29], combined with collected and modelled dry deposition (CMAQ) and precipitation (PRISM) data, to produce national maps of annual atmospheric TN deposition. Data from 2012–2014, coincident with the first two years of the Cell 1B marsh, were used here.

2.3.3. Diffusion

The input of N from sediment below the root zone is assumed to be primarily diffusive due to the relatively high silt (15–55%) and clay (35–80%) contents of typical dredged material placed at Poplar Island [16]. The diffusive flux (Jd) of N from below the root zone was calculated as the flux of NH4, the dominant form of dissolved N in the anaerobic sediment porewater:
Jd = 𝜙 × ΔC/ΔX × Ds,
where 𝜙 = porosity, ∆C/∆X = NH4+ concentration gradient, and Ds = effective diffusion coefficient:
Ds = 𝜙2 × D0,
where D0 = the diffusion coefficient of NH4+ in aqueous solution [30]. An average annual soil temperature (14 °C), obtained using an Onset Hobo Water Temp Pro V2 data logger buried approximately 5 cm below the sediment surface, was used to adjust D0 at 25 °C using the formula:
D0(T) = 19.8 + 0.40(T − 25),
where T = temperature (°C) [31]. A porewater NH4 concentration gradient was obtained using 47 cm-long dialysis samplers [32], deployed at ten locations in Cell 1B in August 2014, and the steepest portion of the concentration gradient (20–47 cm) was used to calculate Jd. Porosities were obtained as part of the initial soil characterization in each Poplar Island marsh (0–10 cm depth), and from a vertical profile in Cell 1B collected in 2017 (0–200 cm depth).

2.3.4. Nitrogen Fixation

Nitrogen fixation was obtained from a series of measurements made in the summer of 2017 using the acetylene reduction assay [33]. Samples were collected on several dates in July from the low marsh in several Poplar Island tidal marshes ranging in age from 2–12 years. Sediment cores were obtained with clear acrylic plastic tubes (inner diameter = 3.75 cm, height = 15 cm). In addition, tidal creek sediments in each marsh were sampled. Samples were incubated for 24 h in a water bath at 28 °C, in constant light for 12 h followed by 12 h in the dark. The headspace was sampled three times during each period to provide a three-point regression for each. Controls with no addition of acetylene were incubated simultaneously. Samples were analyzed within 24 h on a Shimadzu GC-8A gas chromatograph equipped with a flame ionization detector and a HayeSep A column, using a known Matheson Tri-Gas Micromat 14 ethylene standard (100 ppm) and ultra-pure nitrogen as a carrier gas. Nitrogen fixation was estimated assuming a theoretical ratio of three moles of acetylene to one mole of dinitrogen (N2) fixed. Differences between rates determined for day and night in each zone (marsh and creek) were tested using Mann-Whitney Rank Sum tests and were found to be insignificant (p = 0.05). Thus, daily rates were estimated by averaging day and night values for each zone. Although the difference between zones was not significant (Mann Whitney Rank Sum test, p = 0.05), the rate for the whole marsh was calculated as the area-weighted mean of rates for the two zones.

2.3.5. Sediment N Fluxes

An annual rate of denitrification was estimated from sediment-water N2 flux measurements using the N2:Ar ratio [34] on five dates in 2013 and 2014 in Cell 1B. A daily N2 flux was estimated by multiplying representative seasonal light and dark hourly N2 flux rates by the appropriate number of light and dark hours on the date measurements were made and the marsh + creek area (11.22 ha).
Sediment-water NH4 and NO2 plus NO3 (NOx) fluxes measured on five dates were used to estimate annual sediment N fluxes for the marsh. Sediment cores were collected in acrylic tubes with an inside diameter of 7 cm and a length of 30 cm. Marsh cores were collected by hand insertion into the soil and creek bottom using a pole corer. Cores were transported to Horn Point Laboratory where ambient water was added above the soil and they were placed in a water bath for about 4 h in the dark followed by a 2–3 h incubation with gentle stirring under light conditions in most cases. Overlying water was sampled at seven time points, three in the dark, one at the light/dark transition, and three in the light. Four concentration measurements were used in linear regression models to estimate net N fluxes during both light and dark periods. Samples were analyzed for N2, NH4+, and NOx. Annual estimates for all N fluxes were calculated using an area-adjusted mean of all dates. The rates determined here were based on measurements made in the presence of overlying water throughout the incubation period, although the marsh surface in Cell 1B is typically not continuously flooded.

2.3.6. Macrophyte Uptake

An attempt was not made to quantify all internal processes affecting N availability, but the annual N demand for plant growth was estimated using live AG and (total) BG biomass in high and low marsh zones and tissue %N data measured in 2014. An average annual N demand for the marsh was estimated as an area-adjusted mean.

2.3.7. Plant Deposition and Remineralization

Nitrogen remineralization resulting from S. alterniflora shoot decomposition was estimated using biomass production data from Cell 1B and data from a litter bag study conducted in the low marsh of several cells over 22 months spanning 2012–2013. For the litter bag study, eighteen nylon mesh litter bags (20 × 30 cm, mesh size 2 mm; Collins Cottage Industries) were affixed to the sediment surface of each marsh using plastic anchor pins in February 2012. Each bag contained 40 g of dried S. alterniflora shoot material collected in January 2012 from the respective dredged material marshes where the bags were deployed. Three bags were retrieved from each marsh at approximately 3–4 month intervals for eighteen months, with the final collection at 22 months. The bags were gently rinsed to remove loose material attached to the exterior, and detrital material remaining in the bag was removed, dried at 60 °C, weighed, and analyzed for N content. Plant deposition was estimated by multiplying the annual production (AGLive + BG) in the high and low marsh, respectively, by the % dry mass remaining and %N at the conclusion of the decomposition study. Remineralization was estimated by subtracting plant deposition from plant uptake. Decomposition was not tested separately in the HM, so LM values of % dry mass remaining and %N obtained in the decomposition study were applied to the entire marsh area.

2.3.8. N Accumulation

The rate of sediment N accretion was estimated as:
Accumulation = AR × BD × %N,
where AR is the vertical accretion rate, and BD and %N are the soil bulk density and N content, respectively. The accretion rate used was the mean (±se) of 15 sites in the Poplar Island marshes in 2018, 7.4 (±0.62) mm y−1 [17], determined using surface elevation table technology [35]. Established relationships were used to estimate soil bulk density [36] and TN [37] from loss on ignition (LOI) from samples of the layer accreting above feldspar marker horizons at 27 sites assessed in 2018. For the estimate of N accumulation, values of 0.40% and 0.35 g cm−3 were used for percent N and bulk density, respectively.

3. Results

3.1. Standing Stocks

The end of season N standing stock in macrophytic vegetation was 3043 kg (Table 1). The sediment below the root zone contains >90% of TN in the marsh (441,880 kg), while the sediment within the root zone accounts for 8% of the TN stock (Table 2). The macrophyte vegetation at the end of the growing season represents about 7% of the root zone pool, or about 0.5% of the TN pool. Nitrogen in the water column (11.4 kg N) represents <1% of the total estimated N standing stock.

3.2. Exchanges

3.2.1. Tidal Flux

Nitrogen concentrations, mean tidal prisms (Table A1), and calculated fluxes (Table 3) show that there was net export of TN for all monitoring periods, leading to a net annual export of TN (Table 4). There was net export of total dissolved N (TDN), except in May when NO3 drove a small import (Table 3), resulting in a net annual TDN export, primarily as NH4 (Table 4). Particulate N was also exported throughout the year. Fluxes of dissolved inorganic N constituents were generally small compared with TN. On an annual basis we estimated an export of 386 kg (9.42 mg N m−2 d−1) of TN from the Cell 1B marsh (Table 4). Nitrate was imported on an annual basis, while NH4+ was exported. Particulate N was exported at the same magnitude as TN, largely due to a very high summer export.

3.2.2. Atmospheric Deposition

The mean (±sd) annual TN deposition rate for the years 2012–2014 was 9.73 (±0.56) kg N ha−1 (2.66 mg N m−2 d−1), resulting in an annual import of 109 kg N for the marsh.

3.2.3. Diffusion

Using the August 2014 mean porewater NH4 gradient from 20–47 cm, 46.54 µmol cm−1 (Figure 2), at 14 °C (average annual soil temperature), and a range of soil porosities from Cell 1B (Figure 3), the estimated diffusive flux of NH4 from the deep sediment ranged from 5.57–8.85 µmol m−2 h−1 (Table 5). Using the maximum rate, based on a soil porosity of 0.7%, the average of the Cell 1B soil profile (Figure 3), we estimate a net annual input of 122 kg N (2.98 mg N m−2 d−1) for the marsh.

3.2.4. N2-Fixation

N2-fixation rates were low overall, and although there were no significant differences between times or locations (p = 0.05), slightly higher rates were observed in sediment from the marsh platform than from the creek bottom (Figure 4). The area-weighted mean daily rate of N2-fixation for the combined area of the marsh platform and creek bed, measured in July 2017, was 1.33 mg N m−2 d−1 (54.3 kg y−1). All controls showed no acetylene reduction.

3.2.5. Sediment N Fluxes

The estimated fluxes of N2, NH4, and NOx, based on four incubations in 2013–2014 (Table A2), show some seasonal variation in all three constituents (Table 6). A net release of N2, assumed to be due primarily to denitrification, occurred on all dates, with a low in September, a peak in November, and an annual mean of 63.38 µmol N m−2 h−1 (21.3 mg N m−2 d−1). The net annual flux of dissolved N is also out of the sediment, with a net release of NH4, but a net uptake of NOx, generally corresponding to the results of the tidal flux study. The highest NOx import occurred in spring, corresponding with elevated estuarine concentrations recorded at the Chesapeake Bay monitoring buoys CB4.1C and CB4.2C (Figure 5), located approximately 5 km north and 15 km south of Poplar Island, respectively. The NOx flux was out of the sediment in late fall, when plant demand declines due to senescence. Net NH4 fluxes are out of the sediment during the warmer months of the year, when ambient water column concentrations are normally very low, but into the sediment in November.

3.2.6. Macrophyte Uptake

The estimated plant demand for N, based on 2014Live and BG biomass (Table 1), was 2657 kg N (77.19 mg N m−2 d−1).

3.2.7. Plant Deposition and Remineralization

At the conclusion of the litter bag study, a mean (±sd) of 23.98% (±7.09) of the dry mass remained, with a mean %N of 2.06 (±0.58) (Figure 6). Using plant production values of 2574 gdw m−2 and 1185 gdw m−2 for the low marsh (6.92 ha) and high marsh (2.51 ha), respectively, approximately 1630 kg N (47.36 mg N m−2 d−1) was remineralized after 22 months (Table 7), with 1027 kg N (29.84 mg N m−2 d−1) estimated to be remaining in organic material.

3.2.8. Soil N Accretion

The rate of soil N accretion on the marsh platform, estimated from vertical accretion rates measured with SETs (7.4 mm y−1) and soil N density, was 28.5 mg N m−2 d−1 (981 kg y−1).

3.2.9. Budget Summary

Estimates of the major N flux rates and mass fluxes in Cell 1B are summarized in Table 7 and Figure 7.

3.3. SAV Habitat Requirements

Tidal marshes can protect SAV habitat by acting as a sink for anthropogenic nutrients through burial and denitrification [39,40]. A comparison of flood and ebb concentrations of key water quality parameters with SAV habitat requirements (Table 8) shows that while mean growing season DIN and TSS concentrations in water ebbing from the marsh exceeded the habitat requirements of SAV in the mid-Chesapeake Bay region [14], the exceedances were due primarily to elevated estuarine concentrations, which were above the SAV thresholds, rather than export from the marshes. There was some enrichment by the marsh of SRP and Chl a, but both remained below the SAV thresholds. The TSS threshold was exceeded on both the flood and ebb tides, suggesting resuspension occurring in the shallow embayment outside the marsh was primarily responsible for the exceedance, and dilution of the concentration in water ebbing from the marshes would occur in the adjacent cove.

4. Discussion

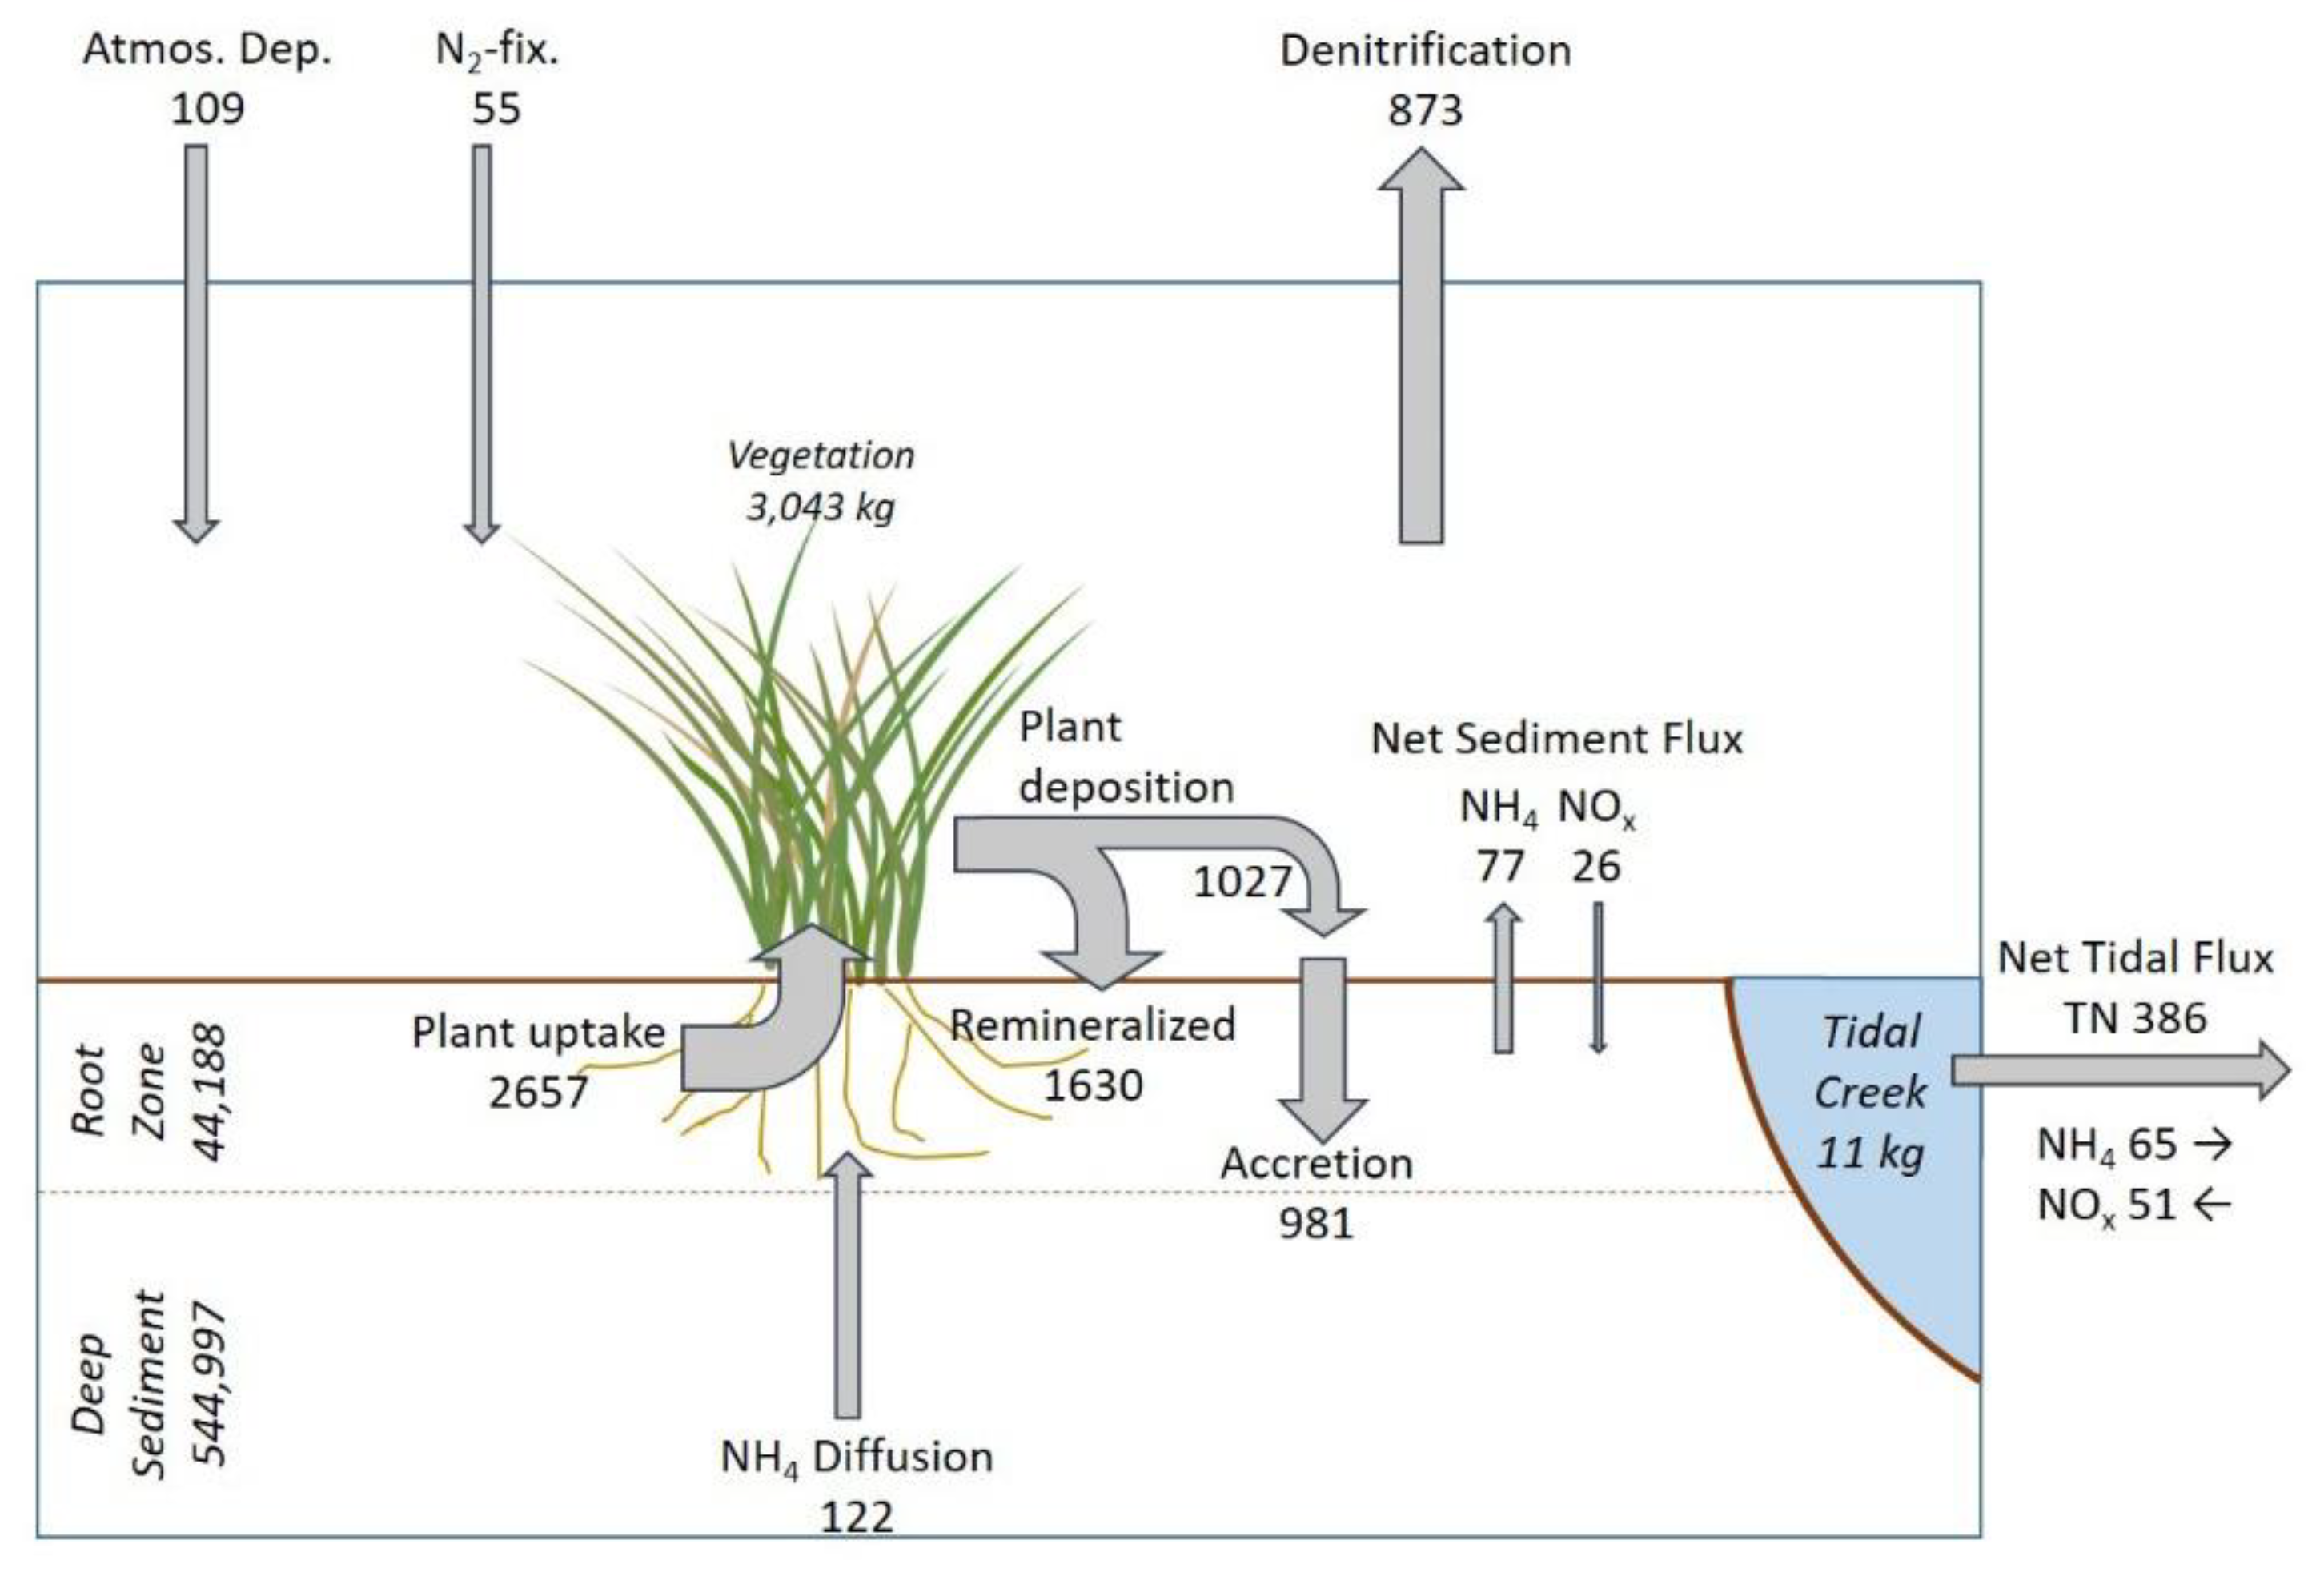
4.1. The Net N Balance

The dredged material used to construct the Cell 1B marsh contains a very large reservoir of N (Figure 7). Most of this reservoir exists in the deeper soil below the root zone, where it is largely unavailable for direct plant uptake but provides a long-term source via diffusion of NH4 into the root zone. Compared with the size of the sediment reservoir, only small amounts of N are being exported annually from the marsh. The largest internal N transfer is short-term uptake of NH4 by macrophytic vegetation, leading to long-term accumulation of carbon-rich marsh soil and associated N. Denitrification is a major sink for N in this marsh, and while NH4 fluxes from the sediment may be high, internal recycling appears to reduce losses to the estuary.
Our estimates show that the annual N export via denitrification, soil accumulation, and tidal flux were about 39%, 44%, and 17% of TN export, respectively. The rate of tidal TN export varied seasonally and, importantly for SAV, the highest export occurred during the colder months, following senescence of the marsh vegetation. Dissolved inorganic N (DIN) released from the marshes at this time of year is less likely to have a negative impact on SAV, which is largely dormant in the cold winter months in upper Chesapeake Bay [41]. The seasonal variability in TN exchange between the marsh and estuary is driven by the influence of temperature on biogeochemical processes as well as the seasonality of the primary producers (macrophyte and edaphic algae). Uptake of dissolved N during the growing season is followed by export of dissolved and particulate N during the dormant season, in agreement with other studies [40,42,43].
An examination of the balance of diffusive and new N inputs to the marsh (286 kg y−1) and N exports as gaseous exchange and in tidal waters (1259 kg y−1, not including soil accumulation) indicates that an important source term has not been directly quantified. This missing “source” of N, which would help balance inputs with export, is likely to result from remineralization of N associated with labile organic matter in the dredged material, primarily in the root zone where microbial activity is enhanced by rhizosphere oxygenation by S. alterniflora [44].

4.2. Internal N Cycling

Temporal variation in denitrification may have been influenced by variation in estuarine water column NO3 concentrations, with the lowest rate occurring in September 2013 when NO3 concentrations in the flood water were lowest, and higher rates occurring on other sampling dates when estuarine NO3 concentrations were higher. However, the import of NO3 represents only about 5% of N denitrified, suggesting that the source of most denitrified N is within the marsh. Coupled nitrification and denitrification may occur in the near surface sediment or in the macrophyte rhizosphere, where NH4 and organic carbon are abundant and oxygen is present, and is likely enhanced due to rapid remineralization when temperatures rise in the spring. Limitation of denitrification due to inhibition by sulfide is unlikely to occur in these young marshes, where sulfide concentrations tend to be below detection in the first few years of development due to the presence of free iron resulting from pyrite oxidation during dewatering of the dredged material prior to marsh establishment [16].
The root zone TN pool would meet the annual macrophyte N requirement for more than a decade, suggesting that the vegetation will not be N limited for many years under present conditions. However, porewater concentrations of dissolved NH4, the preferred form of N for uptake by S. alterniflora [45], show depletion after only 2 years, suggesting that other sources of N are more available and energetically favorable. We estimate that diffusive transport of NH4 from the deeper sediment into the root zone would supply only about 3% of annual macrophyte demand, while atmospheric deposition and N2-fixation, would supply about 4% and 2%, respectively. Translocation at the end of the growing season would conserve a small percentage for the next season’s growth [46]. However, remineralization resulting from plant decomposition, which returned about 61% of assimilated N over two years in this study, is likely to be an important source of N for macrophyte and algal growth, emphasizing the importance of internal N cycling in the overall N budget for the marsh. The estimate of plant N deposition (29.84 mg N m−2 d−1) based on plant production and decomposition data compares well with the estimate obtained from the measured rate of vertical accretion (28.50 mg N m−2 d−1), emphasizing the importance of internal cycling and the utility of measurements of vertical accretion for estimating soil N accumulation. Future studies of soil N trajectories will help characterize the rate of N depletion in the original substrate, N accumulation in accreting soil and organic matter, and how long N enriched conditions may continue to enhance macrophyte growth.

4.3. Sources of Error

Scaling up discreet measurements to derive annual estimates of nutrient fluxes is subject to several sources of error. Seasonal (temporal) variability in N fluxes may occur due to temperature regulation of biogeochemical processes as well as changes in plant uptake driven by phenology. Spatial variability can be high, and may be difficult to assess with limited sampling and the use of ex situ methods (e.g., core incubations). Furthermore, the use of monitoring data which were not designed for a mass balance study sometimes means that the most appropriate data for the analysis are not obtainable. In the study presented here we combined several sources of data to develop the mass balance, and discuss potential sources of error below.
Direct atmospheric N deposition is recognized as a significant source in some locations, including coastal systems [47,48], and direct and indirect deposition combined are estimated to contribute 8% of TN inputs in Chesapeake Bay [49]. The estimate used here included only direct deposition on the marsh, because there is, currently, minimal upland drainage into the marshes. The actual catchment used to calculate deposition may be slightly larger due to runoff from the surrounding dikes and access roads. Additionally, the use of data from NADP/NTN site BWR139 rather than site MD13, which is closer to Poplar Island and has a higher average wet DIN deposition for the 2012–2014 period (3.66 kg N ha−1 y−1 versus 2.75 kg N ha−1 y−1, respectively), but lacks TN deposition data, may have led to an underestimate of the TN deposition rate. These two small sources of error would have opposing effects, and would not change the conclusion that atmospheric deposition is a small term in our N mass balance.
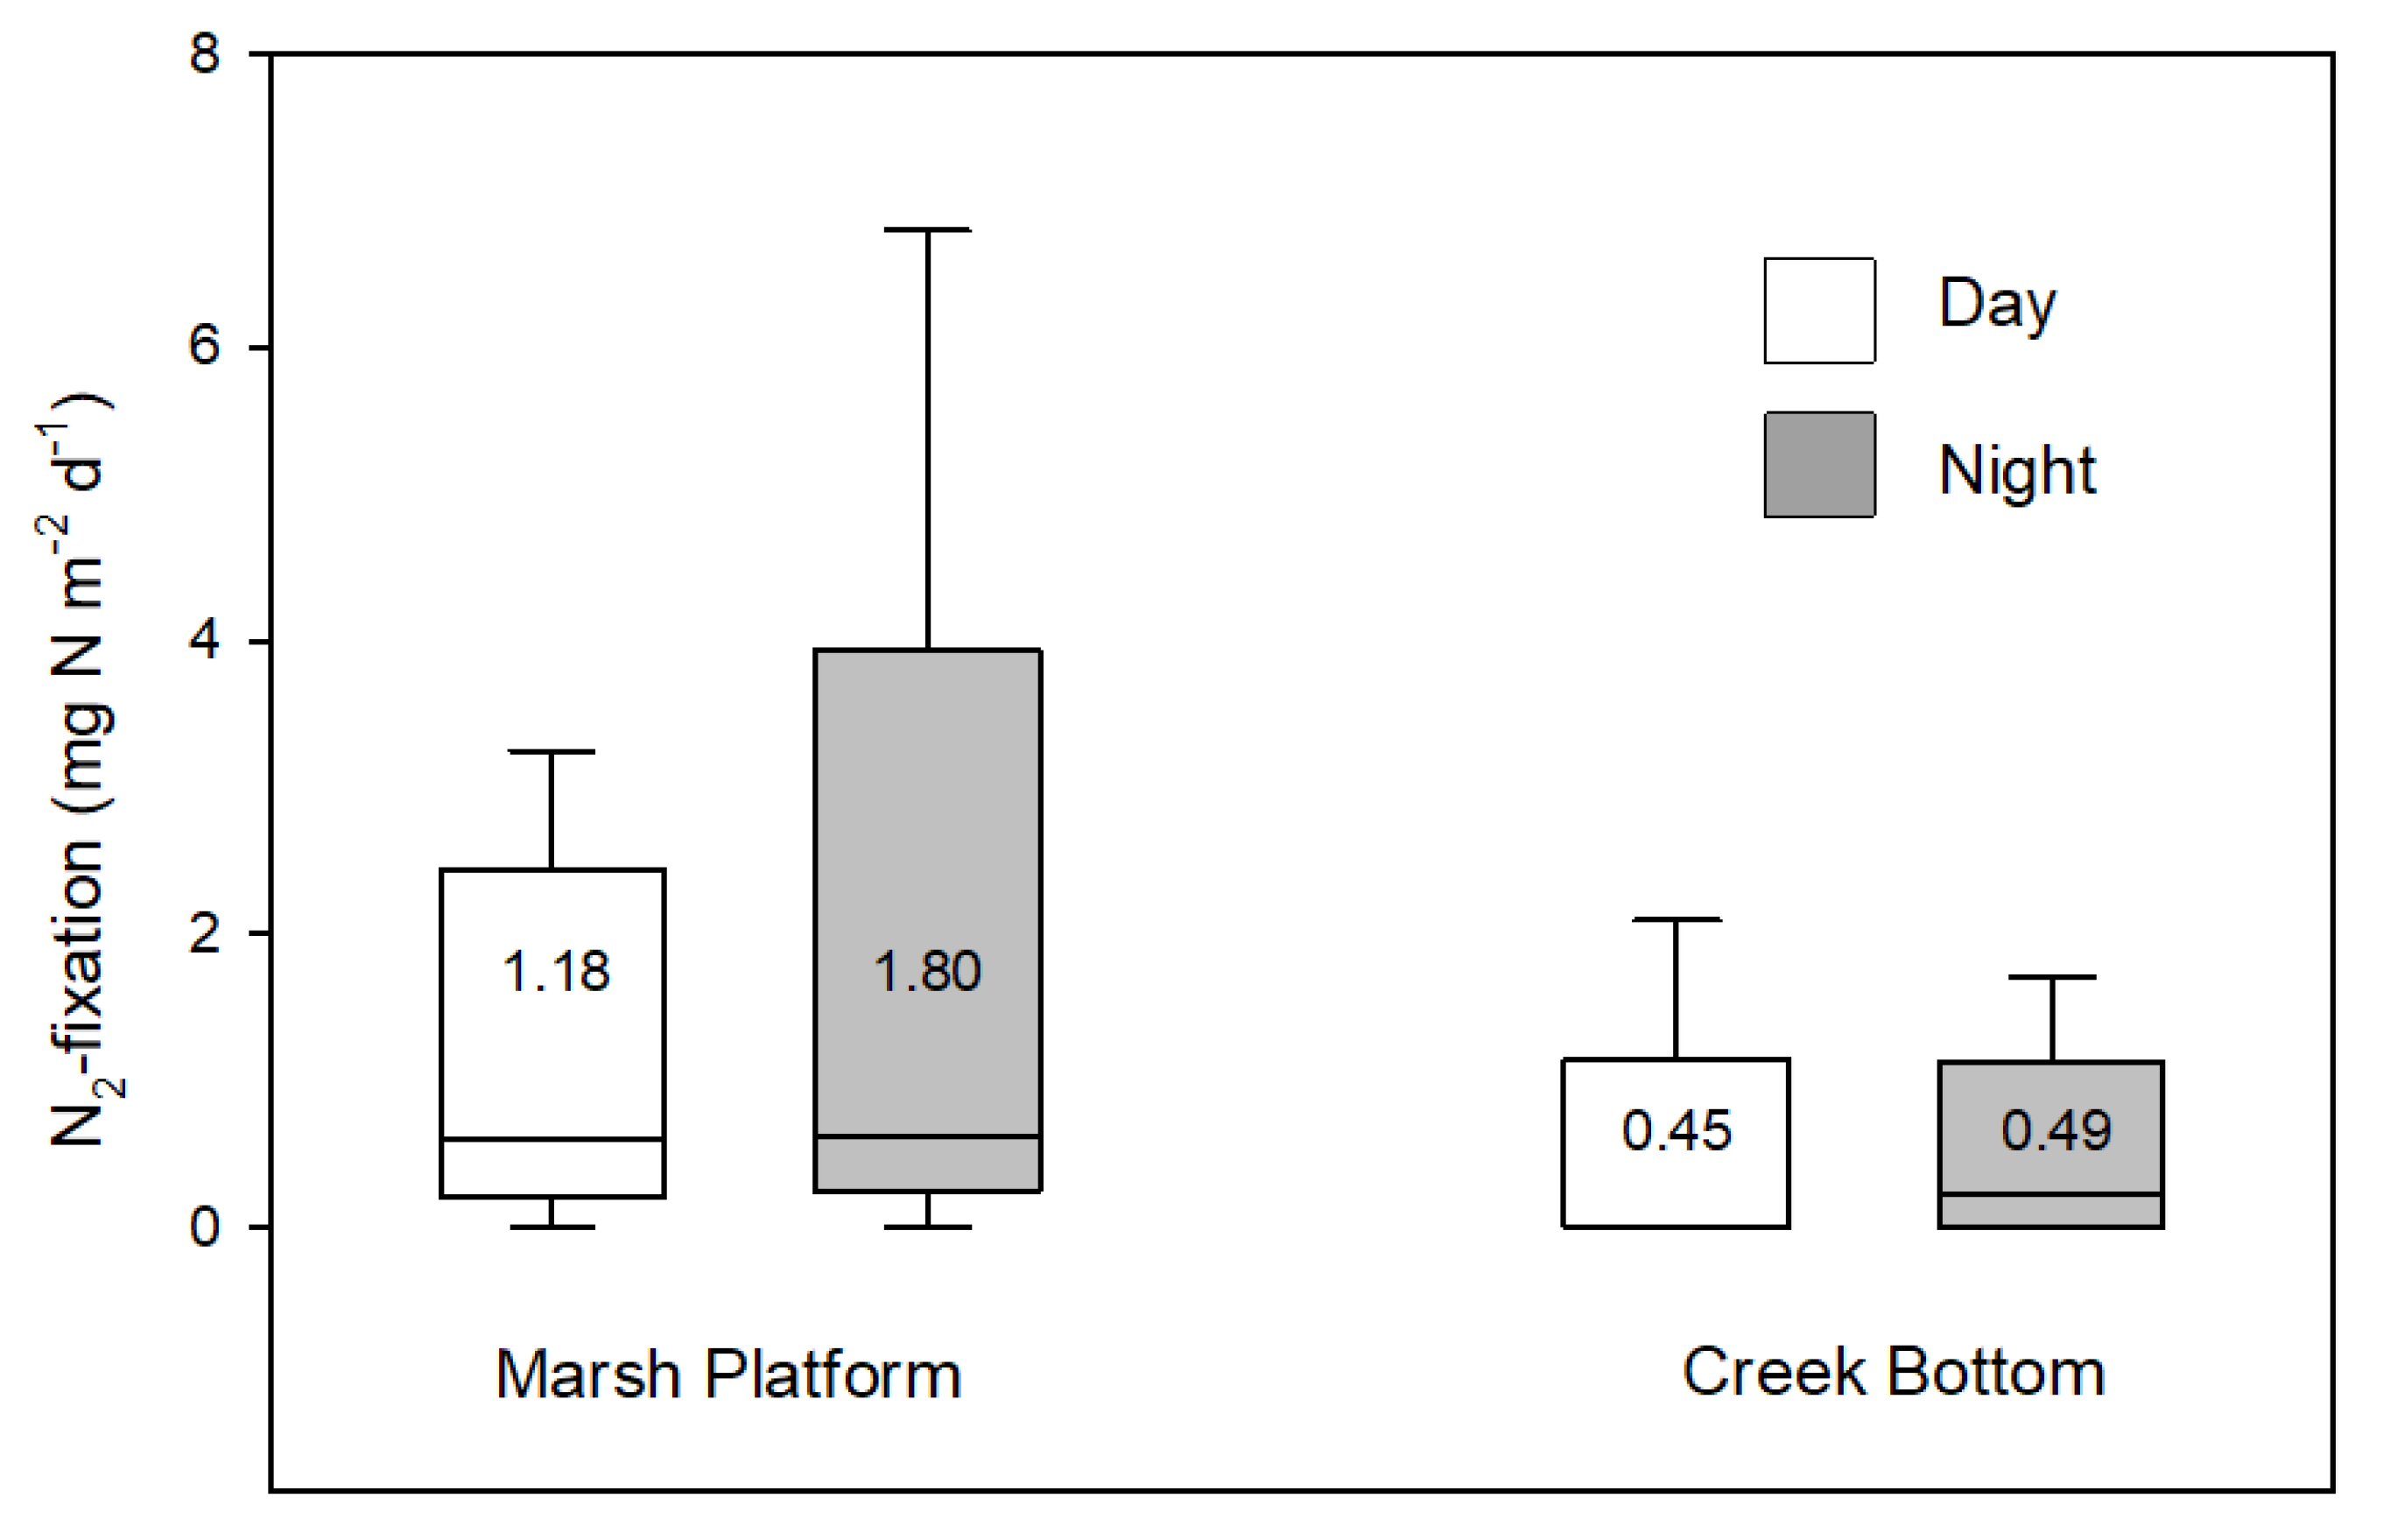
Nitrogen fixation rates were spatially variable but very low for both marsh platform and creek sediments, as expected in this N rich system. The estimate used here was based on measurements made during the summer, near the peak in seasonal variation [18] and, therefore, likely overestimates the annual flux. The contribution to the N mass balance was minimal, however, and a more accurate annual rate would likely further reduce the estimate of N contributed by N2-fixation.
Estimates of sediment N fluxes on the marsh platform may be biased upward due to underrepresentation of the warmest and coldest months of the year. On an annual basis, denitrification is still likely to represent the dominant sink in this two-year-old marsh, but estimates of annual fluxes of dissolved N could also be more accurately represented by evenly distributed seasonal measurements. Further improvements may be made by accounting for the effects of unflooded periods on the marsh platform. During periods in which the soil is unflooded, pore water constituents can accumulate near the soil surface; continuous flooding during incubations may result in measured fluxes that overestimate the actual fluxes because of depuration of the stored nutrient concentrations during flooding. This may result in the daily assignment of rates that reflect gradients that are too large over too long a period of time. In addition, estimates of NH4+ and NOx for the creeks may be a more accurate reflection of actual rates than estimates for the marsh surface, which is not continuously flooded.
The calculation of the upward diffusive flux of pore water NH4+ utilizes average pore water values from a single date; these gradients change over time due to pore water depletion of NH4+ in both the upper (0–10 cm) and the deep (20–47 cm) soil layers [16].
While the N standing stock and fluxes associated with edaphic algae were not quantified in this study, this community can play an important role in internal biogeochemical cycles and food webs [50,51]. A thick layer of edaphic algae has been observed on the sediment surface in the Poplar Island marshes and may create a boundary which limits oxygen penetration into the sediment. As a result, anoxic conditions appear to occur on the sediment surface immediately beneath the algal layer during the warmer months of the year. Decomposition of algal and macrophyte tissue in this layer likely leads to consumption of oxygen and remineralization of organic N, and may enhance denitrification. Further study of the role of edaphic algae in nutrient cycling in these nutrient rich marshes would likely enhance our understanding of internal nutrient processing.
Variations in tidal prism caused by subtidal (time scales longer than a tidal cycle) water level changes can be a large source of error in tidal flux estimates [52], as these changes impact the degree to which the marsh plain is flooded (or not). In this study, water level measured seasonally over two tidal cycles was considered representative of each of the full seasons. The tide ranges recorded during each deployment were within the great diurnal tide range for Poplar Island [53], but a more careful analysis of seasonal water levels would indicate how typically the tidal prisms used here compared with seasonal averages.
Nitrogen fluxes associated with transient nekton species have received less attention than carbon fluxes, but can be significant in some systems [54]. Large nekton migrations (e.g., penaid shrimp) do not appear to occur in the Poplar Island marshes [55], but foraging by small fish in the tidal creeks and on the marsh platform, which may be consumed by predatory fish or birds, has been observed. Although trophic relay is not expected to be a major N flux in this young marsh, quantification of TN fluxes associated with the fauna would help refine the mass balance.
The scale of the N flux estimates presented here suggests that modest errors would not change the conclusions that, in this young marsh, denitrification was a large, permanent N sink, internal N cycling was intense, and there was a modest TN but minimal DIN export to the estuary.

4.4. Comparison with Previous Studies

Atmospheric exchange of gaseous N2 with the sediment is attributed to microbially mediated denitrification and, possibly, anaerobic ammonium oxidation (ANAMMOX), as well as N2 fixation. High rates of ANAMMOX occur in some coastal environments, but are low where NO3 is low and organic carbon is abundant [56,57], including tidal marshes, and is therefore unlikely to represent a significant fraction of the N2 fluxes measured here. Thus, the annual net N2 (21.31 mg N m−2 d−1), assumed to represent denitrification, is on the higher end of the range reported for denitrification in most natural marshes in a recent review of saltmarsh biogeochemistry (0–27 mg N m−2 d−1), although rates up to 279 mg N m−2 d−1 have been reported [39,58]. Nitrogen input via N2-fixation (1.33 mg N m−2 d−1) is a small fraction of denitrification, and on the low end of the range reported for mature marshes, <1.4–18.6 mg N m−2 d−1 [58]. N2-fixation in the Cell 1B marsh is very low compared with rates reported for restored and young marshes, which can range up to 95.9 mg N m−2 d−1 [18]. The low rates in this young marsh likely result from high N availability in the fine-grained dredged material, and emphasize that chronological age is not always a good indicator of marsh function [59].
The estimate of soil N accumulation (28.5 mg N m−2 y−1) is within the range of values reported for natural marshes using a variety of techniques [42,60,61]. It is notable that this rate, derived from the rate of vertical accretion measured with SETs and soil N density, is similar to the estimate that can be derived from the difference between plant uptake and remineralization based on annual biomass and decomposition measurements (27.9 mg N m−2 d−1). Due to the high rate of macrophyte biomass production and the observed retention of biomass on the marsh platform, and low inorganic sediment inputs at this site, organic matter is the primary contributor to vertical accretion and N accumulation is largely associated with organic matter accumulation, similar to many natural marshes [62,63].
The mean annual TN flux via tidal exchange (9.42 mg N m−2 d−1) is of the same order of magnitude reported for several U. S. S. alterniflora marshes [64]. Although the timing of sediment and tidal flux measurements were not synchronized, the direction of tidal exchange of dissolved N estimated in the tidal flux study is largely supported by the sediment flux measurements, which are of similar magnitude and direction.
Finally, our estimate of atmospheric TN deposition is similar to other estimates reported for Chesapeake Bay [47,65,66,67], and is consistent with the dominant agricultural land use in the region [67].

5. Conclusions

The major N fluxes and estimates of internal cycling reported here for the two-year-old constructed marsh at Poplar Island demonstrate the importance of internal N cycling in this marsh and limited tidal N export, especially as DIN. Most fluxes and rates are within the ranges reported for natural marshes, which are likely much older. The rapid development of biologically mediated N transformations in the Poplar Island marsh promoted N remineralization, denitrification, and soil N accretion, and limited inorganic N export to the adjacent estuary. Thus, it appears that in the short term, fine-grained, nutrient-rich dredged material can be used successfully to rapidly restore tidal marsh habitat and ecosystem services without resulting in large inorganic nutrient exports, functioning much like a more mature marsh. This study suggests that the trophic status of restored and created marshes is likely to be a better predictor of marsh function and associated ecosystem services than chronological age.
It remains unclear how the N mass balance may change as these marshes mature, and TN associated with labile organic matter within the root zone is depleted while TN associated with more recalcitrant carbon from macrophytic vegetation accumulates. As the labile N pool is depleted and the pool associated with more recalcitrant macrophyte detritus accumulates, it is expected that primary production will become N limited and the root:shoot ratio will increase. Nitrogen fixation may increase, and tidal export of DIN may decline. However, if vertical accretion does not keep pace with accelerating SLR, increasing inundation and erosion may lead to changes in internal N cycling, vegetation loss, erosion, and an increase in TN export to the estuary. Monitoring these changes will be important to determine the longer term outlook for these beneficial use projects involving fine-grained, nutrient rich dredged material.
The persistence of an SAV bed adjacent to the marsh tidal inlet, with steadily increasing percent cover since monitoring, began in 2001 [68] and the data on critical water quality parameters in tidal export from the marsh (Table 8) indicate that conditions are not markedly degraded by the nutrient-rich dredged material used as the marsh substrate. The conservation of SAV habitat has been achieved, in part, through the rapid development of productive marsh vegetation and biogeochemical N cycling, preserving the adjacent water quality.

Author Contributions

Conceptualization, L.W.S., J.C.C., J.C.S., N.J.N., W.B. and M.O.; methodology, L.W.S., J.C.C., N.J.N., J.C.S. and L.L.-G.; formal analysis, L.W.S., J.C.C., K.W.S. and N.J.N.; investigation, L.W.S., J.C.C. and N.J.N.; resources, L.W.S., J.C.C., N.J.N. and J.C.S.; data curation, L.W.S. and J.C.C.; writing—original draft preparation, L.W.S.; writing—review and editing, all co-authors; visualization, L.W.S.; supervision, L.W.S., J.C.C. and J.C.S.; project administration, L.W.S., J.C.C. and J.C.S.; funding acquisition, L.W.S., J.C.C., J.C.S. All authors have read and agreed to the published version of the manuscript.

Funding

This research was funded by the Maryland Department of Transportation Maryland Port Administration with project management by the Maryland Environmental Service, grant number 14-07-16.

Institutional Review Board Statement

Not applicable.

Informed Consent Statement

Not applicable.

Data Availability Statement

The data presented in this study are available on request from the corresponding author.

Acknowledgments

The authors thank numerous research interns for assistance with field sample collection and processing; and gratefully acknowledge the Maryland Environmental Service and U.S. Army Corps of Engineers for logistical support and guidance.

Conflicts of Interest

The authors declare no conflict of interest. The funders had no role in the design of the study; in the collection, analyses, or interpretation of data; in the writing of the manuscript, or in the decision to publish the results.

Appendix A

Table A1. Volume-weighted water column concentrations of all measured constituents during four seasonal tidal flux deployments in 2014.
MonthTide StageMean Tidal PrismTNTDNNH4NO2NO3SRPTPPNTSSChl a
(m3)(µmol N L−1)(mg N L−1)(mg L−1)(µg L−1)
FebFlood602838.5829.850.980.3017.290.080.670.105.096.80
Ebb 47.1735.733.300.3518.170.111.170.1818.157.39
MayFlood882067.0852.221.300.6937.290.101.290.2611.5013.23
Ebb 70.3552.002.900.7432.830.091.860.3020.3712.82
JulFlood988635.9222.451.960.151.180.091.670.2430.4810.36
Ebb 37.5124.471.160.151.040.152.340.3230.8015.12
NovFlood10,87322.1220.081.710.171.180.110.920.097.773.11
Ebb 27.6523.282.310.172.460.171.360.119.393.99
Table A2. Sediment flux measurements, showing means for light and dark incubations and the weighted daily mean (Wt’d Mean) on five dates. Negative values represent import into the sediment; positive values represent release to the overlying water.
Flux Rate (µmol N m−2 h−1)
Location Jun-13Sep-13Nov-13Apr-14May-14Mean
NH4+
MarshDark53.7200.5−21.9150.9173.2
Light−77.3−89.5−35.632.3−19.0
Wt’d Mean−27.3644.89−27.5786.5956.2826.57
CreekDark758.7162.80.0190.9974.6
Light695.1199.991.9104.6396.3
Wt’d Mean719.34182.7037.98144.07622.84341.39
NOx
MarshDark−24.6−17.311.3−69.1−32.2
Light−25.5−12.1−5.9−79.6−11.3
Wt’d Mean−25.16−14.504.19−74.79−19.52−25.95
CreekDark−51.79.113.2−58.4−46.4
Light−25.97.5−46.0−31.7−28.6
Wt’d Mean−35.738.25−11.25−43.91−35.57−23.64
N2
marshDark3.930.8205.7121.281.8
Light50.6−46.90.062.887.0
Wt’d Mean32.8−10.91120.6789.5184.9863.41
creekDark83.585.9100.692.6148.4
Light−1.9139.00.015.80.0
Wt’d Mean30.66114.3659.0350.9558.1162.62

References

  1. Davidson, N.C. How Much Wetland Has the World Lost? Long-Term and Recent Trends in Global Wetland Area. Mar. Freshw. Res. 2014, 65, 934–941. [Google Scholar] [CrossRef]
  2. Barbier, B.E.; Hacker, S.D.; Kennedy, C.; Koch, E.W.; Stier, A.C.; Silliman, B.R. The Value of Estuarine and Coastal Ecosystem Services. Ecol. Monogr. 2010, 81, 169–193. [Google Scholar] [CrossRef]
  3. Cronin, W.B. The Disappearing Islands of the Chesapeake; JHU Press: Baltimore, MD, USA, 2005. [Google Scholar]
  4. Cornwell, J.C.; Owens, M.S. Quantifying Sediment Nitrogen Releases Associated with Estuarine Dredging. Aquat. Geochem. 2011, 17, 499–517. [Google Scholar] [CrossRef]
  5. Rablais, N.N.; Nixon, S.W. Preface: Nutrient over-Enrichment of the Coastal Zone. Estuaries 2002, 25, 639. [Google Scholar] [CrossRef]
  6. Kemp, W.M.; Twilley, R.R.; Stevenson, J.C.; Boynton, W.R.; Means, J.C. The Decline of Submerged Vascular Plants in Upper Chesapeake Bay: Summary of Results Concerning Possible Causes. Mar. Technol. Soc. J. 1983, 17, 78–89. [Google Scholar]
  7. Kemp, W.M.; Boynton, W.R.; Adolf, J.E.; Boesch, D.F.; Boicourt, W.C.; Brush, G.; Cornwell, J.C.; Fisher, T.R.; Glibert, P.M.; Hagy, J.D.; et al. Eutrophication of Chesapeake Bay: Historical Trends and Ecological Interactions. Mar. Ecol. Prog. Ser. 2005, 303, 1–29. [Google Scholar] [CrossRef]
  8. National Research Council. Achieving Nutrient and Sediment Reduction Goals in the Chesapeake Bay: An Evaluation of Program Strategies and Implementation; National Academies Press: Washington, DC, USA, 2011. [Google Scholar]
  9. Childers, D.L.; Day, J.W. Marsh-Water Column Interactions in Two Louisiana Estuaries. I. Sediment Dynamics. Estuaries 1990, 13, 393–403. [Google Scholar] [CrossRef]
  10. Nixon, S.W. Between Coastal Marshes and Coastal Waters—A Review of Twenty Years of Speculation and Research on the Role of Salt Marshes in Estuarine Productivity and Water Chemistry. In Estuarine and Wetland Processes with Emphasis on Modeling; Hamilton, P., Macdonald, K.B., Eds.; Plenum Press: New York, NY, USA, 1980; pp. 437–525. [Google Scholar]
  11. Valiela, I.; Teal, J.M. The Nitrogen Budget of a Salt Marsh Ecosystem. Nature 1979, 280, 652–656. [Google Scholar] [CrossRef]
  12. Childers, D.L.; Day, J.W., Jr.; McKellar, H.N., Jr. Twenty More Years of Marsh and Estuarine Flux Studies: Revisiting Nixon (1980). In Concepts and Controversies in Tidal Marsh Ecology; Weinstein, M.P., Kreeger, D.A., Eds.; Kluwer Academic Publishers: Boston, MA, USA, 2000; p. 875. [Google Scholar]
  13. Craft, C.; Megonigal, P.; Broome, S.; Stevenson, J.; Freese, R.; Cornell, J.; Zheng, L.; Sacco, J. The Pace of Ecosystem Development of Constructed Spartina Alterniflora Marshes. Ecol. Appl. 2003, 13, 1417–1432. [Google Scholar] [CrossRef]
  14. Batiuk, R.A.; Orth, R.J.; Moore, K.A.; Dennison, W.C.; Stevenson, J.C.; Carter, V.; Rybicki, N.B.; Hickman, R.E.; Kollar, S.; Bieber, S.; et al. Chesapeake Bay Submerged Aquatic Vegettion Habitat Requirements and Restoration Targets: A Technical Synthesis; Chesapeake Bay Program, 1992; p. 186. Available online: https://www.researchgate.net/publication/272169033_Chesapeake_Bay_Submerged_Aquatic_Vegetation_Water_Quality_and_Habitat-Based_Requirements_and_Restoration_Targets_A_Second_Technical_Synthesis_A_Watershed_Partnership (accessed on 5 August 2021).
  15. Anderson, I.C.; Tobias, C.R.; Neikirk, B.B.; Wetzel, R.L. Development of a Process-Based Nitrogen Mass Balance Model for a Virginia (USA) Spartina Alterniflora Salt Marsh: Implications for Net Din Flux. Mar. Ecol. Prog. Ser. 1997, 159, 13–27. [Google Scholar] [CrossRef] [Green Version]
  16. Cornwell, J.C.; Owens, M.S.; Staver, L.W. Tidal Marsh Restoration at Poplar Island I: Transformation of Estuarine Sediments into Marsh Soils. Wetlands 2020, 40, 1673–1686. [Google Scholar] [CrossRef]
  17. Staver, L.W.; Stevenson, J.C.; Cornwell, J.C.; Nidzieko, N.J.; Staver, K.W.; Owens, M.S.; Logan, L.; Kim, C.; Malkin, S.Y. Tidal Marsh Restoration at Poplar Island: II. Elevation Trends, Vegetation Development, and Carbon Dynamics. Wetlands 2020, 40, 1687–1701. [Google Scholar] [CrossRef]
  18. Currin, C.A.; Joye, S.B.; Paerl, H.W. Diel Rates Of N-2-Fixation And Denitrification In A Transplanted Spartina alterniflora Marsh: Implications For N-Flux Dynamics. Estuar. Coast. Shelf Sci. 1996, 42, 597–616. [Google Scholar] [CrossRef]
  19. E.A. Engineering. Evaluation of Dredged Material: Upper Chesapeake Bay Approach Channels to the Port of Baltimore, Maryland; Unpublished report to the USACE; Baltimore District: Baltimore, MD, USA, 2000. [Google Scholar]
  20. NOAA. Noaa Tides and Currents. Available online: https://tidesandcurrents.noaa.gov/stationhome.html?id=8572271#tides (accessed on 20 April 2021).
  21. Chesapeake Bay Program. Chesapeake Bay Mean Surface Salinity 1985–2018. Available online: https://www.chesapeakebay.net/what/maps/chesapeake_bay_mean_surface_salinity_1985_2018 (accessed on 20 April 2021).
  22. Fleri, J.R.; Lera, S.; Gerevini, A.; Staver, L.; Nardin, W. Empirical Observations and Numerical Modelling of Tides, Channel Morphology, and Vegetative Effects on Accretion in a Restored Tidal Marsh. Earth Surf. Process. Landf. 2019, 44, 2223–2235. [Google Scholar] [CrossRef]
  23. Lane, L.; Rhoades, S.; Thomas, C.; VanHeukelem, L. Analytical Services Laboratory Standard Operating Procedures 2000; University of Maryland Center for Environmental Science, Horn Point Laboratory: Cambridge, MD, USA, 2000; p. 67. [Google Scholar]
  24. Stevenson, J.C.; Cornwell, J.C.; Staver, L.; Owens, M. Paul S. sarbanes Ecosystem Restoration Project at Poplar Island Wetland Cells Monitoring Program: 2011 Studies to Address Sea-Level Rise, Marsh Dieback and Silicon-Related Issues, Final Report; University of Maryland Center for Environmental Science, Horn Point Laboratory: Cambridge, MD, USA, 2013; Available online: www.poplarislandrestoration.com/Document (accessed on 5 August 2021).
  25. Craft, C.B.; Broome, S.W.; Seneca, E.D. Nitrogen, Phosphorus and Organic Carbon Pools in Natural and Transplanted Marsh Soils. Estuaries 1988, 11, 272–280. [Google Scholar] [CrossRef]
  26. Snyder, M. Poplar Island Environmental Restoration Project, Talbot County, Maryland; Density Testing of Dredged Material Surface in Wetland Cells 1a and 3d; Baltimore District, U.S. Army Corps of Engineers: Baltimore, MD, USA, 2010; p. 8. [Google Scholar]
  27. USEPA. Methods for Chemical Analysis of Water and Wastes. Edited by Office of Research and Development United States Environmental Protection Agency; USEPA: Cincinnati, OH, USA, 1979. [Google Scholar]
  28. Greenberg, A.E.; Clesceri, L.S.; Eaton, A.D.; Franson, M.A.H. (Eds.) Standard Methods for the Examination of Water and Wastewater; American Public Health Association; American Wter Works Association; Water Environment Federation: Washington, DC, USA, 1992. [Google Scholar]
  29. U.S. Environmental Protection Agency. Clean Air Status and Trends Network. Available online: https://www.epa.gov/castnet (accessed on 20 April 2021).
  30. Lerman, A. Geochemical Processes. Water and Sediment Environments; John Wiley and Sons, Inc.: New York, NY, USA, 1979. [Google Scholar]
  31. Yuan-Hui, L.; Gregory, S. Diffusion of Ions in Sea Water and in Deep-Sea Sediments. Geochim. Et Cosmochim. Acta 1974, 38, 703–714. [Google Scholar] [CrossRef]
  32. Hesslein, R.H. An in Situ Sampler for Close Interval Pore Water Studies. Limnol. Oceanogr. 1976, 21, 912–914. [Google Scholar] [CrossRef]
  33. Hardy, R.W.F.; Holsten, R.D.; Jackson, E.K.; Burns, R.C. The Acetylene-Ethylene Assay for N2 Fixation: Laboratory and Field Evaluation. Plant Physiol. 1968, 43, 1185–1207. [Google Scholar] [CrossRef] [Green Version]
  34. Kana, T.M.; Cornwell, J.C.; Zhong, L.J. Determination of Denitrification in the Chesapeake Bay from Measurements of N-2 Accumulation in Bottom Water. Estuaries Coasts 2006, 29, 222–231. [Google Scholar] [CrossRef]
  35. Cahoon, D.R.; Lynch, J.C.; Perez, B.C.; Segura, B.; Holland, R.D.; Stelly, C.; Stephenson, G.; Hensel, P. High-Precision Measurements of Wetland Sediment Elevation: Ii. The Rod Surface Elevation Table. J. Sediment. Res. 2002, 72, 734–739. [Google Scholar] [CrossRef]
  36. Morris, J.T.; Barber, D.C.; Callaway, J.C.; Chambers, R.; Hagen, S.C.; Hopkinson, C.S.; Johnson, B.J.; Megonigal, P.; Neubauer, S.C.; Troxler, T.; et al. Contributions of Organic and Inorganic Matter to Sediment Volume and Accretion in Tidal Wetlands at Steady State. Earth’s Future 2016, 4, 110–121. [Google Scholar] [CrossRef] [Green Version]
  37. Craft, C.B.; Seneca, E.D.; Broome, S.W. Loss on Ignition and Kjeldahl Digestion for Estimating Organic Carbon and Total Nitrogen in Estuarine Marsh Soils: Calibration with Dry Combustion. Estuaries 1991, 14, 175–179. [Google Scholar] [CrossRef]
  38. Chesapeake Bay Program. Chesapeake Bay Program Data Hub. Available online: https://datahub.chesapeakebay.net/Home (accessed on 20 April 2021).
  39. Valiela, I.; Cole, M.L. Comparative Evidence That Salt Marshes and Mangroves May Protect Seagrass Meadows from Land-Derived Nitrogen Loads. Ecosystems 2002, 5, 92–102. [Google Scholar] [CrossRef]
  40. Brin, L.D.; Valiela, I.; Goehringer, D.; Howes, B. Nitrogen Interception and Export by Experimental Salt Marsh Plots Exposed to Chronic Nutrient Addition. Mar. Ecol. Prog. Ser. 2010, 400, 3–17. [Google Scholar] [CrossRef] [Green Version]
  41. Stevenson, J.C.; Staver, L.W.; Staver, K.W. Water-Quality Associated with Survival of Submersed Aquatic Vegetation Along an Estuarine Gradient. Estuaries 1993, 16, 346–361. [Google Scholar] [CrossRef]
  42. Stribling, J.M.; Cornwell, J.C. Nitrogen, Phosphorus, and Sulfur Dynamics in a Low Salinity Marsh System Dominated by Spartina Alterniflora. Wetlands 2001, 21, 629–638. [Google Scholar] [CrossRef]
  43. Childers, D.L.; McKellar, H.N.; Dame, R.F.; Sklar, F.H.; Blood, E.R. A Dynamic Nutrient Budget of Subsystem Interactions in a Salt Marsh Estuary. Estuar. Coast. Shelf Sci. 1993, 36, 105–131. [Google Scholar] [CrossRef]
  44. Bertness, M.D. Zonation of Spartina Patens and Spartina Alterniflora in New England Salt Marsh. Ecology 1991, 72, 138–148. [Google Scholar] [CrossRef]
  45. Mendelssohn, I. The Influence of Nitrogen Level, Form, and Application Method on the Growth Response of Spartina Alterniflora in North Carolina. Estuaries Coasts 1979, 2, 106–112. [Google Scholar] [CrossRef]
  46. White, D.S.; Howes, B.L. Translocation, Remineralization, and Turnover of Nitrogen in the Roots and Rhizomes of Spartina-Alterniflora (Gramineae). Am. J. Bot. 1994, 81, 1225–1234. [Google Scholar] [CrossRef]
  47. Fisher, D.C.; Oppenheimer, M. Atmospheric Nitrogen Deposition and the Chesapeake Bay Estuary. Ambio 1991, 20, 102–108. [Google Scholar]
  48. Morris, J.T. Effects of Nitrogen Loading on Wetland Ecosystems with Particular Reference to Atmospheric Deposition. Annu. Rev. Ecol. Syst. 1991, 22, 257–279. [Google Scholar] [CrossRef]
  49. Castro, M.S.; Driscoll, C.T.; Jordan, T.E.; Reay, W.G.; Boynton, W.R.; Seitzinger, S.P.; Styles, R.V.; Cable, J.E. Contribution of Atmospheric Deposition to the Total Nitrogen Loads to Thirty-Four Estuaries on the Atlantic and Gulf Coasts of the United States. Coastal Estuarine Stud. 2001, 77–106. [Google Scholar]
  50. Sullivan, M.J.; Currin, C.A. Community Structure and Funtional Dynamics of Benthic Microalgae in Salt Marshes. In Concepts and Controversies in Tidal Marsh Ecology; Weinstein, M.P., Kreeger, D.A., Eds.; Kluwer Acaddemic Publishing: Boston, MA, USA, 2000; pp. 81–106. [Google Scholar]
  51. Sullivan, J.J.; Moncreiff, C.A. Edaphic Algae Are in Important Component of Salt Marsh Food-Webs: Evidence from Multiple Stable Isotope Analyses. Mar. Ecol. Prog. Ser. 1990, 62, 149–159. [Google Scholar] [CrossRef]
  52. Boon, J.D., III. Tidal Discharge Asymmetry in a Salt Marsh Drainage System. Limnol. Oceanogr. 1975, 20, 71–80. [Google Scholar] [CrossRef] [Green Version]
  53. Kent, J. Water Level Variations at Poplar Island, Md. 35; U. S. Department of Commerce: Silver Spring, MD, USA, 2015.
  54. Deegan, L.A.; Hughes, J.E.; Rountree, R.A. Salt Marsh Ecosystem Support of Marine Transient Species. In Concepts and Controversies in Tidal Marsh Ecology; Kluwer Academic Publishers: Dordrecht, The Netherlands, 2002; pp. 333–365. [Google Scholar]
  55. Meyer, D.L. Annual Report on the Nekton Surveys for the Paul S. sarbanes Ecosystem Restoration Project at Poplar Island; National Oceanic and Atmospheric Administration, Report to the U.S. Army Corps of Engineers, Baltimore District. 2016. Available online: https://www.wetlandsofdistinction.org/wp-content/uploads/2019/12/NOAA-2016-Final-Final-report_Poplar-Island-Nekton-Monitoring-63c2c4687313f8f4afc5f7bf3737f64a.pdf (accessed on 5 August 2021).
  56. Algar, C.K.; Vallino, J.J. Predicting Microbial Nitrate Reduction Pathways in Coastal Sediments. Aquat. Microb. Ecol. 2014, 71, 223–238. [Google Scholar] [CrossRef] [Green Version]
  57. Dalsgaard, T.; Thamdrup, B.; Canfield, D.E. Anaerobic Ammonium Oxidation (Anammox) in the Marine Environment. Res. Microbiol. 2005, 156, 457–464. [Google Scholar] [CrossRef] [PubMed] [Green Version]
  58. Tobias, C.; Neubauer, S.C. Salt Marsh Biogeochemistry—An Overview. In Coastal Wetlands; Elsevier: Amsterdam, The Netherlands, 2019; pp. 539–596. [Google Scholar]
  59. Tyler, A.C.; Mastronicola, T.A.; McGlathery, K.J. Nitrogen Fixation and Nitrogen Limitation of Primary Production Along a Natural Marsh Chronosequence. Oecologia 2003, 136, 431–438. [Google Scholar] [CrossRef]
  60. Loomis, M.J.; Craft, C.B. Carbon Sequestration and Nutrient (Nitrogen, Phosphorus) Accumulation in River-Dominated Tidal Marshes, Georgia, USA. Soil Sci. Soc. Am. J. 2010, 74, 1028–1036. [Google Scholar] [CrossRef]
  61. Craft, C. Freshwater Input Structures Soil Properties, Vertical Accretion, and Nutrient Accumulation of Georgia and Us Tidal Marshes. Limnol. Oceanogr. 2007, 52, 1220–1230. [Google Scholar] [CrossRef]
  62. Turner, R.E.; Swenson, E.M.; Milan, C.S. Organic and Inorganic Contributions to Vertical Accretion in Salt Marsh Sediments. In Concepts and Controversies in Tidal Marsh Ecology; Weinstein, M.P., Kreeger, D.A., Eds.; Kluwer Academic Publishing: Boston, MA, USA, 2002; pp. 583–596. [Google Scholar]
  63. Neubauer, S.C. Contributions of Mineral and Organic Components of Tidal Freshwater Marsh Accretion. Estuar. Coast. Mar. Sci. 2008, 78, 78–88. [Google Scholar] [CrossRef]
  64. Rozema, J.; Leendertse, P.; Bakker, J.; Van Wijnen, H. Nitrogen and Vegetation Dynamics in European Salt Marshes. In Concepts and Controversies in Tidal Marsh Ecology; Weinstein, M.P., Kreeger, D.A., Eds.; Kluwer Academic Publishing: Boston, MA, USA, 2000; p. 875. [Google Scholar]
  65. Boynton, W.R.; Hagy, J.D.; Cornwell, J.C.; Kemp, W.M.; Greene, S.M.; Owens, M.S.; Baker, J.E.; Larsen, R.K. Nutrient Budgets and Management Actions in the Patuxent River Estuary, Maryland. Estuaries Coasts 2008, 31, 623–651. [Google Scholar] [CrossRef]
  66. Linker, L.C.; Dennis, R.; Shenk, G.W.; Batiuk, R.A.; Grimm, J.; Wang, P. Computing Atmospheric Nutrient Loads to the Chesapeake Bay Watershed and Tidal Waters. JAWRA J. Am. Water Resour. Assoc. 2013, 49, 1025–1041. [Google Scholar] [CrossRef]
  67. Anderson, K.A.; Downing, J.A. Dry and Wet Atmospheric Deposition of Nitrogen, Phosphorus and Silicon in an Agricultural Region. Water Air Soil Pollut. 2006, 176, 351–374. [Google Scholar] [CrossRef]
  68. Callahan, C.R.; McGowan, P.C.; Schultz, B. Submerged Aquatic Vegetation Monitoring for the Paul S. sarbanes Ecosystem Restoation Project at Poplar Island 2014; USFWS: Annapolis, MD, USA, 2016; p. 92. Available online: https://www.wetlandsofdistinction.org/wp-content/uploads/2019/12/Appendix-11-2014-OU-Terrapin-Monitoring-b8c7a4af866eae1feedad0db7cb7194e.pdf (accessed on 5 August 2021).
Figure 1. Location of Poplar Island in Chesapeake Bay and a detailed map of the research site. White arrow points to the Cell 1B marsh, the focus of this study; oval indicates the source of dredged material used at Poplar Island. (Chesapeake Bay map by Tracey Saxby, Kate Boicourt, Integration and Application Network, ian.umces.edu/media-library).
Jmse 09 00849 g001
Figure 2. Depth profile of mean (n = 10, ±sd) porewater NH4 concentrations in Cell 1B, August 2014.
Jmse 09 00849 g002
Figure 3. Box plot of sediment porosity data from initial characterization of all developed Poplar Island marsh cells (left, 0–10 cm depth, n = 174, mean ± s.d. = 0.56 ± 0.12), and increments from a single 0–200 cm core collected in Cell 1B in 2017 (right, n = 7, mean ± s.d. = 0.70 ± 0.02).
Jmse 09 00849 g003
Figure 4. N2-fixation rates in July 2017 in Poplar Island marshes ranging in age from 2 to 12 years. Boxes represent the 25th and 75th percentile; the line represents the median, bars represent the minimum and maximum, and the numerical value represents the mean. Differences were not significant (p = 0.05).
Jmse 09 00849 g004
Figure 5. Main stem Chesapeake Bay surface water NO3 concentrations from June 2013 to October 2014 [38]. Sites CB4.1C and CB4.2C are located approximately 5 km north and 15 km south of Poplar Island, respectively.
Jmse 09 00849 g005
Figure 6. Percent of remaining dry mass and %N in the litter bag experiment conducted for 22 months from February 2012–December 2013.
Jmse 09 00849 g006
Figure 7. Conceptual diagram of estimated annual N fluxes (kg y−1) in the Cell 1B marsh. Fluxes and standing stocks are shown in normal and italic fonts, respectively. The vegetation standing stock includes both live and standing dead macrophytic vegetation and respective tissue N concentrations, measured in September 2014. Annual plant uptake is based on the live standing stock and plant tissue N estimates. Estimates for remineralized and accreting N from plant organic matter were derived from the annual macrophyte production (plant uptake) and a two-year litter bag (decomposition) study. Estimates of the net sediment fluxes, denitrification and N2-fixation were based on direct measurements in marsh platform and tidal creek sediments, weighted for area. Atmospheric deposition was scaled from regional deposition estimates, and NH4 diffusion was estimated based on measured pore water NH4 concentration profiles and sediment properties. Arrow width indicates relative flux magnitude, but elements of the diagram are not necessarily to scale. Plant image source: Integration and Application Network (ian.umces.edu/media-library).
Jmse 09 00849 g007
Table 1. End of season biomass and N standing stocks for low marsh (LM, area = 6.92 ha) and high marsh (HM, area = 2.51 ha) zones of Cell 1B in 2014.
ComponentBiomass% NN MassN Standing
(g m−2) (g m−2)Stock (kg)
Low Marsh
AG Live11741.6319.11324
AG Dead1761.733.0211
BG14001.0014.0969
LM Total2750-36.22504
High Marsh
AG Live9301.2711.8296
AG Dead4341.617.0175
BG2551.052.767
HM Total1618-21.5539
Marsh Total 3043
Table 2. Estimates of N standing stocks in Cell 1B.
ComponentStanding Stock (kg N)
Macrophyte3043
Water column11
Sediment
root zone < 15 cm44,189
deep 15–200 cm544,997
Marsh Total592,240
Table 3. Fluxes (kg/tidal cycle) of measured N constituents in Cell 1B during 2014 deployments. Negative values represent tidal export.
MonthTide StageTNTDNNH4NOxNO2PN
FebFlood3.262.520.081.480.0250.60
Ebb−3.98−3.02−0.28−1.56−0.030−1.09
Net−0.72−0.50−0.20−0.08−0.004−0.49
MayFlood8.286.450.164.690.0852.33
Ebb−8.69−6.42−0.36−4.15−0.092−2.64
Net−0.400.03−0.200.54−0.006−0.31
JulFlood4.973.110.270.180.0212.33
Ebb−5.19−3.39−0.16−0.16−0.020−3.17
Net−0.22−0.280.110.020.00−0.84
NovFlood3.373.060.260.210.0260.95
Ebb−4.21−3.54−0.350.40−0.026−1.15
Net−0.84−0.49−0.09−0.190.000−0.20
Table 4. Net quarterly (kg N/quarter) and annual (kg N/y) fluxes of all measured N constituents. Negative values represent tidal export. The total marsh area (11.22 ha) was used to normalize annual fluxes.
MonthsTNTDNNH4NOxNO2PN
Jan–Mar−126−86−34−14−0.74−86
Apr–Jun−715−3596−1.08−55
Jul–Sep−39−502040.09−149
Oct–Dec−150−87−16−350.05−36
Annual
(kg y−1)−386−218−6551−1.68−325
(kg ha−1 y−1)−34−19−65−0.15−29
Table 5. Range of NH4+ diffusion coefficients (Ds) and diffusive flux rates (Jd) from the deep sediment into the root zone at the annual average soil temperature (14 °C).
𝜙Ds (10−6 cm−2 s−1)Jd (µmol N m−2 h−1)
0.605.545.57
0.656.517.09
0.707.558.85
Table 6. Summary mean annual net sediment inorganic N fluxes for the Cell 1B marsh. Fluxes were adjusted for day length and marsh platform and creek areas. Negative values represent flux into the sediment from the overlying water column.
Flux Rate (µmol N m−2 h−1)
ConstituentJun-13Sept-13Nov-13Apr-14May-14Mean
N232.529.06111.0283.4980.8263.38
NH491.7366.94−17.1595.89146.7576.83
NOx−26.88−10.891.74−69.97−22.11−25.62
Table 7. Estimated N flux rates for the major terms in the N budget for the Cell 1B marsh. Indented terms and figures in parentheses were estimated separately but contribute to the primary term above.
ComponentFlux Rate
(mg N m−2 d−1)
Area
(ha)
Annual Mass Flux
(kg N y−1)
InputsAtmos. Dep.2.6611.22109
N2-fixation1.3311.2255
Diffusion2.9811.22122
OutputsDenitrification21.3111.22873
Soil accumulation28.509.431027
Tidal Export (TN)9.4211.22386
NOx(−1.24)11.22(−51)
NH4(1.59)11.22(65)
InternalMacrophyte Uptake77.199.432657
Macrophyte Remineralization47.369.431630
Table 8. SAV habitat requirements for the mesohaline portion of Chesapeake Bay, and flood and ebb concentrations (mean of May and July deployments).
DINSRPChl aTSS
(µmol L−1)(µmol L−1)(µg L−1)(mg L−1)
Habitat Req.<10<0.32<15<15
Flood21.30.0911.821.0
Ebb19.40.1214.025.6
Publisher’s Note: MDPI stays neutral with regard to jurisdictional claims in published maps and institutional affiliations.

