Effects of a Wave Power Park with No-Take Zone on Decapod Abundance and Size


Abstract
:1. Introduction
2. Materials and Methods
2.1. Study Area
2.2. Experimental Design and Cage Types
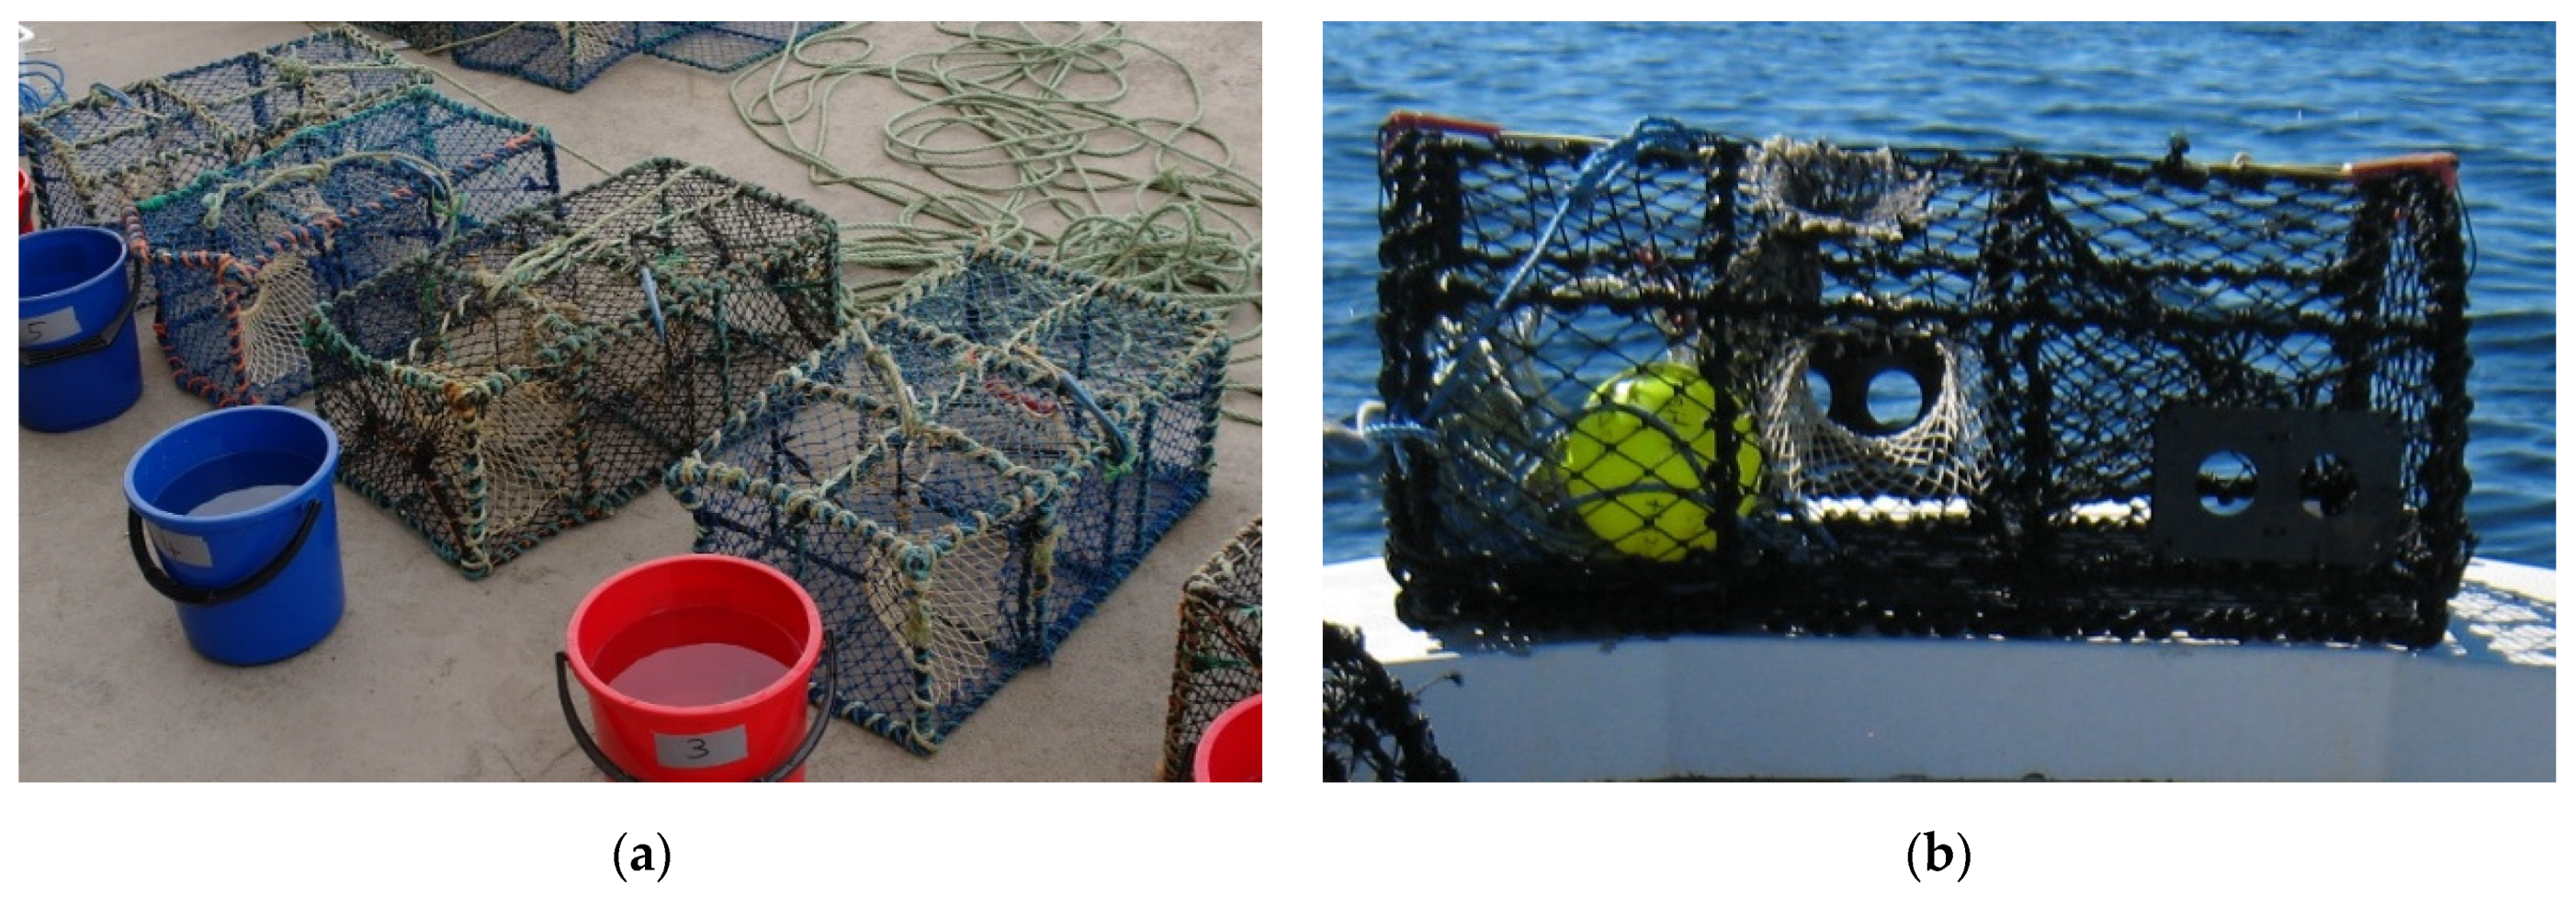
2.2.1. Small Cage Type
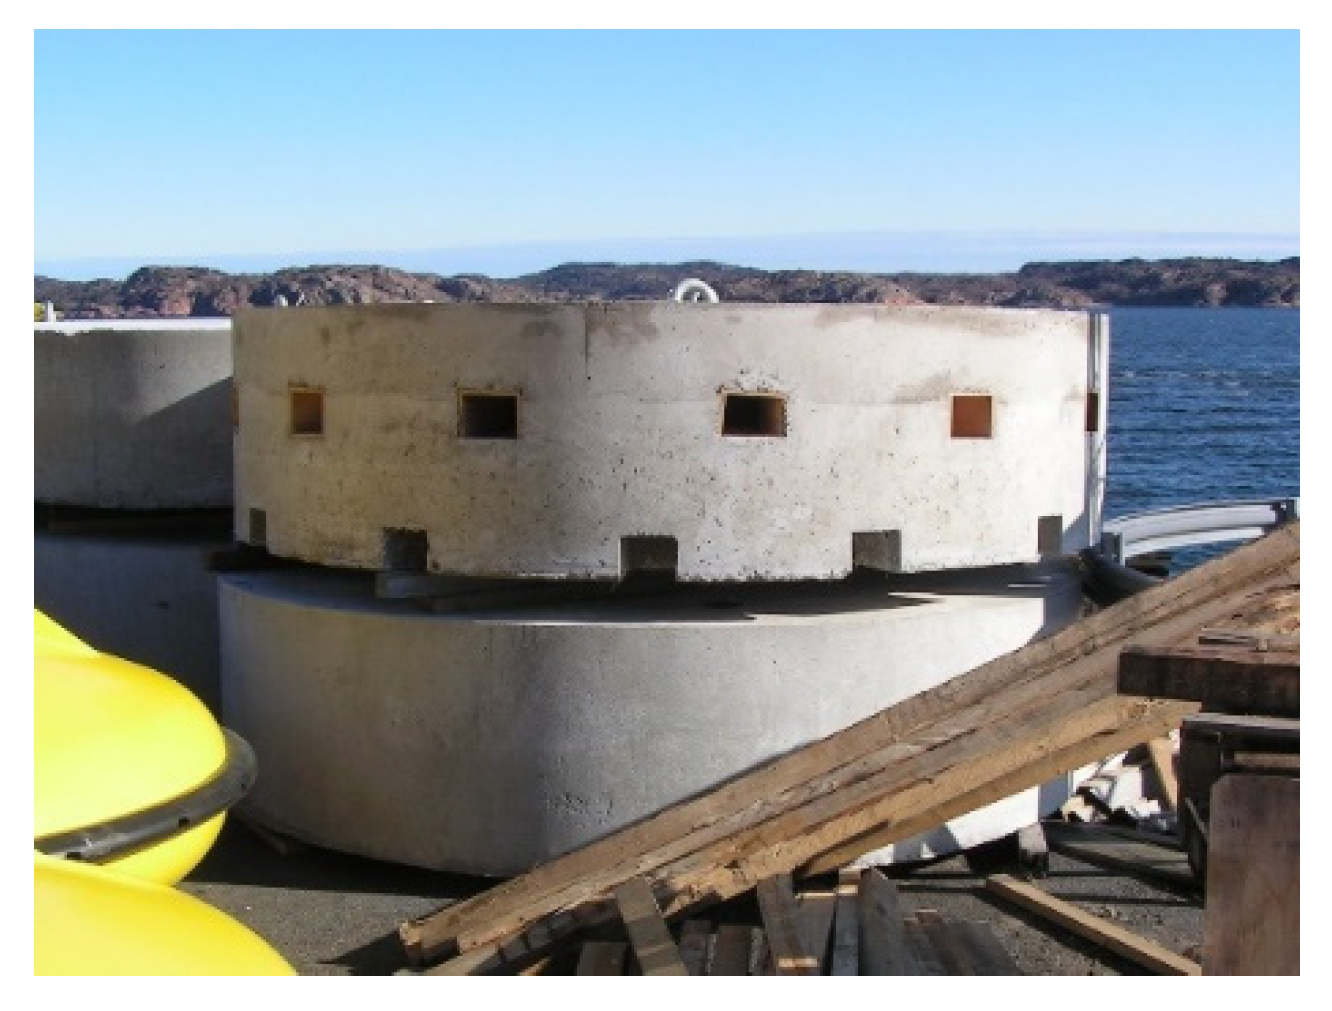
2.2.2. Large Cage Type
2.3. Statistical Analyses
2.3.1. Catch Rate
2.3.2. Number of Decapods and Carapace Width
3. Results
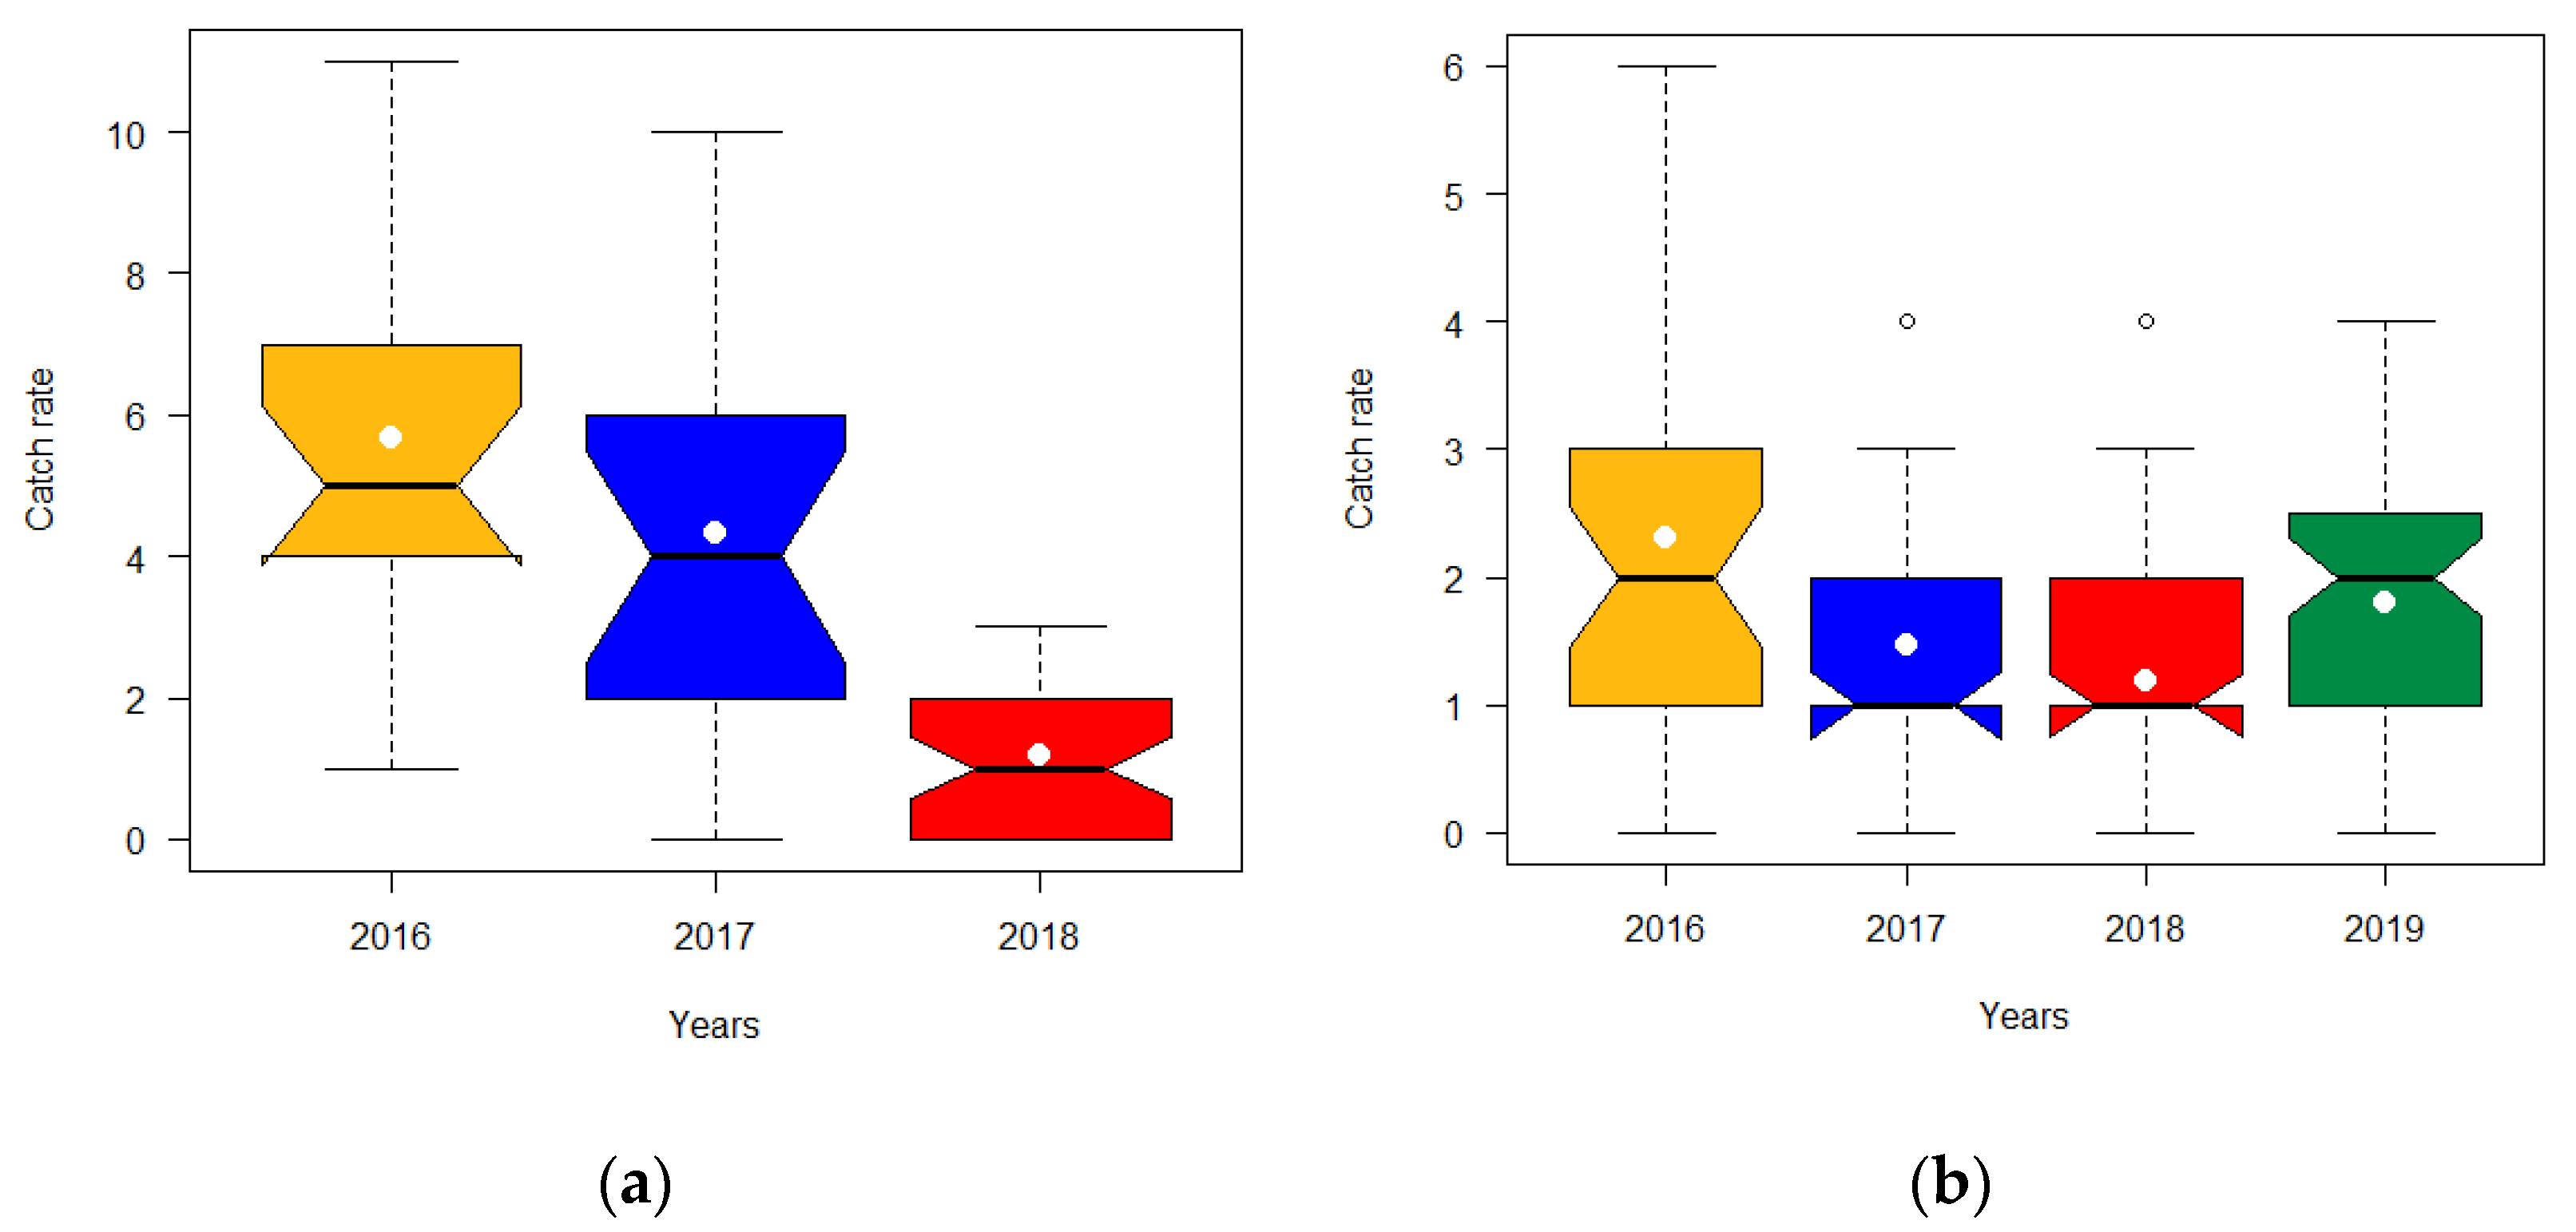
3.1. Catch Rate
3.1.1. Catch Rate of Decapods with Small Cages
3.1.2. Catch Rate of Decapods with Large Cages
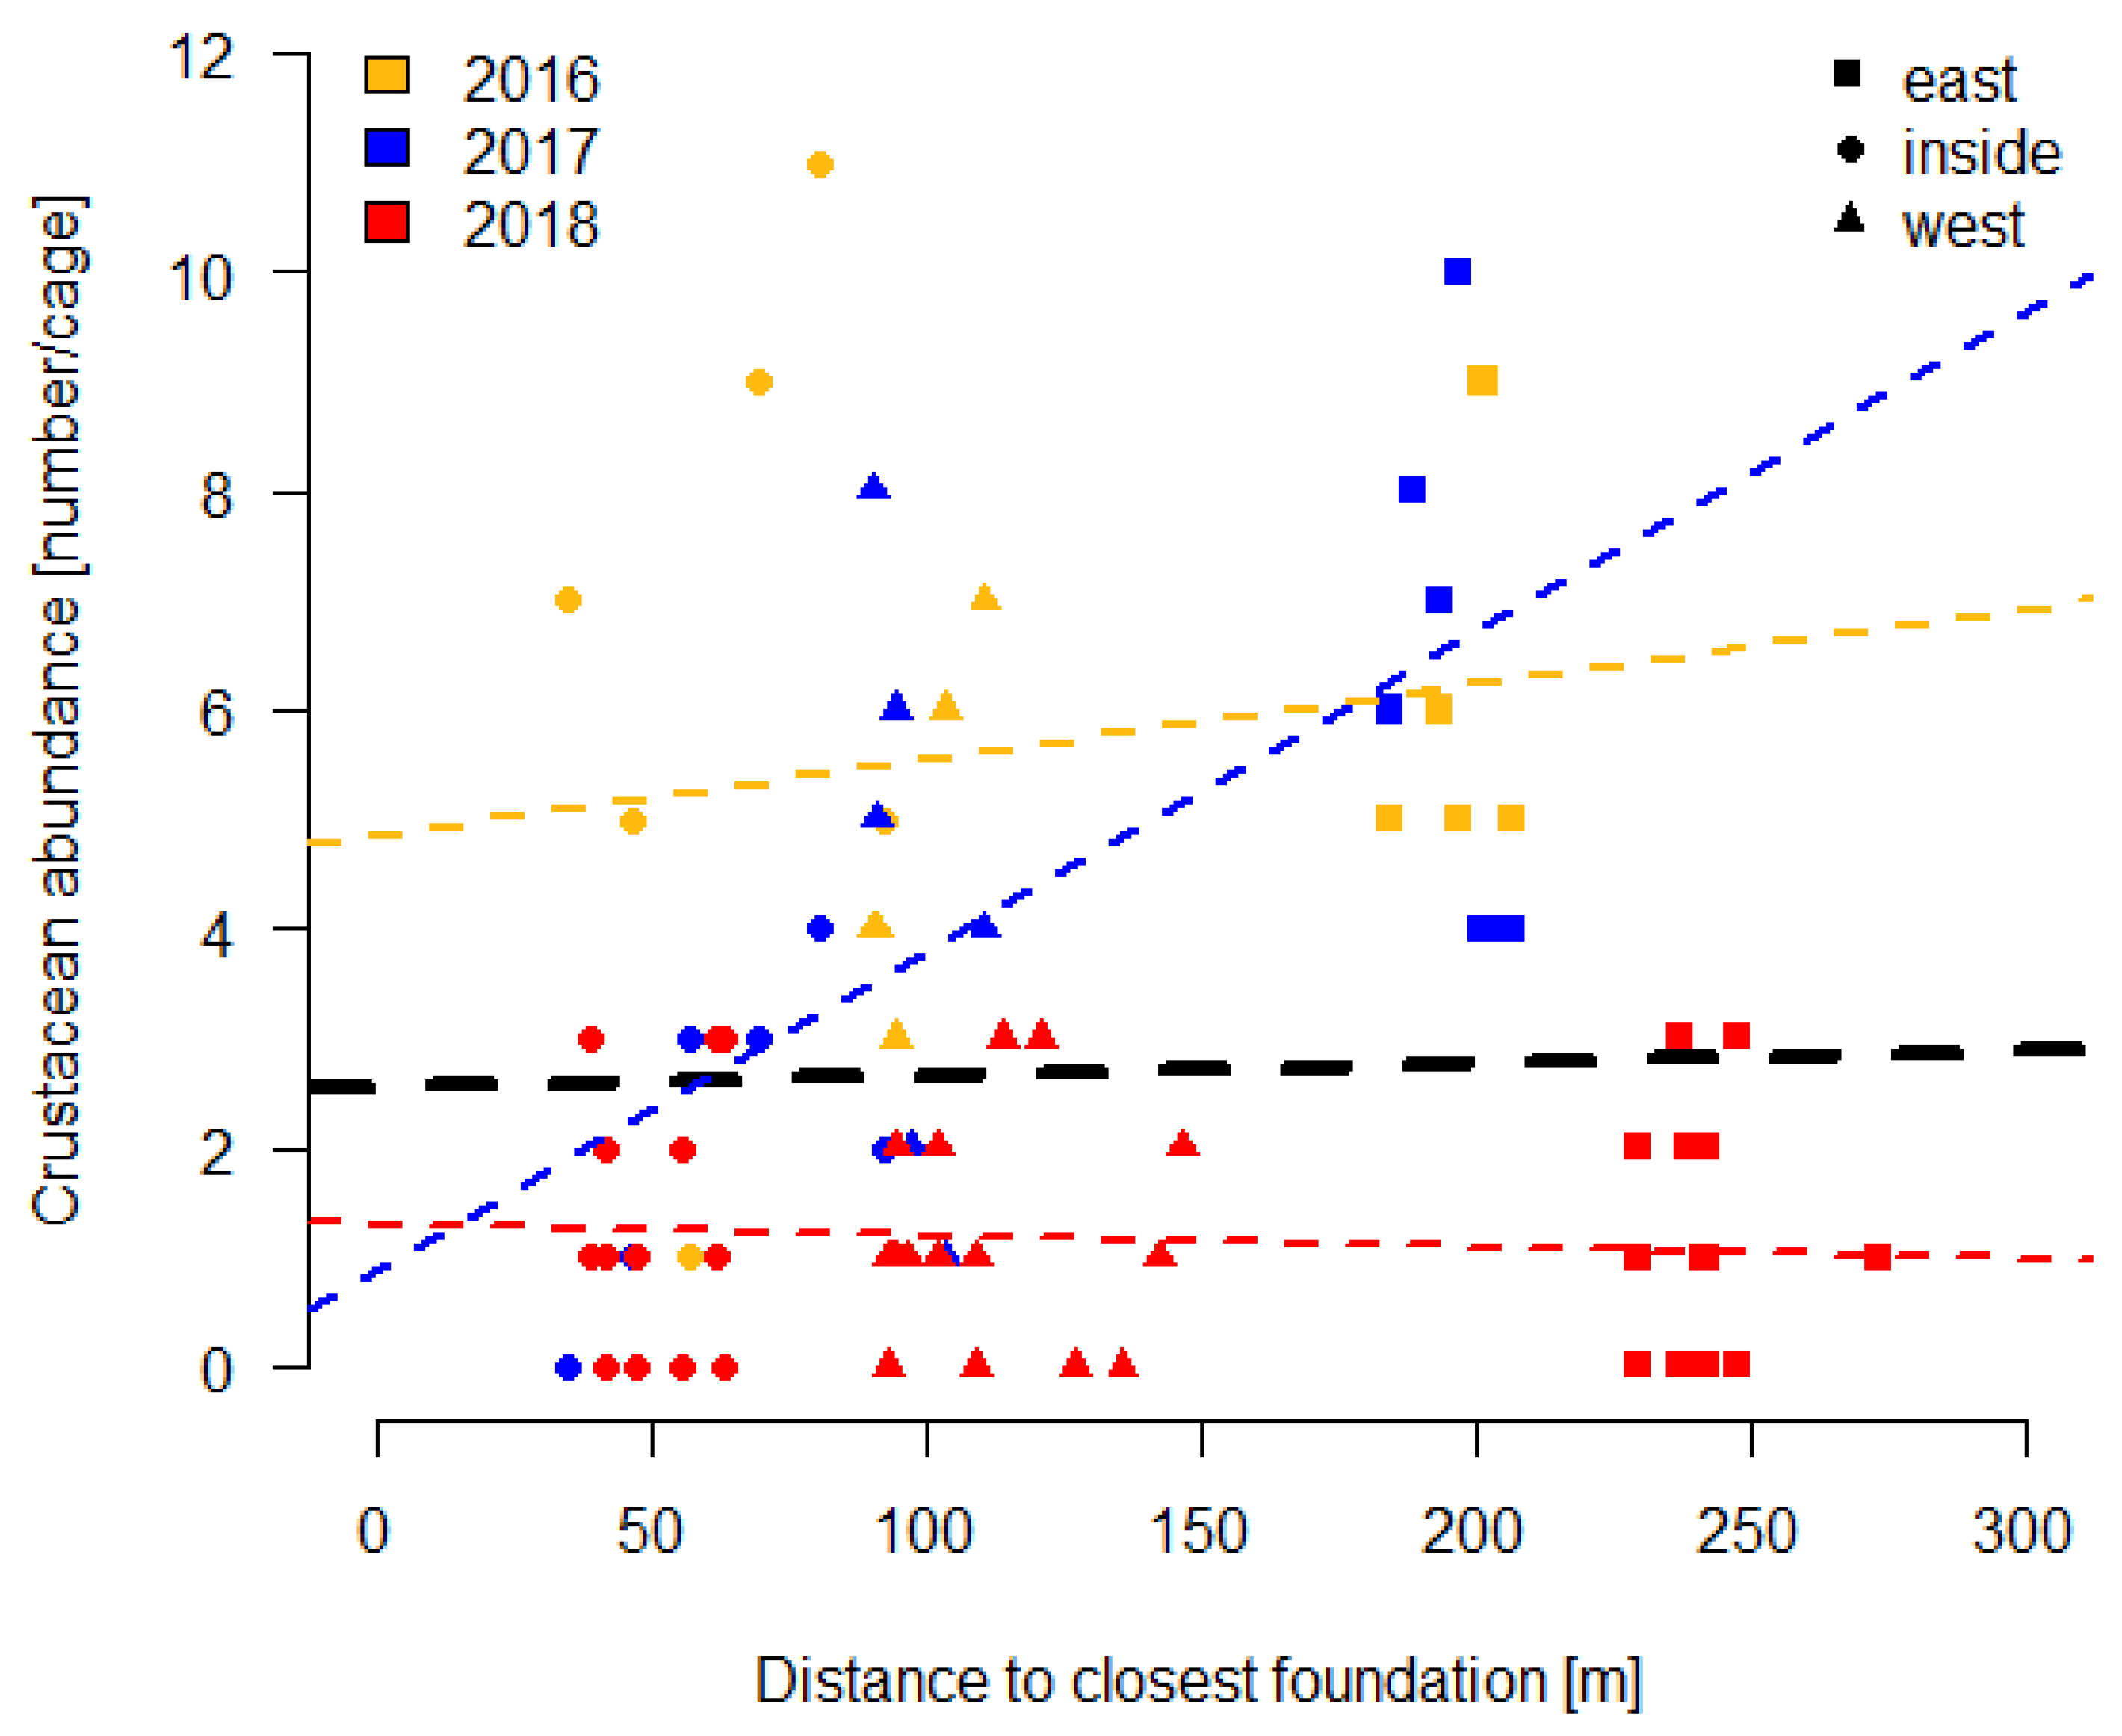
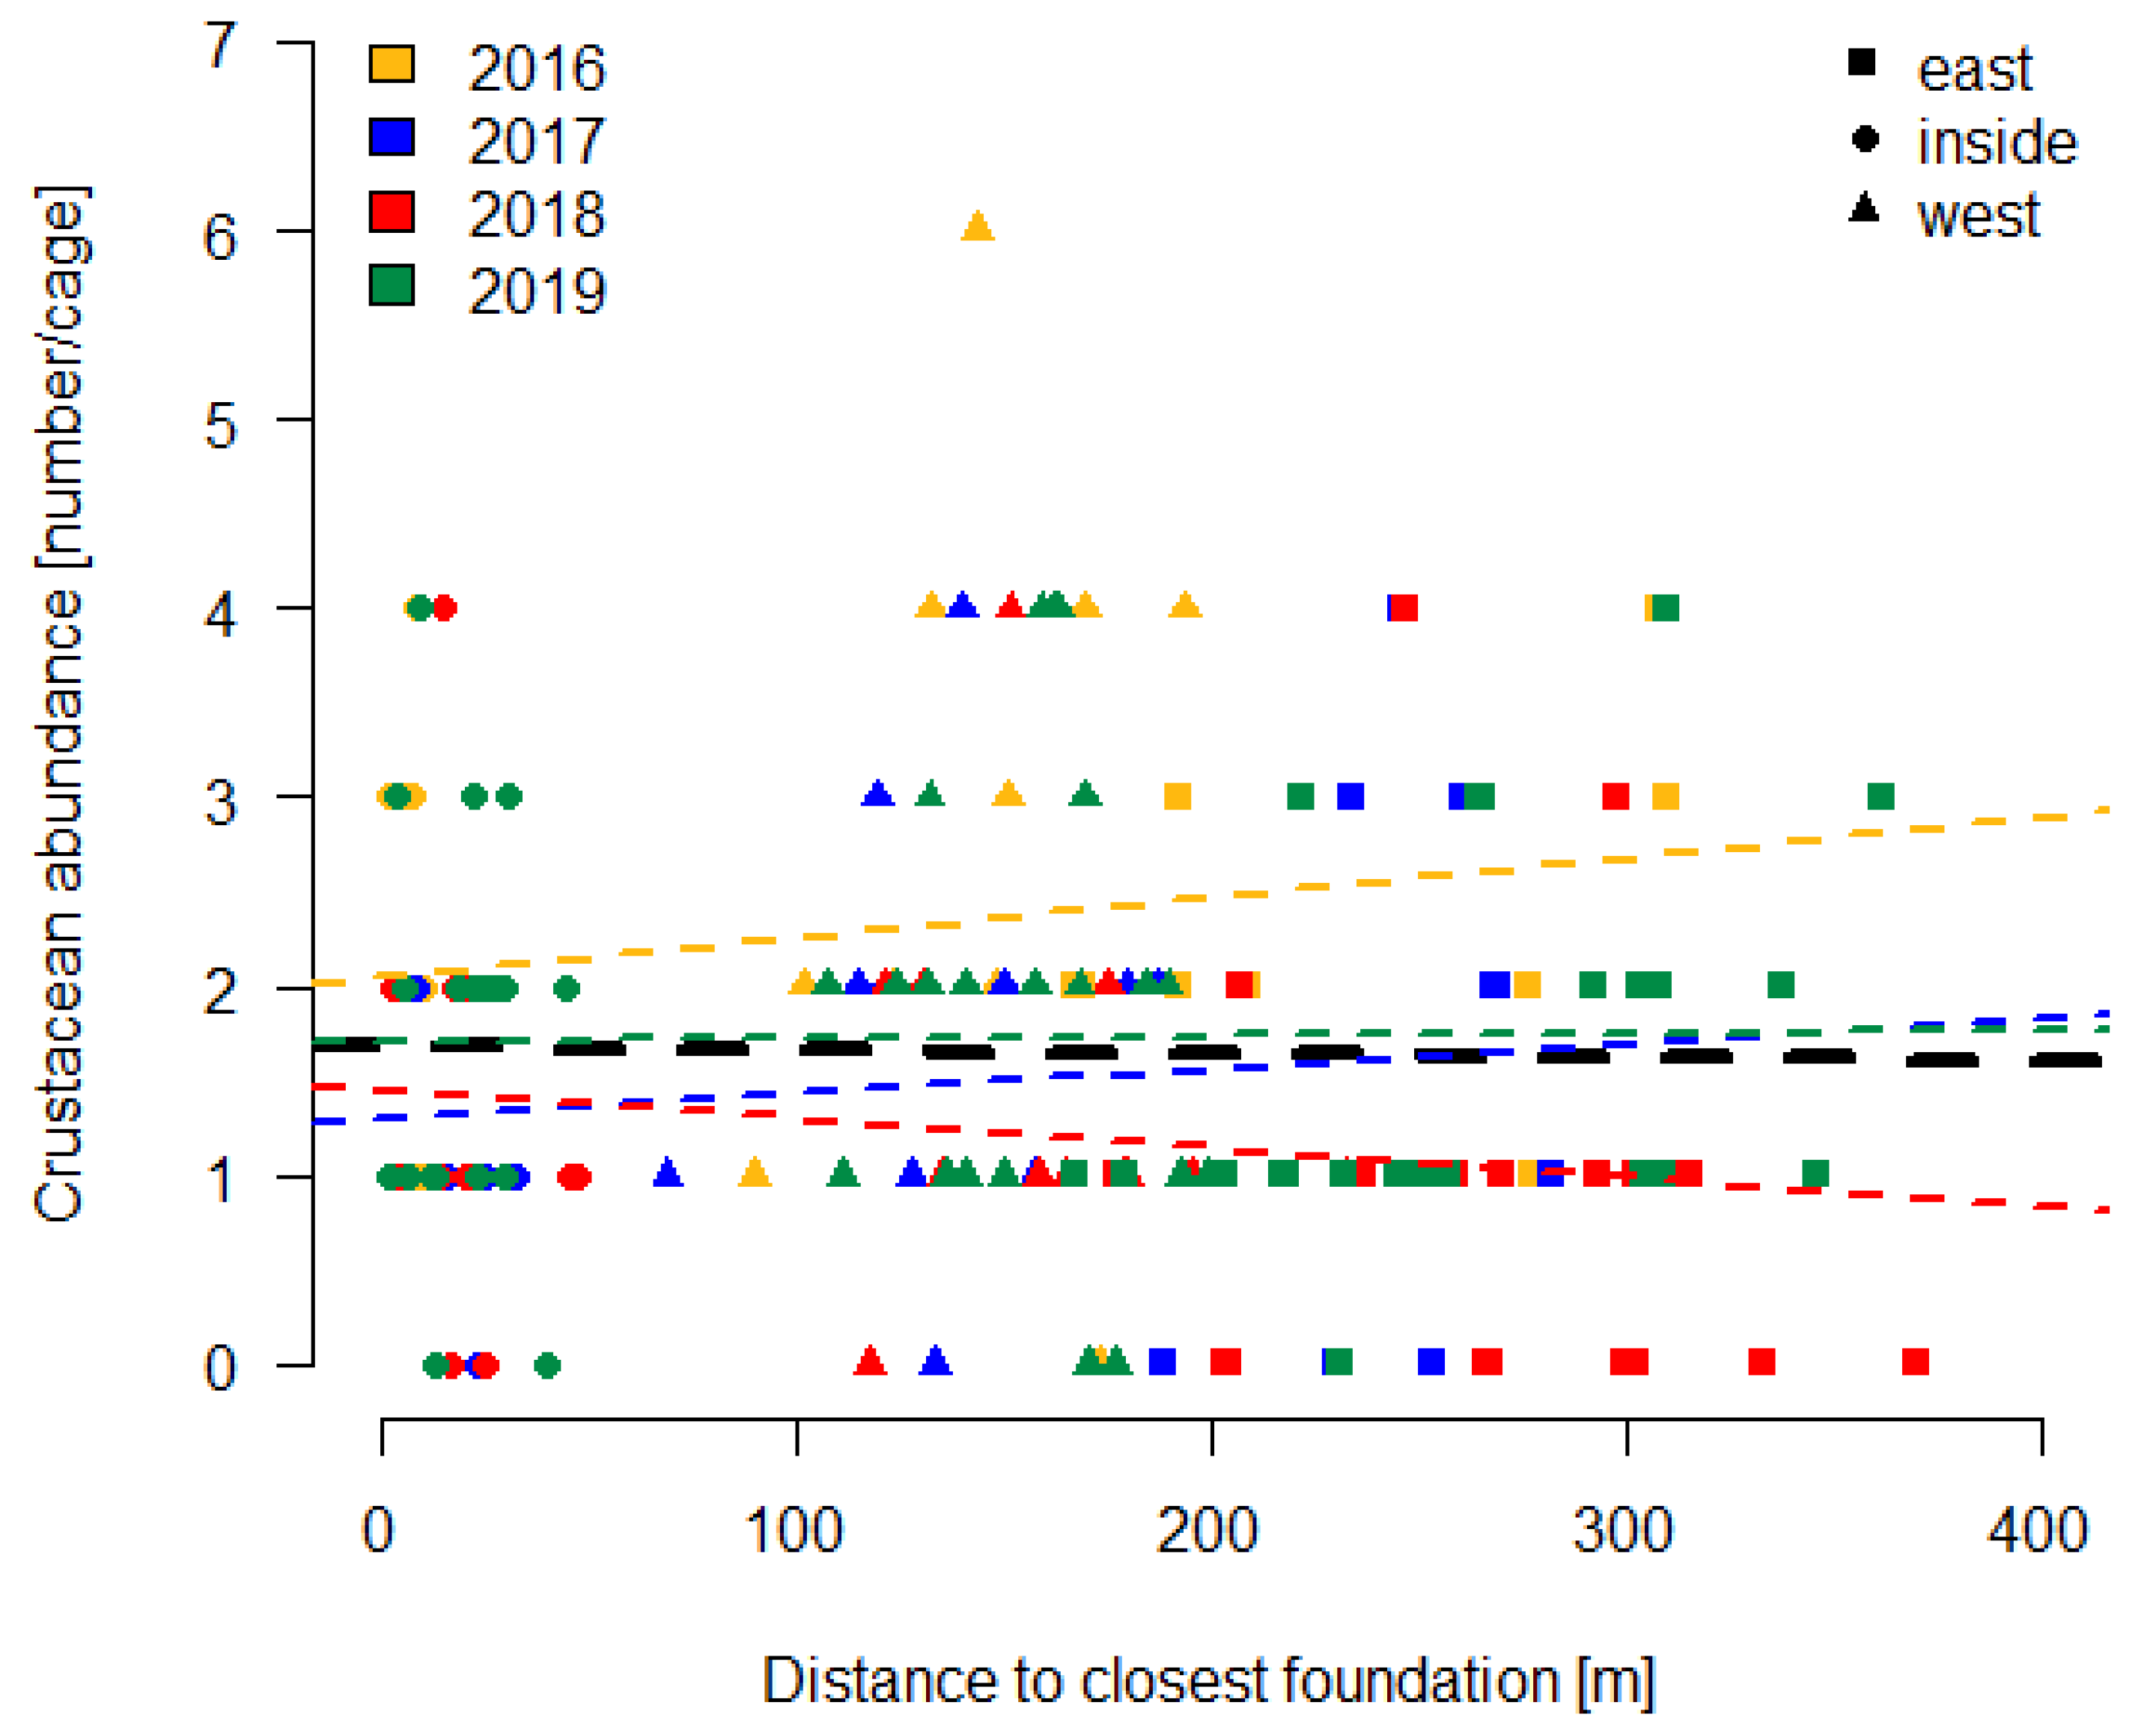
3.2. Number of Decapods
3.2.1. Small Cages
3.2.2. Large Cages
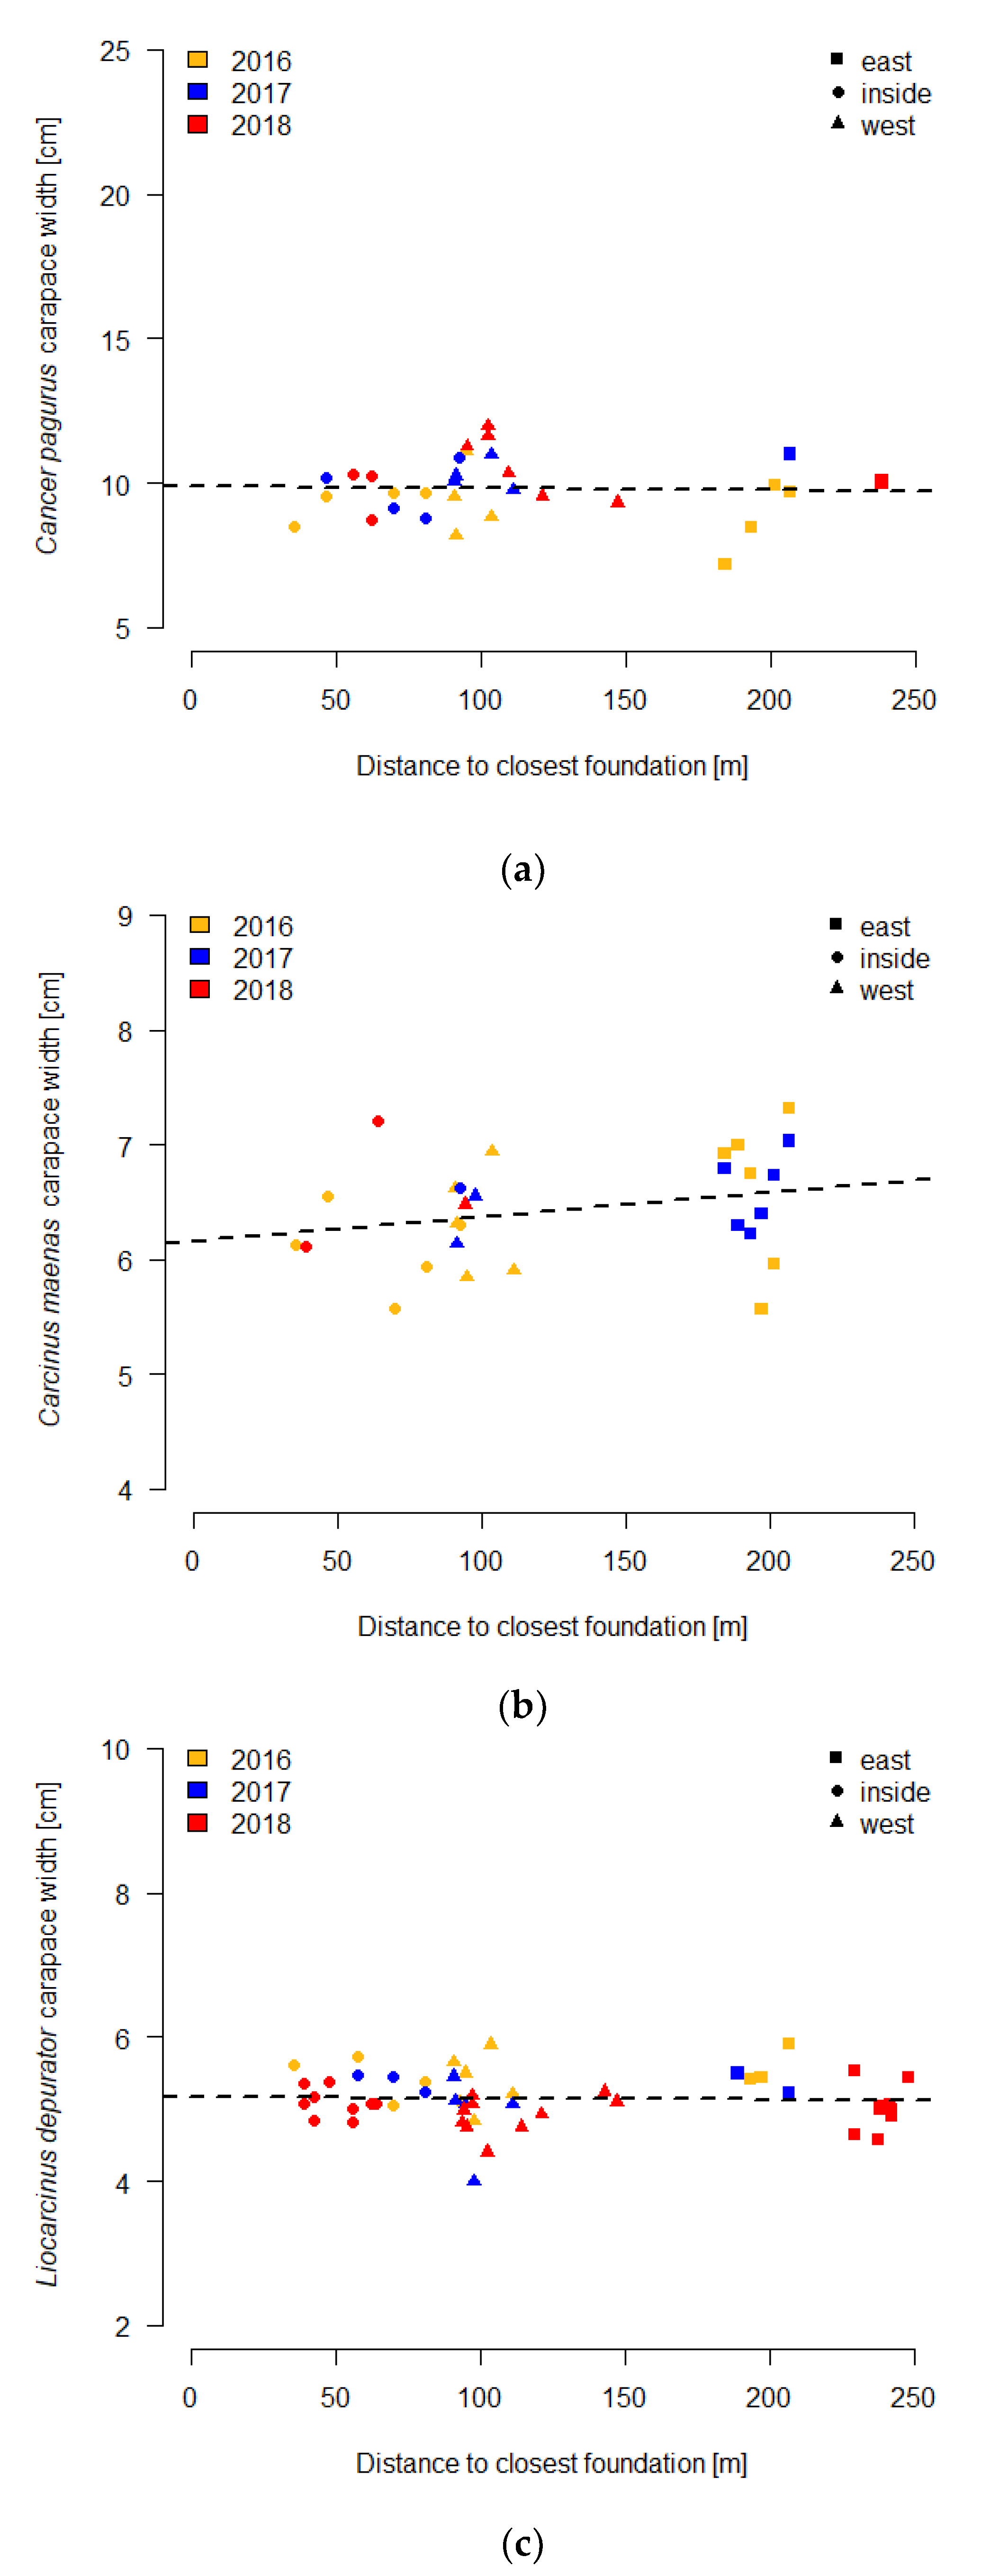
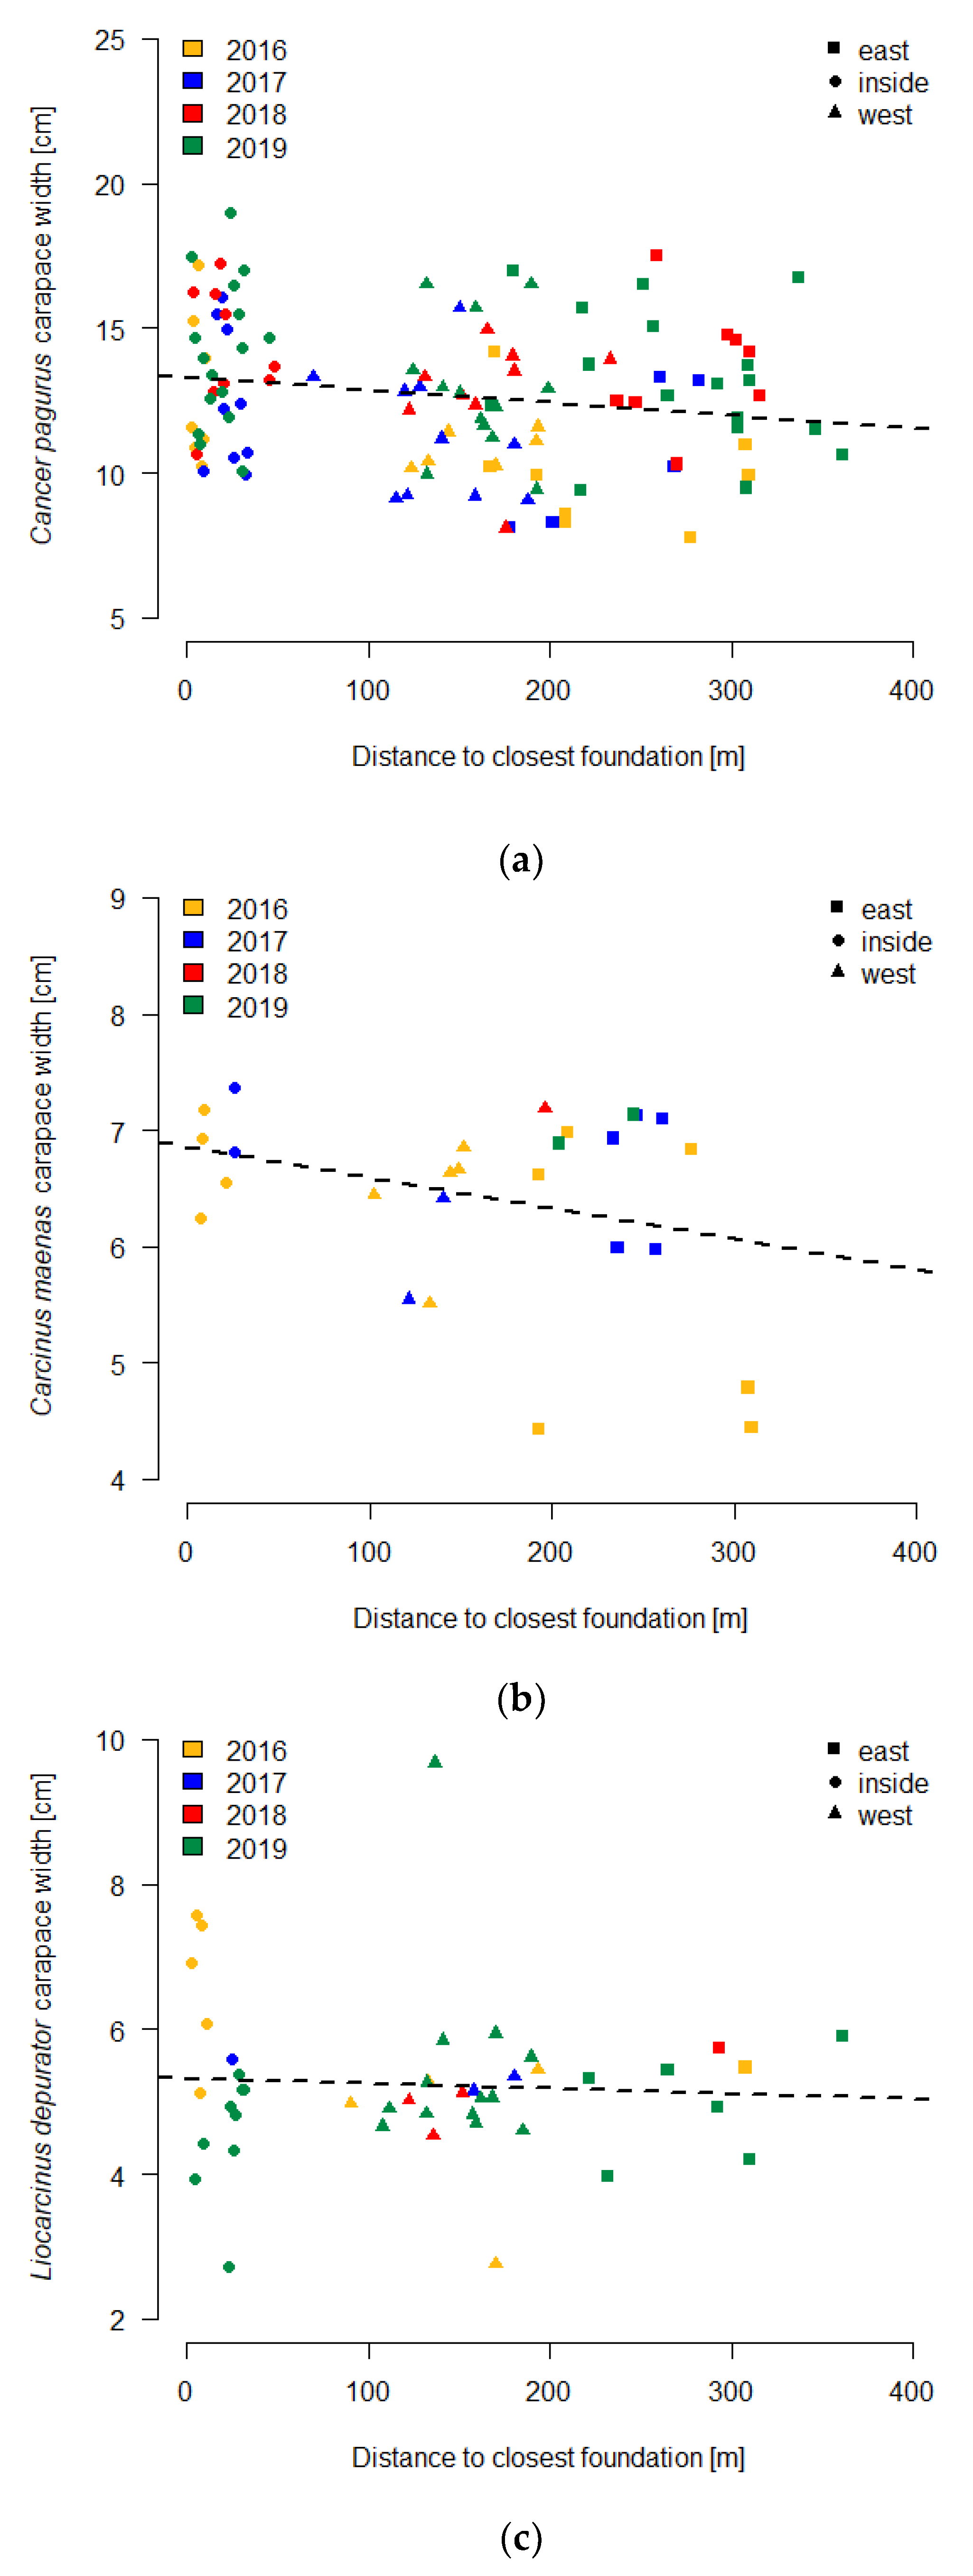
3.3. Carapace Width
4. Discussion
Author Contributions
Funding
Institutional Review Board Statement
Informed Consent Statement
Data Availability Statement
Acknowledgments
Conflicts of Interest
References
- Nations, U. Sustainable Development Goals. Available online: https://sdgs.un.org/goals/goal7 (accessed on 17 July 2020).
- Lindeboom, H.J.; Kouwenhoven, H.J.; Bergman, M.J.N.N.; Bouma, S.; Brasseur, S.; Daan, R.; Fijn, R.C.; De Haan, D.; Dirksen, S.; Van Hal, R.; et al. Short-term ecological effects of an offshore wind farm in the Dutch coastal zone; a compilation. Environ. Res. Lett. 2011, 6. [Google Scholar] [CrossRef] [Green Version]
- Taormina, B.; Bald, J.; Want, A.; Thouzeau, G.; Lejart, M.; Desroy, N.; Carlier, A. A review of potential impacts of submarine power cables on the marine environment: Knowledge gaps, recommendations and future directions. Renew. Sustain. Energy Rev. 2018, 96, 380–391. [Google Scholar] [CrossRef]
- Thurstan, R.H.; Yates, K.L.; O´Leary, B.C. Compatibility of offshore energy installations with marine protected areas. In Offshore Energy and Marine Spacial Planning; Yates, K.L., Bradshaw, C.J.A., Eds.; Routledge: Abingdon, UK, 2018; pp. 214–230. [Google Scholar]
- Gill, A.B. Offshore renewable energy: Ecological implications of generating electricity in the coastal zone. J. Appl. Ecol. 2005, 42, 605–615. [Google Scholar] [CrossRef] [Green Version]
- Copping, A.E.; Hemery, L.G. OES-Environmental 2020 State of the Science Report: Environmental Effects of Marine Renewable Energy Development Around the World; Pacific Northwest National Lab. (PNNL): Richland, WA, USA, 2020. [Google Scholar]
- Haikonen, K. Underwater Radiated Noise from Point Absorbing Wave Energy Converters. Ph.D. Thesis, Acta Universitatis Upsaliensis, Uppsala, Sweden, 2014. [Google Scholar]
- Williamson, B.J.; Blondel, P.; Armstrong, E.; Bell, P.; Hall, C.; Waggitt, J.J.; Scott, B. A Self-Contained Subsea Platform for Acoustic Monitoring of the Environment Around Marine Renewable Energy Devices–Field Deployments at Wave and Tidal Energy Sites in Orkney, Scotland. IEEE J. Ocean. Eng. 2015, 41, 67–81. [Google Scholar] [CrossRef] [Green Version]
- Bohnsack, J.A.; Sutherland, D.L. Artificial reef research: A review with recommendations for future priorities. Bull. Mar. Sci. 1985, 37, 11–39. [Google Scholar]
- Seaman, W.; Lindberg, W.J. Artificial Reefs. In Encyclopedia of Ocean Sciences; Academic Press: Cambridge, MA, USA, 2009; pp. 226–233. ISBN 9781840765472. [Google Scholar]
- Serrano, A.; Rodríguez-Cabello, C.; Sánchez, F.; Velasco, F.; Olaso, I.; Punzón, A. Effects of anti-trawling artificial reefs on ecological indicators of inner shelf fish and invertebrate communities in the Cantabrian Sea (southern Bay of Biscay). J. Mar. Biol. Assoc. United Kingd. 2010, 91, 623–633. [Google Scholar] [CrossRef]
- Komyakova, V.; Swearer, S. Contrasting patterns in habitat selection and recruitment of temperate reef fishes among natural and artificial reefs. Mar. Environ. Res. 2018, 143, 71–81. [Google Scholar] [CrossRef]
- Langhamer, O.; Wilhelmsson, D. Colonisation of fish and crabs of wave energy foundations and the effects of manufactured holes–A field experiment. Mar. Environ. Res. 2009, 68, 151–157. [Google Scholar] [CrossRef] [Green Version]
- Langhamer, O. The location of offshore wave power devices structures epifaunal assemblages. Int. J. Mar. Energy 2016, 16, 174–180. [Google Scholar] [CrossRef]
- Bender, A.; Langhamer, O.; Sundberg, J. Colonisation of wave power foundations by mobile mega- and macrofauna–A 12 year study. Mar. Environ. Res. 2020, 161, 105053. [Google Scholar] [CrossRef]
- Dannheim, J.; Bergström, L.; Birchenough, S.N.R.; Brzana, R.; Boon, A.R.; Coolen, J.W.P.; Dauvin, J.-C.; De Mesel, I.; Derweduwen, J.; Gill, A.B.; et al. Benthic effects of offshore renewables: Identification of knowledge gaps and urgently needed research. ICES J. Mar. Sci. 2019, 77, 1092–1108. [Google Scholar] [CrossRef]
- Wilhelmsson, D.; Yahya, S.A.S.; Öhman, M.C. Effects of high-relief structures on cold temperate fish assemblages: A field experiment. Mar. Biol. Res. 2006, 2, 136–147. [Google Scholar] [CrossRef]
- Reubens, J.T.; Degraer, S.; Vincx, M. The ecology of benthopelagic fishes at offshore wind farms: A synthesis of 4 years of research. Hydrobiology 2014, 727, 121–136. [Google Scholar] [CrossRef]
- Krone, R.; Dederer, G.; Kanstinger, P.; Krämer, P.; Schneider, C.; Schmalenbach, I. Mobile demersal megafauna at common offshore wind turbine foundations in the German Bight (North Sea) two years after deployment-increased production rate of Cancer pagurus. Mar. Environ. Res. 2017, 123, 53–61. [Google Scholar] [CrossRef]
- Langhamer, O. Effects of wave energy converters on the surrounding soft-bottom macrofauna (west coast of Sweden). Mar. Environ. Res. 2010, 69, 374–381. [Google Scholar] [CrossRef] [PubMed]
- Coates, D.A.; Deschutter, Y.; Vincx, M.; Vanaverbeke, J. Enrichment and shifts in macrobenthic assemblages in an offshore wind farm area in the Belgian part of the North Sea. Mar. Environ. Res. 2014, 95, 1–12. [Google Scholar] [CrossRef]
- Miller, R.G.; Hutchison, Z.; MacLeod, A.K.; Burrows, M.; Cottier-Cook, E.; Last, K.S.; Wilson, B. Marine renewable energy development: Assessing the Benthic Footprint at multiple scales. Front. Ecol. Environ. 2013, 11, 433–440. [Google Scholar] [CrossRef]
- Jones, E.V.; MacIntosh, D.; Stead, S.; Gray, T. How effective are MPAs in conserving crab stocks? A comparison of fisheries and conservation objectives in three coastal MPAs in Thailand. Ocean Coast. Manag. 2017, 149, 186–197. [Google Scholar] [CrossRef] [Green Version]
- Moland, O.E.; Olsen, E.M.; Knutsen, H.; Garrigou, P.; Espeland, S.H.; Kleiven, A.R.; Andre, C.; Knutsen, J.A. Lobster and cod benefit from small-scale northern marine protected areas: Inference from an empirical before–after control-impact study. Proc. R. Soc. B Boil. Sci. 2013, 280, 20122679. [Google Scholar] [CrossRef] [Green Version]
- Kleiven, P.J.N.; Espeland, S.H.; Olsen, E.M.; Abesamis, R.A.; Moland, O.E.; Kleiven, A.R. Fishing pressure impacts the abundance gradient of European lobsters across the borders of a newly established marine protected area. Proc. R. Soc. B Boil. Sci. 2019, 286, 20182455. [Google Scholar] [CrossRef]
- Fenberg, P.B.; Caselle, J.E.; Claudet, J.; Clemence, M.; Gaines, S.D.; García-Charton, J.A.; Gonçalves, E.; Grorud-Colvert, K.; Guidetti, P.; Jenkins, S.; et al. The science of European marine reserves: Status, efficacy, and future needs. Mar. Policy 2012, 36, 1012–1021. [Google Scholar] [CrossRef]
- Pande, A.; MacDiarmid, A.; Smith, P.; Davidson, R.; Cole, R.; Freeman, D.; Kelly, S.; Gardner, J. Marine reserves increase the abundance and size of blue cod and rock lobster. Mar. Ecol. Prog. Ser. 2008, 366, 147–158. [Google Scholar] [CrossRef] [Green Version]
- Allison, G.W.; Lubchenco, J.; Carr, M.H. Marine Reserves are Necessary but not Sufficient for Marine Conservation. Ecol. Appl. 1998, 8, S79. [Google Scholar] [CrossRef]
- Novaczek, E.; Howse, V.; Pretty, C.; Devillers, R.; Edinger, E.; Copeland, A. Limited Contribution of Small Marine Protected Areas to Regional Biodiversity: The Example of a Small Canadian No-Take MPA. Front. Mar. Sci. 2017, 4. [Google Scholar] [CrossRef]
- Follesa, M.C.; Cuccu, D.; Cannas, R.; Cabiddu, S.; Murenu, M.; Sabatini, A.; Cau, A. Effects of marine reserve protection on spiny lobster (Palinurus elephas Fabr., 1787) in a central western Mediterranean area. Hydrobiology 2008, 606, 63–68. [Google Scholar] [CrossRef]
- Bevacqua, D.; Melià, P.; Follesa, M.C.; De Leo, G.A.; Gatto, M.; Cau, A. Body growth and mortality of the spiny lobster Palinurus elephas within and outside a small marine protected area. Fish. Res. 2010, 106, 543–549. [Google Scholar] [CrossRef]
- Giakoumi, S.; Scianna, C.; Plass-Johnson, J.; Micheli, F.; Grorud-Colvert, K.; Thiriet, P.; Claudet, J.; Di Carlo, G.; Di Franco, A.; Gaines, S.D.; et al. Ecological effects of full and partial protection in the crowded Mediterranean Sea: A regional meta-analysis. Sci. Rep. 2017, 7, 1–12. [Google Scholar] [CrossRef] [Green Version]
- Rojo, I.; Sánchez-Meca, J.; García-Charton, J.A. Small-sized and well-enforced Marine Protected Areas provide ecological benefits for piscivorous fish populations worldwide. Mar. Environ. Res. 2019, 149, 100–110. [Google Scholar] [CrossRef]
- Di Franco, A.; Plass-Johnson, J.G.; Di Lorenzo, M.; Meola, B.; Claudet, J.; Gaines, S.D.; García-Charton, J.A.; Giakoumi, S.; Grorud-Colvert, K.; Hackradt, C.W.; et al. Linking home ranges to protected area size: The case study of the Mediterranean Sea. Biol. Conserv. 2018, 221, 175–181. [Google Scholar] [CrossRef] [Green Version]
- Claudet, J.; Pelletier, D.; Jouvenel, J.-Y.; Bachet, F.; Galzin, R. Assessing the effects of marine protected area (MPA) on a reef fish assemblage in a northwestern Mediterranean marine reserve: Identifying community-based indicators. Biol. Conserv. 2006, 130, 349–369. [Google Scholar] [CrossRef] [Green Version]
- Davidson, R.; Villouta, E.; Cole, R.; Barrier, R. Effects of marine reserve protection on spiny lobster (Jasus edwardsii) abundance and size at Tonga Island Marine Reserve, New Zealand. Aquat. Conserv. Mar. Freshw. Ecosyst. 2002, 12, 213–227. [Google Scholar] [CrossRef]
- Bayle-Sempere, J.T.; Moreno, D.; García-Charton, J.A.; Pérez-Ruzafa, A.; Sanchez-Jerez, P.; Reñones, O. Multi-scale spatial heterogeneity, habitat structure, and the effect of marine reserves on Western Mediterranean rocky reef fish assemblages. Mar. Biol. 2003, 144, 161–182. [Google Scholar] [CrossRef]
- Murawski, S.; Rago, P.; Fogarty, M. Spillover effects from temperate marine protected areas. In Proceedings of the American Fisheries Society Symposium, Hilton Head, SC, USA, 3–5 November 2004; pp. 167–184. [Google Scholar]
- McClanahan, T.R.; Mangi, S. Spillover of Exploitable Fishes from a Marine Park and Its Effect on the Adjacent Fishery. Ecol. Appl. 2000, 10, 1792. [Google Scholar] [CrossRef]
- Stamoulis, K.A.; Friedlander, A.M. A seascape approach to investigating fish spillover across a marine protected area boundary in Hawai‘i. Fish. Res. 2013, 144, 2–14. [Google Scholar] [CrossRef] [Green Version]
- Chapman, M.R.; Kramer, D.L. Gradients in coral reef fish density and size across the Barbados Marine Reserve boundary: Effects of reserve protection and habitat characteristics. Mar. Ecol. Prog. Ser. 1999, 181, 81–96. [Google Scholar] [CrossRef] [Green Version]
- Goñi, R.; Hilborn, R.; Díaz, D.; Mallol, S.; Adlerstein, S. Net contribution of spillover from a marine reserve to fishery catches. Mar. Ecol. Prog. Ser. 2010, 400, 233–243. [Google Scholar] [CrossRef] [Green Version]
- Roach, M.; Cohen, M.; Forster, R.; Revill, A.S.; Johnson, M. The effects of temporary exclusion of activity due to wind farm construction on a lobster (Homarus gammarus) fishery suggests a potential management approach. ICES J. Mar. Sci. 2018, 75, 1416–1426. [Google Scholar] [CrossRef]
- Ashley, M.; Austen, M.; Rodwell, L.; Mangi, S.C. Co-locating offshore wind farms and marine protected areas. In Offshore Energy and Marine Spacial Planning; Yates, K.L., Bradshaw, C.J.A., Eds.; Routledge: Abingdon, UK, 2018; pp. 246–259. [Google Scholar]
- Ashley, M.; Mangi, S.; Rodwell, L. The potential of offshore windfarms to act as marine protected areas–A systematic review of current evidence. Mar. Policy 2014, 45, 301–309. [Google Scholar] [CrossRef]
- Inger, R.; Attrill, M.J.; Bearhop, S.; Broderick, A.C.; Grecian, J.; Hodgson, D.J.; Mills, C.; Sheehan, E.; Votier, S.; Witt, M.; et al. Marine renewable energy: Potential benefits to biodiversity? An urgent call for research. J. Appl. Ecol. 2009, 46, 1145–1153. [Google Scholar] [CrossRef]
- Lejerskog, E.; Gravråkmo, H.; Savin, A.; Strömstedt, E.; Tyrberg, S.; Haikonen, K.; Krishna, R.; Boström, C.; Rahm, M.; Ekström, R.; et al. Lysekil Research Site, Sweden: A Status Update. In Proceedings of the 9th European Wave and Tidal Energy Conference, Southampton, UK, 5–9 September 2011. [Google Scholar]
- Parwal, A.; Remouit, F.; Hong, Y.; Francisco, F.; Castellucci, V.; Hai, L.; Ulvgård, L.; Li, W.; Lejerskog, E.; Baudoin, A.; et al. Wave Energy Research at Uppsala University and The Lysekil Research Site, Sweden: A Status Update. In Proceedings of the 11th European Wave and Tidal Energy Conference, Nantes, France, 6–11 September 2015; pp. 1–10. [Google Scholar]
- Rémouit, F.; Chatzigiannakou, M.-A.; Bender, A.; Temiz, I.; Sundberg, J.; Engström, J. Deployment and Maintenance of Wave Energy Converters at the Lysekil Research Site: A Comparative Study on the Use of Divers and Remotely-Operated Vehicles. J. Mar. Sci. Eng. 2018, 6, 39. [Google Scholar] [CrossRef] [Green Version]
- Cato, I.; Kjellin, B. Maringeologiska Undersökningar vid Vågkraftsanläggning Utanför Islandsberg, Bohuslän; SGU-Report 2008:10; Geological Survey of Sweden: Uppsala, Sweden, 2008; p. 17. [Google Scholar]
- Johannesson, K. The Bare Zone of Swedish Rocky Shores: Why Is It There? Nord. Soc. Oikos 1989, 54, 77–86. [Google Scholar] [CrossRef]
- Aberg, P. Size-Based Demography of the Seaweed Ascophyllum nodosum in Stochastic Environments. Ecology 1992, 73, 1488–1501. [Google Scholar] [CrossRef]
- R Core Team. R: A Language and Environment for Statistical Computing; R Foundation for Statistical Computing, R Core Team: Vienna, Austria, 2018. [Google Scholar]
- Plaschke, S.; Bulla, M.; Cruz-López, M.; Del Ángel, S.G.; Küpper, C. Nest initiation and flooding in response to season and semi-lunar spring tides in a ground-nesting shorebird. Front. Zoöl. 2019, 16, 15. [Google Scholar] [CrossRef] [PubMed] [Green Version]
- Blackwell, B.F.; Seamans, T.W.; De Vault, T.L.; Lima, S.L.; Pfeiffer, M.; Fernández-Juricic, E. Social information affects Canada goose alert and escape responses to vehicle approach: Implications for animal–vehicle collisions. PeerJ 2019, 7, e8164. [Google Scholar] [CrossRef]
- Knief, U.; Forstmeier, W. Violating the normality assumption may be the lesser of two evils. Behav. Res. Methods 2021, 1–15. [Google Scholar] [CrossRef]
- Wilhelmsson, D.; Langhamer, O. The Influence of Fisheries Exclusion and Addition of Hard Substrata on Fish and Crustaceans. In Marine Renewable Energy Technology and Environmental Interactions; Shields, M.A., Payne, A.I.L., Eds.; Springer: Berlin/Heidelberg, Germany, 2014; pp. 49–60. ISBN 978-94-017-8001-8. [Google Scholar]
- Southward, A.; Hawkins, S.; Burrows, M. Seventy years’ observations of changes in distribution and abundance of zooplankton and intertidal organisms in the western English Channel in relation to rising sea temperature. J. Therm. Biol. 1995, 20, 127–155. [Google Scholar] [CrossRef]
- Magill, S.H.; Sayer, M.D.J. Seasonal and interannual variation in fish assemblages of northern temperate rocky subtidal habitats. J. Fish Biol. 2002, 61, 1198–1216. [Google Scholar] [CrossRef]
- Coates, D.A.; Kapasakali, D.-A.; Vincx, M.; Vanaverbeke, J. Short-term effects of fishery exclusion in offshore wind farms on macrofaunal communities in the Belgian part of the North Sea. Fish. Res. 2016, 179, 131–138. [Google Scholar] [CrossRef]
- Griffin, R.A.; Robinson, G.J.; West, A.; Gloyne-Phillips, I.T.; Unsworth, R.K.F. Assessing Fish and Motile Fauna around Offshore Windfarms Using Stereo Baited Video. PLoS ONE 2016, 11, e0149701. [Google Scholar] [CrossRef] [PubMed] [Green Version]
- Edgar, G.J.; Stuart-Smith, R.D.; Willis, T.J.; Kininmonth, S.; Baker, S.C.; Banks, S.; Barrett, N.S.; Becerro, M.A.; Bernard, A.T.F.; Berkhout, J.; et al. Global conservation outcomes depend on marine protected areas with five key features. Nat. Cell Biol. 2014, 506, 216–220. [Google Scholar] [CrossRef] [Green Version]
- Bolle, L.J.; Hunter, E.; Rijnsdorp, A.D.; Pastoors, M.A.; Metcalfe, J.D.; Reynolds, J.D. Do tagging experiments tell the truth? Using electronic tags to evaluate conventional tagging data. ICES J. Mar. Sci. 2005, 62, 236–246. [Google Scholar] [CrossRef] [Green Version]
- Ungfors, A.; Hallbäck, H.; Nilsson, P.G. Movement of adult edible crab (Cancer pagurus L.) at the Swedish West Coast by mark-recapture and acoustic tracking. Fish. Res. 2007, 84, 345–357. [Google Scholar] [CrossRef]
- Glass, C.W. Field and Laboratory Studies of the Behaviour of the Swimming Crab Liocarcinus depurator (Linnaeus). Ph.D. Thesis, University of Glasgow, Glasgow, Scotland, 1985. [Google Scholar]
- Guidetti, P.; Milazzo, M.; Bussotti, S.; Molinari, A.; Murenu, M.; Pais, A.; Spanò, N.; Balzano, R.; Agardy, T.; Boero, F.; et al. Italian marine reserve effectiveness: Does enforcement matter? Biol. Conserv. 2008, 141, 699–709. [Google Scholar] [CrossRef]
- Sande, H. Recreational Fisheries–Characterization, Quantification and Biological Impact on Natural Resources; Aqua Introductory Research Essay 2020: Swedish University of Agricultural Sciences, Department of Aquatic Resources; Drott-ningholm Lysekil: Öregrund, Sweden, 2020; p. 46. [Google Scholar]
- Radford, Z.; Hyder, K.; Zarauz, L.; Mugerza, E.; Ferter, K.; Prellezo, R.; Strehlow, H.V.; Townhill, B.; Lewin, W.-C.; Weltersbach, M.S. The impact of marine recreational fishing on key fish stocks in European waters. PLoS ONE 2018, 13, e0201666. [Google Scholar] [CrossRef] [PubMed] [Green Version]
- Halpern, B.S. The impact of marine reserves: Do reserves work and does reserve size matter? Ecol. Appl. 2003, 13, 117–137. [Google Scholar] [CrossRef]


| Deployed Cages | West of Park | Inside Park | East of Park | Total Cages |
|---|---|---|---|---|
| Small 2016 | 6 | 6 | 6 | 18 |
| Small 2017 | 6 | 6 | 6 | 18 |
| Small 2018 | 3 × 6 | 3 × 6 | 3 × 6 | 54 |
| Total small cages | 30 | 30 | 30 | 90 |
| Large 2016 | 1 × 6/1 × 5 | 1 × 6/1 × 5 | 2 × 5 | 32 |
| Large 2017 | 2 × 6 | 2 × 6 | 2 × 6 | 36 |
| Large 2018 | 2 × 6 | 2 × 6 | 2 × 6/1 × 5 | 41 |
| Large 2019 | 3 × 7 | 3 × 7 | 3 × 7 | 63 |
| Total large cages | 56 | 56 | 60 | 172 |
| Species | Individuals Small Cages | Individuals Large Cages |
|---|---|---|
| Cancer pagurus | 38 | 165 |
| Carcinus maenas | 92 | 45 |
| Liocarcinus depurator | 102 | 63 |
| Hyas araneus | 8 | 10 |
| Pagurus pubescens | 1 | 0 |
| Pagurus bernhardus | 1 | 6 |
| Homarus gammarus | 0 | 1 |
| Galathea spp. | 1 | 0 |
| Total number of decapods | 243 | 290 |
| Total number of cages | 90 | 172 |
| Total empty cages | 19 | 21 |
| Cages | Number of Cages | F-Statistic | r2 | p-Value | Linear Model: Abundance |
|---|---|---|---|---|---|
| Small 2016 | 18 | 0.42 | 0.03 | 0.528 | 0.007 × D + 4.85 |
| Small 2017 | 18 | 10.29 | 0.391 | 0.006 | 0.029 × D + 0.86 |
| Small 2018 | 54 | 0.38 | 0.007 | 0.538 | −0.001 × D + 1.31 |
| Small pooled | 90 | 0.007 | 0.0008 | 0.79 | 0.001 × D + 2.57 |
| Large 2016 | 32 | 0.87 | 0.03 | 0.359 | 0.002 × D + 2.04 |
| Large 2017 | 36 | 0.50 | 0.015 | 0.482 | 0.001 × D + 1.29 |
| Large 2018 | 41 | 1.01 | 0.03 | 0.321 | −0.002 × D + 1.45 |
| Large 2019 | 63 | 0.01 | 0.0001 | 0.931 | 0.0001 × D + 1.71 |
| Large pooled | 172 | 0.06 | 0.0004 | 0.81 | −0.0002 × D + 1.69 |
| Small Cages | Number of Cages | F-Statistic | r2 | p-Value | Linear Model: Carapace Width |
|---|---|---|---|---|---|
| Cancer pagurus | 32 | 0.04 | 0.001 | 0.849 | −0.0006 × D + 9.91 |
| Carcinus maenas | 28 | 2.13 | 0.076 | 0.157 | 0.0021 × D + 6.16 |
| Liocarcinus depurator | 52 | 0.06 | 0.001 | 0.802 | −0.0002 × D + 5.17 |
| Large Cages | Number of Cages | F-Statistic | r2 | p-Value | Linear Model: Carapace Width |
| Cancer pagurus | 117 | 4.47 | 0.037 | 0.037 | −0.0045 × D + 13.33 |
| Carcinus maenas | 27 | 2.61 | 0.095 | 0.058 | −0.0026 × D + 6.86 |
| Liocarcinus depurator | 45 | 0.16 | 0.004 | 0.693 | −0.0007 × D + 5.32 |
Publisher’s Note: MDPI stays neutral with regard to jurisdictional claims in published maps and institutional affiliations. |
© 2021 by the authors. Licensee MDPI, Basel, Switzerland. This article is an open access article distributed under the terms and conditions of the Creative Commons Attribution (CC BY) license (https://creativecommons.org/licenses/by/4.0/).
Share and Cite
Bender, A.; Langhamer, O.; Molis, M.; Sundberg, J. Effects of a Wave Power Park with No-Take Zone on Decapod Abundance and Size. J. Mar. Sci. Eng. 2021, 9, 864. https://doi.org/10.3390/jmse9080864
Bender A, Langhamer O, Molis M, Sundberg J. Effects of a Wave Power Park with No-Take Zone on Decapod Abundance and Size. Journal of Marine Science and Engineering. 2021; 9(8):864. https://doi.org/10.3390/jmse9080864
Chicago/Turabian StyleBender, Anke, Olivia Langhamer, Markus Molis, and Jan Sundberg. 2021. "Effects of a Wave Power Park with No-Take Zone on Decapod Abundance and Size" Journal of Marine Science and Engineering 9, no. 8: 864. https://doi.org/10.3390/jmse9080864
APA StyleBender, A., Langhamer, O., Molis, M., & Sundberg, J. (2021). Effects of a Wave Power Park with No-Take Zone on Decapod Abundance and Size. Journal of Marine Science and Engineering, 9(8), 864. https://doi.org/10.3390/jmse9080864