Article

Cyclic Behavior of Calcareous Sand from the South China Sea

1
Urban Underground Space Research Center, Nanjing Tech University, Nanjing 210009, China
2
Institute of Geotechnical Engineering, Nanjing Tech University, Nanjing 210009, China
*
Author to whom correspondence should be addressed.
J. Mar. Sci. Eng. 2021, 9(9), 1014; https://doi.org/10.3390/jmse9091014
Submission received: 6 August 2021 / Revised: 10 September 2021 / Accepted: 13 September 2021 / Published: 16 September 2021
(This article belongs to the Section Ocean Engineering)

Abstract

:
This study examines the cyclic behavior of calcareous sand obtained from the South China Sea. A series of undrained cyclic triaxial tests were performed on the calcareous sand with various relative densities, cyclic stress ratios, and effective confining pressures. The test results show that whereas the effective confining pressure exhibited a small influence on the cyclic behavior of the calcareous sand, the effect of changes in CSR and relative density was notable. Due to its angular nature, the liquefaction resistance of calcareous sand was much higher than that of silica sand. In addition, differences between calcareous and silica sands in terms of pore pressure generation characteristics and deformation responses were also observed.

1. Introduction

Calcareous sand is a typical marine sediment that is widely distributed in tropical and subtropical areas. In these areas, the replacement of silica sand with calcareous sand as filling material for the offshore engineering foundations is convenient and cost-effective. Such foundations are often subjected to cyclic loadings, such as waves, winds, and even earthquakes. Therefore, it is necessary to evaluate the dynamic and cyclic behavior of calcareous sand.
Calcareous sands exhibit unconventional characteristics compared to those of silica sands owing to its angular nature, crushable structure, and high void ratio [1,2,3,4,5,6]. Extensive studies have investigated the dynamic properties of calcareous sands retrieved from different regions, including the North West Shelf of Australia [7,8,9], the west coast of Eire [10,11,12], Southwestern Puerto Rico [13], the north coast of Egypt [14], the Hawaiian Islands [15], the Persian Gulf [16], and the South China Sea [17,18,19,20,21]. Drawn from a wide range of physical, chemical, and biological geologic environments, these calcareous sands exhibit significant variability in shape, structure, gradation, and chemical composition. The biogenically induced variability of calcareous sands is therefore substantial, and can greatly influence their cyclic behavior, which is not the case for silica sands. Thus, evaluating the dynamic responses of calcareous sand requires considering different origins and physical characteristics.
This paper performed a series of undrained cyclic triaxial experiments on the calcareous sand retrieved from the South China Sea and compared the results with similar experiments on Fujian silica sand. The research results provide valuable measurements and parameters for the specific calcareous sand foundation in reef engineering.

2. Materials and Methods

2.1. Materials

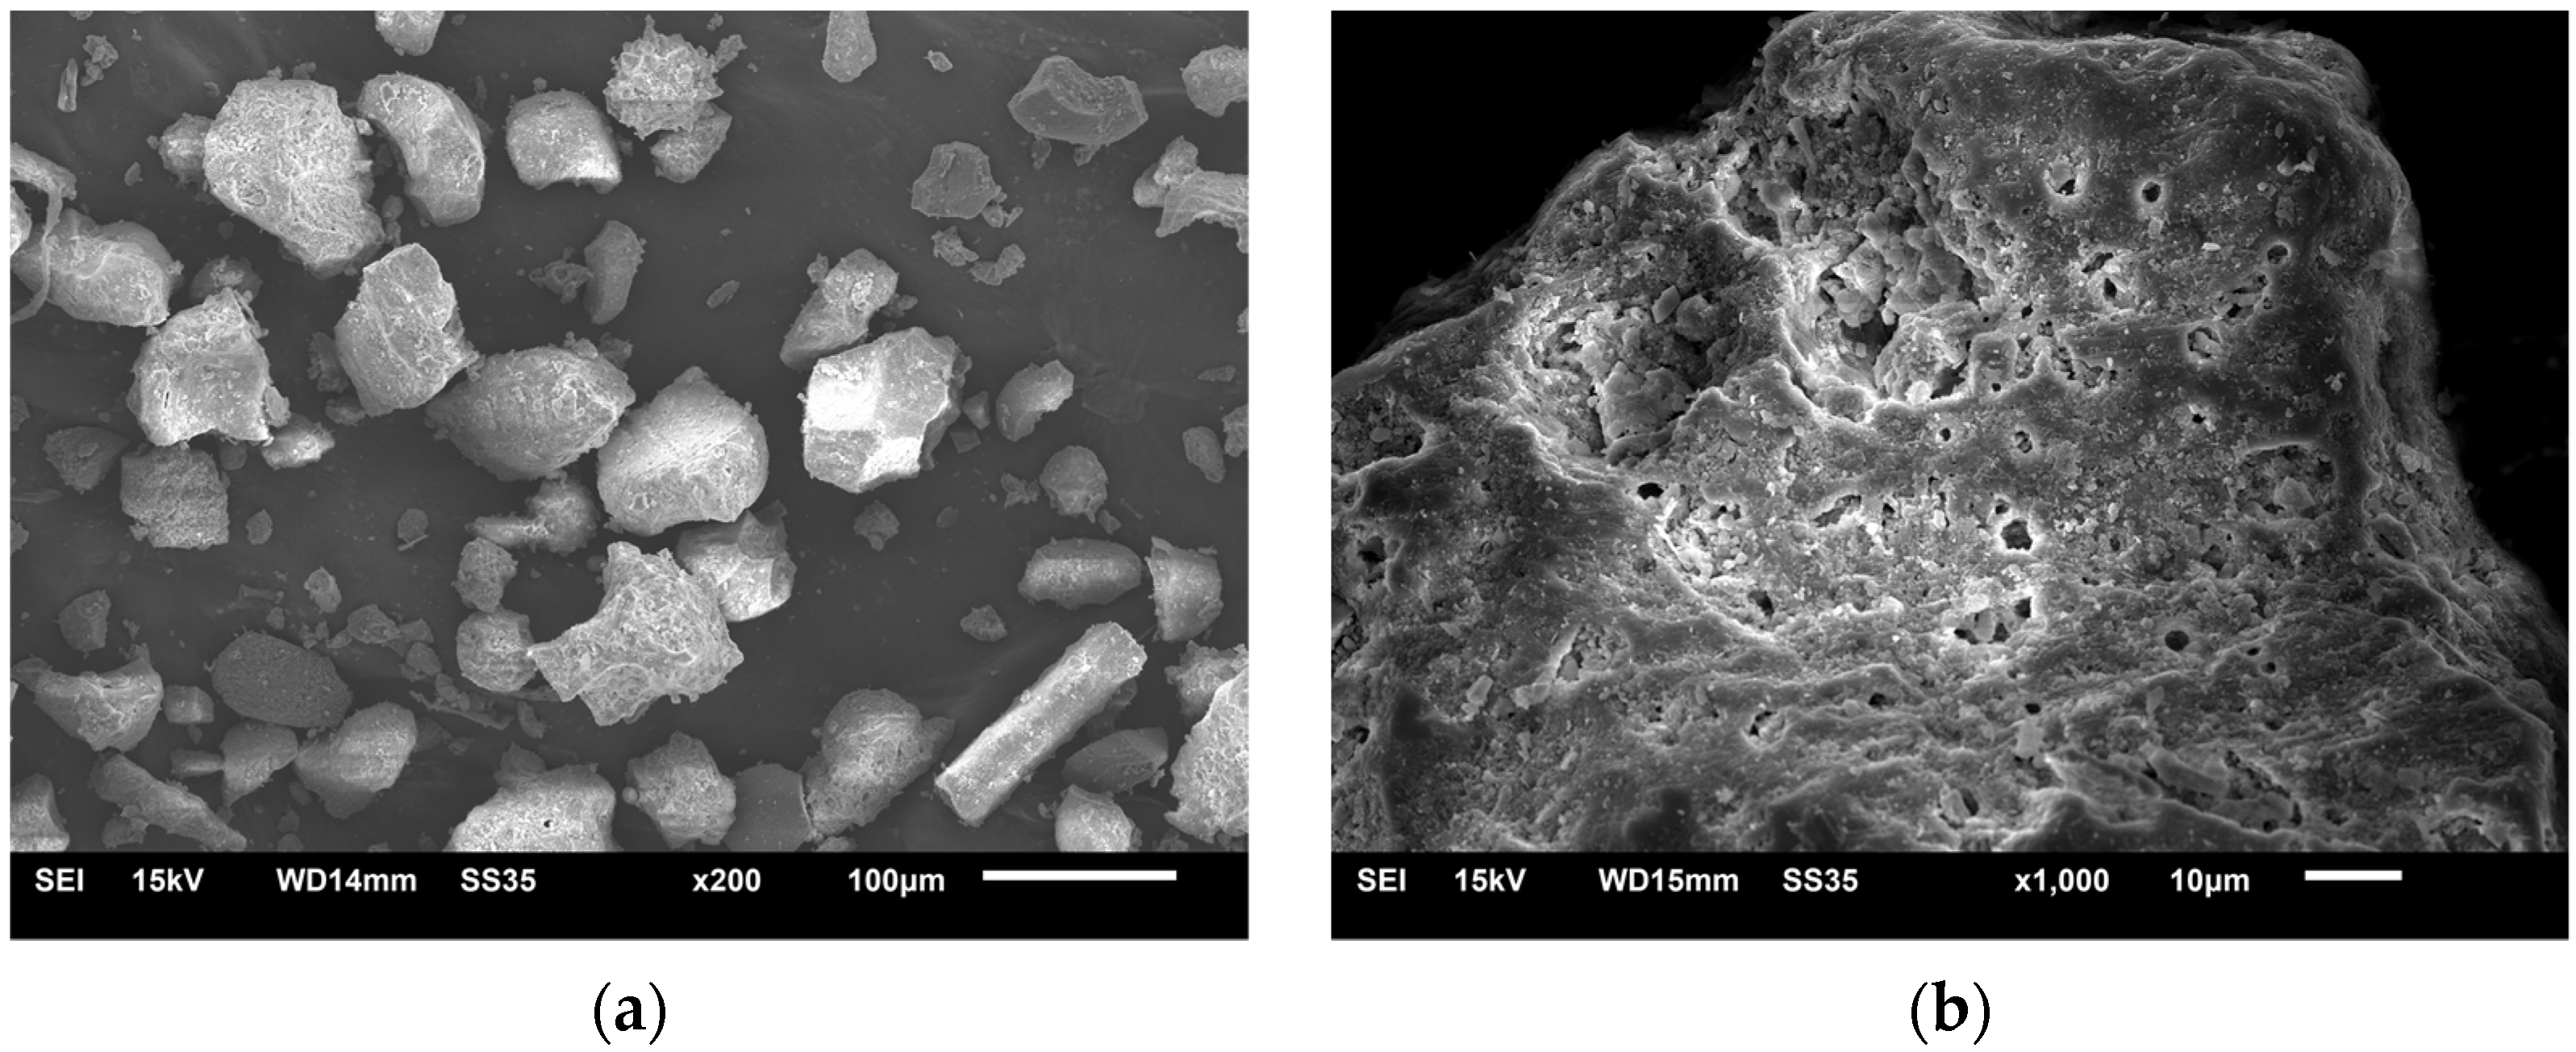
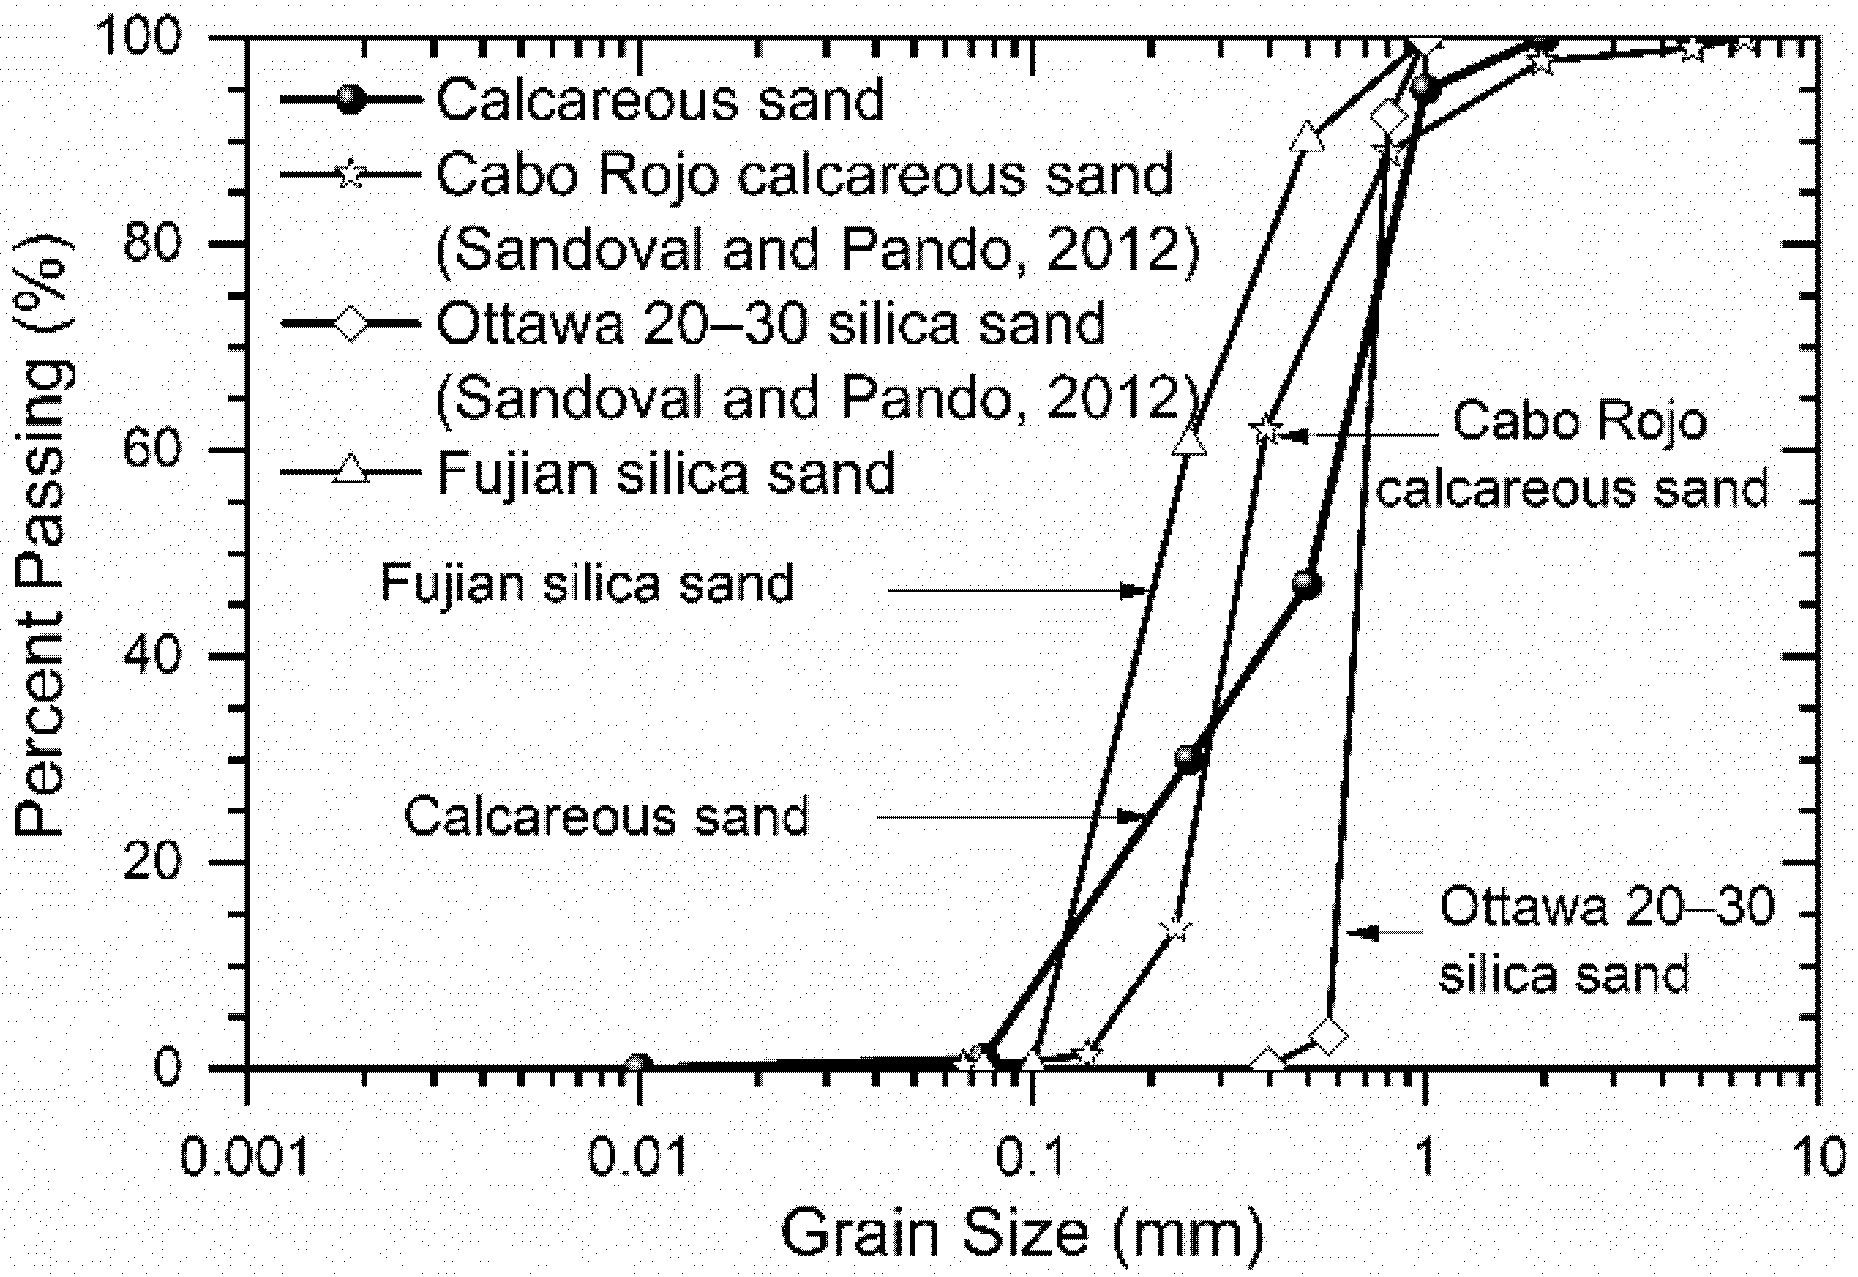
The calcareous sand evaluated in this study was obtained from the South China Sea. As shown in Figure 1, it is white, uncemented, and loose sediment debris. The CaCO3 content in this calcareous sand is 92.67%. The scanning electron micrograph of the calcareous sand with subangular to angular grains is shown in Figure 2a. The Figure 2b indicates that numerous small pores are distributed on the particle surface. The particle size distributions of the tested calcareous sand and other calcareous and siliceous sands are presented in Figure 3. The coefficient of uniformity, Cu; coefficient of curvature, Cc; and median grain diameter, D50, are 4.91, 0.76, and 0.53 mm, respectively, which indicate that the particle gradation of the calcareous sand is poor. The specific gravity is 2.82, and the maximum and minimum void ratios are 1.45 and 0.81, respectively. Compared with other calcareous sand (Table 1), the calcareous sand tested for this paper has a larger particle size and lower porosity. Table 1 also compares the grain characteristics of common siliceous sands, including Ottawa 20–30 and Fujian sand (Figure 3). Fujian sand is a kind of pure silica sand with subrounded shapes and is commonly available in China [22,23]. The program also included specimens of Fujian silica sand tested in similar conditions for comparison purposes.

2.2. Specimen Preparation

Reconstituted calcareous sand specimens were prepared in this experimental investigation. The water sedimentation method was conducted to prepare specimens with the relative densities of 30%, 45%, and 60%. All of the triaxial specimens were 50 mm in diameter and 100 mm in height. The back pressure saturation was conducted under an effective stress of approximately 10 kPa. A back pressure of 400 kPa was applied to reach a B value greater than 0.95.

2.3. Testing Program

A series of undrained cyclic triaxial tests was conducted by the GDS dynamic triaxial equipment (DYNTTS). The loading function was sinusoidal wave, and the frequency of the cyclic loading was 1.0 Hz. All of the cyclic triaxial tests were performed under isotropic conditions. The three main variables investigated were the relative density of specimens, Dr; effective confining pressure, σ c ' ; and the cyclic stress ratio, CSR = σ d / 2 σ c ' , where σ d = the cyclic deviatoric stress. Table 2 presents the Dr, σ c ' , and CSR investigated for each specimen of calcareous and siliceous sand, denoted using CS and SS, respectively.

3. Results

3.1. Undrained Cyclic Response

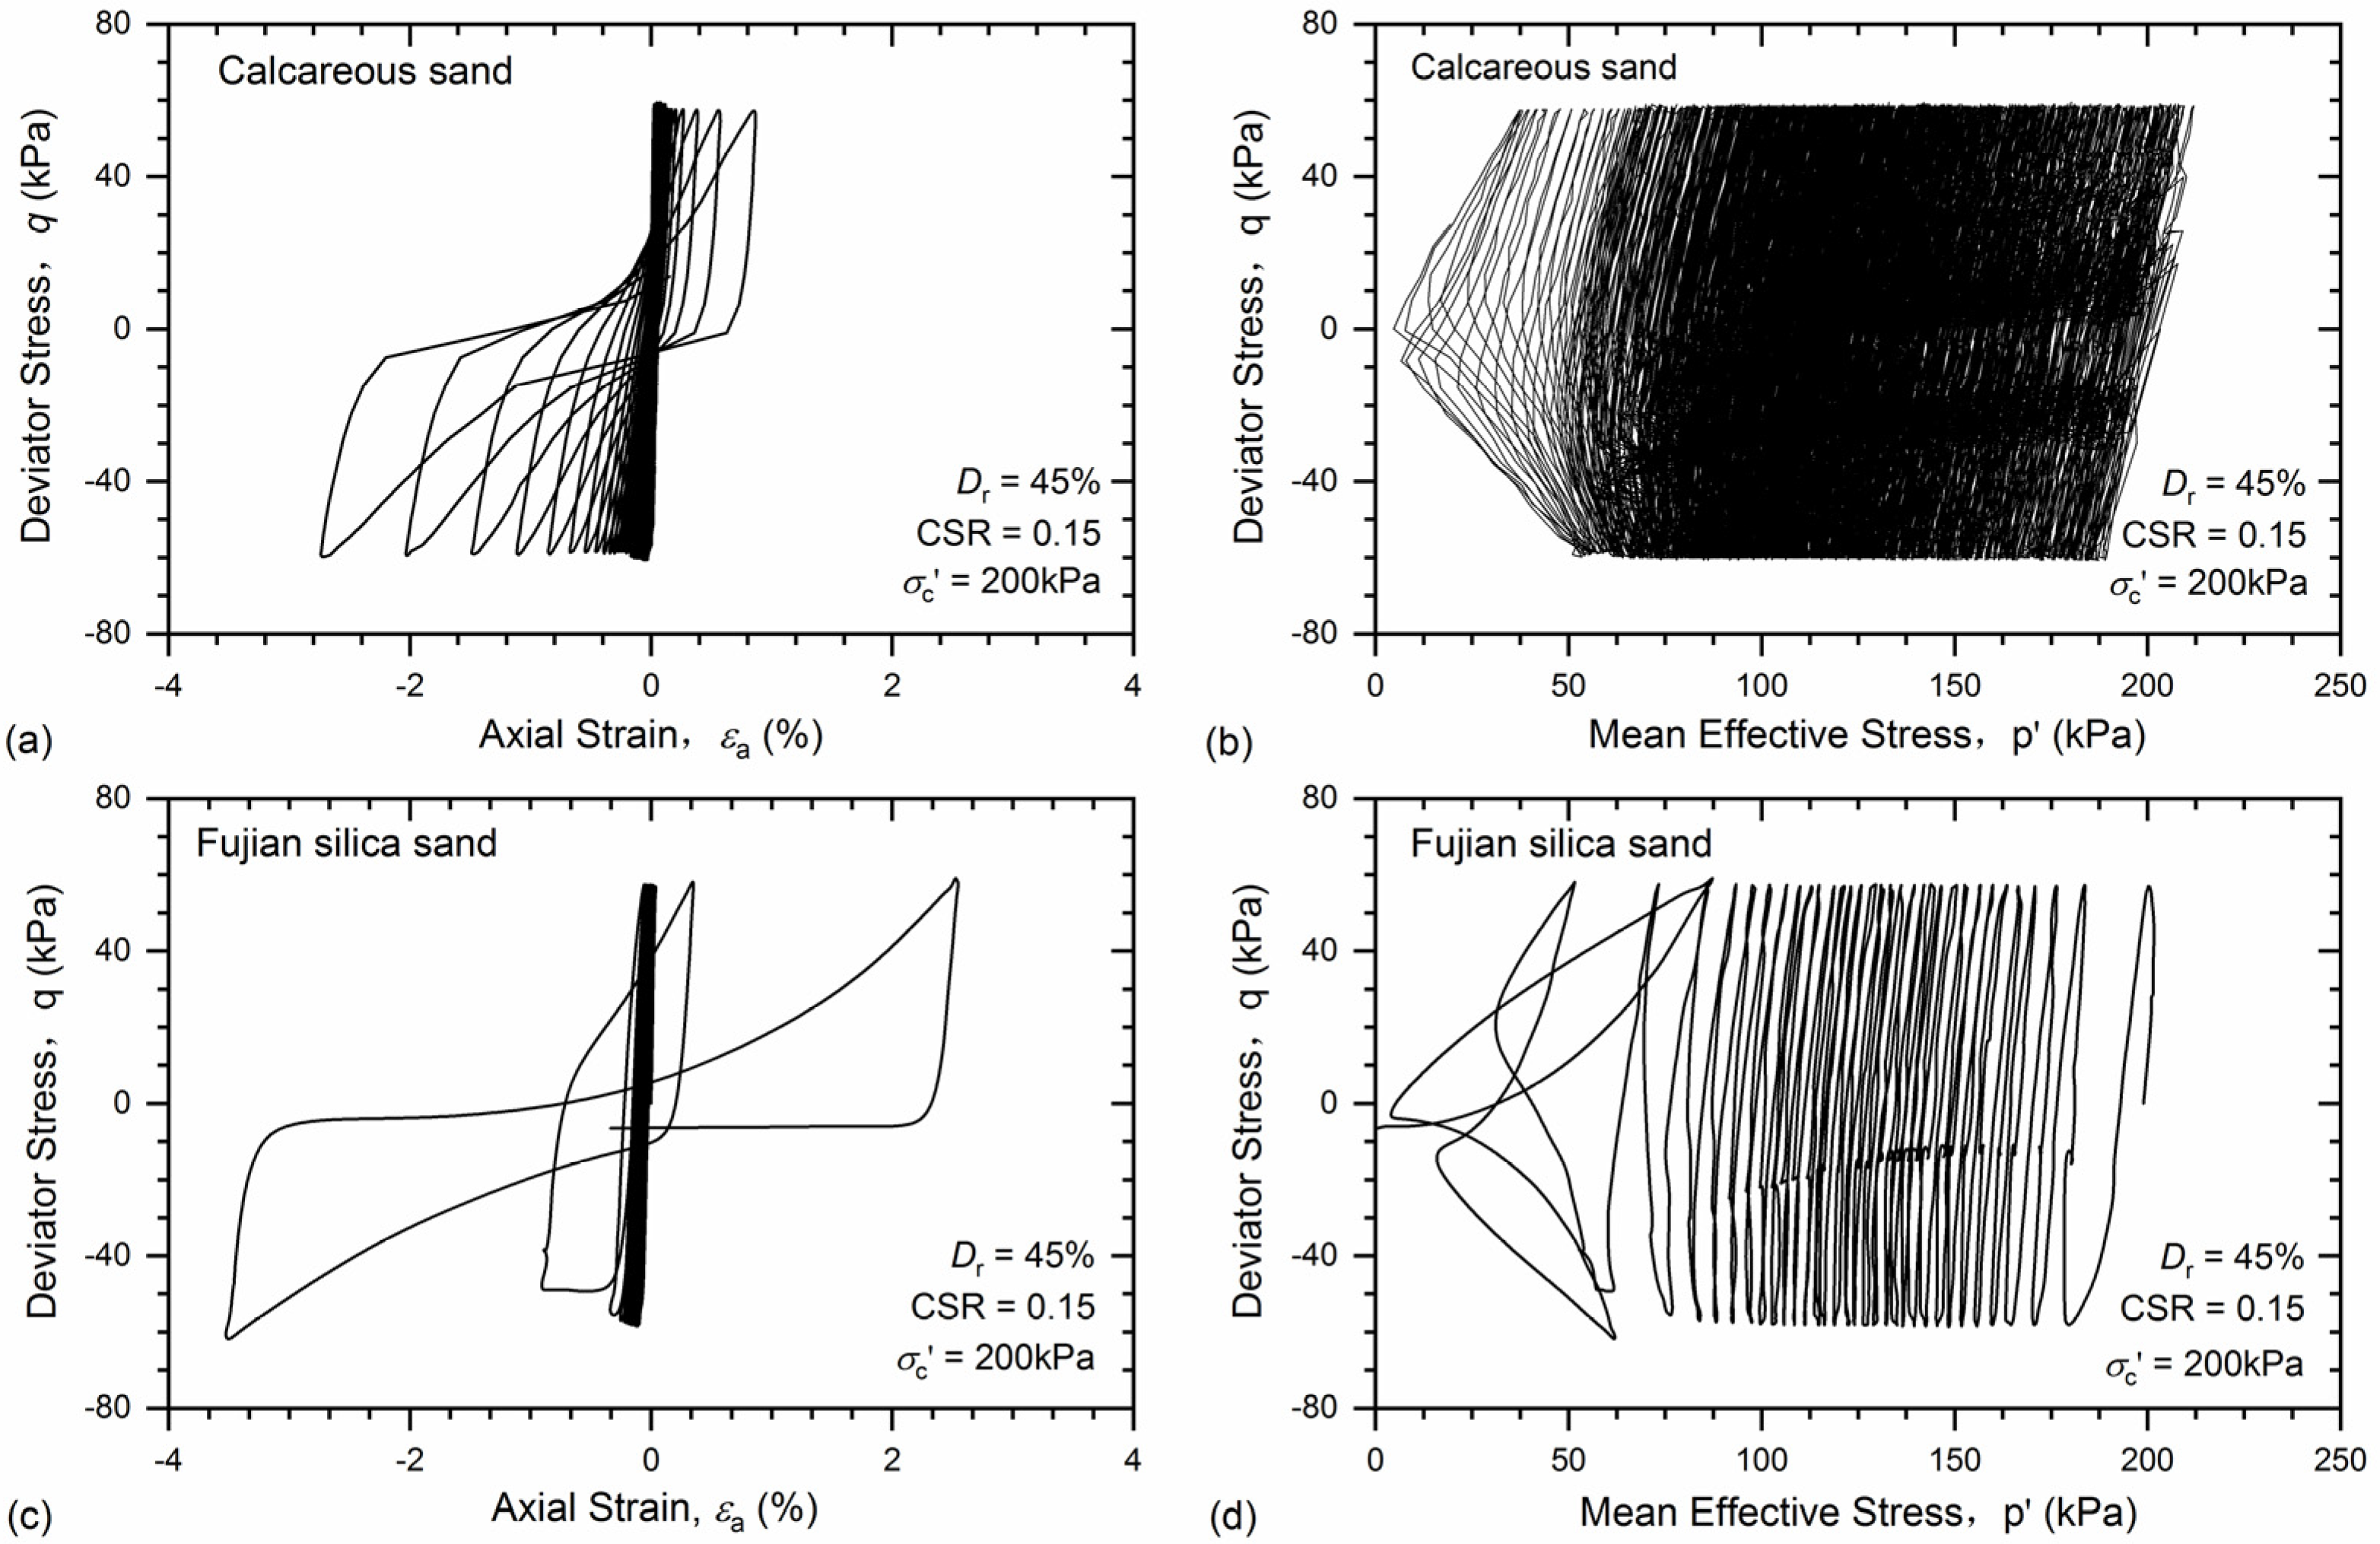
Figure 4 shows the undrained behavior of the calcareous sand and Fujian silica sand at a relative density of 45% under the same CSR = 0.15 with effective confining pressure of σ c ' = 200 kPa. As shown in Figure 4a,b, it can be observed that the stress–strain response of the calcareous sand was not symmetrical; the strain in the extension side was larger than in the compression side. The cyclic axial strain increases at a steady rate to large values when the stress path cycles through zero–p′ conditions. For Fujian silica sand, the strain amplitude was very small initially, and then accelerated rapidly to amplitudes in excess of 5% as the effective mean principal stress cycled through zero, as shown in Figure 4c,d.

3.2. Development of Excess Pore Pressure

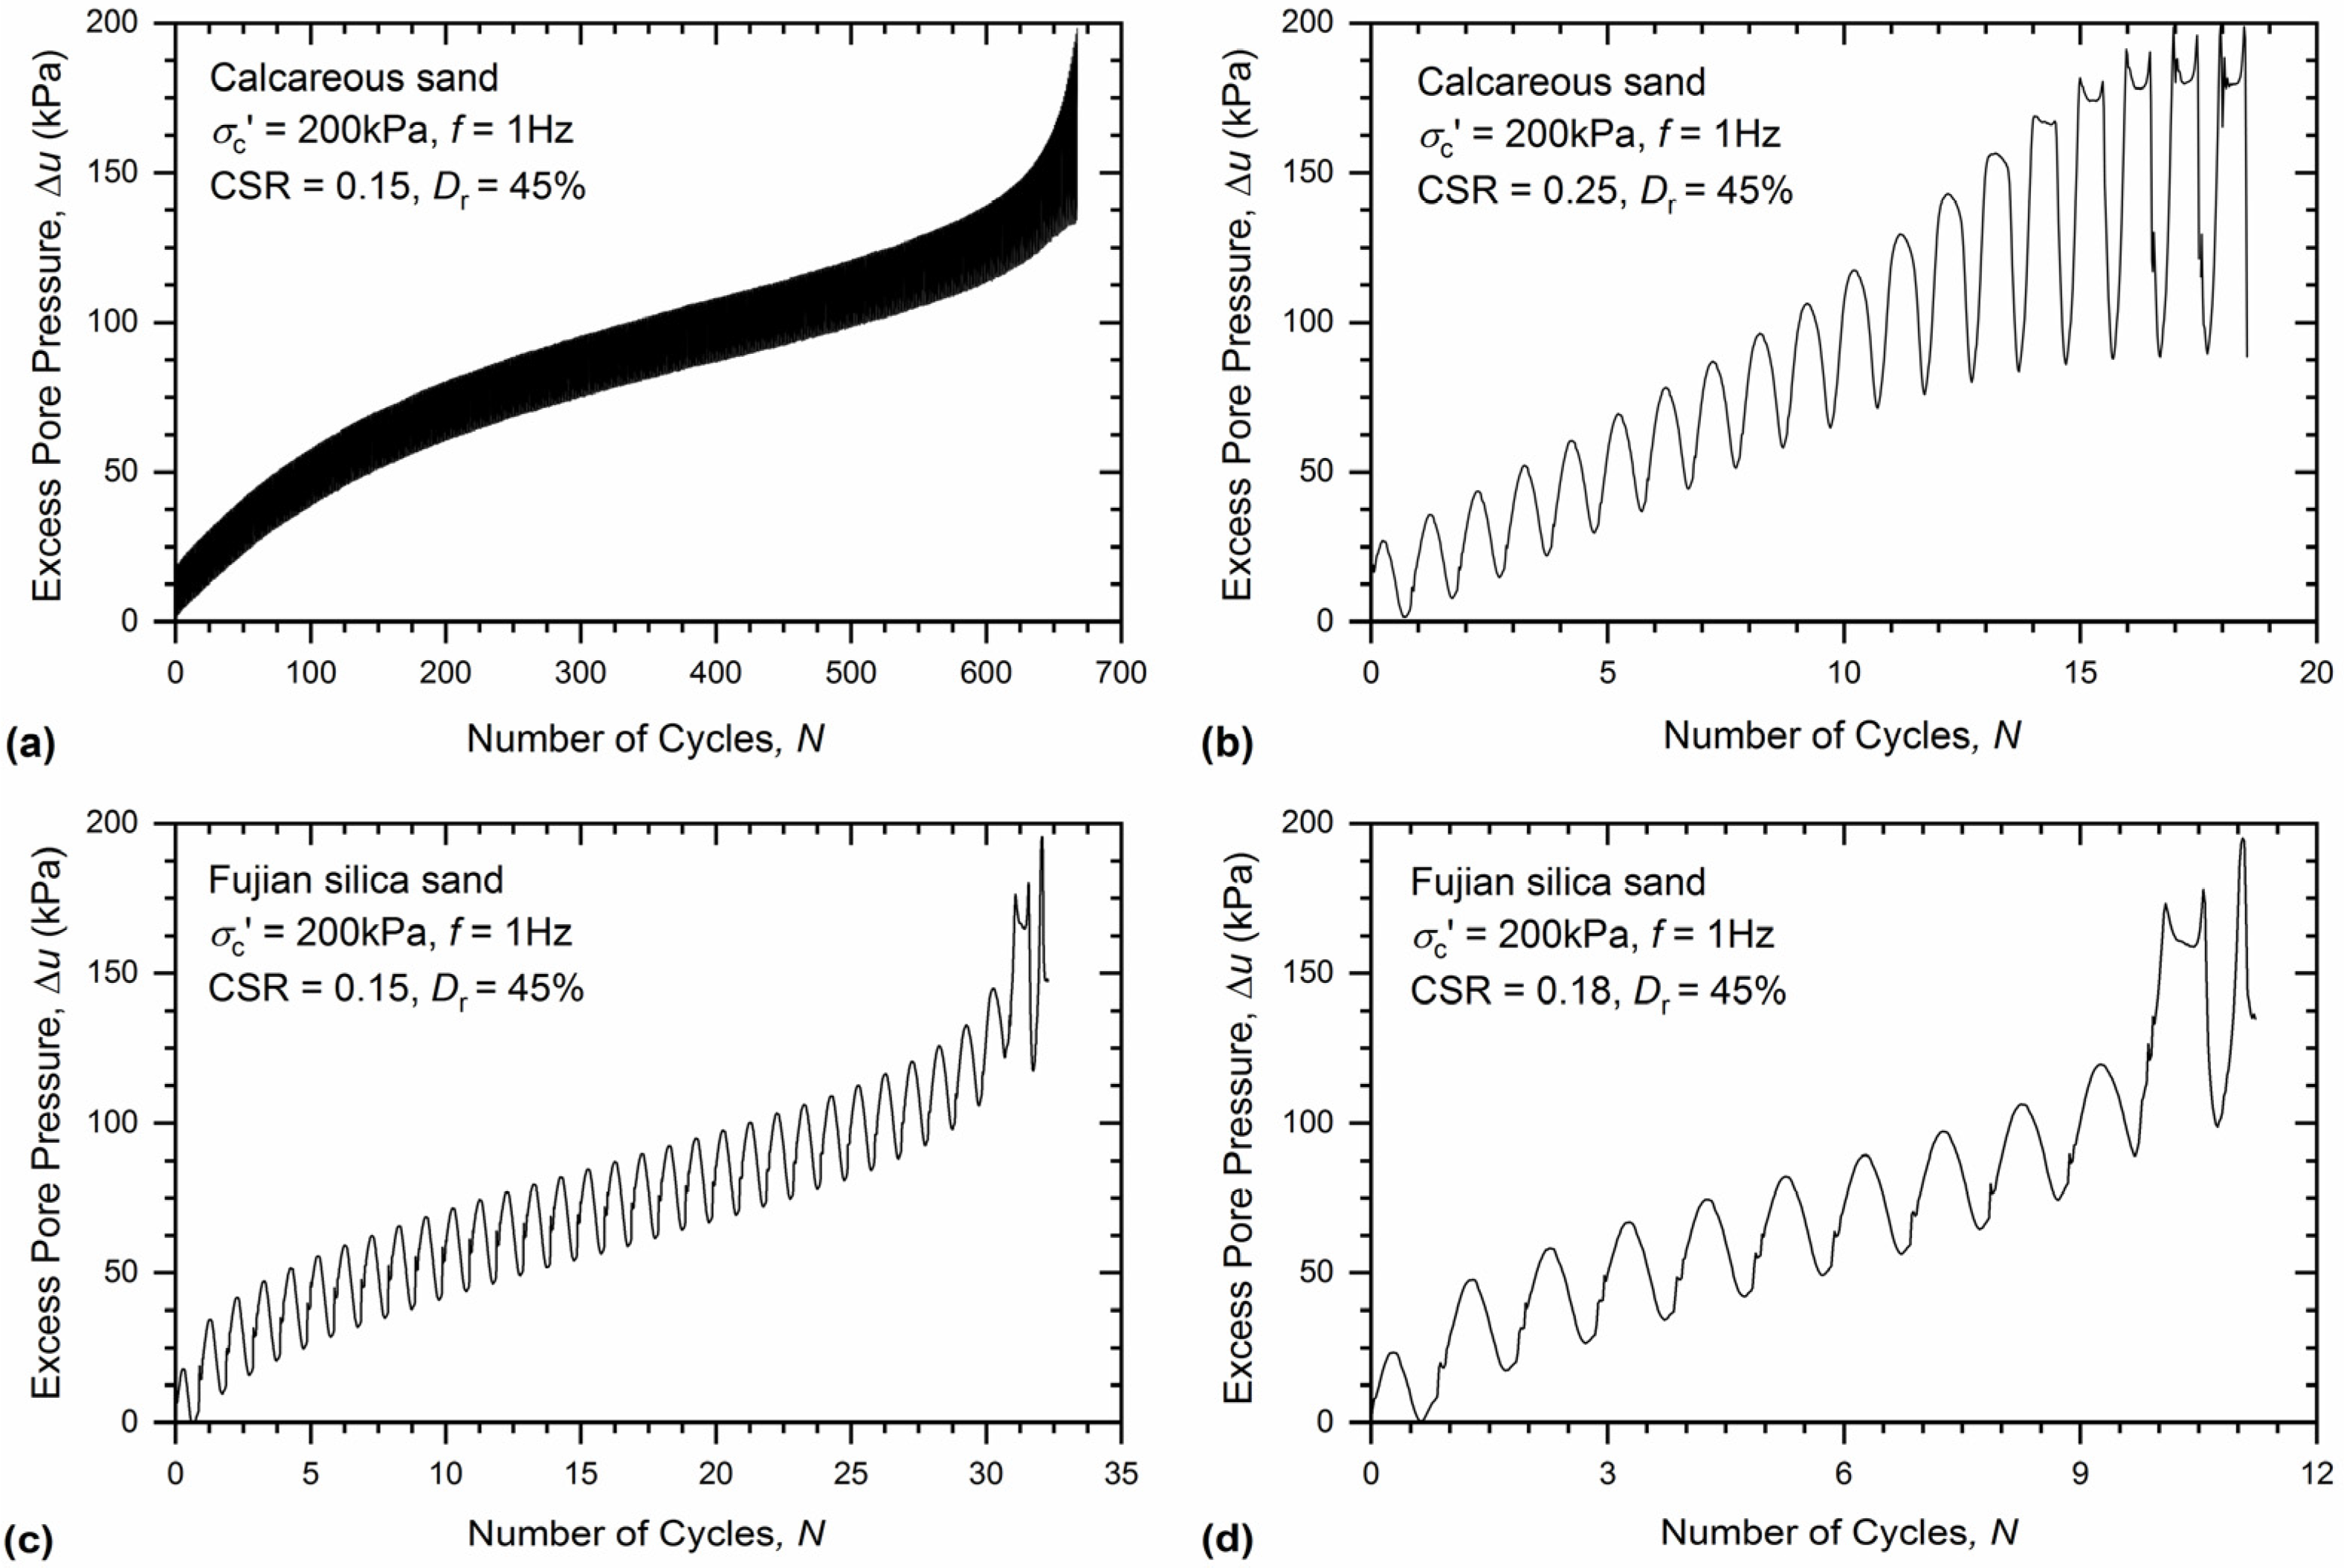
During cyclic loading, the liquefaction of sand occurs when excess pore pressure increases to the initial effective confining pressure. The development of excess pore pressure of the calcareous sand and Fujian silica sand during cyclic loading is presented in Figure 5. All of the specimens were consolidated at an effective confining pressure of 200 kPa with a relative density of 45%. As shown in Figure 5a, the calcareous sand specimen was loaded with a CSR of 0.15. The development of excess pore pressure showed a significant increase at the beginning and then a slower rate of accumulation until it approached the effective confining pressure, and the excess pore pressure increased significantly, thus reaching liquefaction at cycle number 670. The behavior of the calcareous sand specimen with a CSR of 0.25 showed a gradual increase in the excess pore pressure until it reached the effective confining pressure, reaching liquefaction at cycle number 18 (Figure 5b). For Fujian silica sand with a CSR of 0.15 (Figure 5c), the specimen was liquefied at 32 cycles (i.e., NL = 32). In comparison, the calcareous sand did not liquefy until NL = 670 (Figure 5a). This indicates that the calcareous sand has stronger liquefaction resistance than Fujian silica sand under the same cyclic loading conditions. Due to the angular nature of calcareous sand, particles show a more stable interlocking, which is considered to be liquefaction resistant. Figure 5d shows the development of excess pore pressure in Fujian silica sand with a CSR of 0.18, for which the cycle number that caused liquefaction is close to that of the calcareous sand with a CSR of 0.25 (Figure 5b). The excess pore pressure of Fujian silica sand increased slowly at the early stage. After cycle number 9, the excess pore pressure increased rapidly until it reached liquefaction at cycle number 11. Figure 5b,d illustrates differences regarding excess pore pressure development between the calcareous sand and Fujian silica sand. The calcareous sand had greater fluctuations of excess pore pressures than Fujian silica sand during cyclic loading. The large fluctuations of the calcareous sand may be due to particle rearrangement arising from the behaviors concerning contact areas between particles, including irregular shape, rough surface, and intraparticle voids. The excess pore pressure development of the calcareous sand was similar to that reported by Salem et al. [14] for calcareous sand from the north coast of Egypt.
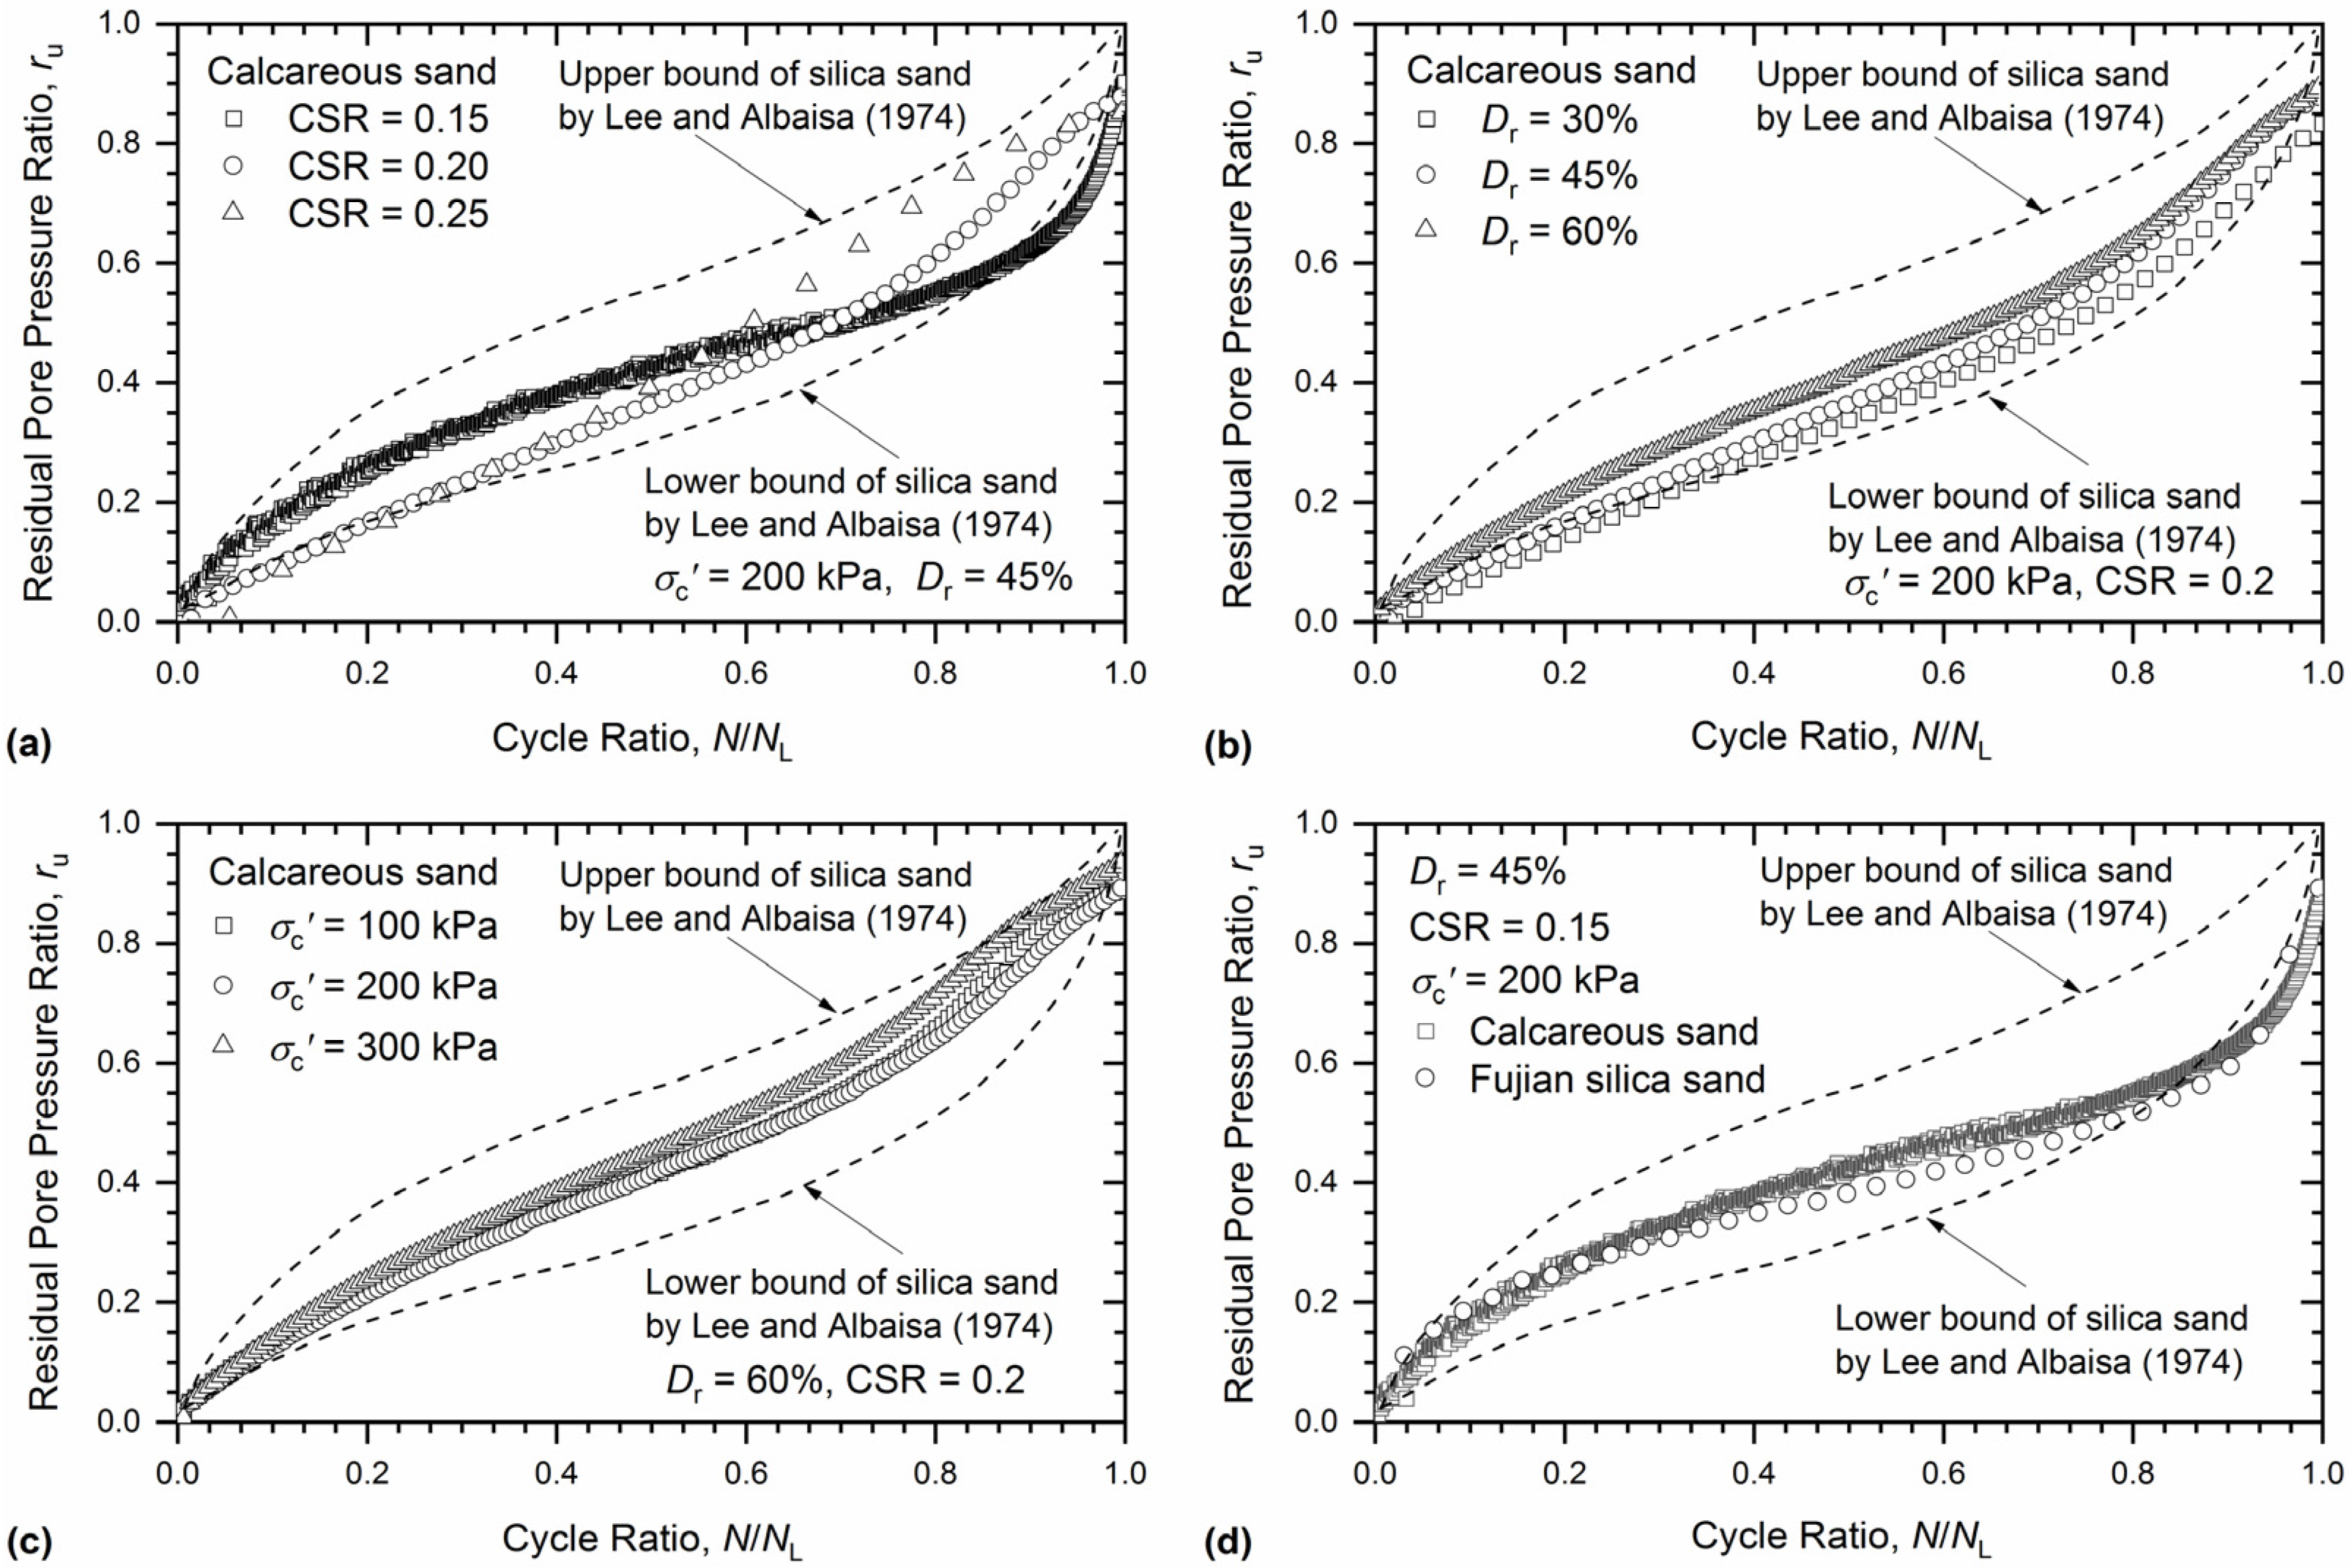
In stress-controlled cyclic triaxial tests, the residual excess pore pressures are those present when the deviator stress is zero during each cycle [24,25]. Figure 6 presents the residual pore pressure ratio (which is defined as the ratio of the residual excess pore pressure to the effective confining pressure, ru) versus the cycle ratio (which is the ratio of the number of loading cycles (N) to the number of cycles required to cause liquefaction (NL)). As may be observed from Figure 6, all of the residual pore pressure development curves of the calcareous sand fell within the band of silica sand proposed by Lee and Albaisa [26]. Effective confining pressure had little influence on the pore pressure development, while the effect of CSR was profound. Due to a higher excess pore pressure development rate, the curves for the larger relative density calcareous sand were shifted upwards. The calcareous sand when cyclic loaded in the same conditions had a residual pore pressure generation curve that was similar to those for Fujian silica sand. However, the calcareous sand did not liquefy as easily as silica sand under cyclic loading.

3.3. Deformation Response

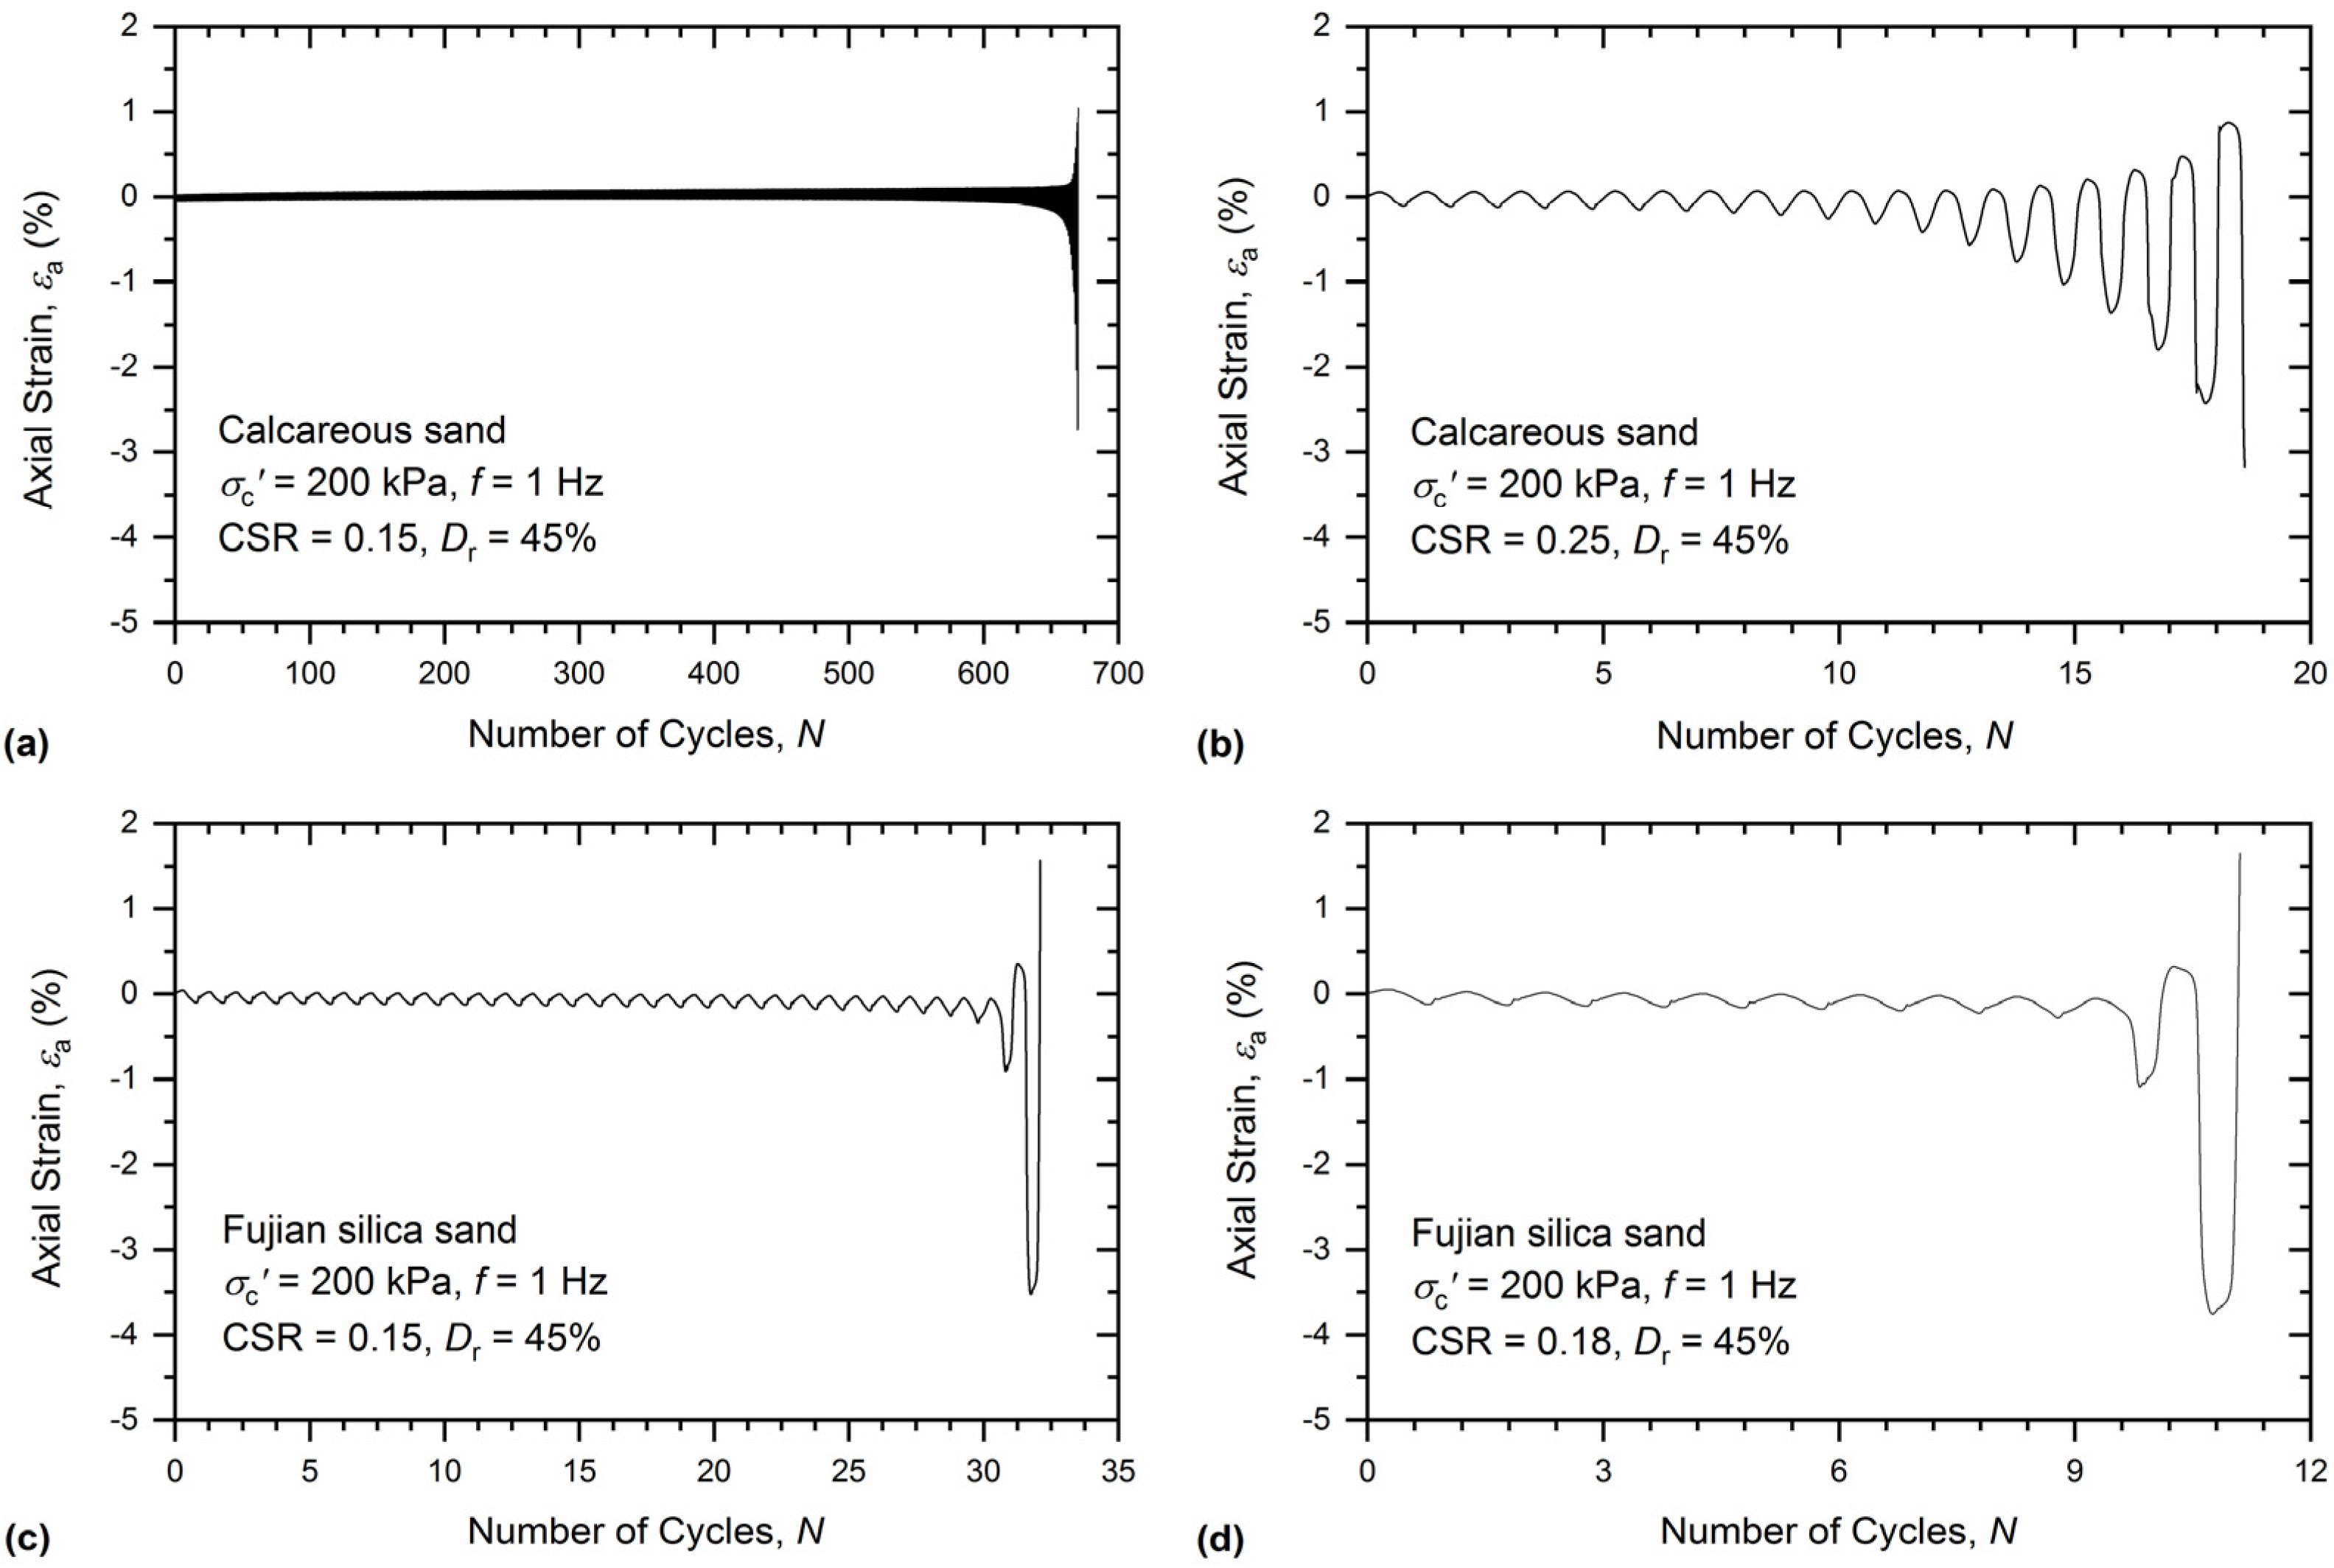
Figure 7 shows the axial strain curve of the calcareous sand and Fujian silica sand. As shown in Figure 7a,b, the initial axial strains of the calcareous sand were small and then experienced a gradual accumulation until liquefaction. In contrast, the axial strain response of Fujian silica sand shown in Figure 7c,d is significantly different to that of the calcareous sand. The axial strain of Fujian silica sand was smaller than that of the calcareous sand and experienced a stabilization strain until a sudden enlargement in liquefaction. For example, the axial strain of the calcareous sand was −1.03% at N = 15, and increased to −2.42% by NL = 18 (Figure 7b). However, for Fujian silica sand, the amplitude axial strain was only −0.28% at N = 9, and achieved liquefaction at −3.75% by NL = 11 (Figure 7d). When approaching the liquefaction state, an increase in accumulated axial strain can be attributed to large soil stiffness losses as the effective stress decreases. Particle characteristic is an important reason for the difference between the calcareous sand and Fujian silica sand in the development and accumulation of axial strain.
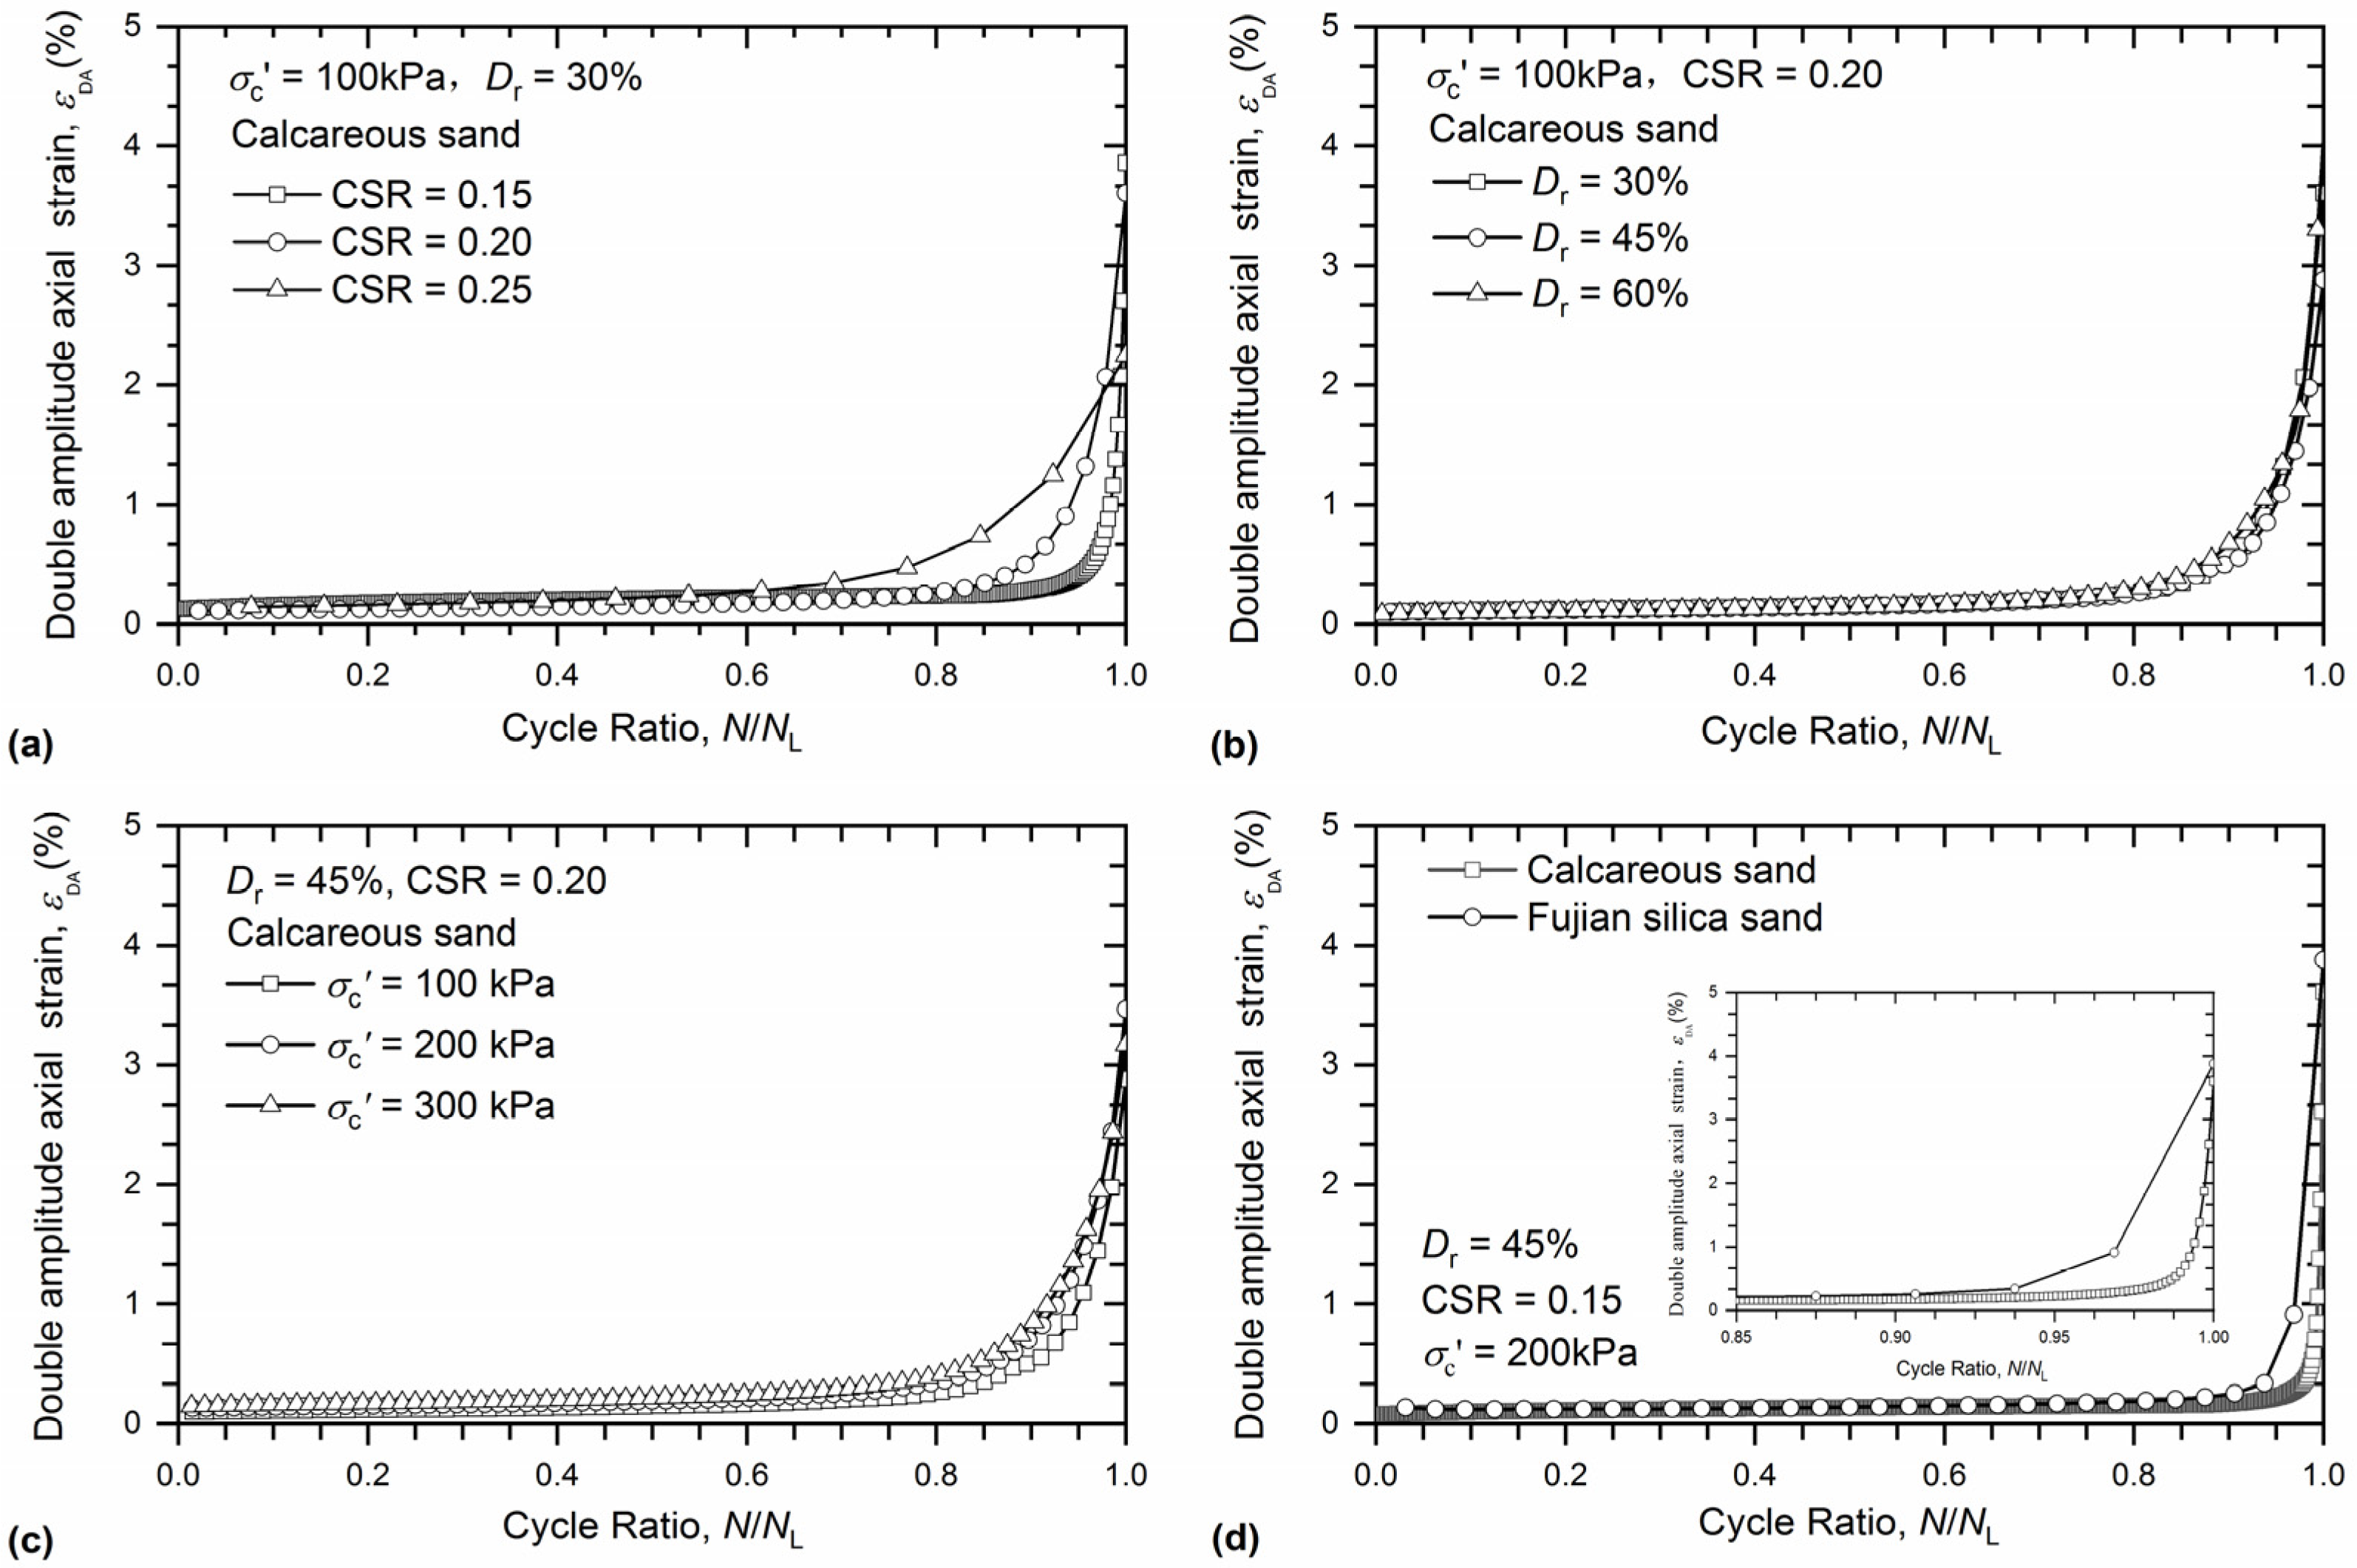
Figure 8 shows the double amplitude axial strain at each cycle of loading versus the cycle ratio. Figure 8a shows the results of the calcareous sand with the same relative density (Dr = 30%) and the same effective confining pressure ( σ c ' = 100 kPa), and under different levels of CSR. As shown in Figure 8a, the strain developed on the calcareous sand was slow initially, and then the strain development rate increased. The calcareous sand specimens with CSR of 0.15, 0.20, and 0.25 started to increase strain when the cycle ratio was more than 0.9, 0.8, and 0.6, respectively. Figure 8b,c shows that the strain development patterns of the calcareous sand were similar, regardless of effective confining pressure or relative density. Figure 8d compares the deformation behavior of the calcareous sand and Fujian silica sand with the same Dr = 45% and σ c ' = 200 kPa and a CSR of 0.15. The double amplitude axial strains of the calcareous sand and Fujian silica sand at the beginning of cyclic loading were negligible. The difference is that the strain of calcareous sand increased gradually as soon as the cycle ratio reached 0.98, while the strain of Fujian silica sand increased rapidly until the cycle ratio reached 0.94.

3.4. Shear Modulus

During cyclic loading, the variation of stiffness is characterized by the loop stiffness (G), which was determined by connecting the end points of a loop as described by Hardin and Drnevich [27]. The G for each cycle is given in Figure 9. G clearly decreased during cycle loading when the cycle number increased, due to the increase in pore pressures, and the samples began to liquefy. The degradation rate and initial shear modulus of the calcareous sand are related to the cyclic loading conditions. The initial shear modulus depends on the relative density and effective confining pressure. In general, the initial shear modulus of the calcareous sand decreases with decreasing effective confining pressure and relative density (Figure 9b,c). However, CSR has little influence on the initial shear modulus (Figure 9a). The degradation rate of the shear modulus increases with the increasing CSR and the decreasing relative density (Figure 9a,b). The effect of effective confining pressure is not good (Figure 9c). As shown in Figure 9d, the initial shear modulus of silica sand is lower than that of the calcareous sand, and the shear modulus of silica sand drastically decreased during cyclic loading.

3.5. Cyclic Strength

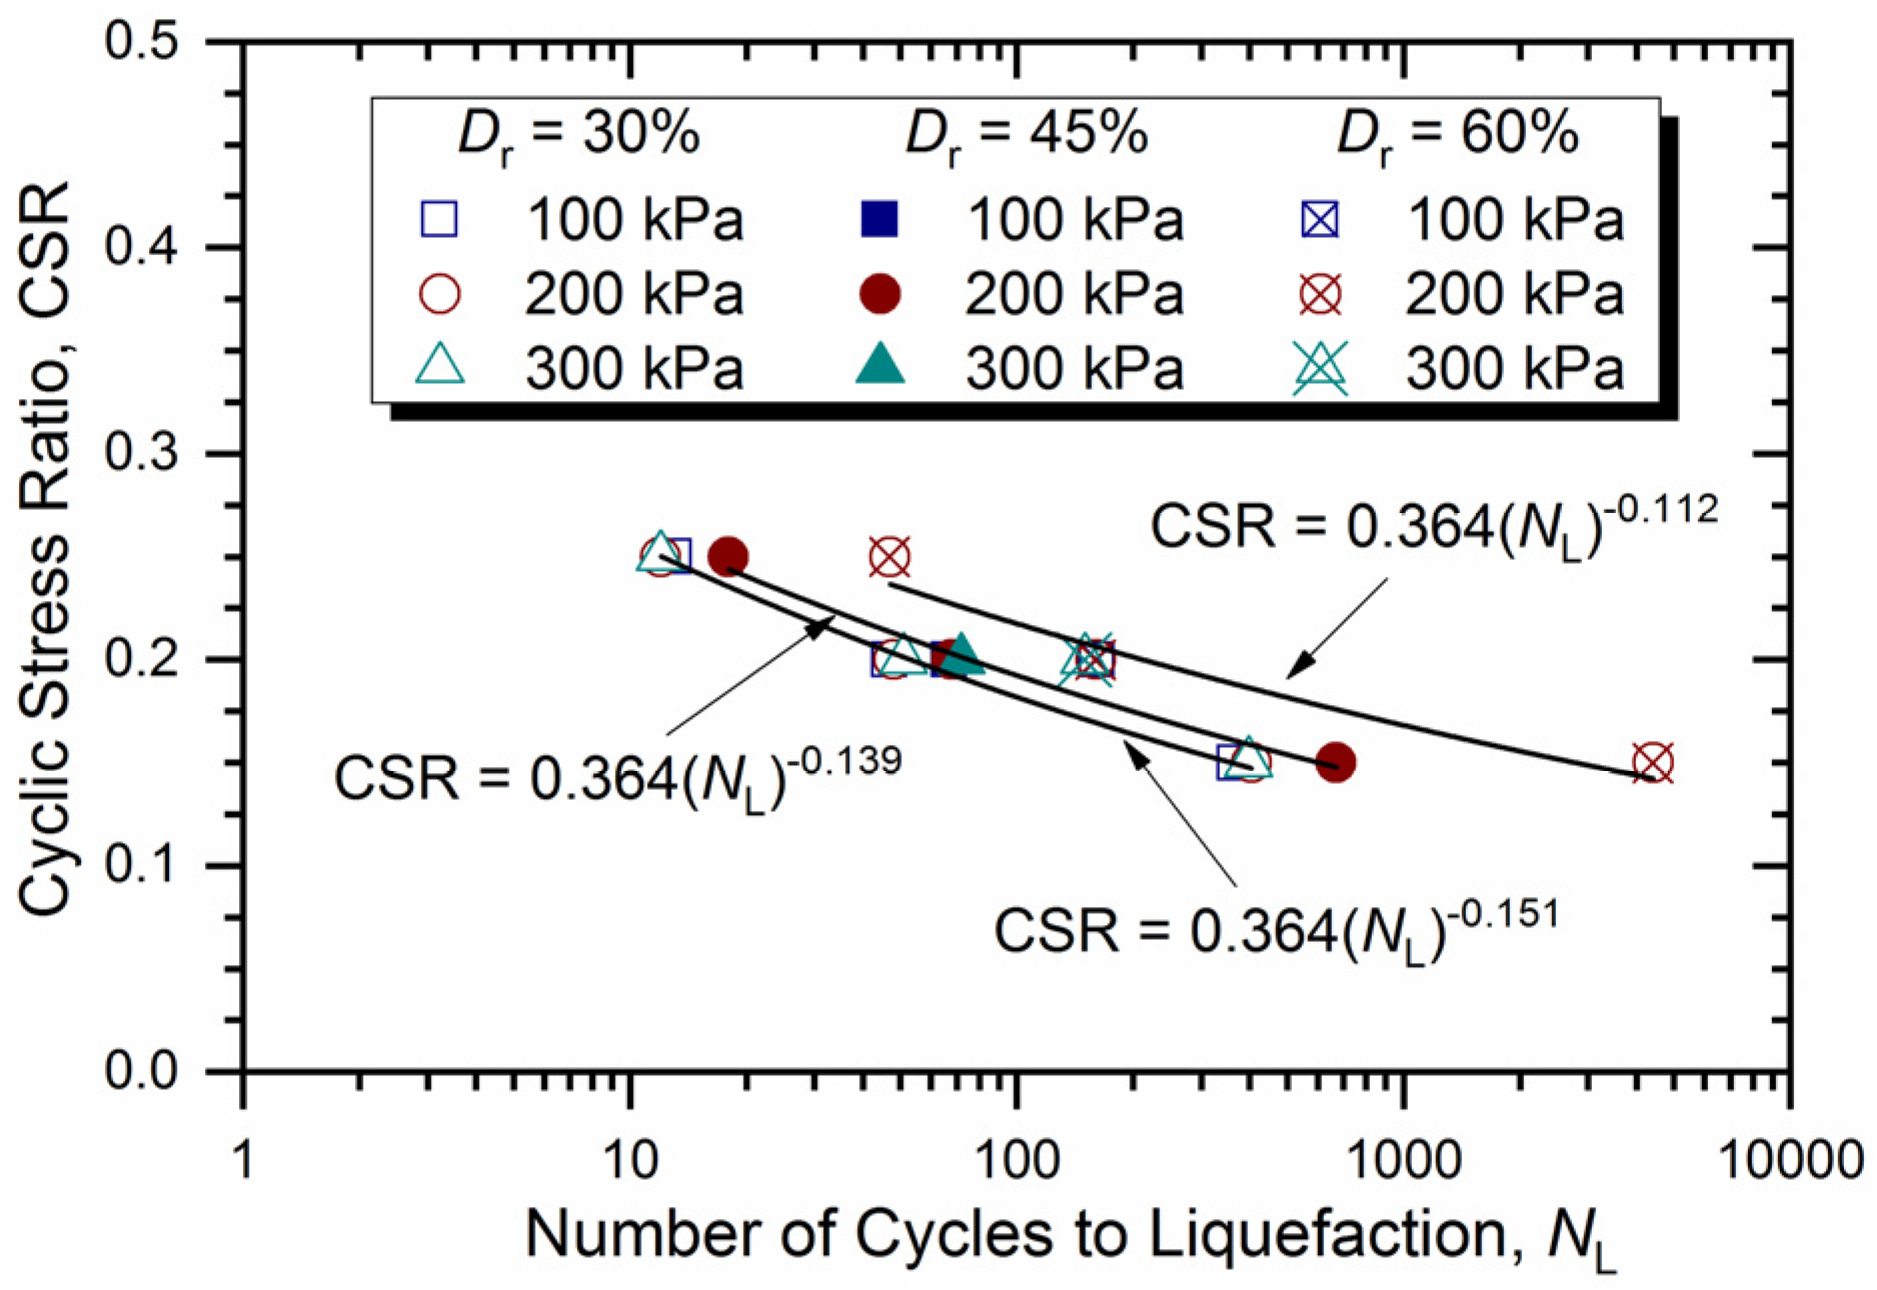
The cyclic strength is defined as the relationship between the cyclic stress ratio (CSR) and the number of cycles required to liquefaction (NL). The cyclic strength curves of calcareous sand under different relative densities and effective confining pressures are presented in Figure 10. The results show that the number of cycles to liquefaction decreased as CSR increased for calcareous sand. The higher the relative density, the larger the number of cycles to liquefaction. Similar trends have been found in other calcareous sands [11,13,14]. The results also showed that the effective confining pressure has little effect on the calcareous sand for relative densities ranging from 30% to 60%, which differs from the results of previous studies.
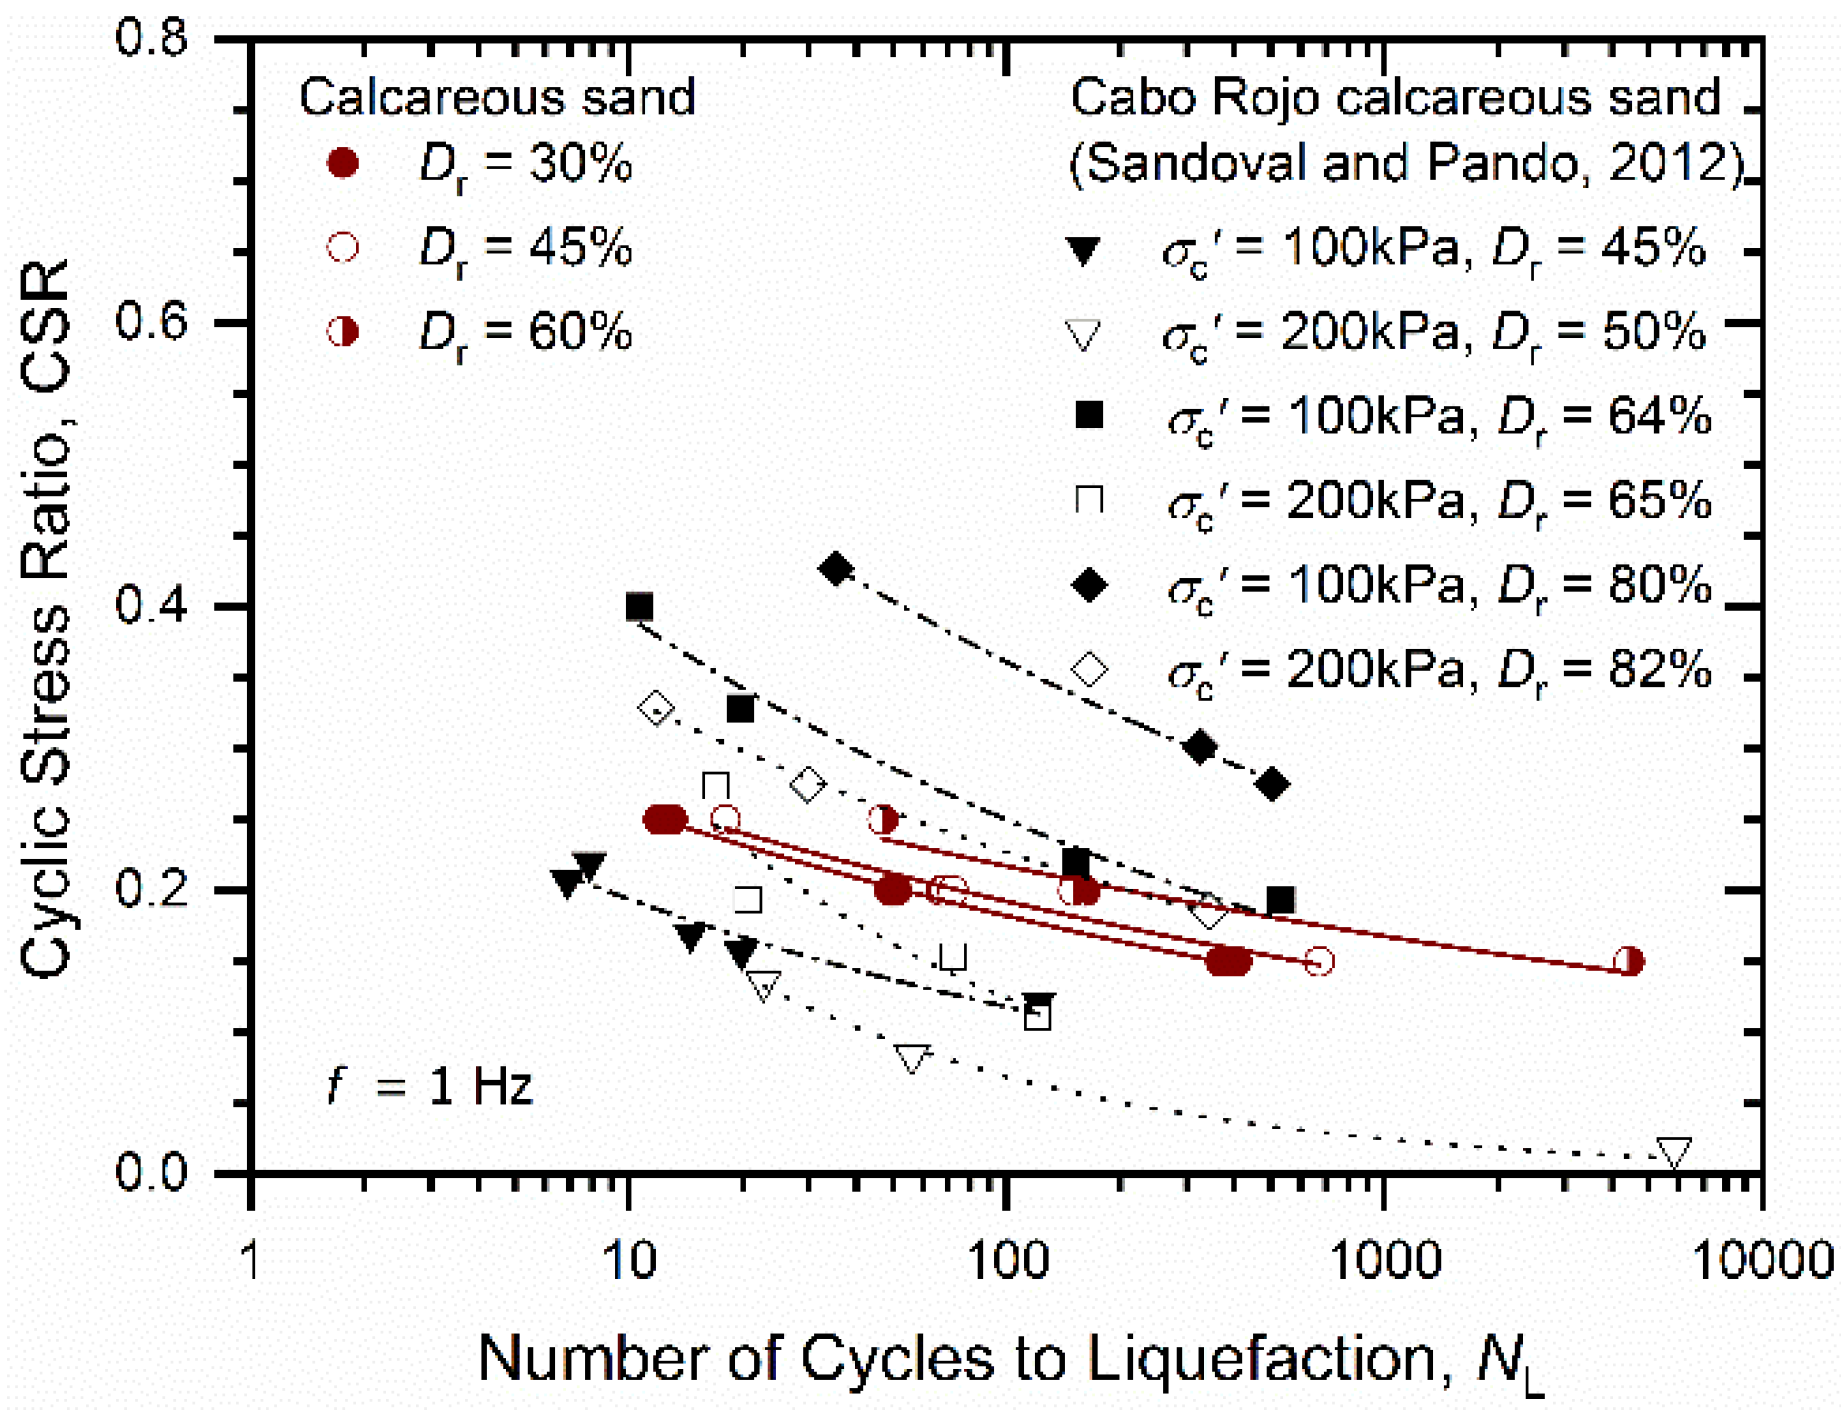
Figure 11 shows data for the calcareous sand at relative densities of 30%, 45%, and 60% over a range of effective confining pressures (100 to 300 kPa), and for comparison purposes, includes the data for Cabo Rojo calcareous sand at relative densities of 45%, 65%, and 80% for effective confining pressures of 100 and 200 kPa [13]. It was shown that all of the cyclic strength of calcareous sand increased with increasing relative densities. The range of the cyclic strength of Cabo Rojo calcareous sand was larger than that of the calcareous sand. The cyclic strength of calcareous sand was greater than that of Cabo Rojo calcareous sand at relative densities of 45%, while the cyclic strength of calcareous sand was slightly less than that of Cabo Rojo calcareous sand at relative densities of 60%. There appeared to be a dependence on confining pressure for Cabo Rojo calcareous sand, with an increase in cyclic strength as the confining pressure decreased, which is similar to the behavior of Dogs Bay calcareous sand [11] and Dabaa calcareous sand [14]. However, there was no confining-pressure effect on the calcareous sand in this range of relative densities. The variations in the locations, compositions, soil structure, intraparticle voids, and particle shape may explain the variation in cyclic strength of calcareous sands from different regions.
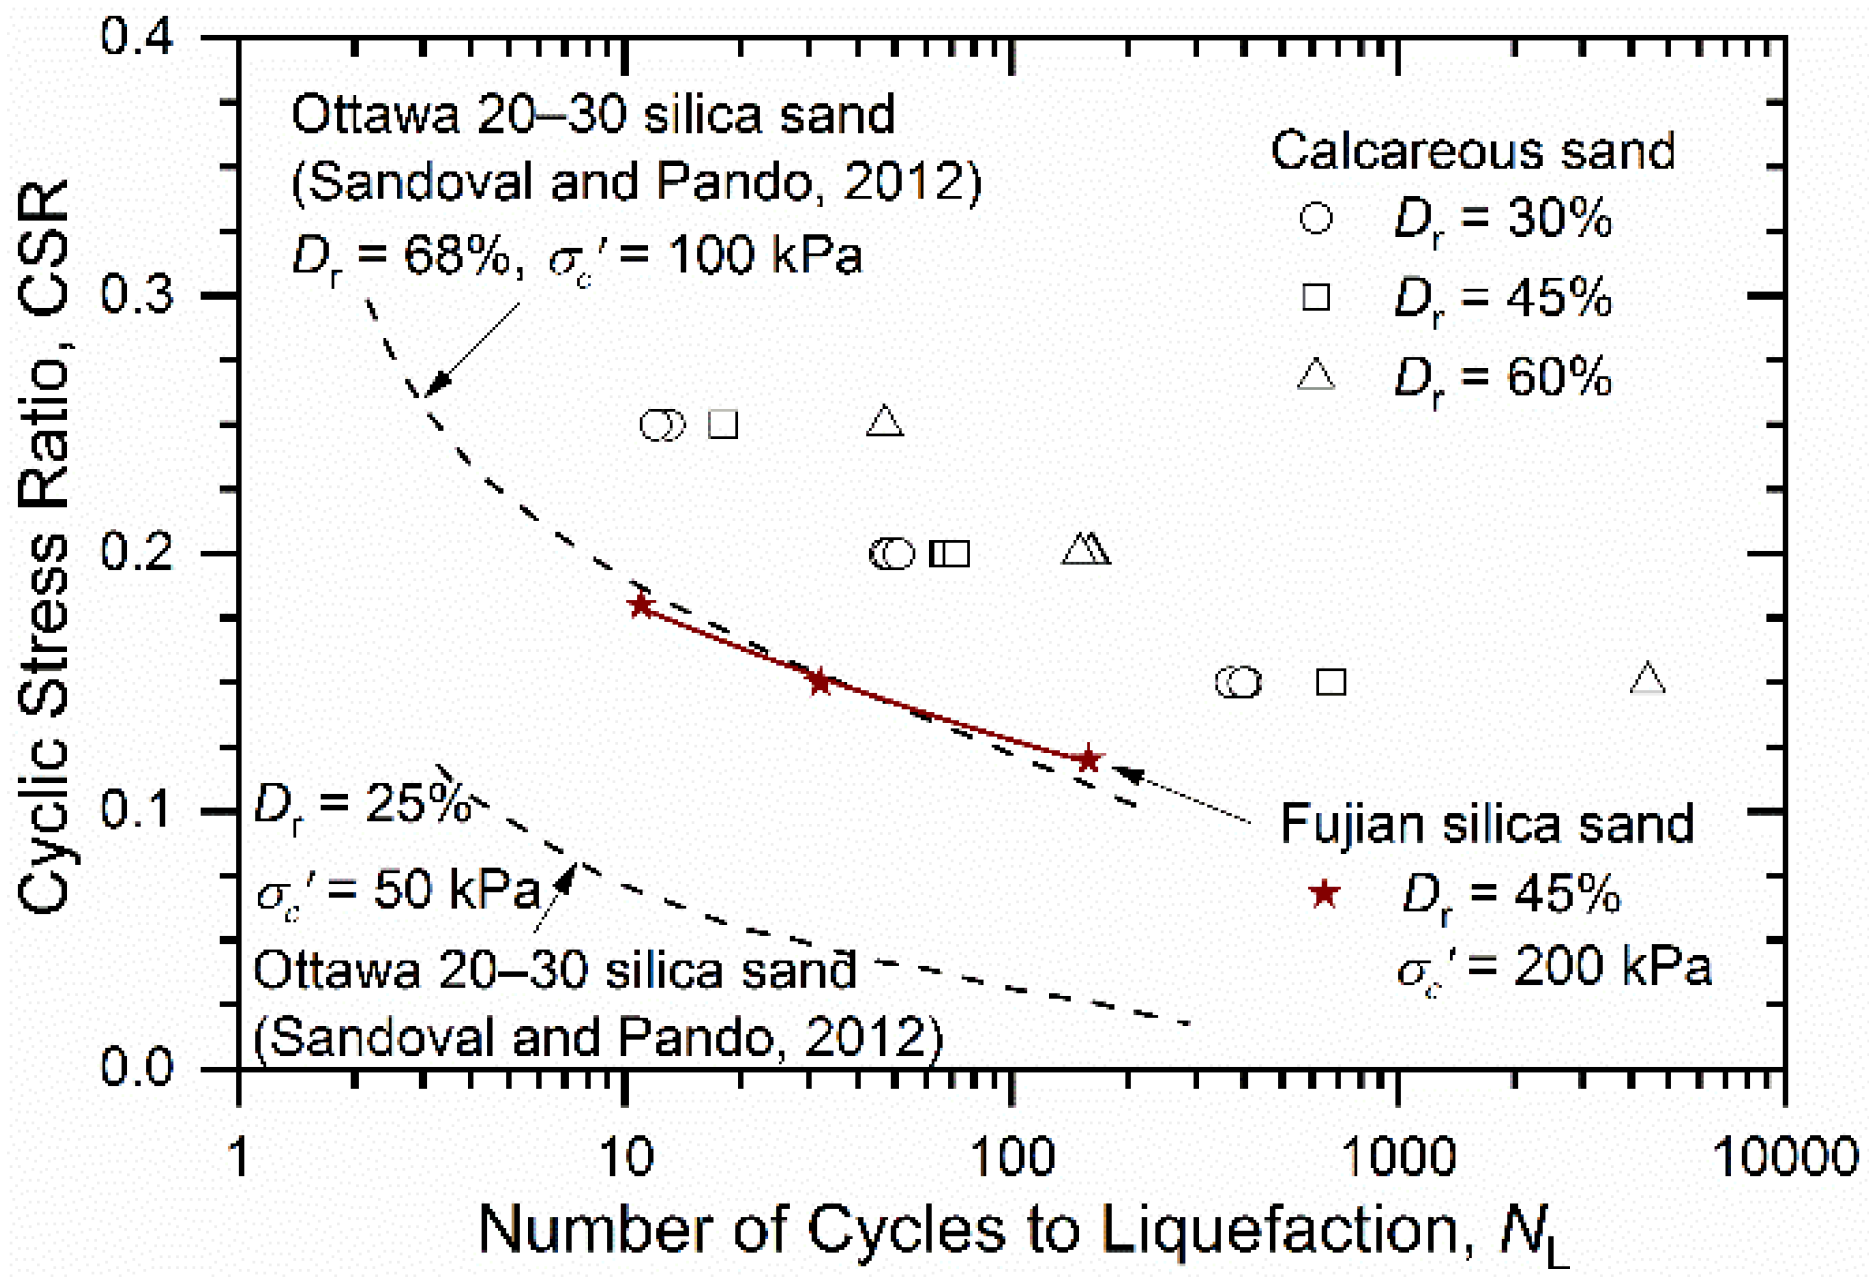
Figure 12 shows data for the calcareous sand at relative densities of 30%, 45%, and 60% over a range of confining pressures (100 to 300 kPa), and for comparison purposes, includes Fujian silica sand at relative densities of 45% and Ottawa 20–30 silica sand at relative densities of 25% and 68% [13]. The calcareous sand showed higher cyclic strength than both Fujian silica sand and Ottawa 20–30 silica sand in this range of relative densities. The higher cyclic strength is due to the angular shape of calcareous sand particles, which has more stable interlocking soil fabric that is resistant to liquefaction.

4. Conclusions

This paper presents the cyclic behavior of the calcareous sand in the South China Sea and highlights the differences between the calcareous sand and Fujian silica sand. The following conclusions can be drawn from the results analyzed in this paper:
(1)
During the cyclic triaxial test, both the excess pore pressure and axial strain of the calcareous sand gradually increased as it reached liquefaction, whereas for Fujian silica sand, a sudden increase in excess pore pressure and axial strain was observed when approaching liquefaction state.
(2)
The calcareous sand had greater liquefaction resistance than Fujian silica sand tested under same cyclic loading conditions. This may be attributed to the angular nature of calcareous sand particles providing more stable interlocking soil fabric that is resistant to liquefaction.
(3)
The CSR had a significant effect on the cyclic behavior of calcareous sand, including excess pore pressure development, deformation response, the degradation rate of the shear modulus, and cyclic strength. However, there was little confining-pressure effect on the cyclic behavior of calcareous sand, which is different from other calcareous sands. This may be attributed to the variations in regions and grain composition, which warrants further study.

Author Contributions

Conceptualization, L.L. and H.G.; methodology, L.L. and H.G.; validation, L.L. and X.Y.; investigation, L.L. and X.Y.; resources, Z.W. and H.G.; data curation, X.Y. and Z.J.; writing—original draft, L.L. and X.Y.; writing—review and editing, Z.J., Z.W. and Z.S.; visualization, L.L. and X.Y.; supervision, Z.W. and H.G. All authors have read and agreed to the published version of the manuscript.

Funding

This work was supported by the National Natural Science Foundation of China (grant no. 52008207, 51908284 and 51678300), Natural Science Research Project of Colleges and Universities in Jiangsu Province of China (grant no. 18KJA560002 and 19KJB560015), and the Middle-Aged and Young Science Leaders of Qinglan Project of Universities in Jiangsu Province of China.

Institutional Review Board Statement

Not applicable.

Informed Consent Statement

Not applicable.

Conflicts of Interest

The author declare no conflict of interest.

References

  1. Coop, M.R. The mechanics of uncemented carbonate sands. Géotechnique 1990, 40, 607–626. [Google Scholar] [CrossRef]
  2. Miao, G.; Airey, D. Breakage and ultimate states for a carbonate sand. Géotechnique 2013, 63, 1221–1229. [Google Scholar] [CrossRef]
  3. Liu, L.; Liu, H.L.; Xiao, Y.; Chu, J.; Xiao, P.; Wang, Y. Biocementation of calcareous sand using soluble calcium derived from calcareous sand. Bull. Eng. Geol. Environ. 2018, 77, 1781–1791. [Google Scholar] [CrossRef]
  4. Liu, L.; Liu, H.L.; Stuedlein, A.W.; Evans, T.M.; Xiao, Y. Strength, Stiffness, and Microstructure Characteristics of Biocemented Calcareous Sand. Can. Geotech. J. 2019, 56, 1502–1513. [Google Scholar] [CrossRef]
  5. Wu, Y.; Li, N.; Wang, X.; Cui, J.; Chen, Y.; Wu, Y.; Yamamoto, H. Experimental investigation on mechanical behavior and particle crushing of calcareous sand retrieved from South China Sea. Eng. Geol. 2020, 280, 105932. [Google Scholar] [CrossRef]
  6. Wang, X.; Wu, Y.; Cui, J.; Zhu, C.Q.; Wang, X.Z. Shape Characteristics of Coral Sand from the South China Sea. J. Mar. Sci. Eng. 2020, 8, 803. [Google Scholar] [CrossRef]
  7. Airey, D.W.; Fahey, M.D. Cyclic response of calcareous soil from the North-West Shelf of Australia. Géotechnique 1991, 41, 101–121. [Google Scholar] [CrossRef]
  8. Mao, X.; Fahey, M. Behaviour of calcareous soils in undrained cyclic simple shear. Géotechnique 2003, 53, 715–727. [Google Scholar] [CrossRef]
  9. Sharma, S.S.; Ismail, M.A. Monotonic and cyclic behavior of two calcareous soils of different origins. J. Geotech. Geoenviron. Eng. 2006, 132, 1581–1591. [Google Scholar] [CrossRef]
  10. Hyodo, M.; Aramaki, N.; Itoh, M.; Hyde, A.F.L. Cyclic strength and deformation of crushable carbonate sand. Soil Dyn. Earthq. Eng. 1996, 15, 331–336. [Google Scholar] [CrossRef]
  11. Hyodo, M.; Hyde, A.F.L.; Aramaki, N. Liquefaction of crushable soils. Géotechnique 1998, 48, 527–543. [Google Scholar] [CrossRef]
  12. Qadimi, A.; Coop, M.R. The undrained cyclic behaviour of a carbonate sand. Géotechnique 2007, 57, 739–750. [Google Scholar] [CrossRef]
  13. Sandoval, E.A.; Pando, M.A. Experimental assessment of the liquefaction resistance of calcareous biogenous sands. Earth Sci. Res. J. 2012, 16, 55–63. [Google Scholar] [CrossRef]
  14. Salem, M.; Elmamlouk, H.; Agaiby, S. Static and cyclic behavior of North Coast calcareous sand in Egypt. Soil Dyn. Earthq. Eng. 2013, 55, 83–91. [Google Scholar] [CrossRef]
  15. Brandes, H.G. Simple shear behavior of calcareous and quartz sands. Geotech. Geol. Eng. 2011, 29, 113–126. [Google Scholar] [CrossRef]
  16. Shahnazari, H.; Rezvani, R.; Tutunchian, M.A. Post-cyclic volumetric strain of calcareous sand using hollow cylindrical torsional shear tests. Soil Dyn. Earthq. Eng. 2019, 124, 162–171. [Google Scholar] [CrossRef]
  17. Xiao, P.; Liu, H.L.; Xiao, Y.; Stuedlein, A.W.; Evans, T.M. Liquefaction resistance of bio-cemented calcareous sand. Soil. Dyn. Earthq. Eng. 2018, 107, 9–19. [Google Scholar] [CrossRef]
  18. Xiao, P.; Liu, H.L.; Stuedlein, A.W.; Evans, T.M.; Xiao, Y. Effect of relative density and biocementation on cyclic response of calcareous sand. Can. Geotech. J. 2019, 56, 1849–1862. [Google Scholar] [CrossRef] [Green Version]
  19. He, S.H.; Zhang, Q.F.; Ding, Z.; Xia, T.D.; Gan, X.L. Experimental and Estimation Studies of Resilient Modulus of Marine Coral Sand under Cyclic Loading. J. Mar. Sci. Eng. 2020, 8, 287. [Google Scholar] [CrossRef]
  20. Wu, Q.; Ding, X.M.; Zhang, Y.L.; Chen, Z.X. Comparative Study on Seismic Response of Pile Group Foundation in Coral Sand and Fujian Sand. J. Mar. Sci. Eng. 2020, 8, 189. [Google Scholar] [CrossRef] [Green Version]
  21. Zhou, X.Z.; Chen, Y.M.; Liu, H.L.; Zhang, X.Z. Experimental study on the cyclic behavior of loose calcareous sand under linear stress paths. Mar. Georesour. Geotec. 2020, 38, 277–290. [Google Scholar] [CrossRef]
  22. Yang, J.; Sze, H.Y. Cyclic strength of sand under sustained shear stress. J. Geotech. Geoenviron. Eng. 2011, 137, 1275–1285. [Google Scholar] [CrossRef] [Green Version]
  23. Chen, G.X.; Wu, Q.; Zhao, K.; Shen, Z.F.; Yang, J. A Binary Packing Material–Based Procedure for Evaluating Soil Liquefaction Triggering during Earthquakes. J. Geotech. Geoenviron. Eng. 2020, 146, 4020040. [Google Scholar] [CrossRef]
  24. Seed, H.B.; Lee, K.L. Liquefaction of saturated sands during cyclic loading. J. Soil Mech. Found. Div. 1966, 92, 105–134. [Google Scholar] [CrossRef]
  25. Polito, C.P.; Green, R.A.; Lee, J. Pore pressure generation models for sands and silty soils subjected to cyclic loading. J. Geotech. Geoenviron. Eng. 2008, 134, 1490–1500. [Google Scholar] [CrossRef]
  26. Lee, K.L.; Albaisa, A. Earthquake induced settlements in saturated sands. J. Geotech. Engng Div. 1974, 100, 387–406. [Google Scholar] [CrossRef]
  27. Hardin, B.O.; Drnevich, V.P. Shear modulus and damping in soils: Design equations and curves. J. Soil Mech. Found. Div. 1972, 98, 667–692. [Google Scholar] [CrossRef]
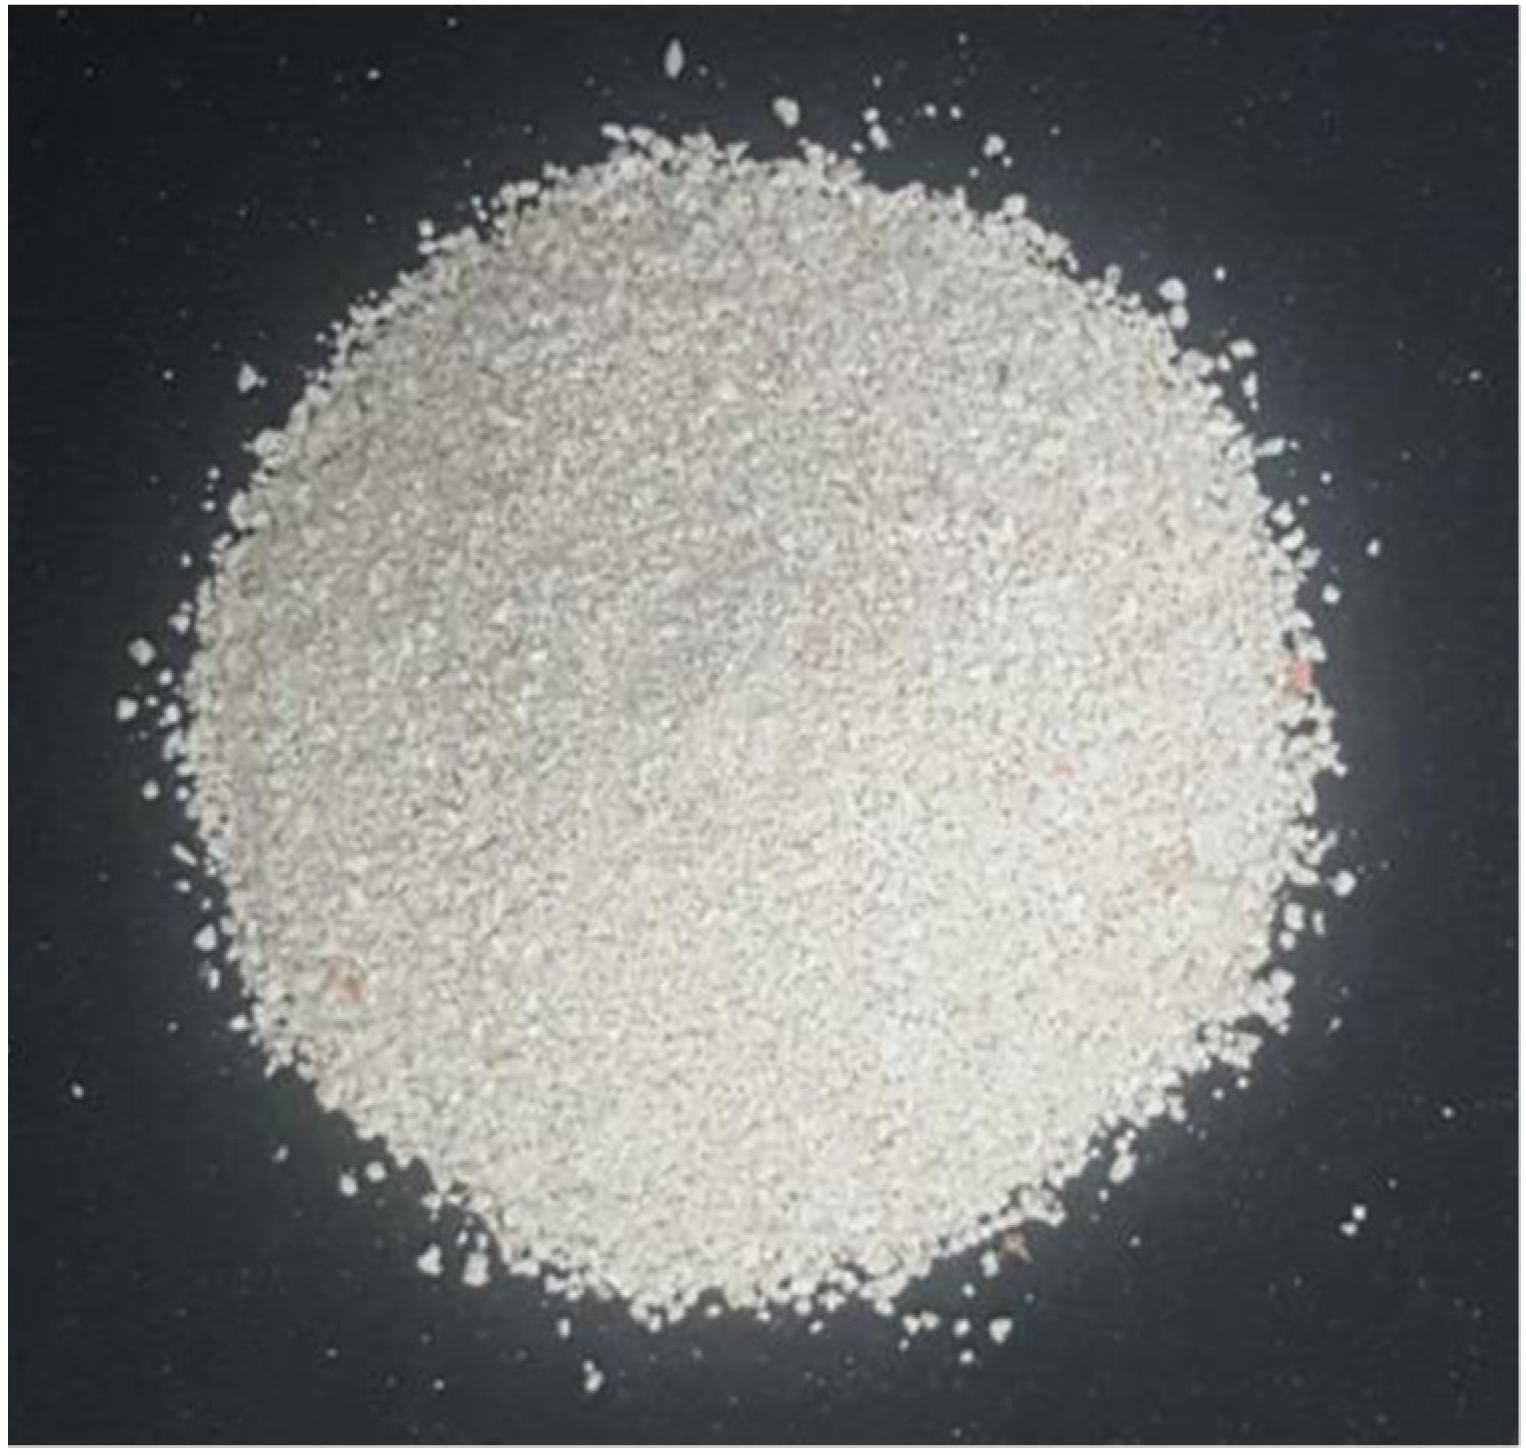
Figure 1. Photo of the tested calcareous sand.
Jmse 09 01014 g001
Figure 2. SEM images of the calcareous sand from the South China Sea: (a) ×200, (b) ×1000.
Jmse 09 01014 g002
Figure 3. Particle size distribution of the calcareous sand and other calcareous and siliceous sands.
Jmse 09 01014 g003
Figure 4. Typical cyclic behavior: (a) stress–strain curve for calcareous sand, (b) effective stress path for calcareous sand, (c) stress–strain curve for Fujian silica sand, (d) effective stress path for Fujian silica sand.
Jmse 09 01014 g004
Figure 5. Development of excess pore pressure with number of cycles for the specimens under σ c ' = 200 kPa and Dr = 45%: (a) calcareous sand with CSR = 0.15, (b) calcareous sand with CSR = 0.25, (c) Fujian silica sand with CSR = 0.15, (d) Fujian silica sand with CSR = 0.18.
Jmse 09 01014 g005
Figure 6. Comparison of residual pore pressure ratio versus cycle ratio: (a) calcareous sand with different cyclic stress ratios, (b) calcareous sand with different relative densities, (c) calcareous sand with different effective confining pressures, (d) calcareous sand and Fujian silica sand with the same loading conditions.
Jmse 09 01014 g006
Figure 7. Axial strain versus number of cycles for the specimens under σ c ' = 200 kPa and Dr = 45%: (a) calcareous sand with CSR = 0.15, (b) calcareous sand with CSR = 0.25, (c) Fujian silica sand with CSR = 0.15, (d) Fujian silica sand with CSR = 0.18.
Jmse 09 01014 g007
Figure 8. Comparison of double amplitude axial strain versus cycle ratio: (a) calcareous sand with different cyclic stress ratios, (b) calcareous sand with different relative densities, (c) calcareous sand with different effective confining pressures, (d) calcareous sand and Fujian silica sand with the same loading conditions.
Jmse 09 01014 g008
Figure 9. Comparison of shear modulus versus number of cycles: (a) calcareous sand with different cyclic stress ratios, (b) calcareous sand with different relative densities, (c) calcareous sand with different effective confining pressures, (d) calcareous sand and Fujian silica sand with the same loading conditions.
Jmse 09 01014 g009
Figure 10. Cyclic strength curves for the calcareous sand.
Jmse 09 01014 g010
Figure 11. Comparison between the calcareous sand and Cabo Rojo calcareous sand.
Jmse 09 01014 g011
Figure 12. Comparison between the calcareous sand and Fujian and Ottawa 20–30 silica sand.
Jmse 09 01014 g012
Table 1. Properties of the calcareous sand and other calcareous and siliceous sands.
Category of SandGsD50(mm)CuCcemaxemin
Calcareous sand
(present study)
2.820.534.910.761.450.81
Cabo Rojo calcareous sand
(Sandoval and Pando, 2012)
2.840.371.750.942.071.51
Fujian silica sand
(present study)
2.650.222.010.980.860.55
Ottawa 20–30 silica sand
(Sandoval and Pando, 2012)
2.650.752.11.10.780.5
Table 2. Test conditions and results.
Test No.Dr (%) σ c ' ( kPa ) CSRNL
CS1301000.15368
CS2301000.247
CS3301000.2513
CS4302000.15405
CS5302000.248
CS6302000.2512
CS7303000.15397
CS8303000.251
CS9303000.2512
CS10451000.267
CS11452000.15670
CS12452000.268
CS13452000.2518
CS16602000.154415
CS17602000.2160
CS18602000.2547
CS19603000.2150
SS1452000.12158
SS2452000.1532
SS3452000.1811
Note: CS: calcareous sand; SS: Fujian silica sand.
Publisher’s Note: MDPI stays neutral with regard to jurisdictional claims in published maps and institutional affiliations.