
A Simulation Approach to the Definition of the Subsystems Parameters in Small Container Terminals


Faculty of Maritime Studies and Transport, University of Ljubljana, Pot Pomorščakov 4, 6320 Portorož, Slovenia
*
Author to whom correspondence should be addressed.
J. Mar. Sci. Eng. 2021, 9(9), 1023; https://doi.org/10.3390/jmse9091023
Submission received: 20 August 2021
/
Revised: 12 September 2021
/
Accepted: 15 September 2021
/
Published: 18 September 2021
(This article belongs to the Section Coastal Engineering)
Abstract
:This article deals with the extremely difficult problem faced by a large number of smaller ports: how to enable small container terminals to simultaneously receive two ships of post-Panamax size, and at the same time provide effective transshipment operations on an individual terminal subsystem, which would enable the fast turnaround of the ship in port and at the same time provide the port the possibility to increase annual traffic. For this purpose, a simulation approach was used in a hypothetical small size container terminal. The performed simulations covered all the berth-yard-berth operations focusing on the correct allocation of transfer mechanization to ensure optimal results on the sea side of the terminal. The results obtained were used to define the key parameters on the basis of which a Decision Support Tool was created. The aim of the Decision Support Tool is to help port operators to identify their current problems quickly and effectively and to give them an insight into the measures that need to be implemented to accommodate two post-Panamax ships at the terminal at the same time.
1. Introduction
Over the last two decades, the demand for maritime container transport has increased significantly, leading to major changes in the size of the maritime container fleet and the development of ports and terminals. In reviewing the available literature [1,2,3,4,5,6,7,8,9], we found that in the current market situation, ship owners are deciding to build larger and larger container ships that allow them to operate at lower transportation costs. The largest container ship size has evolved from about 5500 TEU in 1995 to 24,000 TEU in 2020. In the coming years, ships of 25,000 TEU and above are expected. However, according to Ge, Zhu, Sha, Notteboom, Shi and Wang [9], the economic justification for a further increase in ship size depends largely on current and future conditions in the container shipping market, environmental requirements and considerations, and the adaptability of ports and terminals. In this sense, large ships pose a major challenge even in the world’s largest container ports, as they require large terminal capacities and highly efficient handling equipment to handle thousands of containers within a short time window. Moreover, they have a great indirect impact on medium and small container ports. Indeed, according to Merk, Busquet and Aronietis [4], these ports are subject to the cascade effect, which means that vessels that have become redundant due to the very large new vessels are used in direct services that include medium and small container ports. It is therefore expected that these ports will be able to accommodate one or more post-Panamax vessels (6000 to 8000 TEU), even if their original capacity was for smaller Panamax and feeder vessels. For this reason, they are increasingly opting to optimize the capacity of their terminals in order to increase, or at least not lose, their competitiveness vis-à-vis neighbouring ports. However, this type of investment is expensive and time-consuming, especially for small terminals with a capacity of up to 1 million TEU, as they are usually limited by space and draft. Nevertheless, in addition to physical capacity, terminals need to ensure smooth and efficient ship-to-shore operations in order to enable the fast clearance of the vessel at the port. For this reason, this paper addresses two research problems:
- how to enable smaller container terminals to increase the annual throughput accommodating two post-Panamax ships at the same time;
- how to provide these ships with optimal berth operations to enable them to leave the port quickly.
A simulation approach was used to solve the two problems. First, a hypothetical container terminal with small dimensions (630,000 TEU) was created using the discrete event simulation tool FlexSim CT 3.3. The simulations performed included all operations between berth and yard, focusing on the correct allocation of handling mechanization to ensure optimal results on the sea side of the terminal. The first part of the study involved handling operations between berth and yard using yard trucks (YTs). The results of this study were published by Stojaković and Twrdy [10], while the present study represents the second part of the study, in which the handling operations were performed with shuttle carriers (ShCs). During the simulations, terminal characteristics such as berth length, number of quay cranes (QCs) and vessel type were changed to gradually increase the annual traffic volume and capacity to approximately 1 million TEUs and evaluate how such traffic increase affects the productivity of the berth in the first place and the yard in the second place. In this way, it was possible to identify measures that would allow the berth to operate optimally. Secondly, the results from both simulation parts were used to define the key parameters based on which a Decision Support Tool (DST) was created. The objective of the DST is to help port operators quickly and effectively identify their current terminal problems and provide them with insight into the physical measures that need to be implemented to accommodate two post-Panamax vessels simultaneously if they are to increase annual throughput.
Since this research did not want to focus on a specific terminal, but on a hypothetical one combining the elements of different small terminals with similar characteristics, the basic criteria for the layout of the simulation terminal were represented by the northern Adriatic ports of Koper, Trieste, and Rijeka, from which most of the common factors were adopted. However, most of the berth characteristics were derived from the port of Koper. The selected ports correspond to the characteristics of small container terminals and have a real need for capacity expansion. Currently, only the port of Trieste has the condition to accept two post-Panamax vessels at the same time. Improving the terminal conditions has therefore become an important and immediate challenge to achieve greater competitiveness. Those ports that do not adjust their capacity to accept larger ships will simply receive a smaller share of the global container business. The aim of this paper is to show how smaller ports such as the above northern Adriatic should upgrade their existing terminal infrastructure and facilities and improve their productivity in order to be able to accommodate two post-Panamax vessels at the same time with the help of the created DST. The presented DST is applicable to all small and medium ports.
The structure of the paper is as follows. Section 2 gives an overview of container terminal operations, presenting key elements for a container terminal operation system and the preliminary field studies. Section 3 presents the simulation optimization approach and methodology. The simulation results are presented in Section 4, while the interpretation of the results and discussion are given in Section 5. Section 6 is entirely devoted to the explanation of the DST, while the conclusion is presented in Section 7.
2. Container Terminal Operations Background
Container terminals have become an extremely important part of almost all ports in recent years. For this reason, the operating system and optimization of container terminals are receiving more and more attention in the academic world. The most known papers that formed the basis for further research were published by Vis and De Koster [11], Steenken et al. [12], Günther and Kim [13], Murty et al. [14], and Stahlbock and Voß [15].
A seaport container terminal consists of three subsystems: the Berth, Yard, and Gate [16]. In the literature, the three subsystems are often considered separately, although a more comprehensive approach involving at least two of them needs to be considered, since the efficiency of a terminal depends on the well-organized coordination between all three subsystems. This paper deals with all berth–yard–berth operations in a terminal. Therefore, the literature dealing with terminal operations and simulations is examined and presented in this section.
2.1. Container Terminal Operations
The berth subsystem represents the most important part of the container terminal, as all other processes on the other subsystems of the terminal are connected to it. It is the elements of this subsystem that determine the maximum size of the ship that can enter the port [16]. Martin, Martin and Pettit [5] pointed out that the increase in the physical dimensions of ships has led container terminals to provide deeper water, longer berths, and quay cranes (QCs) with greater outreach and height to allow for more containers across and higher stacks on deck. In their research, they quantified the changes that increased vessel size had on berth and quay utilization and the impact on ship-to-shore service levels in northern European terminals. Stojaković and Twrdy [16] also addressed this issue by creating a DST to be used by terminal operators to identify the components that need to be optimized to obtain a desired ship size in a port. They defined the parameters according to 12 Mediterranean ports of different sizes. Some good research on the impact of increased ship size on berth operations has also been published by Park and Suh [6], Sys, Blauwens, Omey, Van De Voorde and Witlox [1], and Meng, et al. [17]. Obviously, in addition to physical capacity, a terminal must also ensure an adequate level of productivity that reduces the turnaround time of ships in the port [18]. For this purpose, the provision of an adequate number and type of handling equipment and their coordination in the operational processes is crucial. Usually, after the ship arrives at the port, the operations of unloading containers from the ship to the terminal are performed first, followed by loading containers from the terminal to the ship. During unloading, three sequences are performed in the quay and yard area, while the loading process is the reverse [17]:
- The unloading of containers from the ship by assigned QCs and transfer to transfer mechanization;
- The transfer of containers to the yard and handing them to the YC for positioning at the assigned slot;
- The return of the transfer mechanization to the berth to pick up another container or transport another container ready for loading to the berth.
In addition to the terminal operating system (TOS), which was addressed by Böse [19] in the Handbook of Terminal Planning, and Hervás-Peralta, et al. [20], who considered TOS functionalities using the Analytic Hierarcy Process, the main research areas are the berth allocation problem (BAP) and the quay crane assignment problem (QCAP). In both cases, generic algorithms are mostly used [21,22,23]. One of the main problems that ports face due to the arrival of larger ships is the reduction of berth productivity, which leads to longer ship times in port and higher costs for the ship operator. Nevertheless, according to Zeng and Yang [24] the most important measures to be considered in the berth subsystem are vessel productivity, quay productivity, and QC productivity. A good level of these measures can significantly reduce the ship’s laytime. Quay productivity is highly dependent on QC productivity. This is measured by the number of movements per hour. A detailed analysis of this area was carried out by Bartošek and Marek [25], while Zhao and Goodchild [26] explained QC efficiency and its influence on possible bottlenecks. On the other hand, Singgih and Kim [27] used a tree search algorithm to define the best loading order to minimise the total QC time and the number of container shifts in the yard. Therefore, assigning the right number of QCs to a ship is crucial. According to Stojaković and Twrdy [28], in most smaller ports the allocation of an insufficient number of QCs to a ship is a very common problem that prolongs the turnaround time of the ship in the port. However, even when the right number of QCs have been allocated, they do not always achieve the recommended average productivity. Since a container terminal is a complex system, ship service depends not only on the operations of QCs, but mainly on the operations of the transfer mechanization and secondarily on yard operations [29]. Therefore, coordination between the cargo handling equipment in different terminal subsystems is essential. YTs, straddle carriers (SCs), ShCs, and automated guided vehicles (AGVs) can be chosen for transfer operations [30]. As YTs and ShCs are included in this study, they are presented in more detail in this section. In small terminals, YTs are the most common choice due to their low price and high flexibility. According to Stojaković and Twrdy [28], they can be assigned to a group of QCs, but in most cases, they are assigned to a specific QC. However, they also have a negative side, as they are categorised as passive transfer equipment, which means that they cannot lift a container. Carlo, et al. [31] explained that, for this reason, a QC has to wait for the YT to pick up or drop off a container. This leads to many deadhead trips, as most QCs in smaller ports perform single-cycle movements [31,32]. Therefore, in order to maintain a good productivity level of QCs, a correct number of YTs must be assigned to each QC and synchronisation between port equipment elements must be ensured. This will have a positive impact on their working and waiting times. Minimising truck waiting time in landside operations has been analysed by Kim, et al. [33]. Tang, et al. [34] have also focused on the average waiting times of YTs. On the other hand, ShCs belong to the so-called active transfer equipment that can lift a container. This avoids deadheads of vehicles and reduces the waiting time of QCs. The increased crane productivity in turn speeds up the service of a vessel. They are mostly used at large terminals. Compared to YTs, the use of ShCs is accompanied by higher acquisition, maintenance, and operating costs. The choice of transfer mechanization has a major impact on the operation of QCs and thus on the whole berth subsystem. At the yard subsystem the choice can be made between SCs, which can then be used for transfer purposes, or rubber-tired gantry cranes (RTGs), rail-mounted gantry cranes (RMGs), and automated stacking cranes (ASCs). Even though RTGs are well known in medium and large terminals, they are often used in smaller terminals such as the ports of the north Adriatic. Their main advantage is the small space required in the stacking area due to the high storage capacity and the possibility of being transported to other storage blocks. On the other hand, a disadvantage is that a different type of transport equipment is required for the transfer process between QCs and RTGs [30]. Among the literature covering yard equipment that has been examined are also Kress, et al. [35], and Chen, et al. [36].
2.2. Container Terminal Simulations
When researchers want to analyse the interoperability of different terminal areas or the operation of a subsystem in more detail, they often choose to do so using various built-in simulation software such as ARENA, AnyLogic, MicroPort, and FlexSim CT. A detailed overview of the works dealing with the application of simulation models in port development published in the period from 1961 to 2015 has been provided by Dragović, et al. [37].
Kotachi, et al. [38] used the software ARENA to model generic port operations to see how different inputs to the model can affect outputs such as the throughput, resource utilization, and waiting times. The same software in combination with DEA was also used by Sislioglu, et al. [39] to find the optimal investment to improve container terminal productivity. AnyLogic software was used by Longo, et al. [40] to create a simulation-based tool of a medium-sized Mediterranean port that can be used by the main port authorities to support decision making and process management. Yang, et al. [41] also used AnyLogic to evaluate the performance of the algorithm. They were able to effectively increase the utilization of QCs and YCs and reduce the time to task completion. On the other hand, Pirhonen [42] used Kalmar’s simulation program, Port Optimizer, to model the operational processes of a container terminal in order to increase the average productivity of each QC. They examined manual ShCs. Said and El-Horbaty [43] and Said, et al. [44] used FlexSim CT software to address the storage space allocation problem considering different interrelated container terminal handling activities in the port of Alexandria, while Stojaković and Twrdy [28] chose the same program to study the productivity of QCs in small container ports by assigning them a different number of YTs.
The present research is an upgrade of the model presented by Stojaković and Twrdy [10] wherein they focused on the allocation of the right number of YTs to QCs in order to assure better productivity levels in the berth and yard subsystems. The aim of this research is to enhance the existing study with simulations of the berth–yard–berth operations with ShCs. The simulations were again performed with the FlexSim CT software. In this way, it was possible to compare the results and determine how a smaller terminal would perform and what elements of the terminal would need to be optimized to accommodate two post-Panamax vessels at the same time while maintaining optimal berth productivity primarily and storage productivity. The data obtained formed the basis for the DST developed.
3. Simulation Optimization Approach and Methodology
3.1. Simulation Model
The basic container terminal model has an annual capacity of 630,000 TEU and has a continuous quay 600 m long divided into two berths. Large vessels can occupy more than one berth, while small vessels can share one berth. The length of the first berth is 250 m and is equipped with four Panamax QCs. The length of the second berth is 350 m, and there are four post-Panamax QCs serving vessels. All QCs perform single cycling operations, which is common in medium and small ports. The transhipment operations between the sea and the storage area are carried out by ShCs. The storage area has a capacity of 20,160 TEU and is located parallel to the quay. It is divided into three stacking areas: Import, Export and Empty Container Area. Operations with full containers are carried out with RTGs, while empty containers are handled with reach stackers. All operating equipment of the same type has the same specifications. Once the containers are placed in their final slot, they are not moved within the yard. The model layout is shown in Figure 1.
For the simulation of berth operations, a real ship arrival schedule was used in which each ship service has a fixed scheduled arrival time that is the same every week. It consists of 13 services, which include feeder vessels, Panamax vessels, and post-Panamax vessels. In this schedule, post-Panamax ships accounted for only 30.77% of all ships arriving at the terminal but provided 66.20% of the terminal throughput. The simulations were conducted over a period of one week or until the completion of the transhipment operations of the last liner.
3.2. Simulation Experiments and Methodology
The simulations performed included all operations at the berth and yard subsystems. That is, the unloading and loading of ships, the transfer of containers from shore to yard and vice versa, and the stacking operations at the yard. The gate operations were abstracted by the software according to the input data (Figure 2).
The simulations started with the first scenario, which included simulations of the basic container terminal model where only one post-Panamax ship and one smaller ship can be served at the terminal at the same time. Later, the capacity of the basic terminal was gradually increased so that it was possible to accommodate 2 post-Panamax vessels at the quay at the same time and increase the throughput of the terminal to approximately 1 million TEU per year. This was carried out in seven scenarios, which are shown in Table 1. The simulations were carried out in the order shown in Figure 3.
All simulations were based on five terminal factors explained by Stojaković and Twrdy [16], which define a functioning system at the seashore that depends on the quality of service when the ship enters the port. These factors are sea depth, berth length, quay cranes, yard area, and yard mechanization. Although sea depth is the first condition for vessel reception, this factor was neglected in this analysis due to software limitations that do not allow such simulations. We therefore assumed that this condition was met and focused on other conditions, in particular the required berth length and quay cranes in the berth area, and then on the factors from the yard area. The simulations carried out were crucial in determining which parts of the terminal would need to be physically enlarged to accommodate two post-Panamax vessels at the same time.
In this study the simulation methodology adopted was the same used by Stojaković and Twrdy [10]. On that occasion, the simulations were performed in three sets with different numbers of YTs per QC. It was found that when YTs are used to transfer containers from berth to yard and vice versa, the best productivity results in both subsystems are obtained when 10 YTs are assigned to each QC. When fewer or more than 10 YTs are assigned to the QCs, the results in the berth and yard areas are exactly opposite, which has a negative impact on terminal productivity. By running simulations with the same container terminal model using ShCs, it was possible to determine whether the use of a different, more efficient type of mechanization commonly used in larger container terminals can improve productivity in both subsystems of smaller container terminals and may be a good alternative for smaller ports. The order of simulations is shown in Figure 4.
4. Results
The performed simulations provided the following outputs: QC working time, QC productivity (moves/hour), berth occupancy ratio, yard utilisation, and YC waiting times. The results are presented in Table 2 and Figure 5 and Figure 6.
The results show that at the berth subsystem, both QC types performed all transhipment operations with an extremely low work ratio that never exceeded the recommended work ratio, which still allows for smooth vessel operation. This is especially important in the last two scenarios where the traffic volume at the terminal is the highest. There, the working time of the post-Panamax QCs did not exceed 47%. This had a very positive effect on the vessel operating time and, of course, on the time the vessel spends in port and therefore on berth occupancy. This only varied between 36% and 51%, which means that there is still much space before the recommended limit of 65% is reached. It is extremely important that berth occupancy remained so low even in the last two scenarios where terminal traffic increased up to 1 million TEU per year. This means that it would be possible to increase throughput even further without losing berth operating levels. Moreover, the productivity of the QCs reached the desired numbers. The overall average QC moves per hour were between 25 and 30, but if we focus only on the post-Panamax QCs, we find that they achieved between 28 and 32 moves per hour, which is a result that small or medium-sized ports actually want to achieve. On the other hand, until scenario 4, the yard utilisation was low and quite similar (between 44% and 48% on average). From scenario 5 onwards, where the annual throughput increased to 844,000 TEU, differences were observed. There, the percentage utilisation increased (from 49% to 56%) but was still below the recommended limit (65%), which means that the storage capacity is still sufficient for all the traffic and would potentially also allow for an increase in traffic without the congestion having a negative impact on productivity. The simulation also showed that YCs waited the longest for ShCs at the blocks for import containers and much less for export containers, as these were placed directly behind the coast.
Comparing this study with that of Stojaković and Twrdy [10], it becomes clear that while it is difficult to define the optimal number of YTs that can be assigned to a single QC, since the choice that is favourable for one terminal subsystem turns out to be less than ideal for the other subsystem, it is possible to determine more precisely the number of ShCs for each QC, since the conditions that led to excellent productivity results for the berth subsystem also yielded very good results for the yard subsystem. Optimal productivity results can therefore be achieved by assigning two ShCs to a Panamax QC and from three to five ShCs to a post-Panamax QC (depending on the traffic volume). The decision to use ShCs for transfer purposes also proved to be a good choice for smaller terminals.
5. Interpretation of Results and Discussion
The first part of the simulations was based on the required length of berth and quay to accommodate two post-Panamax vessels simultaneously and the required number of QCs to serve the vessel in ship-to-shore operations. The simulations showed that each berth must have an additional 40 m of shore length (20 m on each side of the vessel) in addition to the vessel length to allow the safe berthing of the vessel. Thus, to accommodate a post-Panamax vessel that is approximately 300 m long, the terminal requires a berth of approximately 350 m. In our basic model, where the length of the quay is 600 m, it was already possible to accommodate a post-Panamax ship together with a ship of smaller capacity. So, by increasing the berth by 100 m, it was theoretically possible to accommodate two large ships at the terminal at the same time, but this would not make sense without proper handling mechanization. The quay was still equipped with four Panamax and four post-Panamax cranes, although handling a post-Panamax vessel with Panamax cranes would be impossible due to the shorter reach of the cranes (only possible when the vessel is turning in port), and their low productivity (about 20 moves per hour) would significantly increase the time the vessel would have to spend in port anyway. In addition to the type of QC assigned to the vessel, the time and efficiency of the vessel in port also depends on the number of QCs assigned to each vessel. Simulations have shown that even an insufficient number of assigned post-Panamax QCs is not efficient for a large ship. Vessels completed their operations in an acceptable and reliable time only when they were assigned three to four post-Panamax cranes (depending on the number of planned movements, the placement of containers on the vessel, and the estimated time available for operations in port). It can be concluded that in order to accommodate one or more vessels with a capacity of 6000 to 8000 TEU, a sufficient number of QCs is required in addition to a correspondingly long berth at the terminal. It was confirmed that the two factors are closely linked and cannot be considered separately. With a quay length of 700 m, an annual throughput of almost 1 million TEU could be achieved at the terminal of our capacity without major congestion with ShCs, while with YTs, the utilization would be higher. The simulations also showed that if we had a larger number of liner services with post-Panamax vessels arriving at both berths at the same time, we would need at least seven post-Panamax cranes at the terminal of our capacities, which would enable fast vessel handling. For an annual traffic of more than 900,000 TEU, there should be eight post-Panamax QCs, as the traffic would be mainly large vessels. The results of the yard subsystem confirmed that its efficiency also had a significant impact on the efficiency of the berth subsystem. Thus, in all simulations, the initially allocated storage capacities met the demand until the traffic volume increased to about 768,000 TEU per year. Then, the capacities had to be adjusted according to the traffic demands. Thus, it can be said that when an additional service with post-Panamax vessels was introduced, the capacity of the terminal would be sufficient, whereas, when additional services were introduced, optimization would have to be considered. In addition to the spatial factor, the most important factor in the yard area was the land mechanization, against which we measured the productivity and the waiting time for handling a container. This mainly depended on the type and number of transfer mechanization used. According to Stojaković and Twrdy [10], the results showed that by using YTs, the berth and yard subsystems are in conflict with each other and require different conditions to achieve optimal handling results, but they are also closely related, as they influence each other during operation. The best results, where the two subsystems harmonized very well in terms of ideal conditions, were obtained in those simulations where the transfer operations were performed with ShCs. Extremely good results were obtained in terms of berth occupancy, QC productivity, as well as storage occupancy and waiting for land mechanization. Terminal operators therefore still have a key role to play in correctly assessing the capacity of their subsystems and improving them accordingly on this basis. To support operators in this type of decision making, we have developed a DST (presented in the next section) whose key parameters are based on the results of the simulations performed.
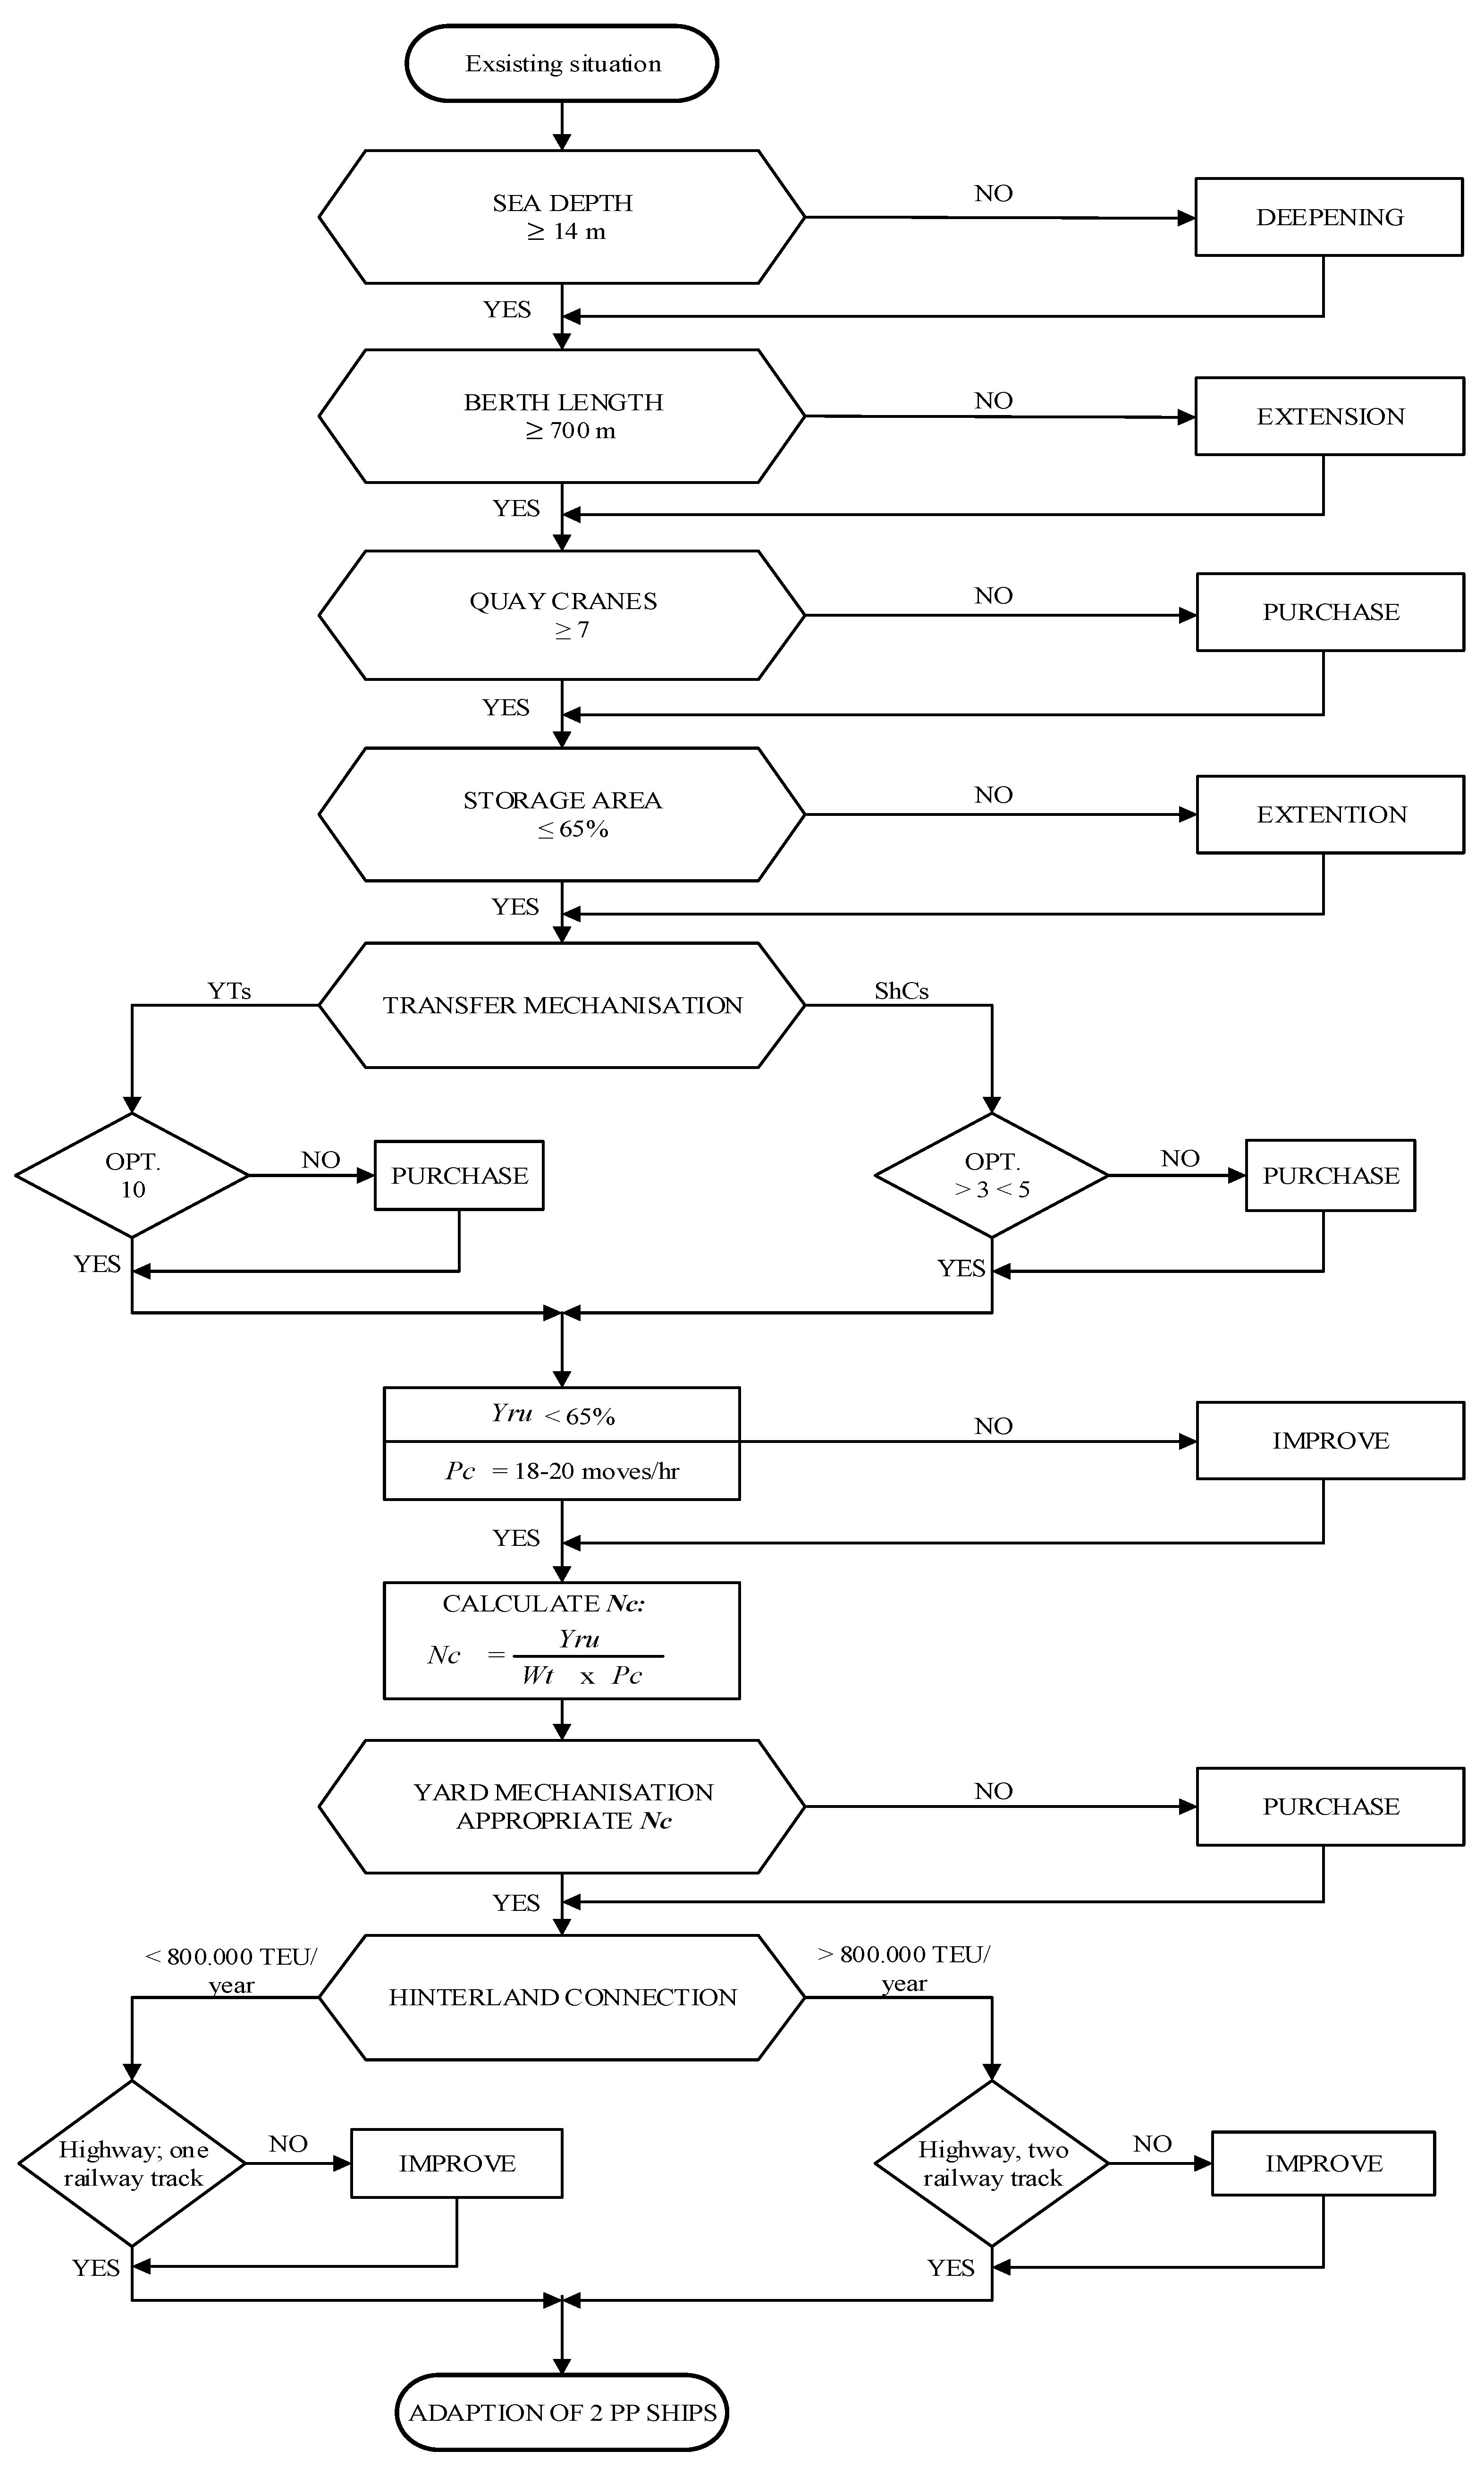
6. DST (Decision Support Tool)
The DST (Figure 7) consists of seven factors that are critical to the acceptance of ships at the terminal. The first three factors belong to the berth subsystem, which directly determines the size of the ship that can enter the port, while the others belong to the yard and gate subsystem, whose influence on ship acceptance is indirect. The transfer mechanization occupies a special position in the DST, since the simulations showed that it has a great influence on the productivity of both QCs and YCs.
Each factor (with the exception of sea depth, which was defined according to available literature) was defined with parameters that were shown in the simulations to be crucial for the possibility of accommodating two post-Panamax vessels (about 300 m) at the terminal at the same time. While the berth parameters were very clear and easy to define, the yard parameters had to be adjusted in an optimal way, as the terminals are very different in this area. The storage capacities were defined according to the maximum recommended utilization rate, which does not yet hinder the operation of the terminal (65%), while the yard mechanization (according to its current capacities) has to be precisely determined by the following equation:
where Nc defines the required number of YCs on the yard, Yru represents the maximum recommended daily yard utilization (65%), and Wt represents the yard working time (depending on the length and number of shifts), while Pc represents the productivity of the YCs (moves/hour). The equation was inserted into the DST because it is conditioned by the utilization of the storage capacity of each terminal.
Before the terminal operator uses the DST, he or she must have a thorough understanding of the capacity and operations of the terminal, starting with the existing situation. The parts of the terminal to be considered are followed by the importance, so the terminal operator must first focus on the existing situation of the first factor. If the factor corresponds to the required capacities, it means that no optimization is required in this part of the terminal and the operator proceeds to analyse the following factors. If the situation in the selected part of the terminal does not meet the required capacities, the operator goes to the right and defines the necessary optimization measures and only then proceeds to the factors listed below. At the end of the DST, the measures that should be considered in order to accommodate two post-Panamax vessels (300 m) in the terminal are known. Therefore, based on the DST presented, it can be determined whether or not the capacity of a single part of the terminal meets the requirements to accommodate two post-Panamax vessels at the same time, and optimization is required at a certain point. Of course, each port has its own needs and priorities, but these are factors that are common to all ports. With the DST, ports can therefore quickly and efficiently identify their current problems and the measures they need to implement to meet the conditions that ship-owners expect when they start a direct service.
7. Conclusions
The trends towards building larger ships will have a major impact on smaller ports in the future, which will find it difficult to meet the demands of shipowners. The ships built in 2007 had a capacity of about 8000 TEU and were considered the largest ships at the time, but are now used as feeder ships to call at smaller ports. The tendency to use large ships thus has a cascading effect on ports, which must prepare to receive them. Indeed, this paper is concerned with the phenomenon of the impact of these ships on ports. We were interested in how smaller ports can prepare to receive larger ships when they are limited by the depth and size of the terminal. To increase their productivity, they need to prepare to receive two post-Panamax vessels under existing conditions. The solution was found in another application of transport mechanization.
In order to determine what optimization measures are necessary to overcome such a challenge, we performed step simulations on the model assigned the characteristics of a small container terminal, in which we determined the optimization measures necessary to accommodate these ships in the terminal. The simulations carried out provide the innovative results of the operation of two subsystems (berth/yard) of the container terminal, while their parameters (both infrastructure and number and type of mechanization) are modified with the aim of accommodating two post-Panamax vessels and increasing the traffic to 1 million TEU. The results offer a real contribution to science, as no similar analysis has been found in the literature so far. At the same time, it provides a good starting point for possible further research on one of the subsystems considered, as well as an extension of the research on the operation of all three terminal subsystems to include simulation tools such as FlexSim CT 3.3. Thus, it has been shown that it is not sufficient to improve the productivity of a single terminal subsystem if the port wants to accommodate a larger post-Panamax category of vessels or even several such vessels at the same time. Measures involving the physical expansion of a specific part of the terminal and additional handling equipment are required. Based on the obtained results, a DST has been developed that allows ports to quickly and efficiently identify the required measures, as it allows the input of real terminal data. The developed model is therefore suitable for use in medium and small ports with terminal capacities that do not yet allow the simultaneous handling of two post-Panamax vessels. The rapid increase in ship sizes shows that such terminals will face even greater pressure in the future, requiring the accommodation of even larger ships. The presented DST was tested at the container terminal in the port of Koper. This fact was a starting point for further research, which will include simulations of the arrival of even larger ships at a small container terminal. In this way, it will be possible to obtain new parameters with which the presented DST can be upgraded. Nevertheless, it should be emphasized that our DST is intended for the immediate improvement actions that ports can take in the short term to remain competitive with neighbouring ports and inviting for shipping companies. In the long term, the solutions of some of these terminals will focus mainly on the construction of internal terminals to be used for container storage. In this operation, the operational parts of the terminal will be dedicated exclusively to transhipment, with the chosen handling mechanization playing a key role. Some ports in the northern Adriatic (the characteristics of which our simulations were based on) have already opted for such projects, but the completion of these projects and thus the commissioning is not expected for several years (maybe even later, due to the current situation in this pandemic period), which is a major problem in a period of great competition and pressure. Hence, there is a need to find temporary, quick, and effective solutions, and the present DST can be very helpful in this regard.
Author Contributions
Conceptualization, M.S. and E.T.; methodology, M.S. and E.T.; software, M.S.; validation, M.S.; formal analysis, M.S. and E.T.; data curation, M.S.; writing—original draft preparation, M.S.; writing—review and editing, M.S. and E.T. All authors have read and agreed to the published version of the manuscript.
Funding
This research received no external funding.
Institutional Review Board Statement
Not applicable.
Informed Consent Statement
Not applicable.
Data Availability Statement
Data are available from the authors upon request.
Conflicts of Interest
The authors declare no conflict of interest.
References
- Sys, C.; Blauwens, G.; Omey, E.; Van De Voorde, E.; Witlox, F. In Search of the Link between Ship Size and Operations. Transp. Plan. Technol. 2008, 31, 435–463. [Google Scholar] [CrossRef] [Green Version]
- Cullinane, K.; Khanna, M. Economies of Scale in Large Container Ships. J. Transp. Econ. Policy 1999, 33, 185–207. [Google Scholar]
- Imai, A.; Nishimura, E.; Papadimitriou, S. Marine container terminal configurations for efficient handling of mega-containerships. Transp. Res. Part E Logist. Transp. Rev. 2013, 49, 141–158. [Google Scholar] [CrossRef]
- Merk, O.; Busquet, B.; Aronietis, R. The Impact of Mega-Ships. OECD. 2015, p. 108. Available online: https://link.springer.com/article/10.1057/s41278-019-00136-4 (accessed on 17 September 2021).
- Martin, J.; Martin, S.; Pettit, S. Container ship size and the implications on port call workload. Int. J. Shipp. Transp. Logist. 2015, 7, 553. [Google Scholar] [CrossRef]
- Park, N.K.; Suh, S.C. Tendency toward Mega Containerships and the Constraints of Container Terminals. J. Mar. Sci. Eng. 2019, 7, 131. [Google Scholar] [CrossRef] [Green Version]
- Shi, B.; Liu, D.; Peter, T.-J.; Wong, K.M. Overview of the development of ultra large container carriers: Where next? In Proceedings of the Boxship 2006 Conference, Shanghai, China, 5–6 December 2006; p. 10. [Google Scholar]
- Tran, N.K.; Haasis, H.-D. An empirical study of fleet expansion and growth of ship size in container liner shipping. Int. J. Prod. Econ. 2015, 159, 241–253. [Google Scholar] [CrossRef]
- Ge, J.; Zhu, M.; Sha, M.; Notteboom, T.; Shi, W.; Wang, X. Towards 25,000 TEU vessels? A comparative economic analysis of ultra-large containership sizes under different market and operational conditions. Marit. Econ. Logist. 2019, 1–28. [Google Scholar] [CrossRef]
- Stojaković, M.; Twrdy, E. Determining the optimal number of yard trucks in smaller container terminals. Eur. Transp. Res. Rev. 2021, 13, 1–12. [Google Scholar] [CrossRef]
- Vis, I.F.A.; De Koster, R. Transshipment of containers at a container terminal: An overview. Eur. J. Oper. Res. 2003, 147, 1–16. [Google Scholar] [CrossRef]
- Steenken, D.; Voß, S.; Stahlbock, R. Container terminal operation and operations research—A classification and literature review. OR Spectr. 2004, 26, 3–49. [Google Scholar] [CrossRef]
- Günther, H.-O.; Kim, K.H. Container treminals and Automated transport systems; Günther, H.-O., Kim, K.H., Eds.; Springer Science and Business Media: Berlin, Germany, 2005; p. 379. [Google Scholar]
- Murty, K.G.; Liu, J.; Wan, Y.-w.; Linn, R. A decision support system for operations in a container terminal. Decis. Support Syst. 2005, 39, 309–332. [Google Scholar] [CrossRef]
- Stahlbock, R.; Voß, S. Operations research at container terminals: A literature update. OR Spectr. 2008, 30, 1–52. [Google Scholar] [CrossRef]
- Stojaković, M.; Twrdy, E. A decision support tool for container terminal optimization within the berth subsystem. Transport 2016, 31, 29–40. [Google Scholar] [CrossRef] [Green Version]
- Meng, Q.; Weng, J.; Suyi, L. Impact Analysis of Mega Vessels on Container Terminal Operations. Transp. Res. Procedia 2017, 25, 187–204. [Google Scholar] [CrossRef]
- Zhang, H.; Kim, K.H. Maximizing the number of dual-cycle operations of quay cranes in container terminals. Comput. Ind. Eng. 2009, 56, 979–992. [Google Scholar] [CrossRef]
- Böse, J.W. Handbook of Terminal Planning; Böse, J.W., Ed.; Springer Science and Business Media: Berlin/Heidelberg, Germany, 2011; Volume 49, p. 437. [Google Scholar]
- Hervás-Peralta, M.; Poveda-Reyes, S.; Molero, G.D.; Santarremigia, F.E.; Pastor-Ferrando, J.-P. Improving the Performance of Dry and Maritime Ports by Increasing Knowledge about the Most Relevant Functionalities of the Terminal Operating System (TOS). Sustainability 2019, 11, 1648. [Google Scholar] [CrossRef] [Green Version]
- Bierwirth, C.; Meisel, F. A survey of berth allocation and quay crane scheduling problems in container terminals. Eur. J. Oper. Res. 2010, 202, 615–627. [Google Scholar] [CrossRef]
- Imai, A.; Sun, X.; Nishimura, E.; Papadimitriou, S. Berth allocation in a container port: Using a continuous location space approach. Transp. Res. Part B Methodol. 2005, 39, 199–221. [Google Scholar] [CrossRef] [Green Version]
- Jin, Z.; Li, N. Optimization of Quay Crane Dynamic Scheduling Based on Berth Schedules in Container Terminal. J. Transp. Syst. Eng. Inf. Technol. 2011, 11, 58–64. [Google Scholar] [CrossRef]
- Zeng, Q.; Yang, Z. Integrating simulation and optimization to schedule loading operations in container terminals. Comput. Oper. Res. 2009, 36, 1935–1944. [Google Scholar] [CrossRef]
- Bartošek, A.; Marek, O. Quay Cranes in Container Terminals. Trans. Transp. Sci. 2013, 6, 9–18. [Google Scholar] [CrossRef] [Green Version]
- Zhao, W.; Goodchild, A.V. Using the truck appointment system to improve yard efficiency in container terminals. Marit. Econ. Logist. 2013, 15, 101–119. [Google Scholar] [CrossRef]
- Singgih, I.K.; Kim, K.H. Flexible Load Sequencing in Container Terminals. J. Korean Soc. Supply Chain Manag. 2016, 16, 93–104. [Google Scholar]
- Stojaković, M.; Twrdy, E. The Influence of Yard Trucks on Berth Operations in Smaller Container Terminals. Sci. J. Marit. Res. 2019, 33, 171–175. [Google Scholar] [CrossRef]
- Hu, H.; Chen, X.; Zhen, L.; Ma, C.; Zhang, X. The Joint quay crane scheduling and block allocation problem in container terminals. IMA J. Manag. Math. 2018, 30, 51–75. [Google Scholar] [CrossRef]
- Brinkmann, B. Operations System of Container Terminals: A Compendious Overview. In Handbook of Terminal Planning; Bose, J.W., Ed.; Springer Science and Business Media, LLC: New York, NY, USA, 2011; pp. 25–39. [Google Scholar]
- Carlo, H.J.; Vis, I.F.A.; Roodbergen, K.J. Transport operations in container terminals: Literature overview, trends, research directions and classification scheme. Eur. J. Oper. Res. 2014, 236, 1–13. [Google Scholar] [CrossRef]
- Zeng, Q.; Yang, Z.; Lai, L. Models and algorithms for multi-crane oriented scheduling method in container terminals. Transp. Policy 2009, 16, 271–278. [Google Scholar] [CrossRef]
- Kim, K.; Lee, K.; Hwang, H. Sequencing delivery and receiving operations for yard cranes in port container terminals. Int. J. Prod. Econ. 2003, 84, 283–292. [Google Scholar] [CrossRef]
- Tang, G.; Qin, M.; Zhao, Z.; Yu, J.; Shen, C. Performance of peak shaving policies for quay cranes at container terminals with double cycling. Simul. Model. Pract. Theory 2020, 104, 102129. [Google Scholar] [CrossRef]
- Kress, D.; Meiswinkel, S.; Pesch, E. Straddle carrier routing at seaport container terminals in the presence of short term quay crane buffer areas. Eur. J. Oper. Res. 2019, 279, 732–750. [Google Scholar] [CrossRef]
- Chen, L.; Langevin, A.; Lu, Z. Integrated scheduling of crane handling and truck transportation in a maritime container terminal. Eur. J. Oper. Res. 2013, 225, 142–152. [Google Scholar] [CrossRef]
- Dragović, B.; Tzannatos, E.; Park, N.K. Simulation modelling in ports and container terminals: Literature overview and analysis by research field, application area and tool. Flex. Serv. Manuf. J. 2017, 29, 4–34. [Google Scholar] [CrossRef]
- Kotachi, M.; Rabadi, G.; Obeid, M.F. Simulation Modeling and Analysis of Complex Port Operations with Multimodal Transportation. Procedia Comput. Sci. 2013, 20, 229–234. [Google Scholar] [CrossRef] [Green Version]
- Sislioglu, M.; Celik, M.; Ozkaynak, S. A simulation model proposal to improve the productivity of container terminal operations through investment alternatives. Marit. Policy Manag. 2018, 46, 156–177. [Google Scholar] [CrossRef]
- Longo, F.; Huerta, A.; Nicoletti, L. Performance Analysis of a Southern Mediterranean Seaport via Discrete-Event Simulation. J. Mech. Eng. 2013, 59, 517–525. [Google Scholar] [CrossRef]
- Yang, Z.; Li, C.; Zhao, Q. Dynamic Time Estimation Based AGV Dispatching Algorithm in Automated Container Terminals. In Proceedings of the Chinese Control Conference (CCC), Wuhan, China, 25–27 July 2018. [Google Scholar]
- Pirhonen, J. Automated Shuttle Carrier Concept. In Handbook of Terminal Planning; Jurgen, B.W., Ed.; Springer Science and Business Media, LLC: New York, NY, USA, 2011; pp. 41–59. [Google Scholar]
- Said, G.A.E.-N.A.; El-Horbaty, E.-S.M. A simulation modeling approach for optimization of storage space allocation in container terminal. Inf. Syst. Control Eng. 2015, 9, 168–173. [Google Scholar]
- Said, G.A.E.-N.A.; Mahmoud, A.M.; El-Horbaty, E.-S.M. Solving container terminals problems using computer-based modeling. Int. J. Comput. Sci. Eng. (IJCSE) 2014, 3, 91–100. [Google Scholar]
Figure 1.
Model layout.
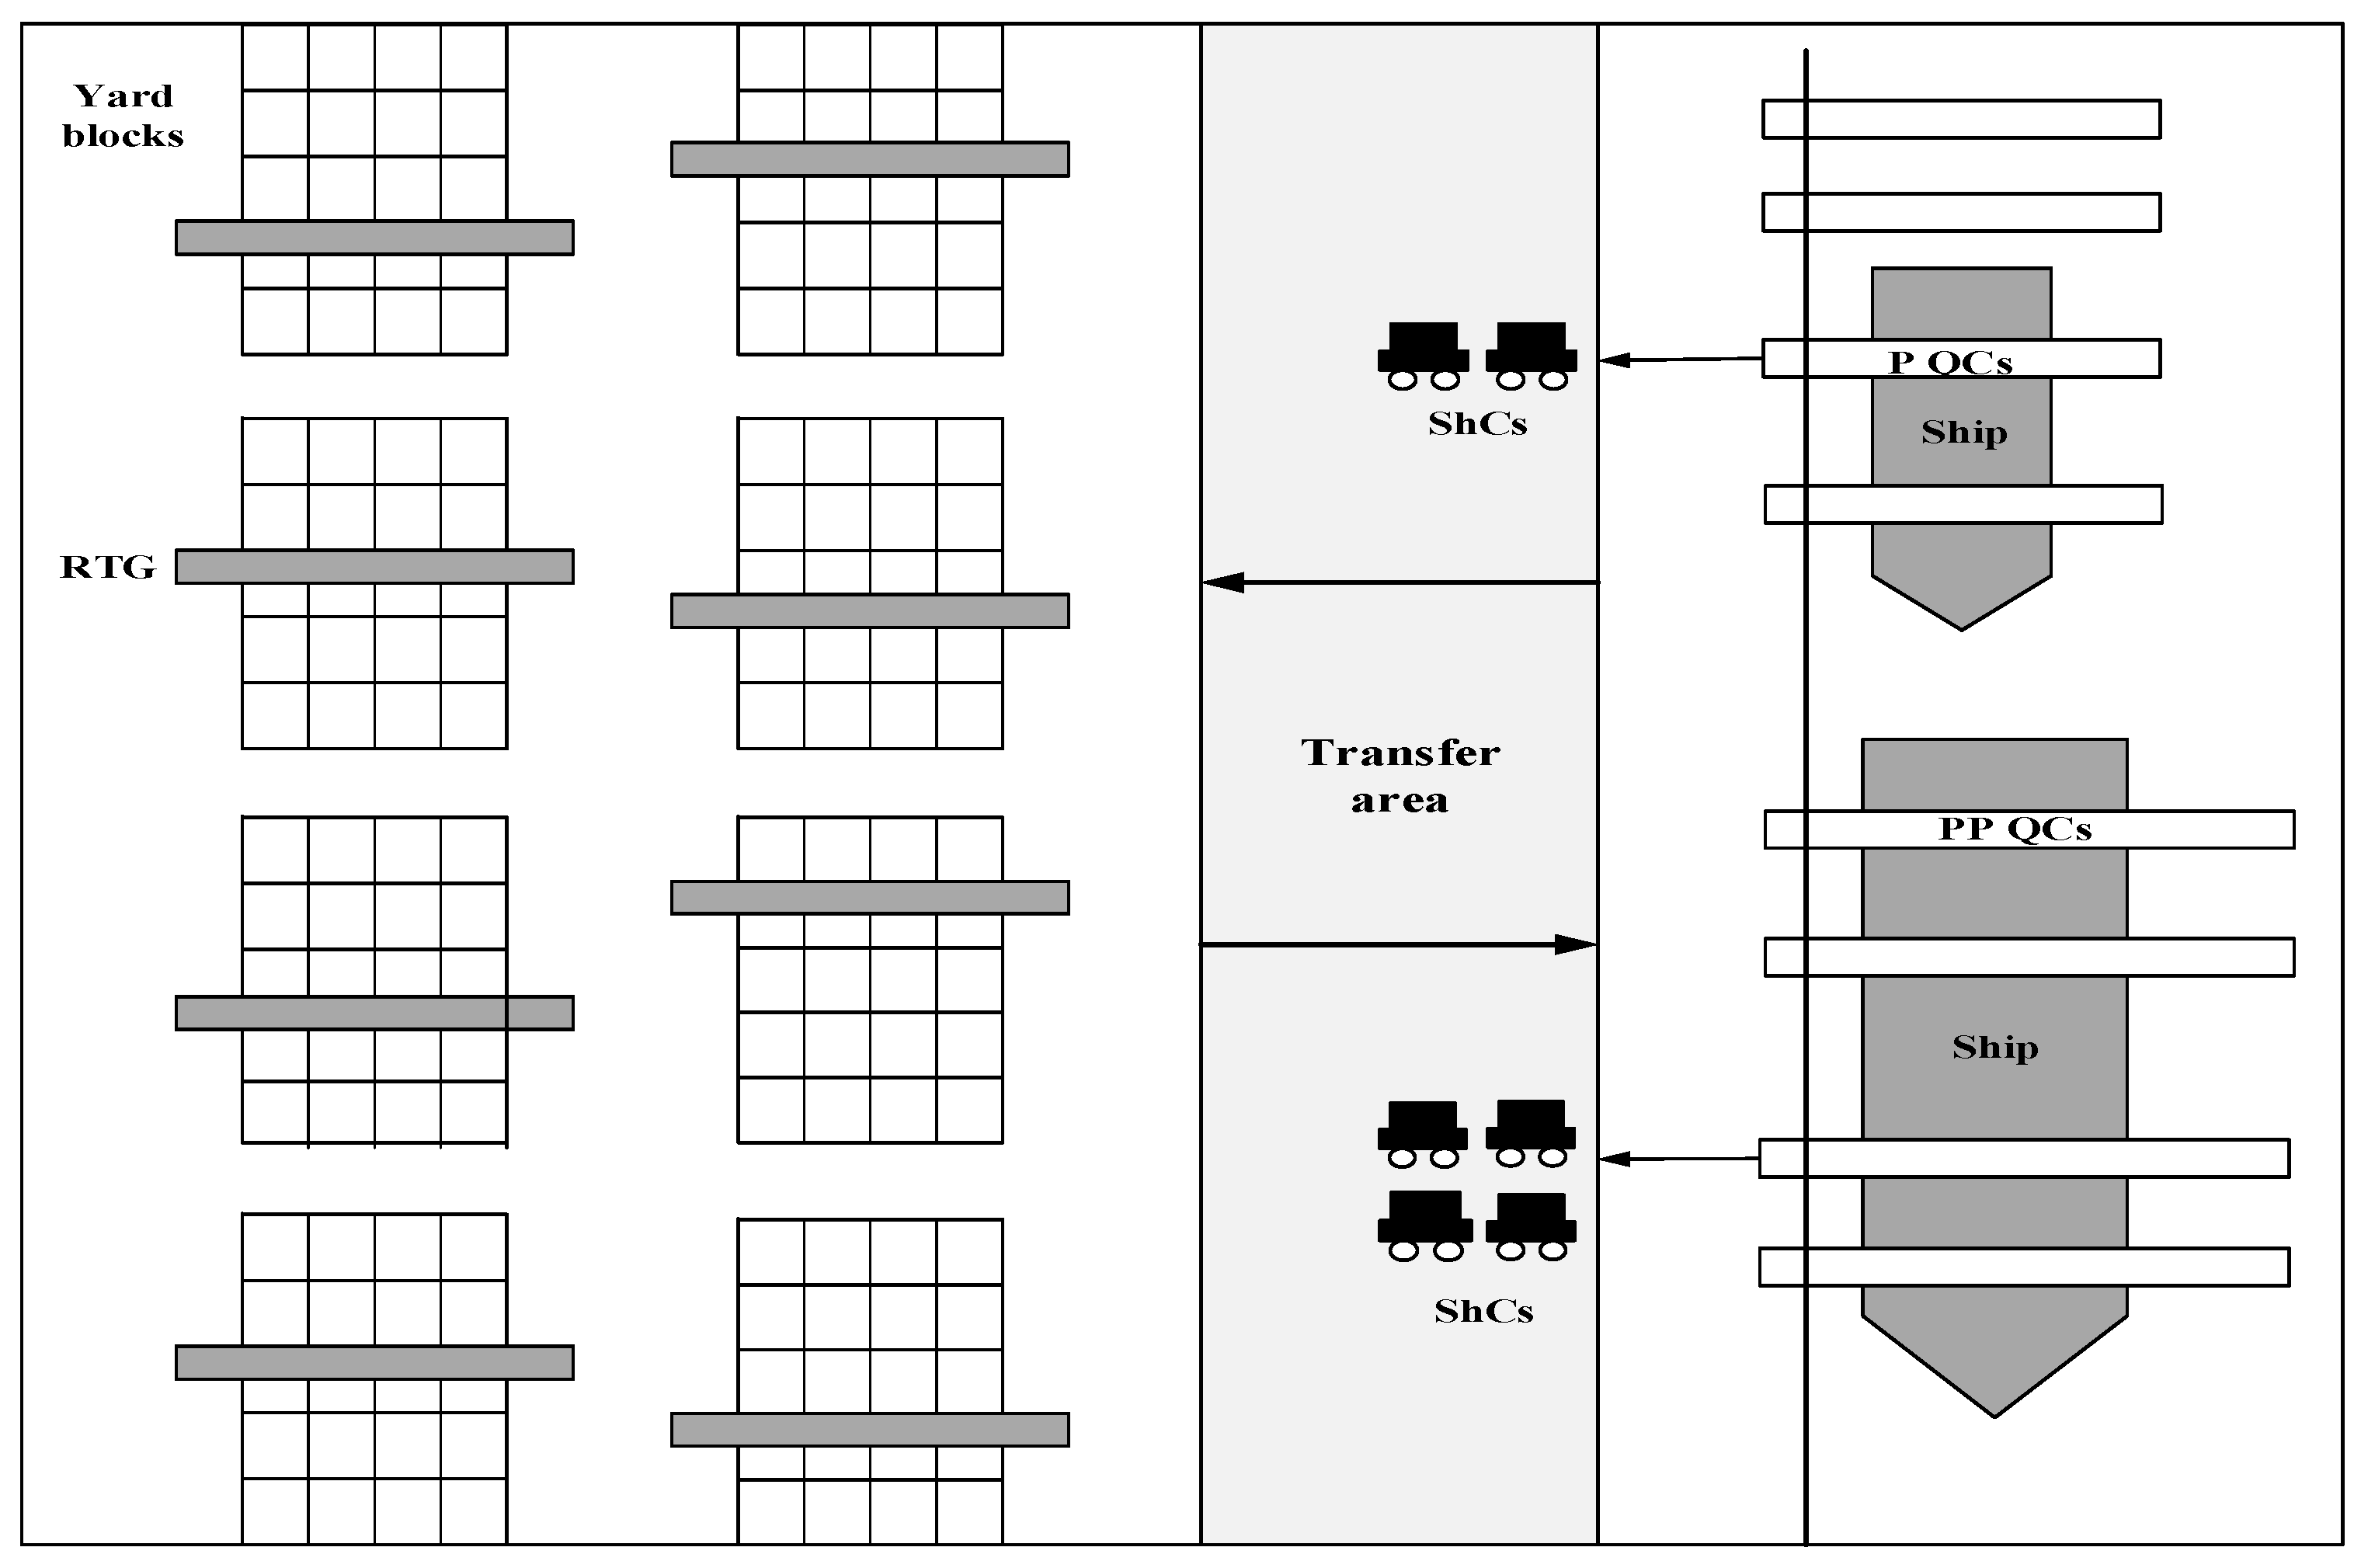
Figure 2.
Simulated terminal operations.

Figure 3.
Simulation performance sequence (light blue—characteristics of the 1st scenario; dark blue—characteristics of 7th scenario).
Figure 3.
Simulation performance sequence (light blue—characteristics of the 1st scenario; dark blue—characteristics of 7th scenario).
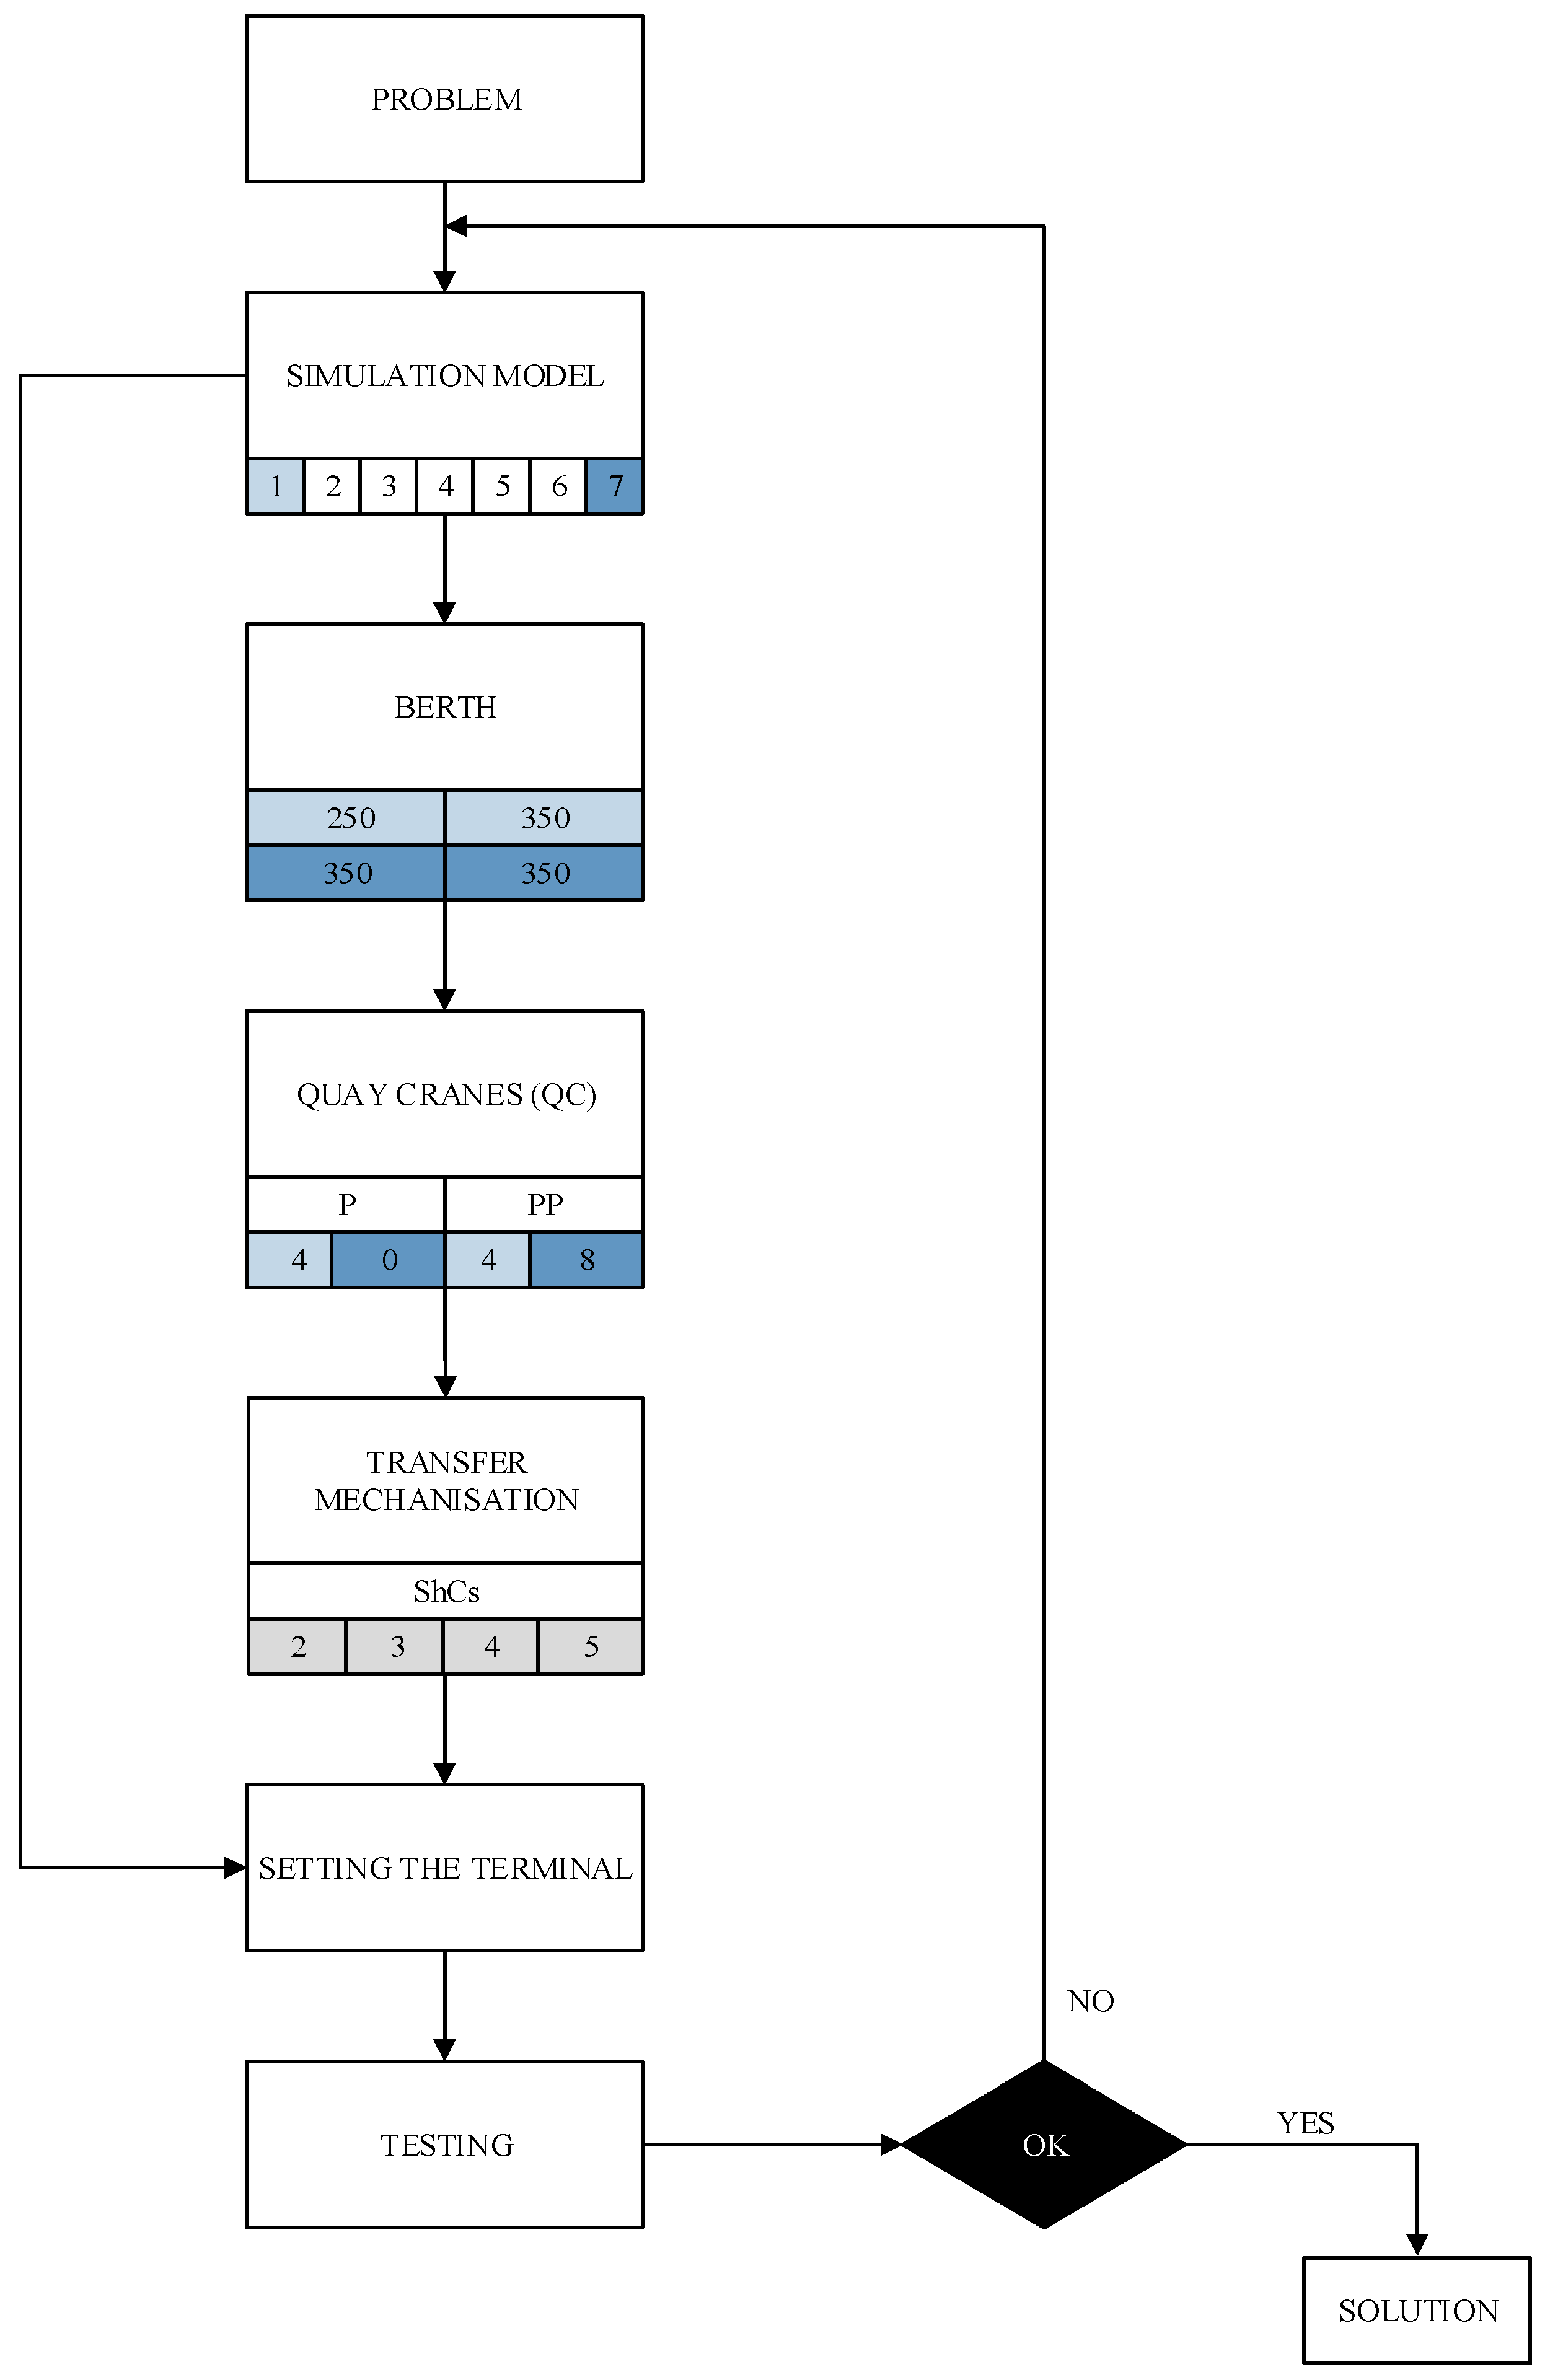
Figure 4.
Four simulation sets.
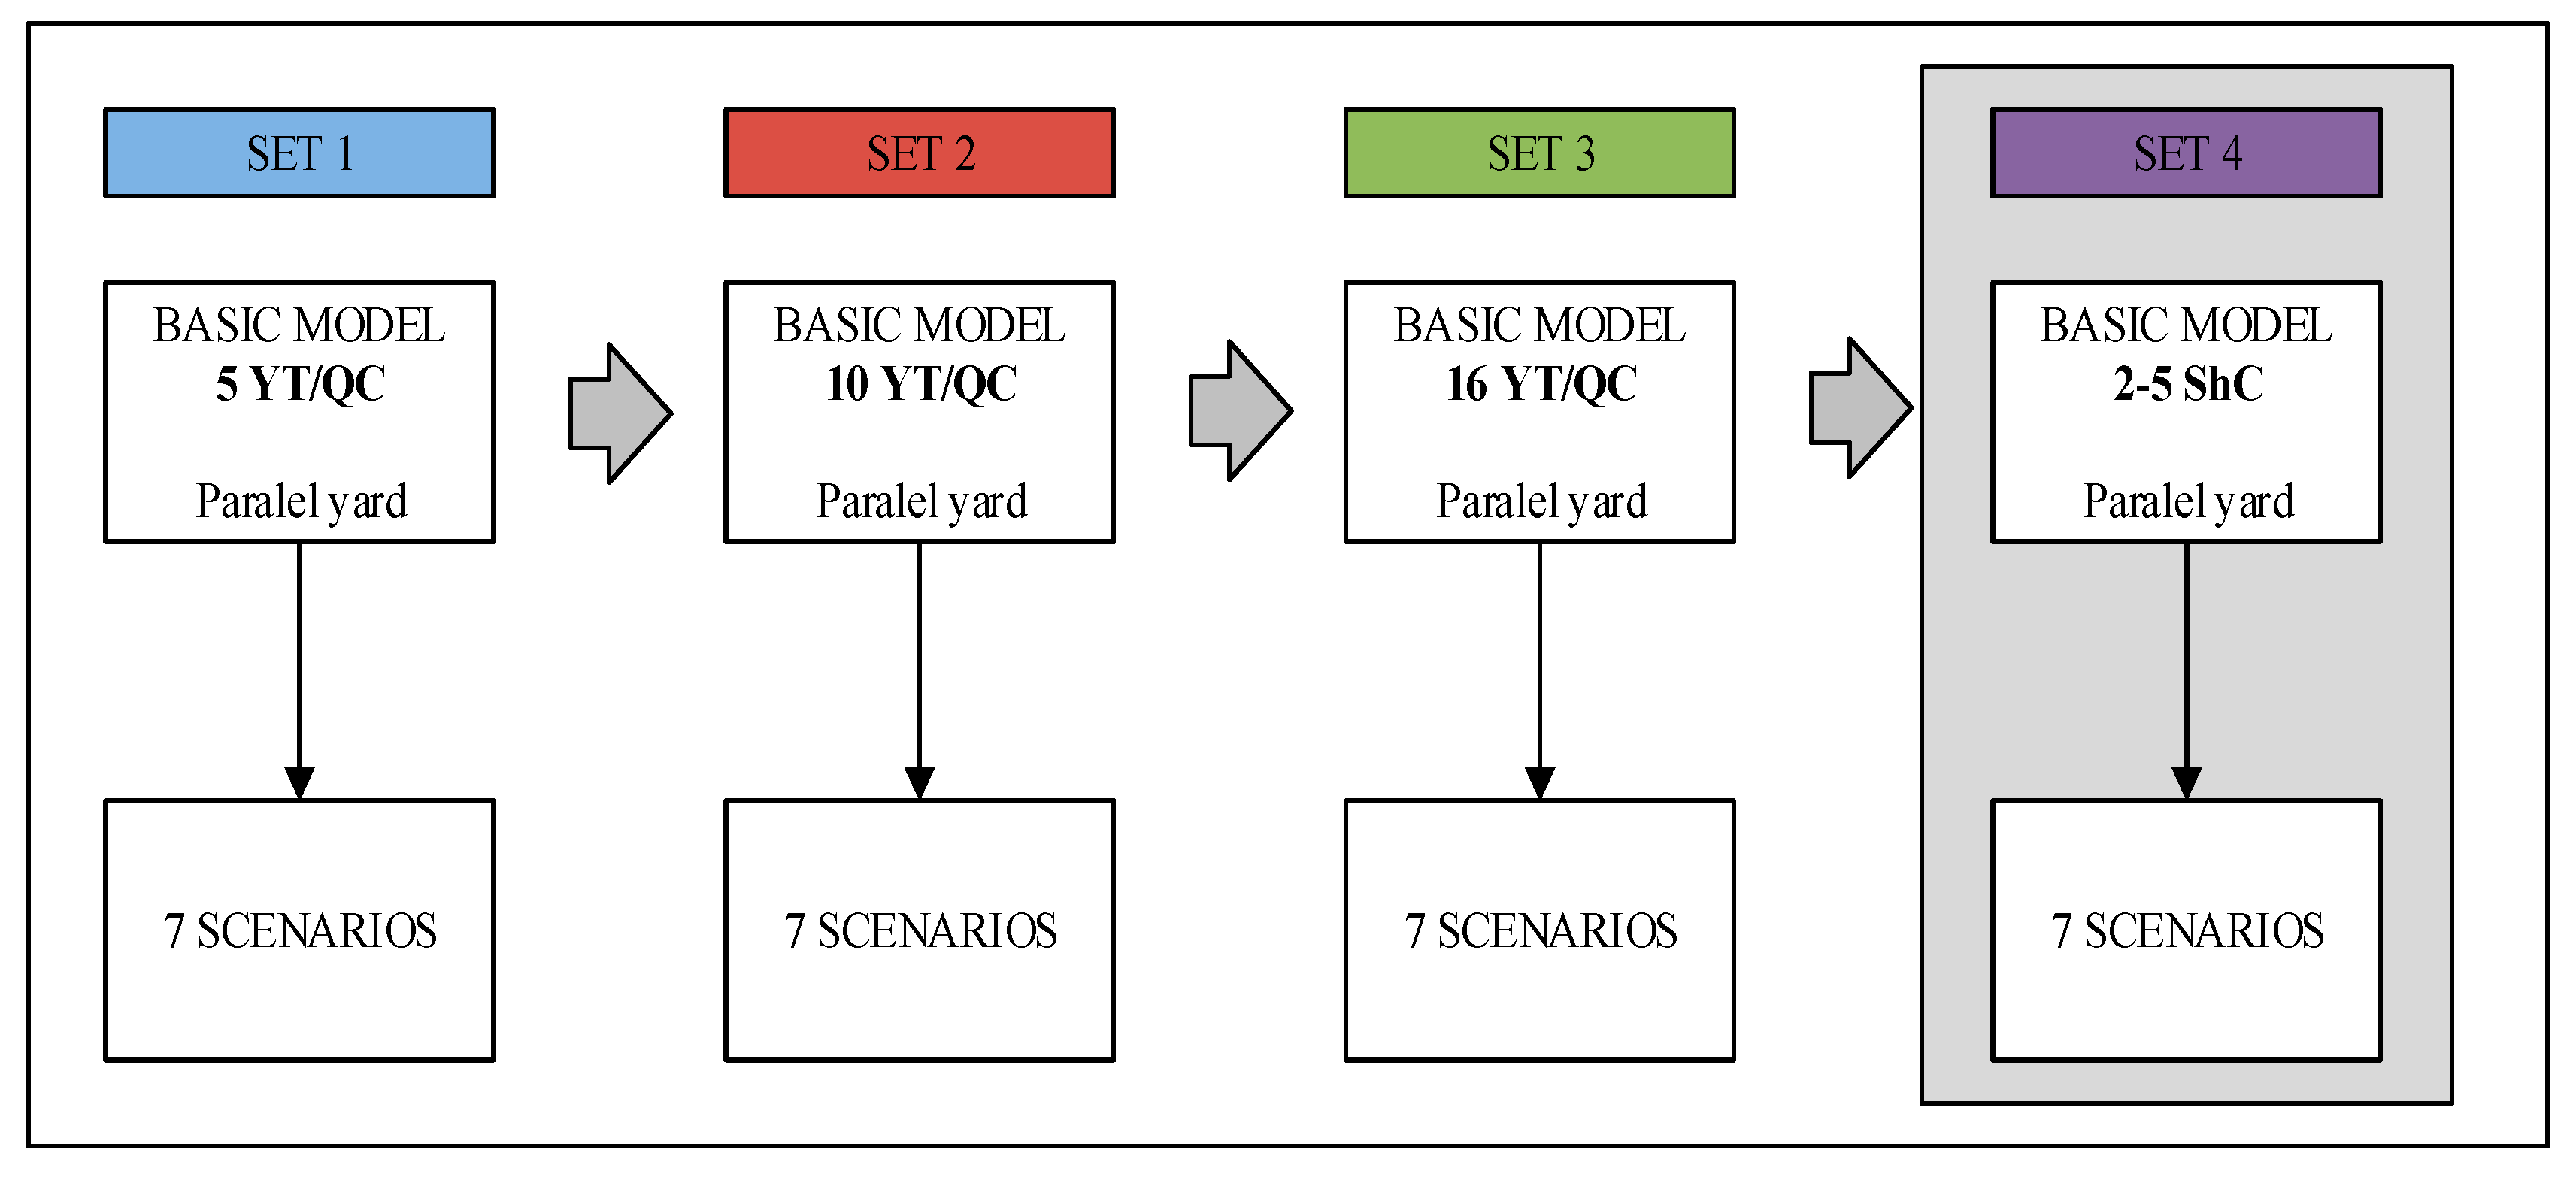
Figure 5.
Graphical view of the berth results.
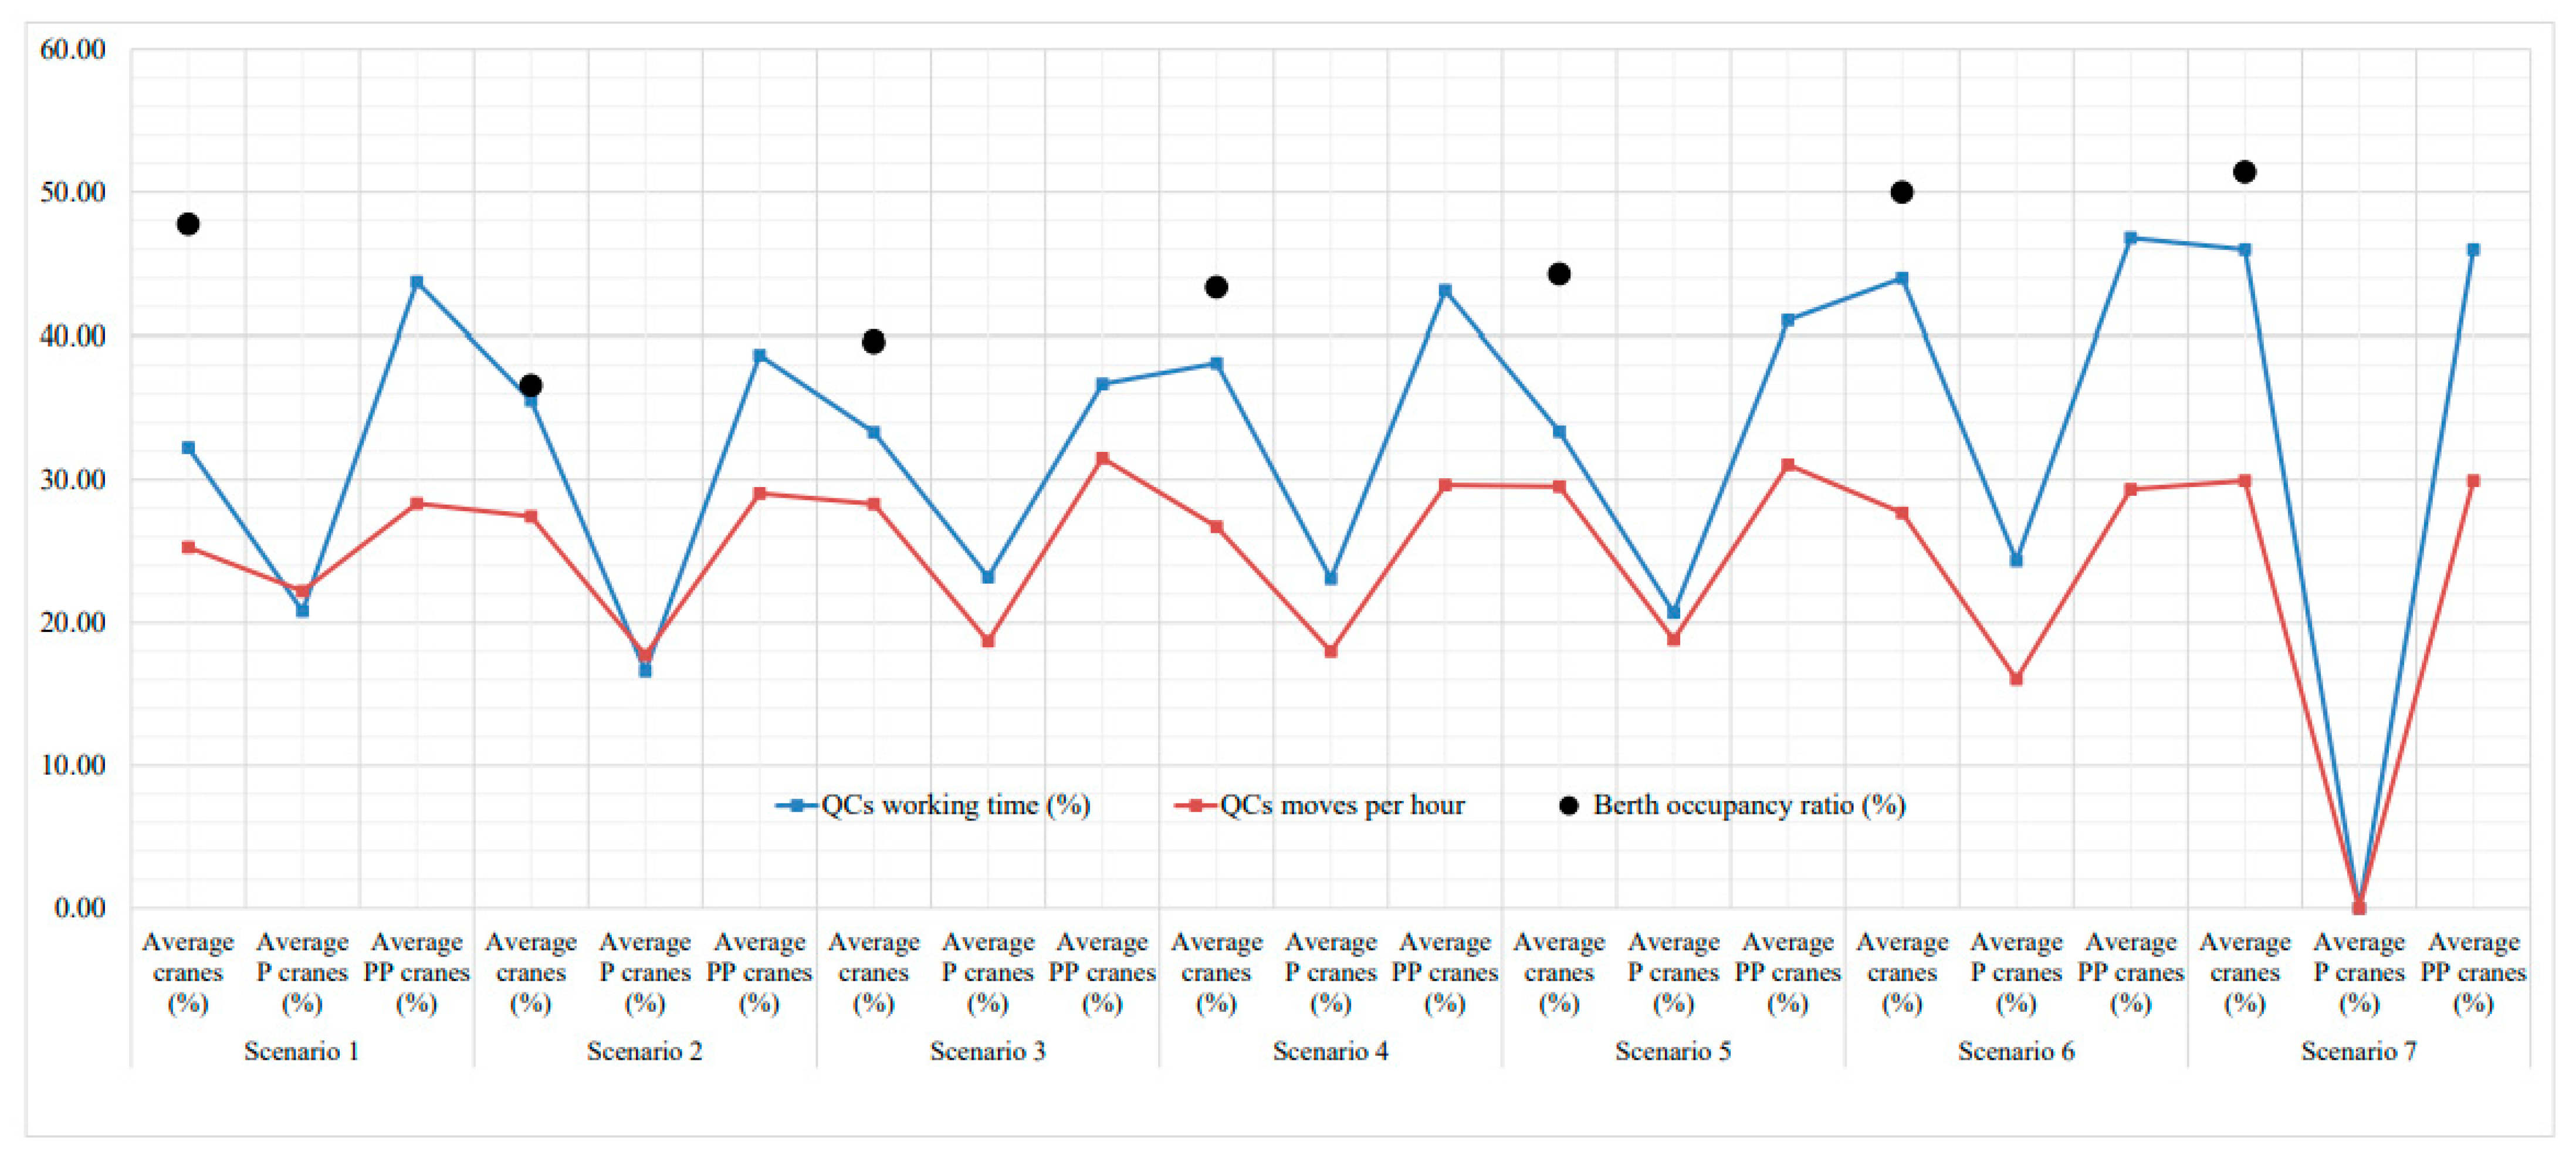
Figure 6.
Graphical view of the yard results.

Figure 7.
DST for the simultaneous acceptance of two post-Panamax ships at the terminal. * When deciding on factors: berth length and quay cranes, the minimum (3) and maximum (4) QCs per vessel must be taken into account, as well as the required distance between the two nearby QCs (25 m).
Figure 7.
DST for the simultaneous acceptance of two post-Panamax ships at the terminal. * When deciding on factors: berth length and quay cranes, the minimum (3) and maximum (4) QCs per vessel must be taken into account, as well as the required distance between the two nearby QCs (25 m).

Table 1.
The seven performed scenarios.
| Scenario | Annual Throughput (TEU) | Quay (m) | QCs | No. of Feeder and Panamax Services | No. of post-Panamax Services |
|---|---|---|---|---|---|
| 1 | 630,000 | 600 | 4 P + 4 PP | 9 | 4 |
| 2 | 630,000 | 700 | 2 P + 6 PP | 9 | 4 |
| 3 | 689,000 | 700 | 2 P + 6 PP | 7 | 5 |
| 4 | 768,000 | 700 | 2 P + 6 PP | 6 | 6 |
| 5 | 844,000 | 700 | 1 P + 7 PP | 5 | 7 |
| 6 | 899,000 | 700 | 1 P + 7 PP | 5 | 7 (higher throughput) |
| 7 | 990,000 | 700 | 0 P + 8 PP | 4 | 7 (higher throughput) |
P—Panamax (QC); PP—post-Panamax (QC).
Table 2.
Results of the fourth set of simulations.
| Scenarios | QCs Working Time (%) | QCs Moves per Hour | Berth Occupancy Ratio (%) | Average Yard Utilisation (%) | YCs Average Waiting Time (min) | ||
|---|---|---|---|---|---|---|---|
| P | PP | P | PP | / | / | / | |
| Scenario 1 | 20.81 | 43.71 | 22.21 | 28.34 | 47.75 | 44.67 | 3.78 |
| Scenario 2 | 16.60 | 38.71 | 17.72 | 29.05 | 36.61 | 44.81 | 4.56 |
| Scenario 3 | 23.19 | 36.71 | 18.69 | 31.52 | 39.60 | 47.71 | 4.39 |
| Scenario 4 | 23.07 | 43.13 | 17.99 | 29.64 | 43.34 | 47.75 | 4.78 |
| Scenario 5 | 20.70 | 41.06 | 18.80 | 31.06 | 44.27 | 49.25 | 5.60 |
| Scenario 6 | 24.33 | 46.79 | 16.04 | 29.34 | 49.98 | 56.95 | 7.99 |
| Scenario 7 | 0.00 | 45.98 | 0.00 | 29.93 | 51.40 | 54.09 | 6.79 |
P—Panamax (QC); PP—post-Panamax (QC).
Publisher’s Note: MDPI stays neutral with regard to jurisdictional claims in published maps and institutional affiliations. |
© 2021 by the authors. Licensee MDPI, Basel, Switzerland. This article is an open access article distributed under the terms and conditions of the Creative Commons Attribution (CC BY) license (https://creativecommons.org/licenses/by/4.0/).
Share and Cite
MDPI and ACS Style
Stojaković, M.; Twrdy, E. A Simulation Approach to the Definition of the Subsystems Parameters in Small Container Terminals. J. Mar. Sci. Eng. 2021, 9, 1023. https://doi.org/10.3390/jmse9091023
AMA Style
Stojaković M, Twrdy E. A Simulation Approach to the Definition of the Subsystems Parameters in Small Container Terminals. Journal of Marine Science and Engineering. 2021; 9(9):1023. https://doi.org/10.3390/jmse9091023
Chicago/Turabian StyleStojaković, Maja, and Elen Twrdy. 2021. "A Simulation Approach to the Definition of the Subsystems Parameters in Small Container Terminals" Journal of Marine Science and Engineering 9, no. 9: 1023. https://doi.org/10.3390/jmse9091023
Note that from the first issue of 2016, this journal uses article numbers instead of page numbers. See further details here.