1. Introduction
High demand for longevity and lowering costs, in the modern aircraft engine technology, have created new challenges for engineers in the field of engine development; it is necessary to investigate previously studied units under these new working conditions. For fuel systems, these developments led to a move away from the variable-stroke plunger pump, used as the main fuel pump, to the use of an external gear pump with a constant displacement mechanism. The use of a variable-stroke plunger pump allows for the adjustment of the chamber volume and matches the pump performance with the required fluid flow over the entire range of operating modes. The volume of the chamber in the external gear pump is constant and the fluid flow rate depends on rotation speed only. Such pump should be designed for a critical mode. Therefore, it’s design becomes significantly oversized for all other operating conditions. Such a pump and engine can be matched over the entire operating range in various ways. The most common method is by using a bypass valve to match the pump capacity to the required engine flow rate. As a result, the integral efficiency of the system is reduced. For more effective matching, it is necessary to remove the dependence of the pump speed on the gas turbine engine (GTE) rotor, which is made possible by using an independent (electric) drive instead of the drive box [
1].
In modern aircraft engine technology, there is a tendency to replace the mechanical drive of the external gear fuel pump with an electric one. Transitioning to gearbox-free engines will solve a number of issues associated with the linkage to the rotor speed of the gas turbine engine. This solution also makes it possible to reduce the size of the power plant as well as drag, pipeline numbers, and shaft lines, and to achieve an optimally designed system consistent for the whole operating range. The example of using a gearbox-free turbofan engine is given in the article [
2], where the authors showed the layout and advantages of a distributed pump system, confirmed by experimental data.
At the same time, using an electric drive will fix a number of issues associated with the specificity of the journal bearings (
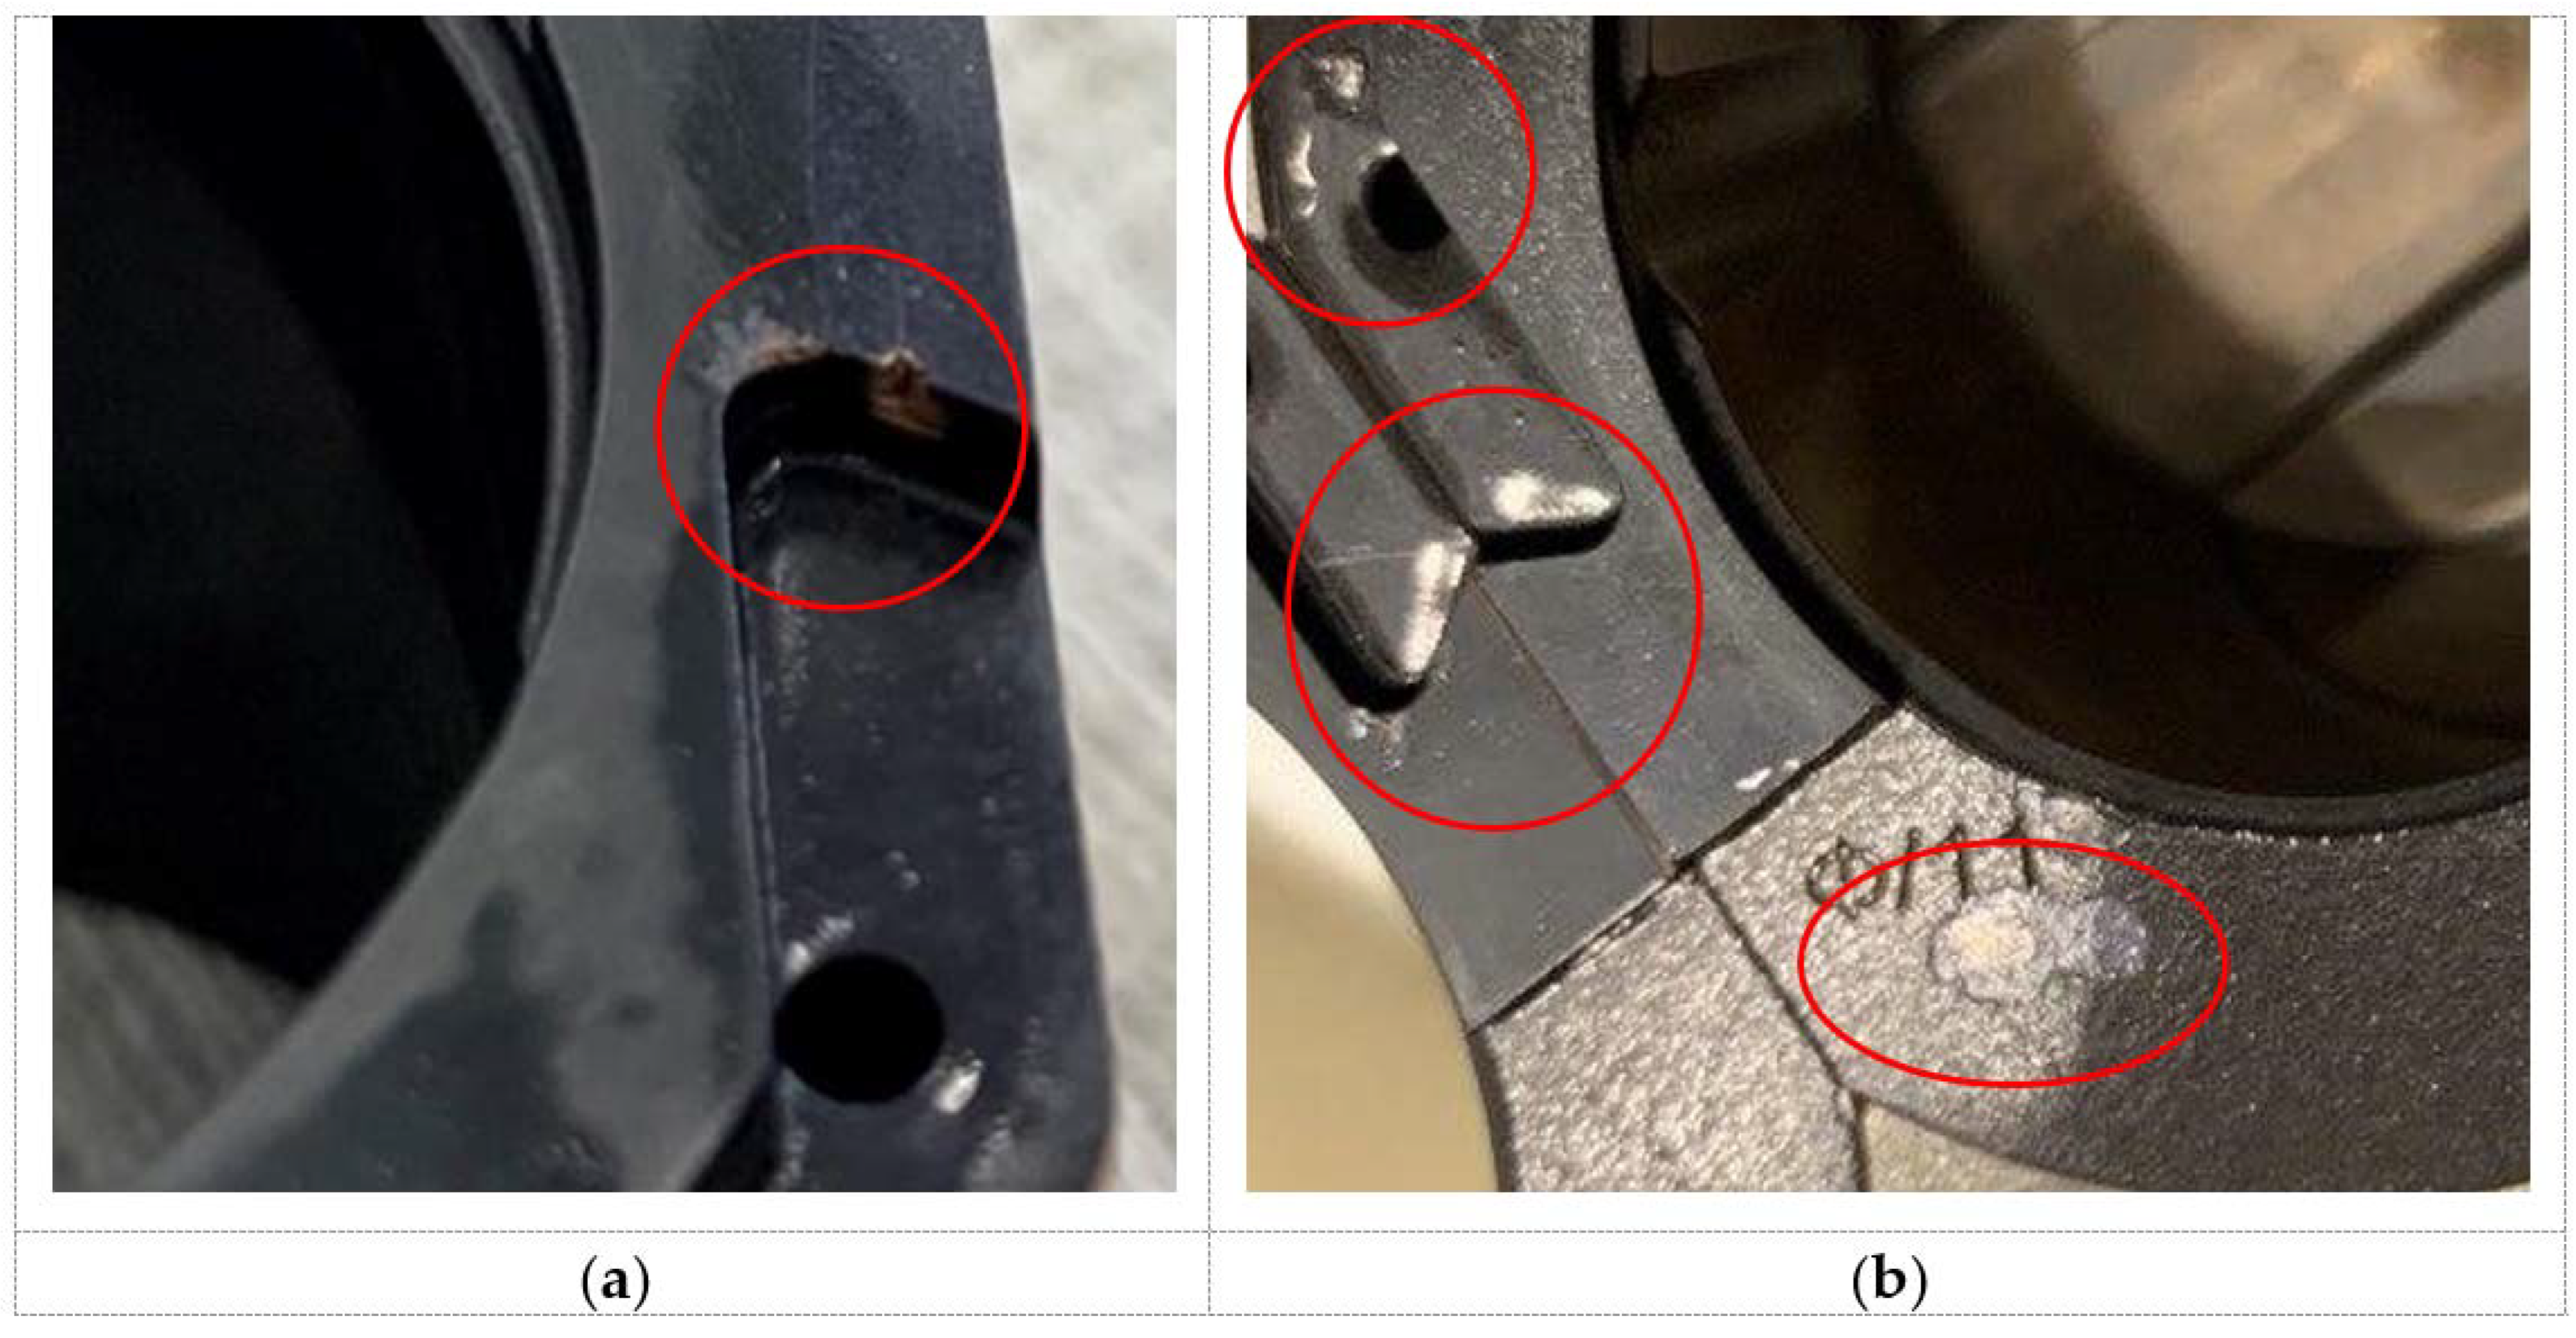
Figure 1), used on highly loaded fuel gear pumps. The low viscosity of the working fluid (kerosene), as well as the low peripheral speed of the gear shaft, cause the bearings to operate in a semi-dry friction mode, which significantly accelerates the wear of the bearing surfaces and reduces the life of the pump as a whole. However, applying an electric drive will help to increase peripheral speed up to oil film appearance mode. It will reduce wear on the bearings and consequently increase the life span of the pump.
The rotation speed has both positive and negative effects on the system. With an increase in the rotation speed of the gears, the fluid flow rate, and the fluid displacement rate in the meshing area increase. This will lead to an intensification of the cavitation process and, as a result, to excessive wear of the working chamber.
Figure 1 shows the cavitation wear of the thrust bearing surface, which appeared as a result of increasing rotor speed in the external gear fuel pump.
The figure clearly shows traces of wear on the thrust pads in the meshing area. This pump has been designed according to design methodologies for low gear rotation speeds, around 2000–4000 rpm. As a result, its use at higher rotation speeds (around 6000–8000 rpm) led to the occurrence and development of cavitation and damage to the surface of the thrust bearing. These facts became the basis for studying the working process in the meshing zone and assessing the possibility of increasing the gear rotation speed up to 10,000–20,000 rpm and adjusting the design methodology.
The fluid flow behavior in the chambers of an external gear pump can be studied in two ways: by mathematical models simulations and/or by using experimental ways. Modeling the workflow of the gear pump includes determining the operating parameters (velocity and pressure distribution) over the pump chambers. Several approaches exist today [
3] for external gear pump modeling but the most commonly used are computational fluid dynamics (CFD) and lumped parameters models. Results of simulation using modeling with lumped parameters for external gear pump have been shown in article [
4,
5,
6,
7,
8,
9]. This approach uses the division of pump volume for control volumes in which fluid properties are assumed uniform and dependent on time only. Thus, lumped parameter models cannot be used in the current investigation, as they do not take into account fluid flow behavior in the meshing zone in every chamber.
Computer fluid dynamics will provide more detailed modeling with velocity distribution in pump chambers for different gear positions. However, as with a prior model, this approach relies on assumptions depending on the goals of the research. To investigate the circular distribution of pressure and velocity, Szwemin, Campo, and Honga [
10,
11,
12,
13] used 2D models. This approach clearly showed the distribution of pressure for different positions and rotation velocity but did not sufficiently show the behavior of flow in the inlet and outlet chambers. Yoon [
14] used 3D models to study flow behavior. This article shows the pressure distribution in the circumferential direction for high-speed external gear fuel pump, as well as the accuracy of flow rate calculation compared with experimental data. Furthermore, this study has been done for a small-size gear pump, which does not have issues with cavitation in the meshing zone area and is less susceptible to wear and tear. In the article, Corvaglia [
14] showed a 3D simulation analysis result for the external gear oil pump. As a result, the distribution of pressure in the circumferential direction for different gears eccentricity was shown in comparison with experimental data. The gas fraction volume and pressure field were obtained for 2000 rpm.
Research using an experimental method is complicated by the peculiarities of the design and working process of gear pumps. Experimentally, it is possible to investigate the pressure distribution around the circumference of the working chamber and the pressure in the cavities of the face-pressure system [
15,
16], but not in the meshing zone.
Most of the listed researchers have experimentally proved the pressure distribution for the average chamber value, but the current study requires the determination of a more precise behavior in the meshing zone.
Analysis of existing designs shows that the process that occurs in the meshing zone has the greatest impact on the pump operation [
17], especially if the design of a closed volume-displacing system is inaccurate. This is caused by the appearance of areas of intense cavitation due to high velocities when closing and opening the closed volume in the meshing zone.
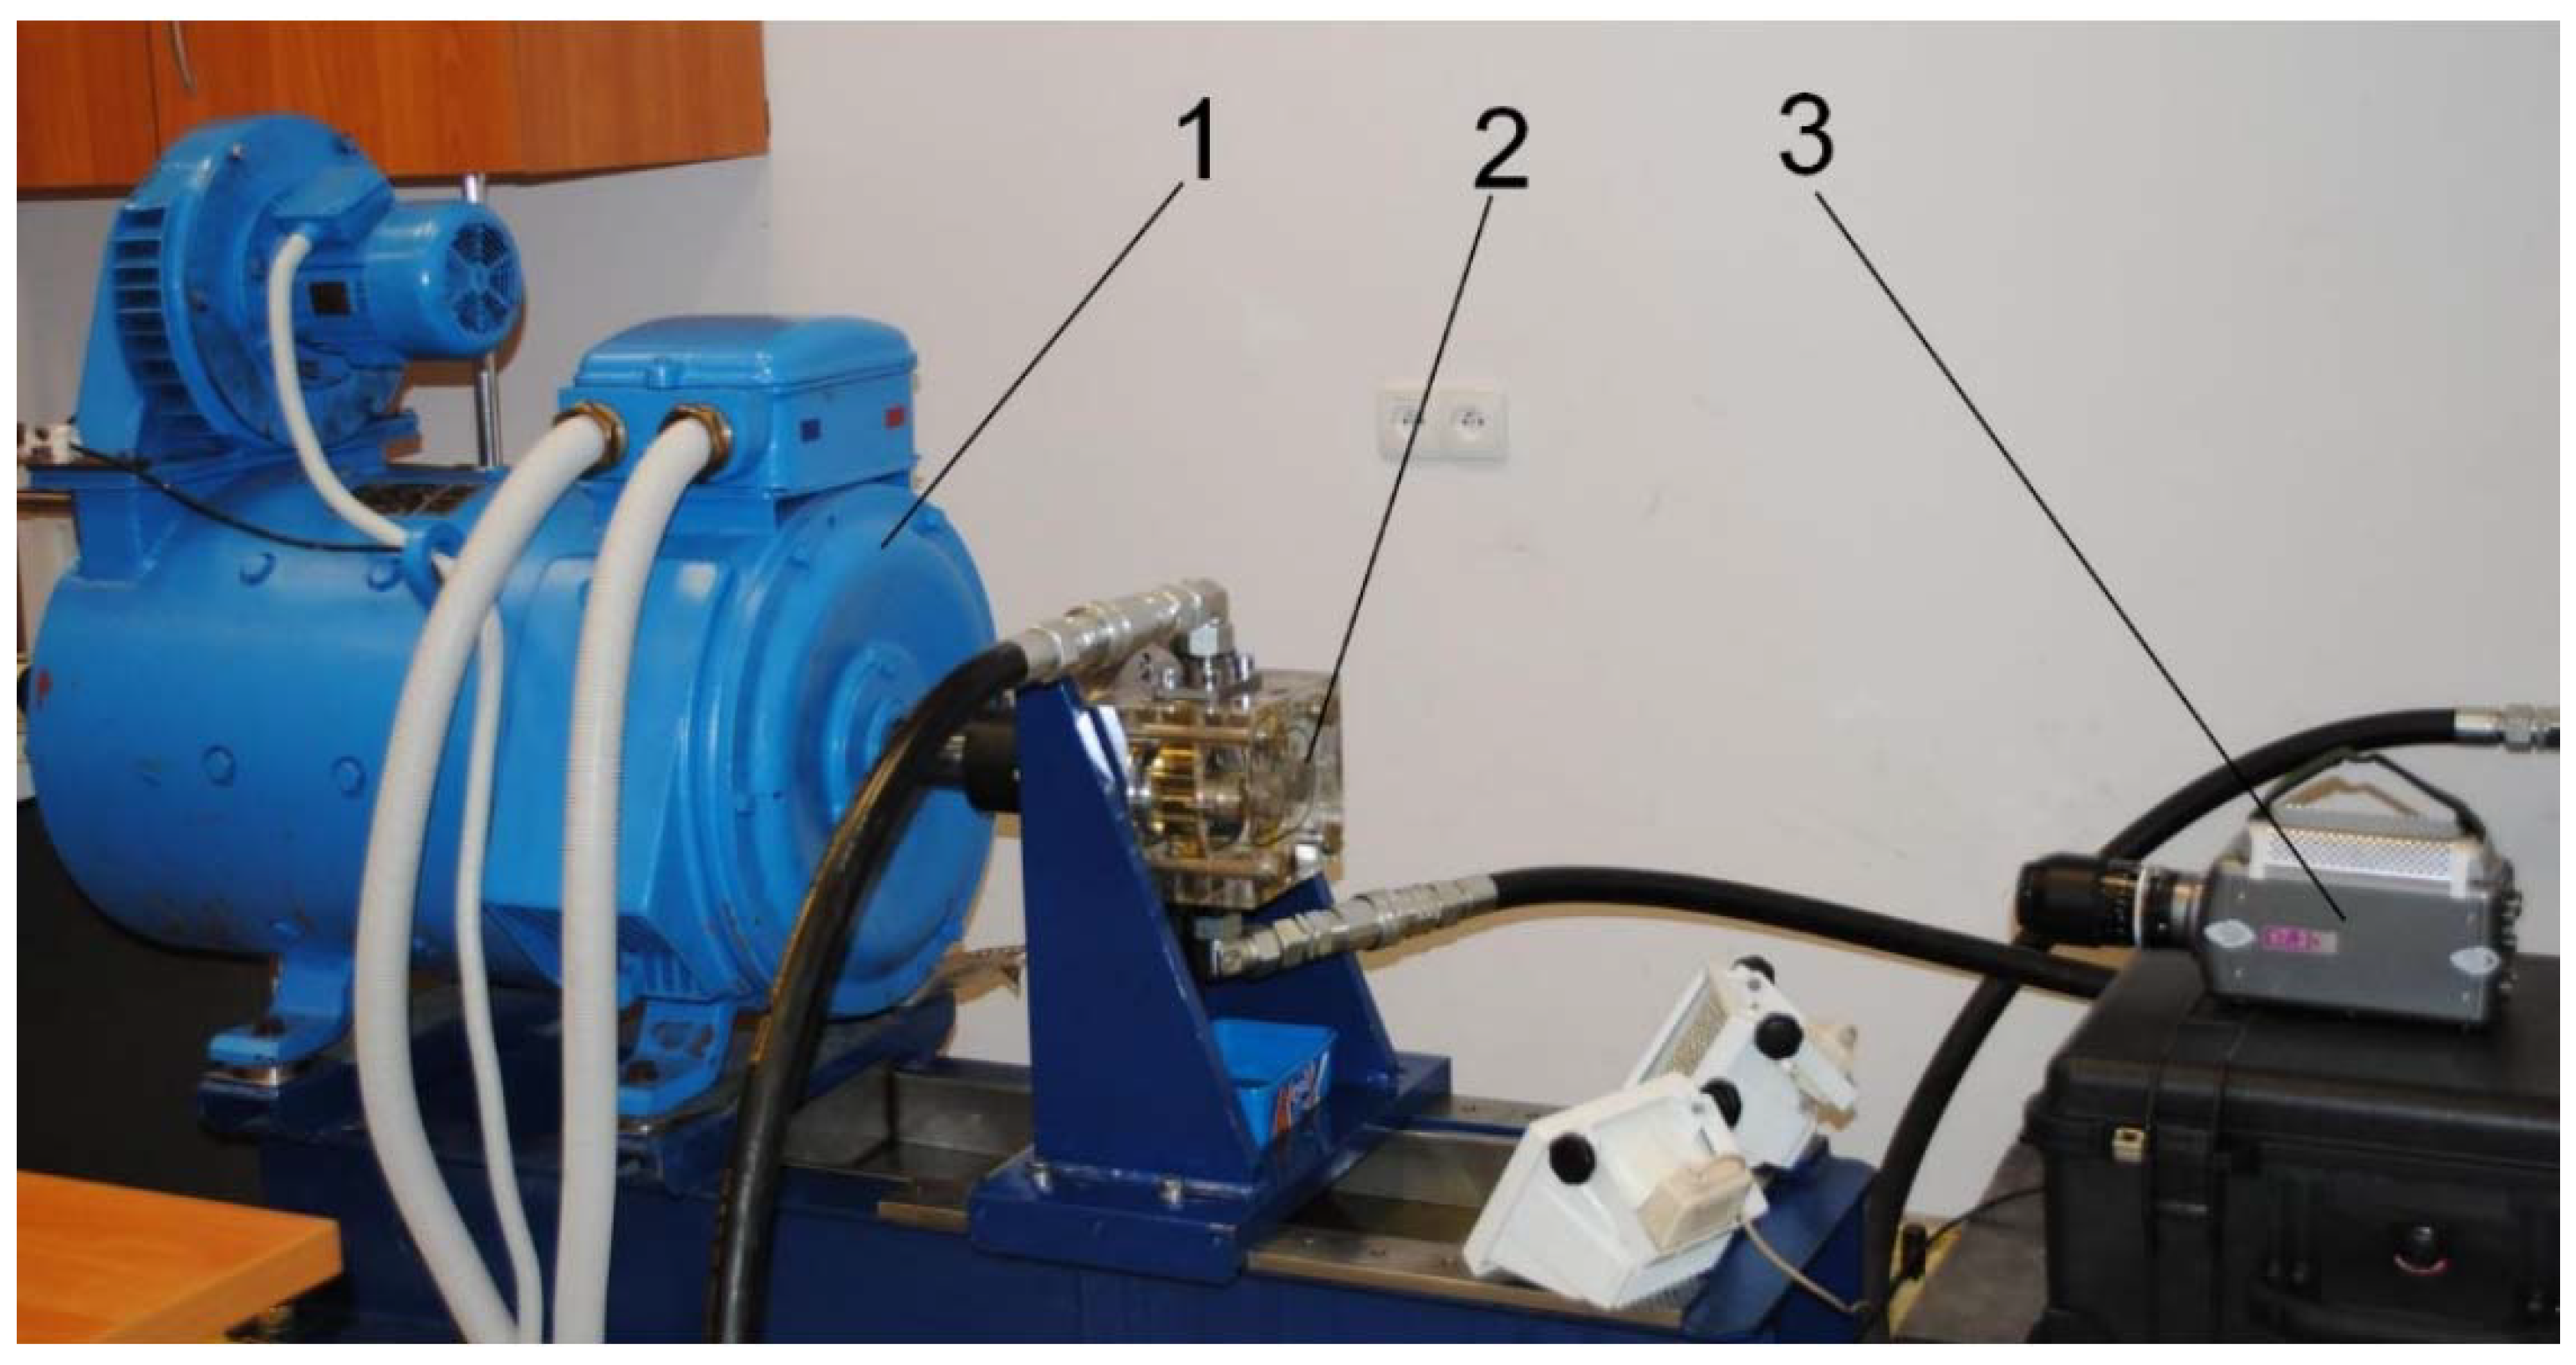
High-speed video (movie) filming to record the nature of the fluid flow can be an informative method to study the behavior of the fluid in the meshing zone. This approach does not allow us to determine absolute values of pressure and forces at a specific moment in time, but it allows us to verify the CFD model of fluid flow for further extrapolation to other sizes and operating conditions. The method and results of such a study were described in [
18]. To implement the study, an external gear pump with a transparent housing cover was made,
Figure 2.
The results of the experiment are shown as a video of the fluid motion in the gear meshing zone. The video detects the dynamics of the cavitation zone appearance at different operating modes (in terms of speed, inlet pressure, and working fluid temperature). Therefore, in order to verify the calculated CFD model of a high-pressure fuel pump, it was proposed to perform a CFD calculation of the model based on a low-pressure oil pump and to compare the visualization of the experimental and simulation results.
The purpose of this study is to verify the model of fluid flow in the meshing zone based on the oil pump for further transition to the fuel pump model and analysis of the working process in it. The achievement of this goal is divided into several main stages:
Preparation of the geometric model and calculation of the geometric parameters of the pump;
Building a computational grid to perform the calculation of the fluid dynamics in the working cavity;
Setting up the solver and selecting the turbulence model;
Analysis of the results and comparison with experimental data;
Perform the calculation for the fuel external gear pump.
2. Geometric and Calculation Models
Construction of the geometric model is performed according to the parameters of the experimental sample [
18]. To solve the problem, it is assumed that the processes occurring in the meshing zone and in the working cavity are uniformly distributed over the height of the gear (boundary effects are not considered). This allowed considering the model in 2-dimensional formulation, simplifying the computational model, and reducing the computational power required.
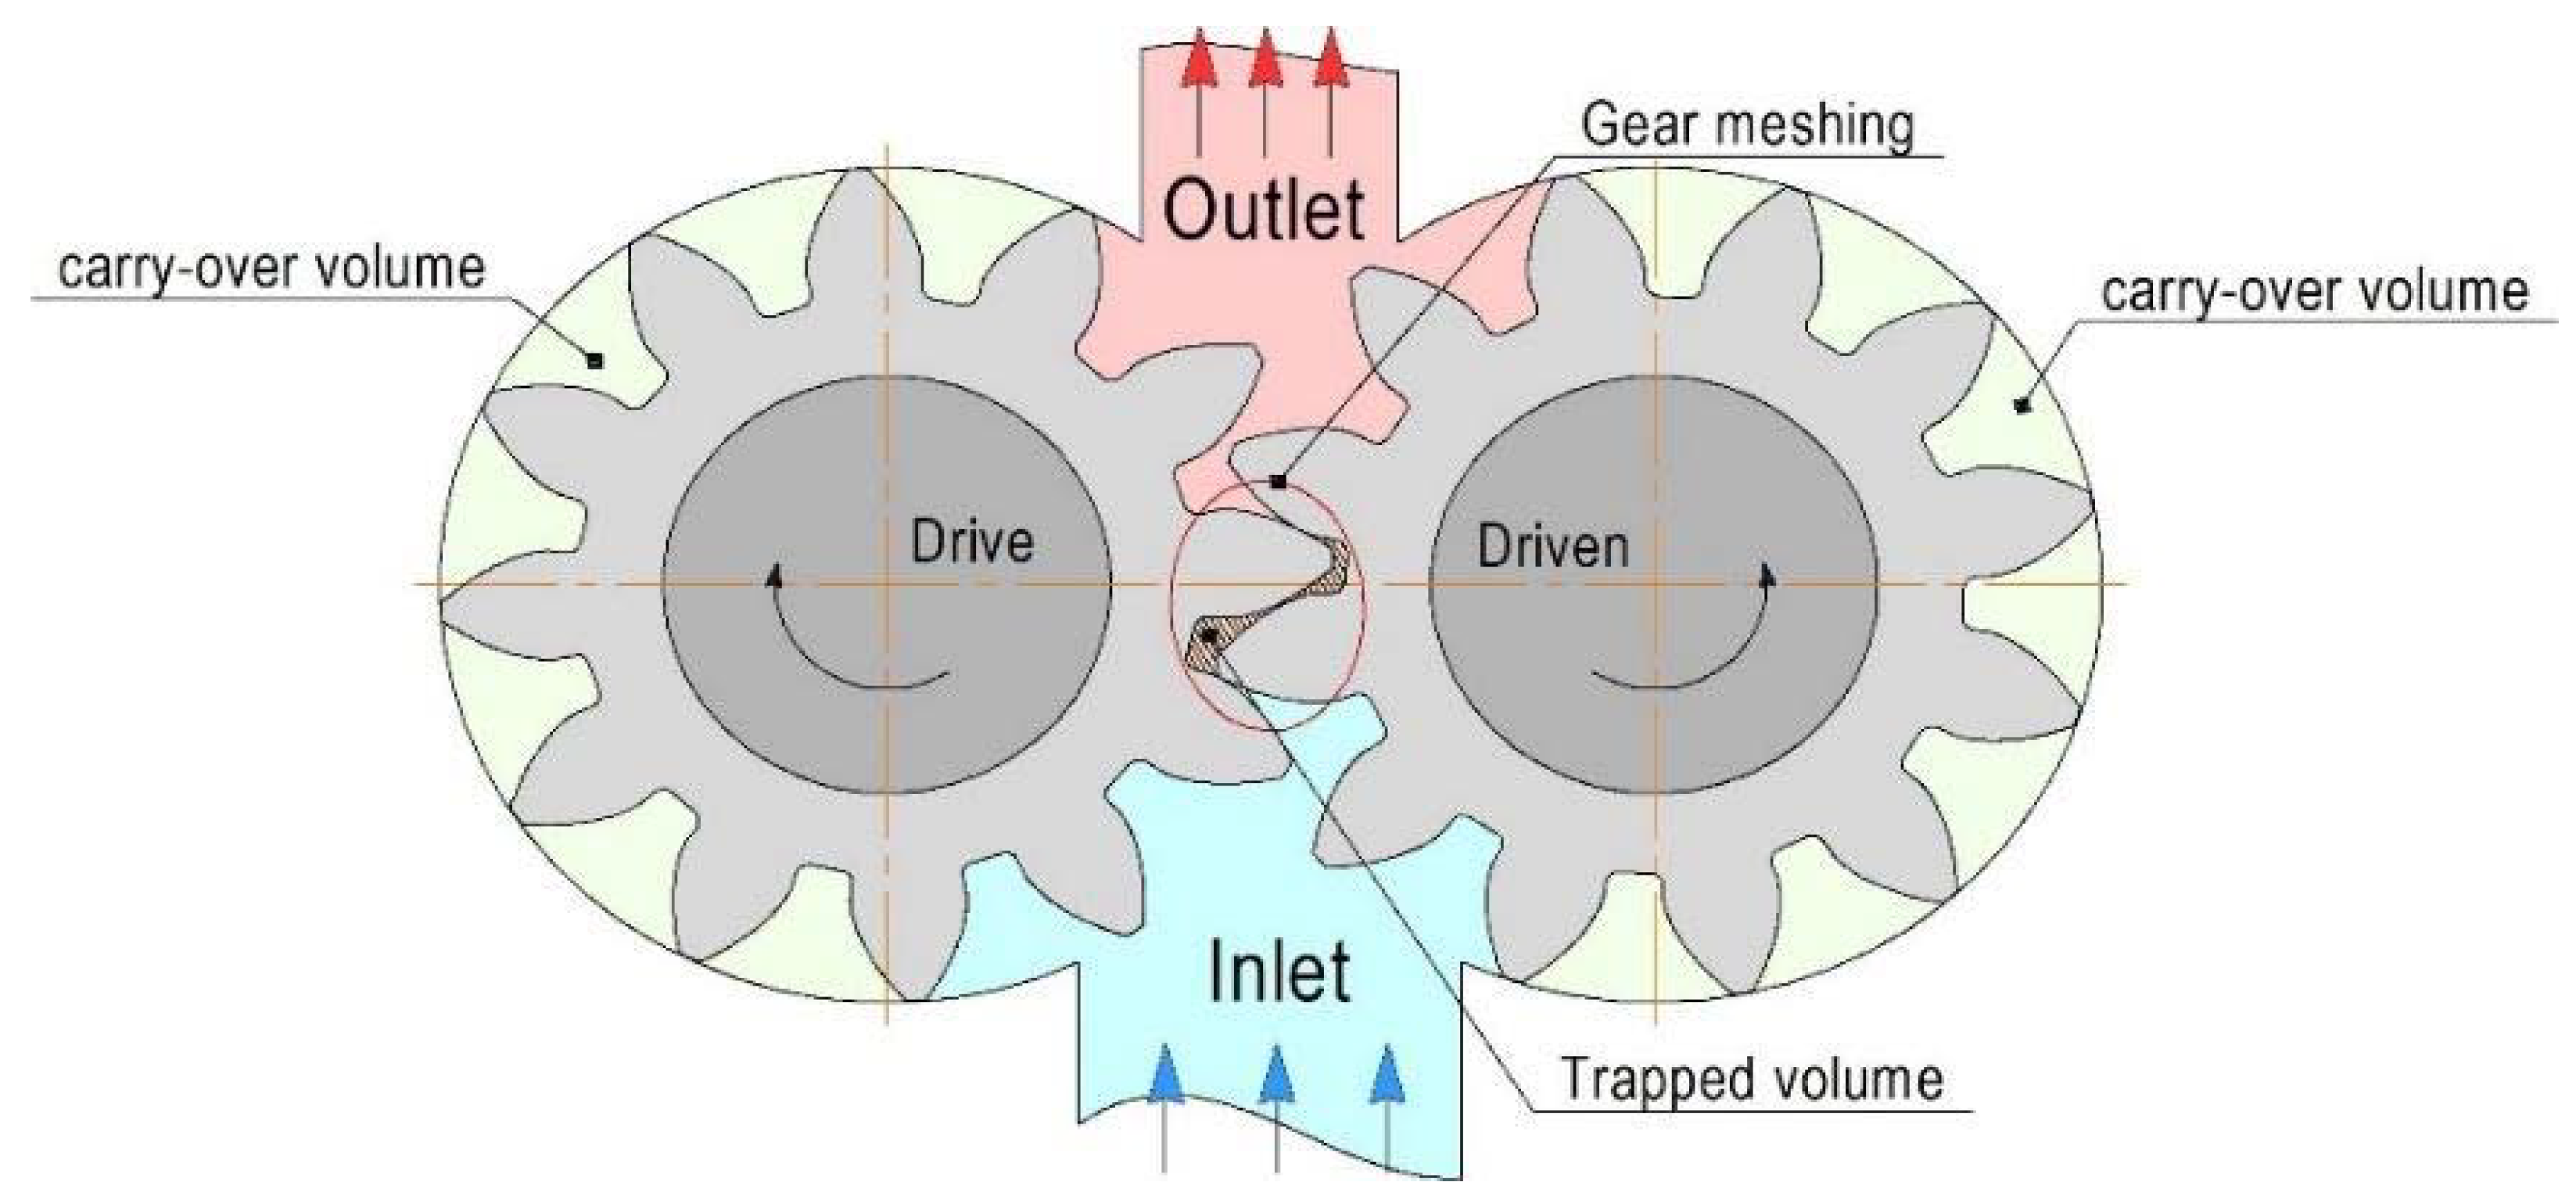
Figure 3 shows the meridional cross-section of the main elements of the pump working cavity, considered in this study.
The model consists of a drive and driven gears, pump inlet (suction), pump outlet (supply), and housing. The construction of a geometric model of a gear pump has a specific trait: the workflow in the pump unit and the model, are affected by the deviation of the geometric dimensions of the pump. To obtain a valid calculation model of the pump, it is necessary to measure the manufactured pump and use the obtained dimensions to construct the actual pump geometry. However, there is no possibility of measuring the experimental pump, so the construction of the geometry of pumping unit elements is made in the middle of the tolerance field of a similar pump size. The relative positioning of the gears and clearances between the housing and the gears are chosen in the middle of the tolerance field (
Table 1). The minimum clearance in the meshing is set as the minimum possible, which does not affect the result of the calculation and allows to perform the calculation with the available computing power.
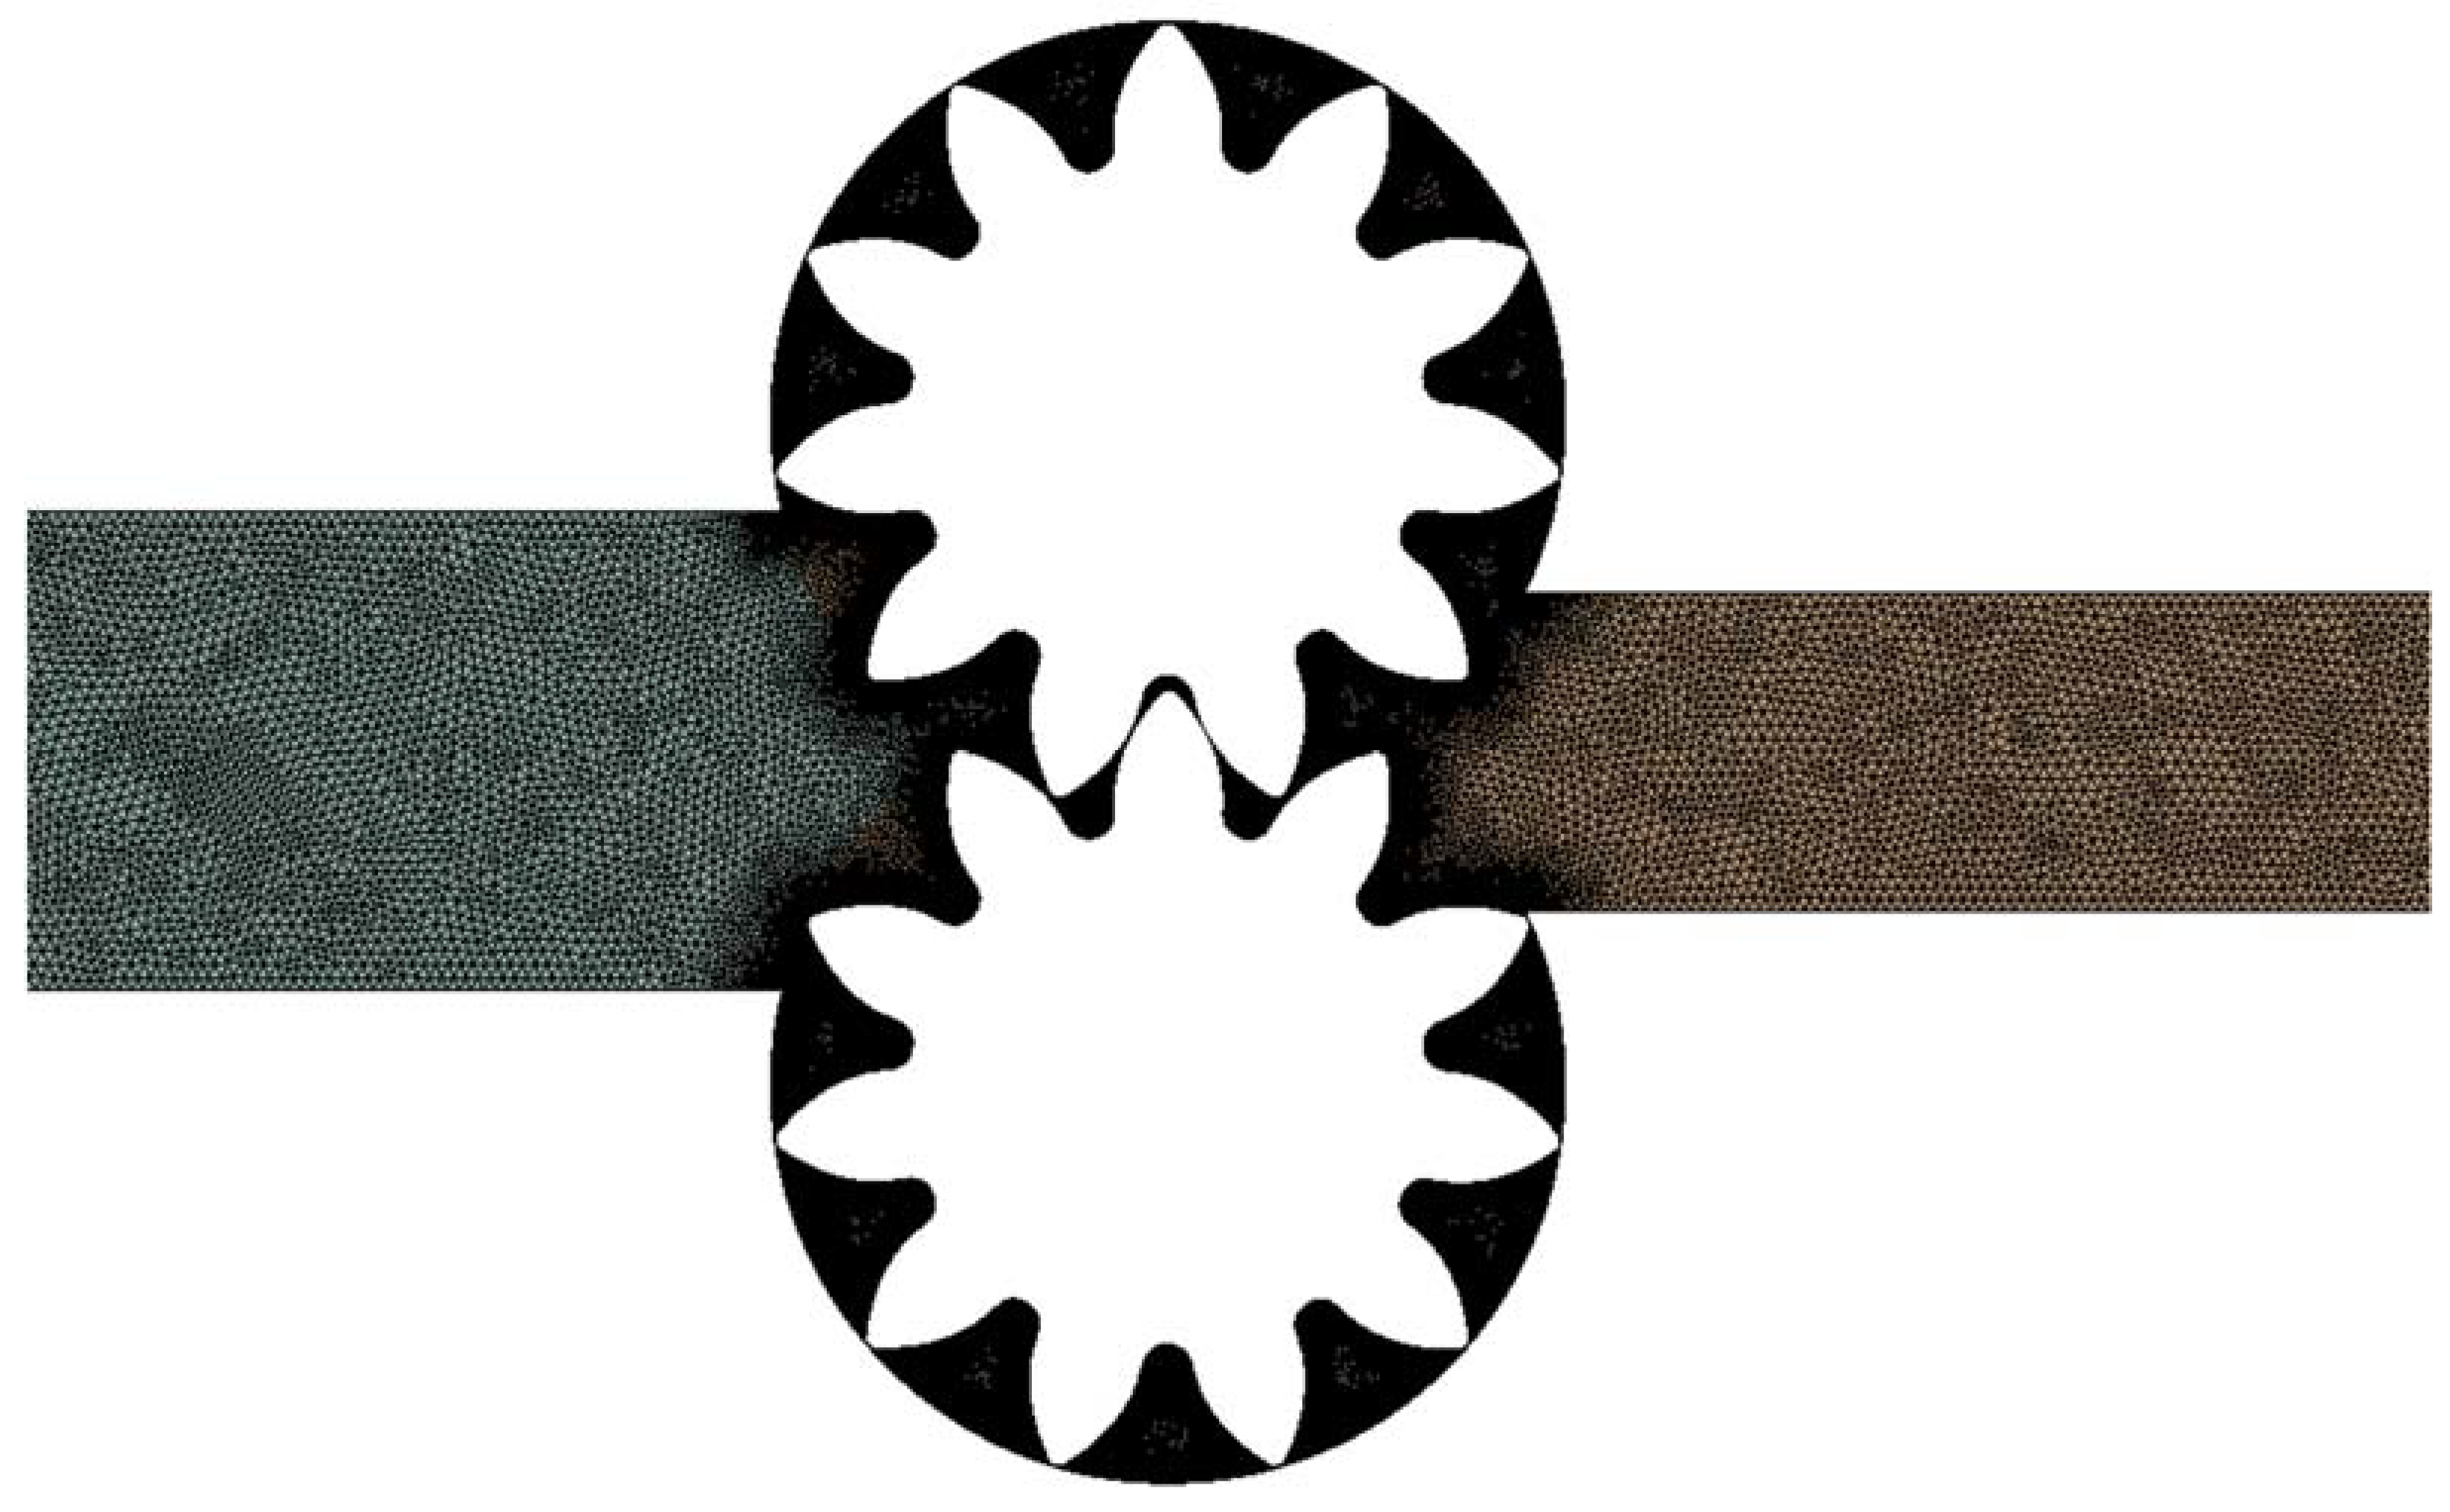
Preparing the computational domain is an important step in CFD modeling. In such tasks, the question of the mesh quality, or rather the size of the element is crucial because the calculation is performed in small gaps of the order of 0.1 mm.
For this purpose, the construction of the mesh was implemented considering the specificity of the pump geometry. The mesh in the moving zone was set on the assumption that there should be three elements in the meshing zone, within the gap [
19]. Element size outside the meshing zone is increased.
Triangular elements are chosen to describe the computational domain. The size of the elements in the meshing area and on the teeth surface is set to 0.01 mm, in the input and output areas the size of the elements is 1 mm. The results of meshing the computational domain are shown below (
Figure 4). Typically, a sensitivity analysis is performed on the parameters of interest but the current study used fluid behavior as the main result. Sensitivity analysis of mesh size cannot be performed because we cannot say which value we expect. That is why the minimal gap value was chosen based on computation capacity.
The Stress Blending (SBE)/Shielded DES turbulence model was selected for the calculation. In article [
20], the authors give a detailed description and comparison of the chosen turbulence model with others. They show that this model allows us to describe the work process (workflow) with the optimal ratio of accuracy and computing power consumption. The simulation has been done in a transient mode [
21]. Time steps for different liquid types and rotational speeds were around 4 × 10
−5 s–4 × 10
−7 s. Simulation steps were chosen based on dynamic mesh update and results convergence. Higher values of simulation steps lead to distortion of the shape of the elements and mesh quality which, in a few steps, lead to calculation errors. The max value of y+ on the meshing zone for the oil pump equals 10.
3. Results
The fluid flow analysis divides the meshing process into five characteristic gear positions:
Position (a): start of the drive and driven gear teeth meshing;
Position (b): closed volume appears;
Position (c): compression and reaching a minimum enclosed volume;
Position (d): closed volume increase;
Position (e): closed volume opening.
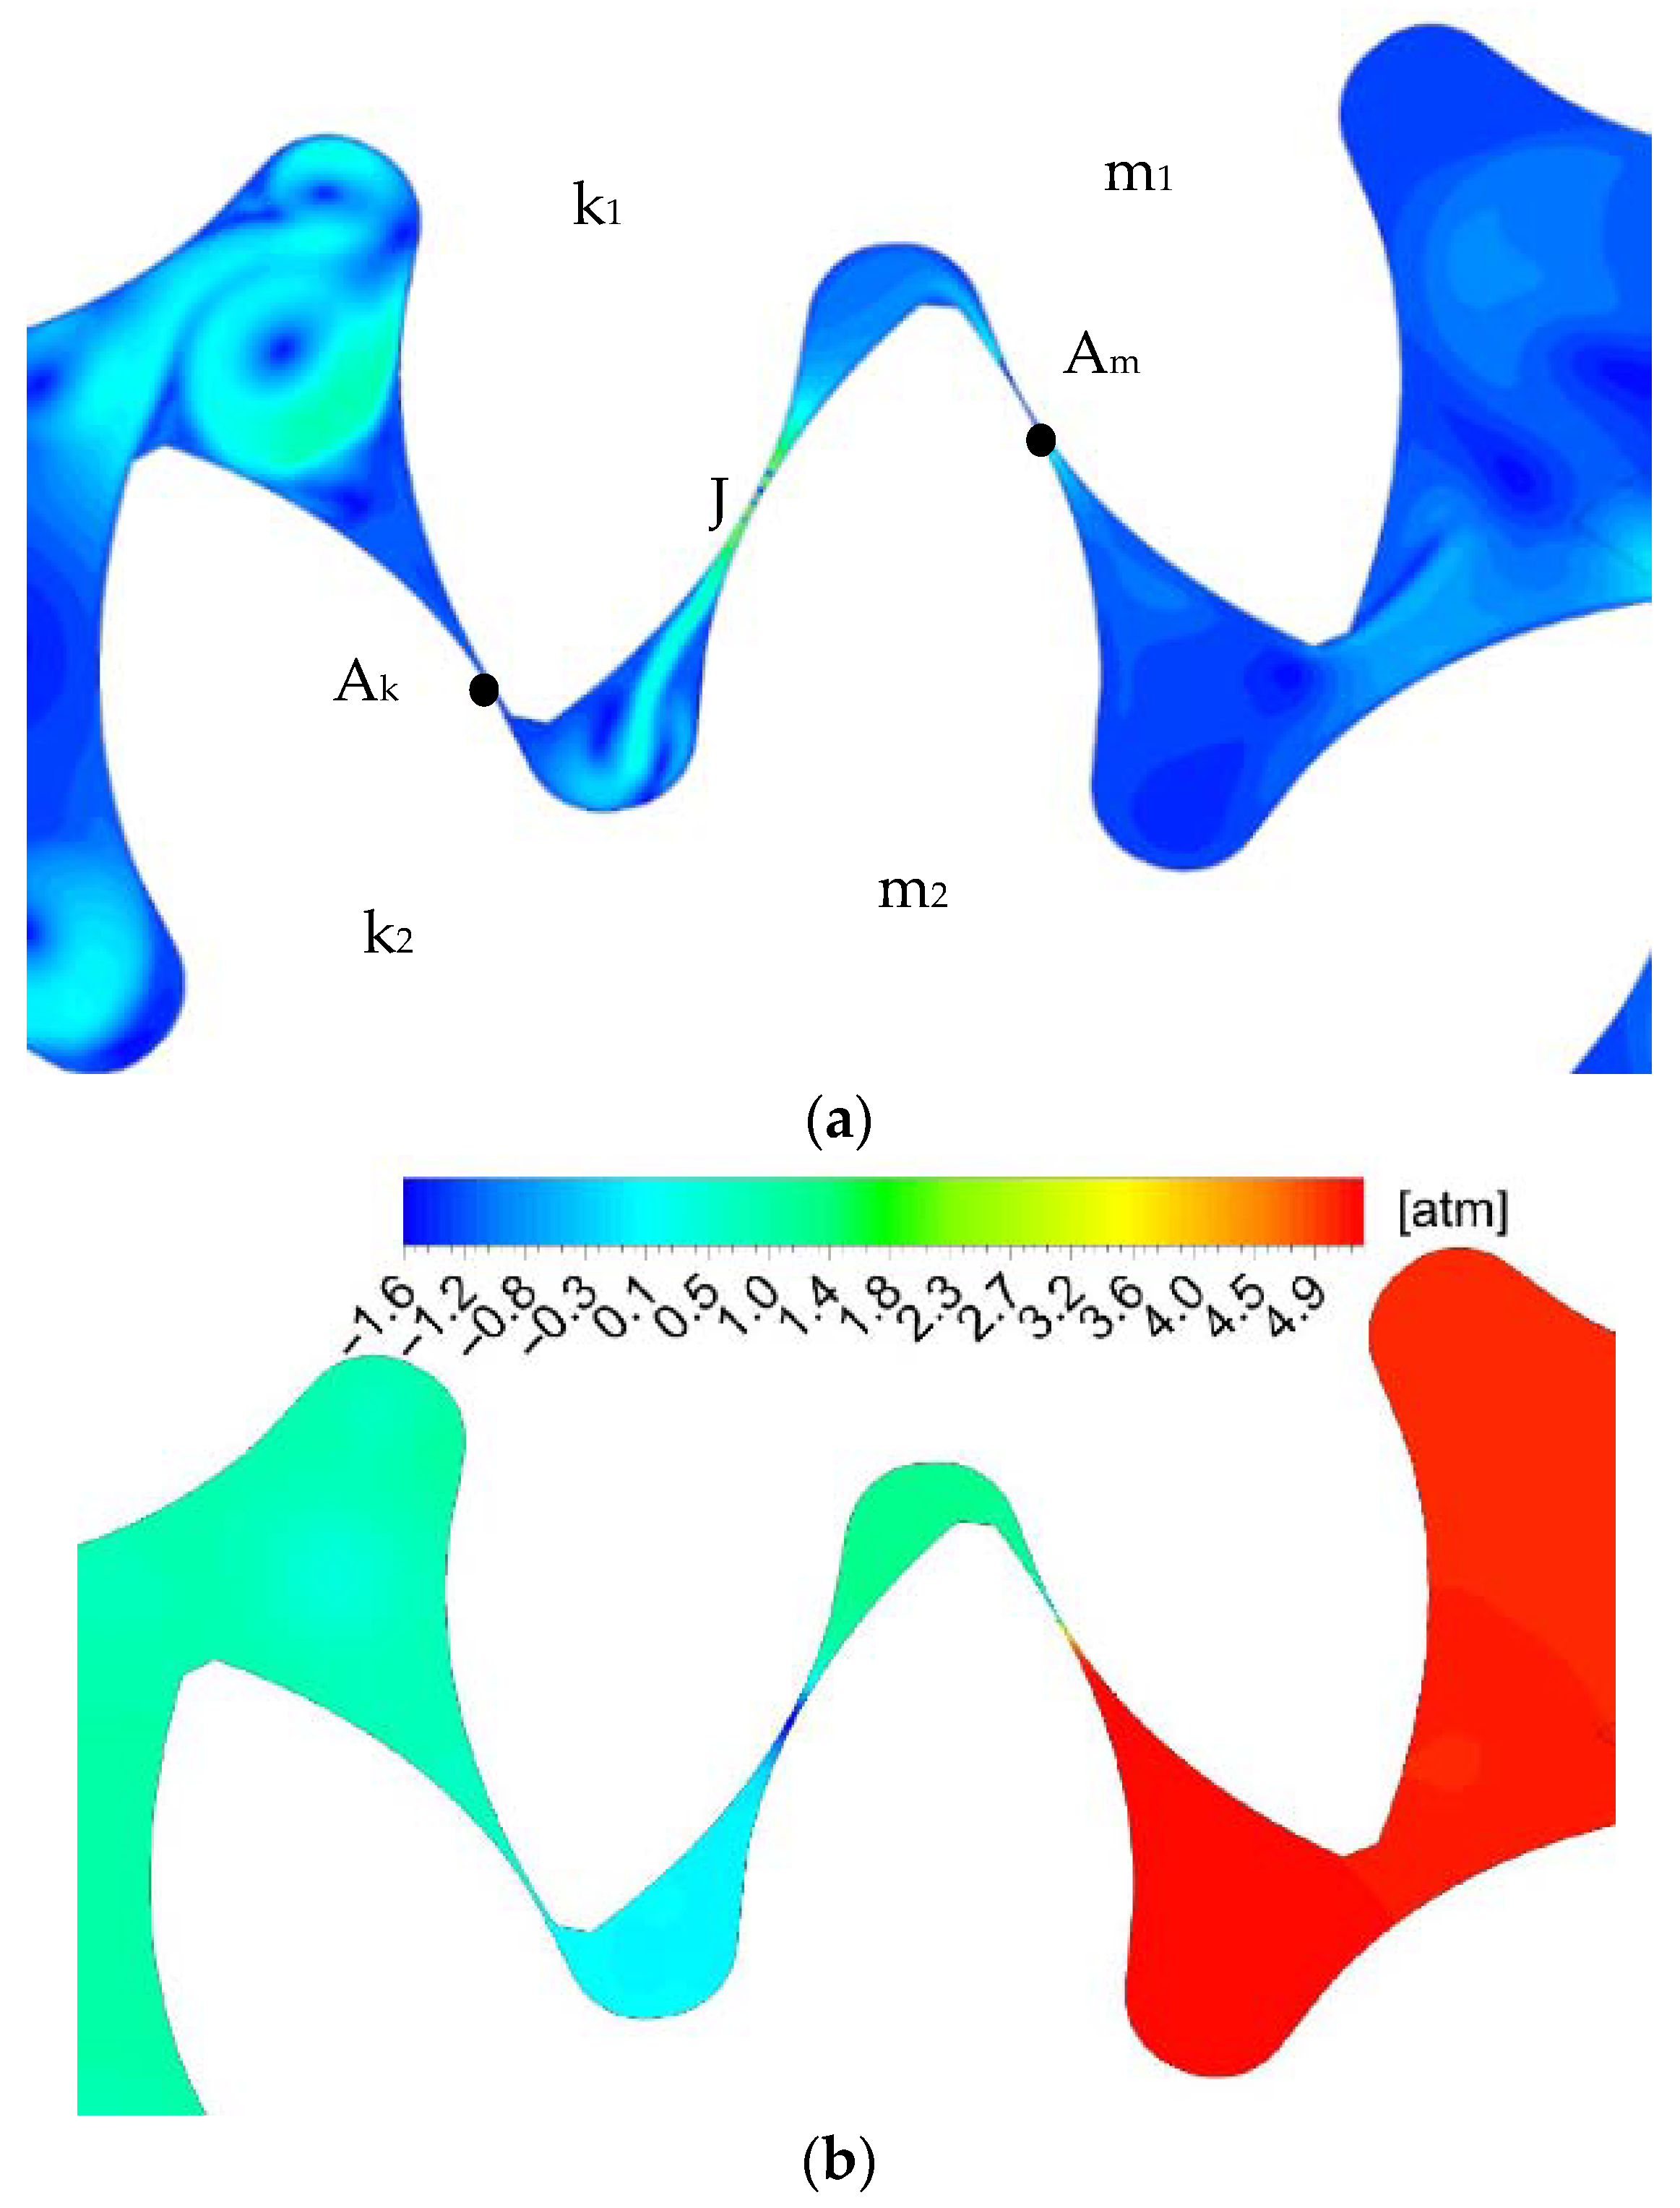
Figure 5 presents the result for position (a). In this position, the pair of teeth (k
1-k
2) is in the meshing zone and moves toward the suction zone, while the second (m
1-m
2) is approaching the meshing zone.
A gap is formed between teeth k1 and m1, and the closing point is the point AK, which separates the high and low-pressure zones. A meshing teeth pair (m1 and m2) are displaced liquid from the interdental chamber. The fluid flow is moved into the high-pressure chamber as an O flow. The pressure in the chamber (k1-m1) is higher than the supply pressure. In the chamber (k2-m2) the pressure is also increased due to the overflow of liquid from the chamber (k1-m1) through the gap J. The pressure increases in the chamber (k1-m1) are due to the displacement of the liquid into the high-pressure zone because the hydraulic resistance of the channel between (m1-m2) is less than in the gap J.
Figure 6 presents the result for position (b). In this position, the teeth pair (k
1-k
2) is in the meshing zone and moves into the separation zone.
The second pair of teeth are meshing in Am point. A closed volume appears and is in a maximum upper position. The AK point separates the closed volume from the suction chamber and Am—from the supply zone. The pressure in chambers (k1-m1) and (k2-m2) is reduced by increasing the volume of the chamber (k2-m2) but no negative pressure zone is formed due to the overflow of liquid from the chamber (k1-m1) through the gap J. There is a significant pressure drop in the gap J, which is caused by an increase in the fluid flow rate.
Figure 7 presents the result for position (c). In this position, the closed volume is in the center of the meshing zone. The pressure drop between the closed volume and the suction area can lead to fluid over-flow if the thrust bearing gap compensation system is not properly designed. The enclosed volume is separated from the supply zone at the A
m point, and from the suction zone at the A
K point. The fluid flow through gap J from the chamber (k
1-m
1) to (k
2-m
2) increases due to the increase in volume (k
2-m
2) and a significant decrease in pressure inside it. The velocity in the gap J increases even more, which leads to the cavitation zone.
Figure 8 presents the result for position (d). In this position, a pair of teeth (k
1-k
2) leaves the meshing area, and the second pair is still in the meshing area. The closed volume is in the leftmost position, and its value again takes the maximum value. The pressure in the chamber decreases. The contact point and flow pattern remain the same as in the previous position.
Figure 9 presents the result for position (e). The pair of teeth (k
1-k
2) is out of mesh, and the pair (m
1-m
2) is in contact at the point A
m. Flow I fills the chamber (k
2-m
2) smoothing the pressure to the level of the suction zone. On the other side of the chamber at point A
m there is compression in the supply chamber and the occurrence of fluid flow O. The chamber pressure and fluid behavior for the next pair of teeth are similar to position (a).
4. Discussion
Experimental data and the numerical experiment showed a similar result and clarified the fluid flow behavior in the meshing zone in more detail. The model can be simplified to two isolated volumes to analyze the effect of the dynamic component of fluid motion. By removing the dynamic component of fluid motion, at the moment of closed volume formation, the pressure in the chamber should correspond to the discharge pressure. This position corresponds to the teeth position (b). Additionally, up to this position, the pressure in the chambers up to the AK point must correspond to the supply pressure. After the formation of a closed volume, the pressure in the chamber (k1-m1) should begin to drop significantly due to an increase in volume, and in (k2-m2) to increase due to a decrease in volume. Such fluid motion should continue until the closed volume is opened and connected to the low-pressure zone. Then, the pressure should equalize and reach the level of the suction zone.
Adding the dynamics of fluid motion in the gaps, the fluid flow from the chamber (k
1-m
1) to (k
2-m
2), results in a completely different picture of pressure changes in the meshing area. To analyze pressure changes in the meshing zone, it is necessary to consider chambers (k
1-m
1) and (k
2-m
2) as two sequentially connected closed volumes, connected by a channel corresponding to the gap
J. Then, after the formation of a closed volume, when the volume of the chamber decreases (k
2-m
2), the pressure will not increase, but due to the flow of liquid through the gap
J will decrease, increasing the pressure in the chamber (k
1-m
1) up to the position d. This effect changes the position of the low-pressure zone starts and will depend on the gap between the teeth, and therefore on the accuracy of the manufacture of the gear wheel. Comparing the behavior of the fluid in a closed volume with and without the dynamics of fluid motion, one can observe the opposite dynamics of pressure. When the volume in the chamber (k
1-m
1) decreases, the pressure should increase, but since chambers (k
1-m
1) and (k
2-m
2) are connected through gap J, the pressure in (k
1-m
1) decreases because the total volume increases (
Figure 10)
This fluid behavior will continue up to position (d) where the chamber (k2-m2) connects to the suction zone. In this position, there is also fluid overflow from the chamber (k1-m1) to (k2-m2) and a slight fluid overflow from the suction area to the chamber (k2-m2).
In the model without fluid flow dynamics, in position (e), the pressure in chambers (k1-m1) and (k2-m2) must correspond to the suction zone pressure, but the pressure in the chamber (k1-m1) is lower, which confirms the significant effect of the dynamic effect.
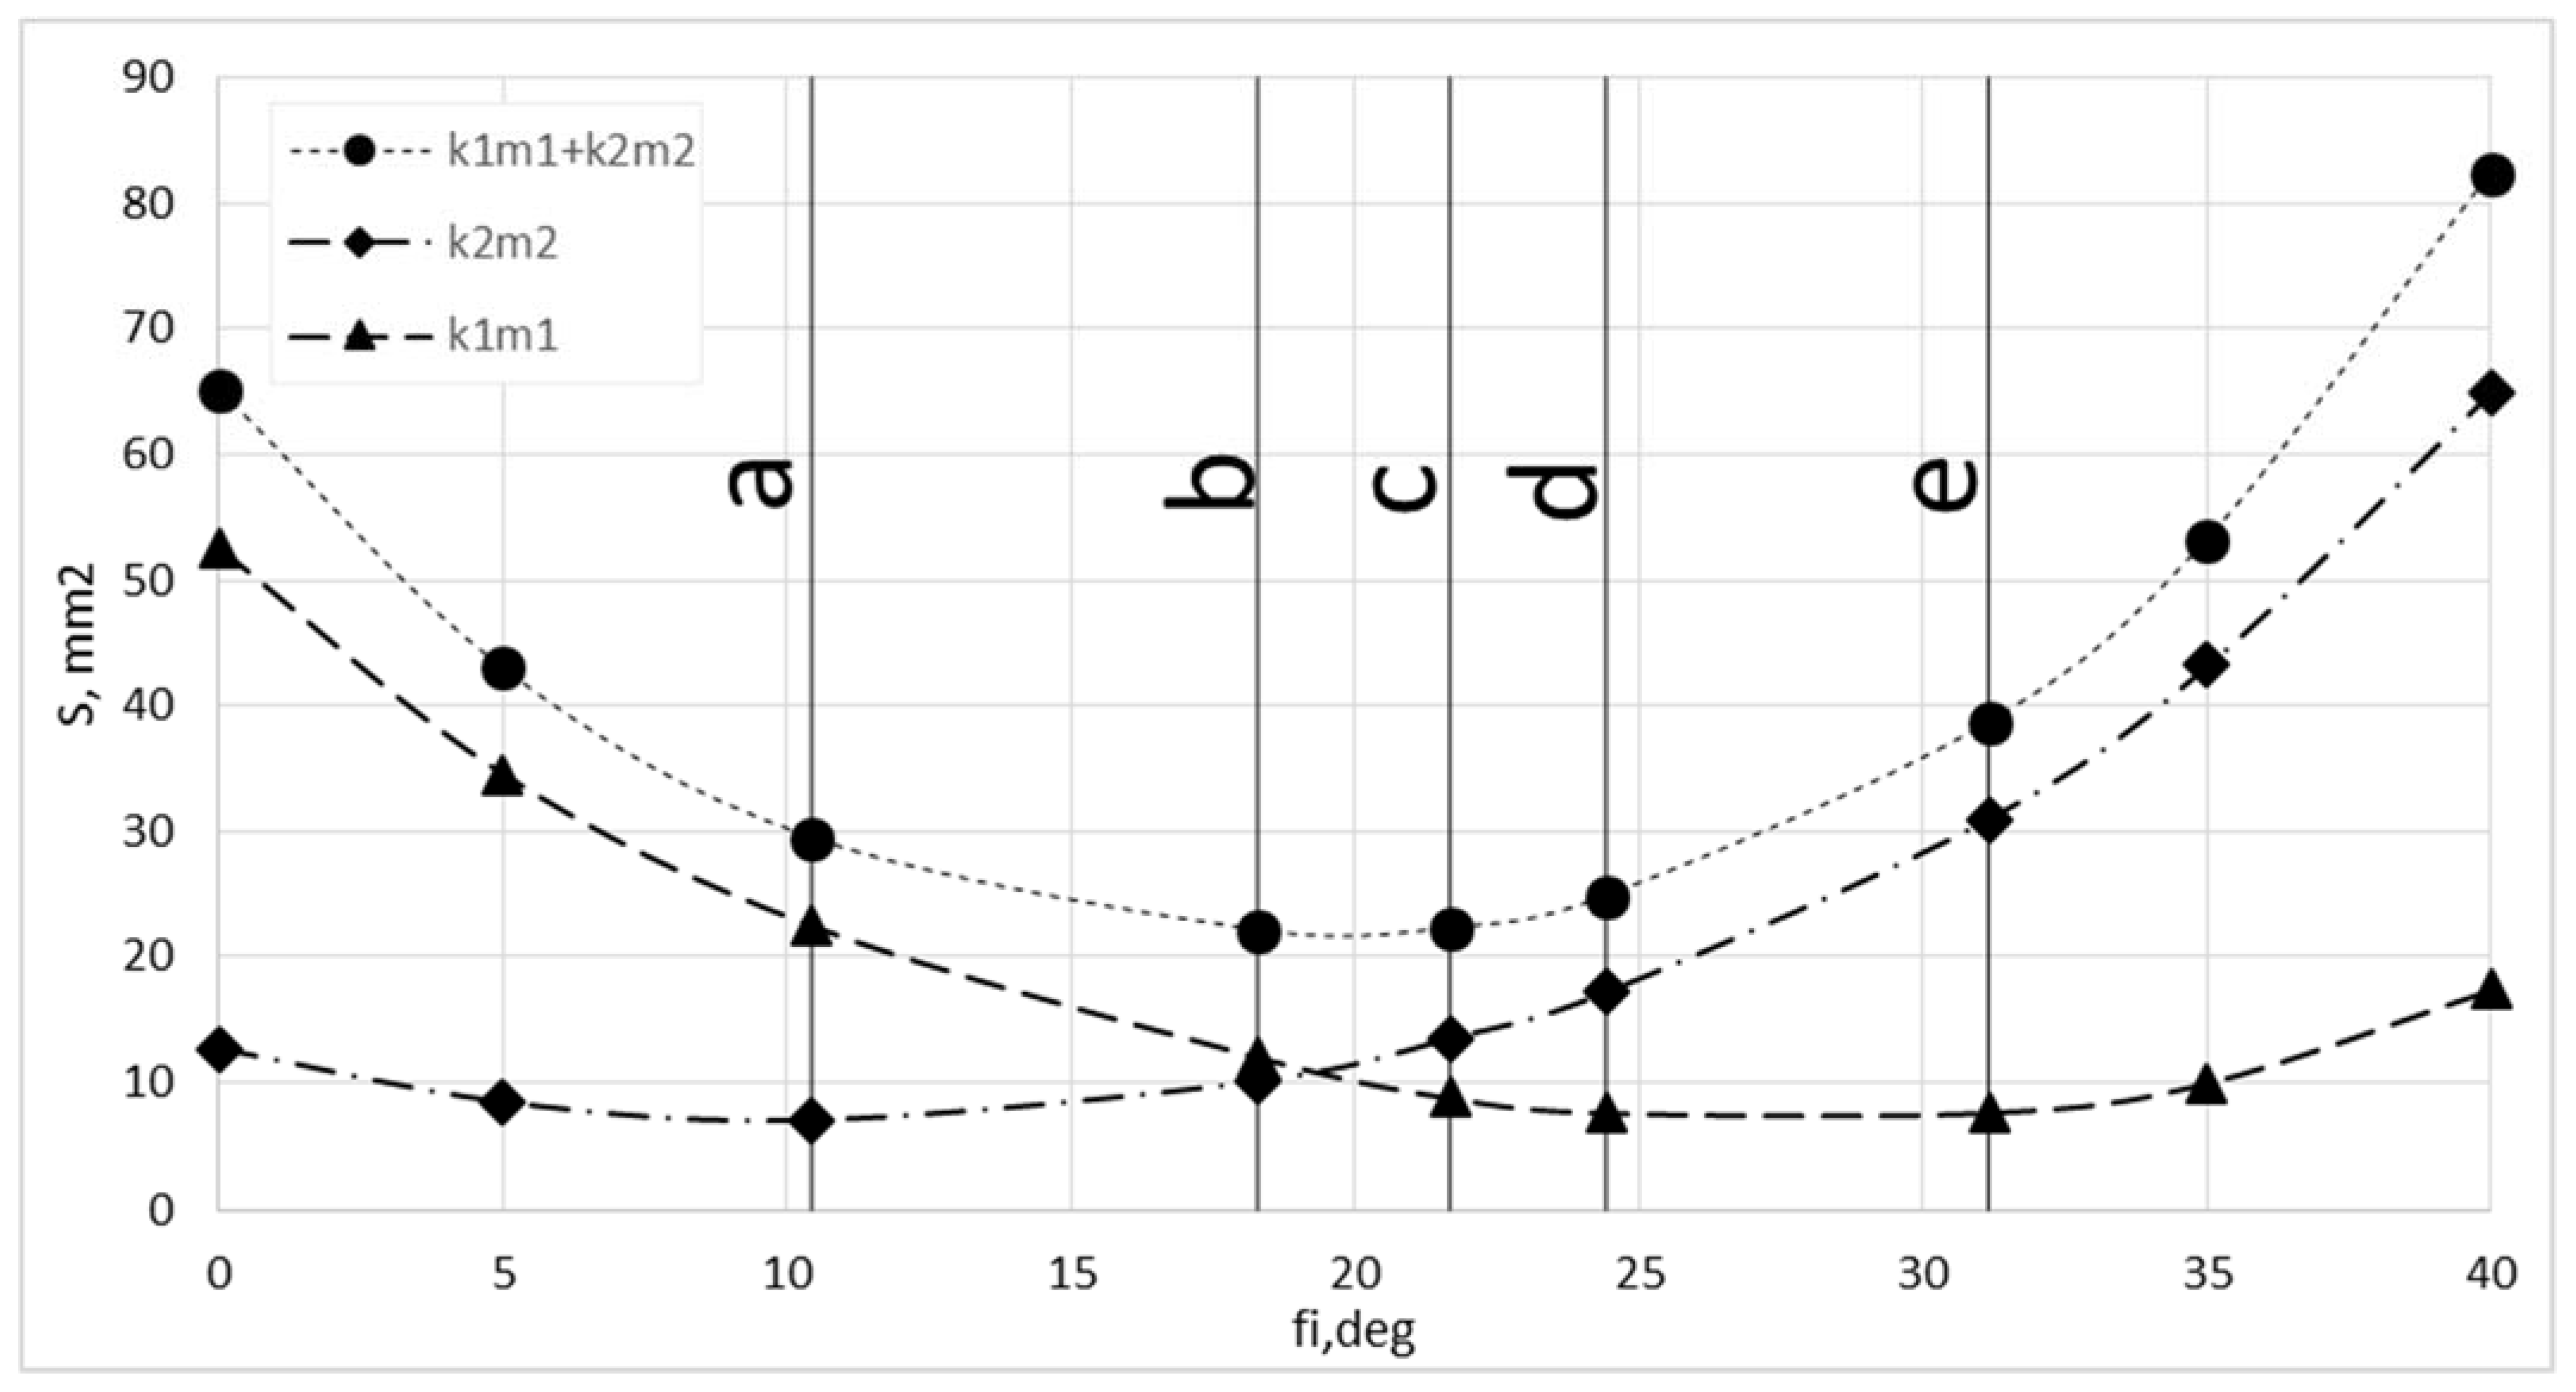
Due to the dynamic effect, the section with the maximum pressure is near position (a) but not in the position with the minimum total volume (
Figure 10). This is caused by the fact that as the fluid is displaced from the chamber, the gap between the teeth decreases, but it is still larger than the gap J. To displace the fluid into the high-pressure chamber the fluid to be displaced must have a higher pressure, and as a result, the pressure rises in the chamber until it is sufficient to displace the volume from the chamber along the path of least resistance. The pressure in the chamber increases until the gap is less than J and then the liquid is displaced into the cavity (k
2-m
2).
In order to demonstrate the dependence of pressure maximum and minimum changes on the dynamics of fluid flow, simulations were performed at several gear rotation speeds.
The calculation result (
Figure 11) confirmed that increasing the speed will significantly increase the pressure in the zone with the maximum pressure, due to the effects described above, and in the zone with the minimum pressure will significantly reduce it, while increasing the cavitation zone.
According to the goals set in this study, the simulation of fluid flow in the external gear pump operating on kerosene was performed.
Table 2 presents the geometric and operating parameters for this study.
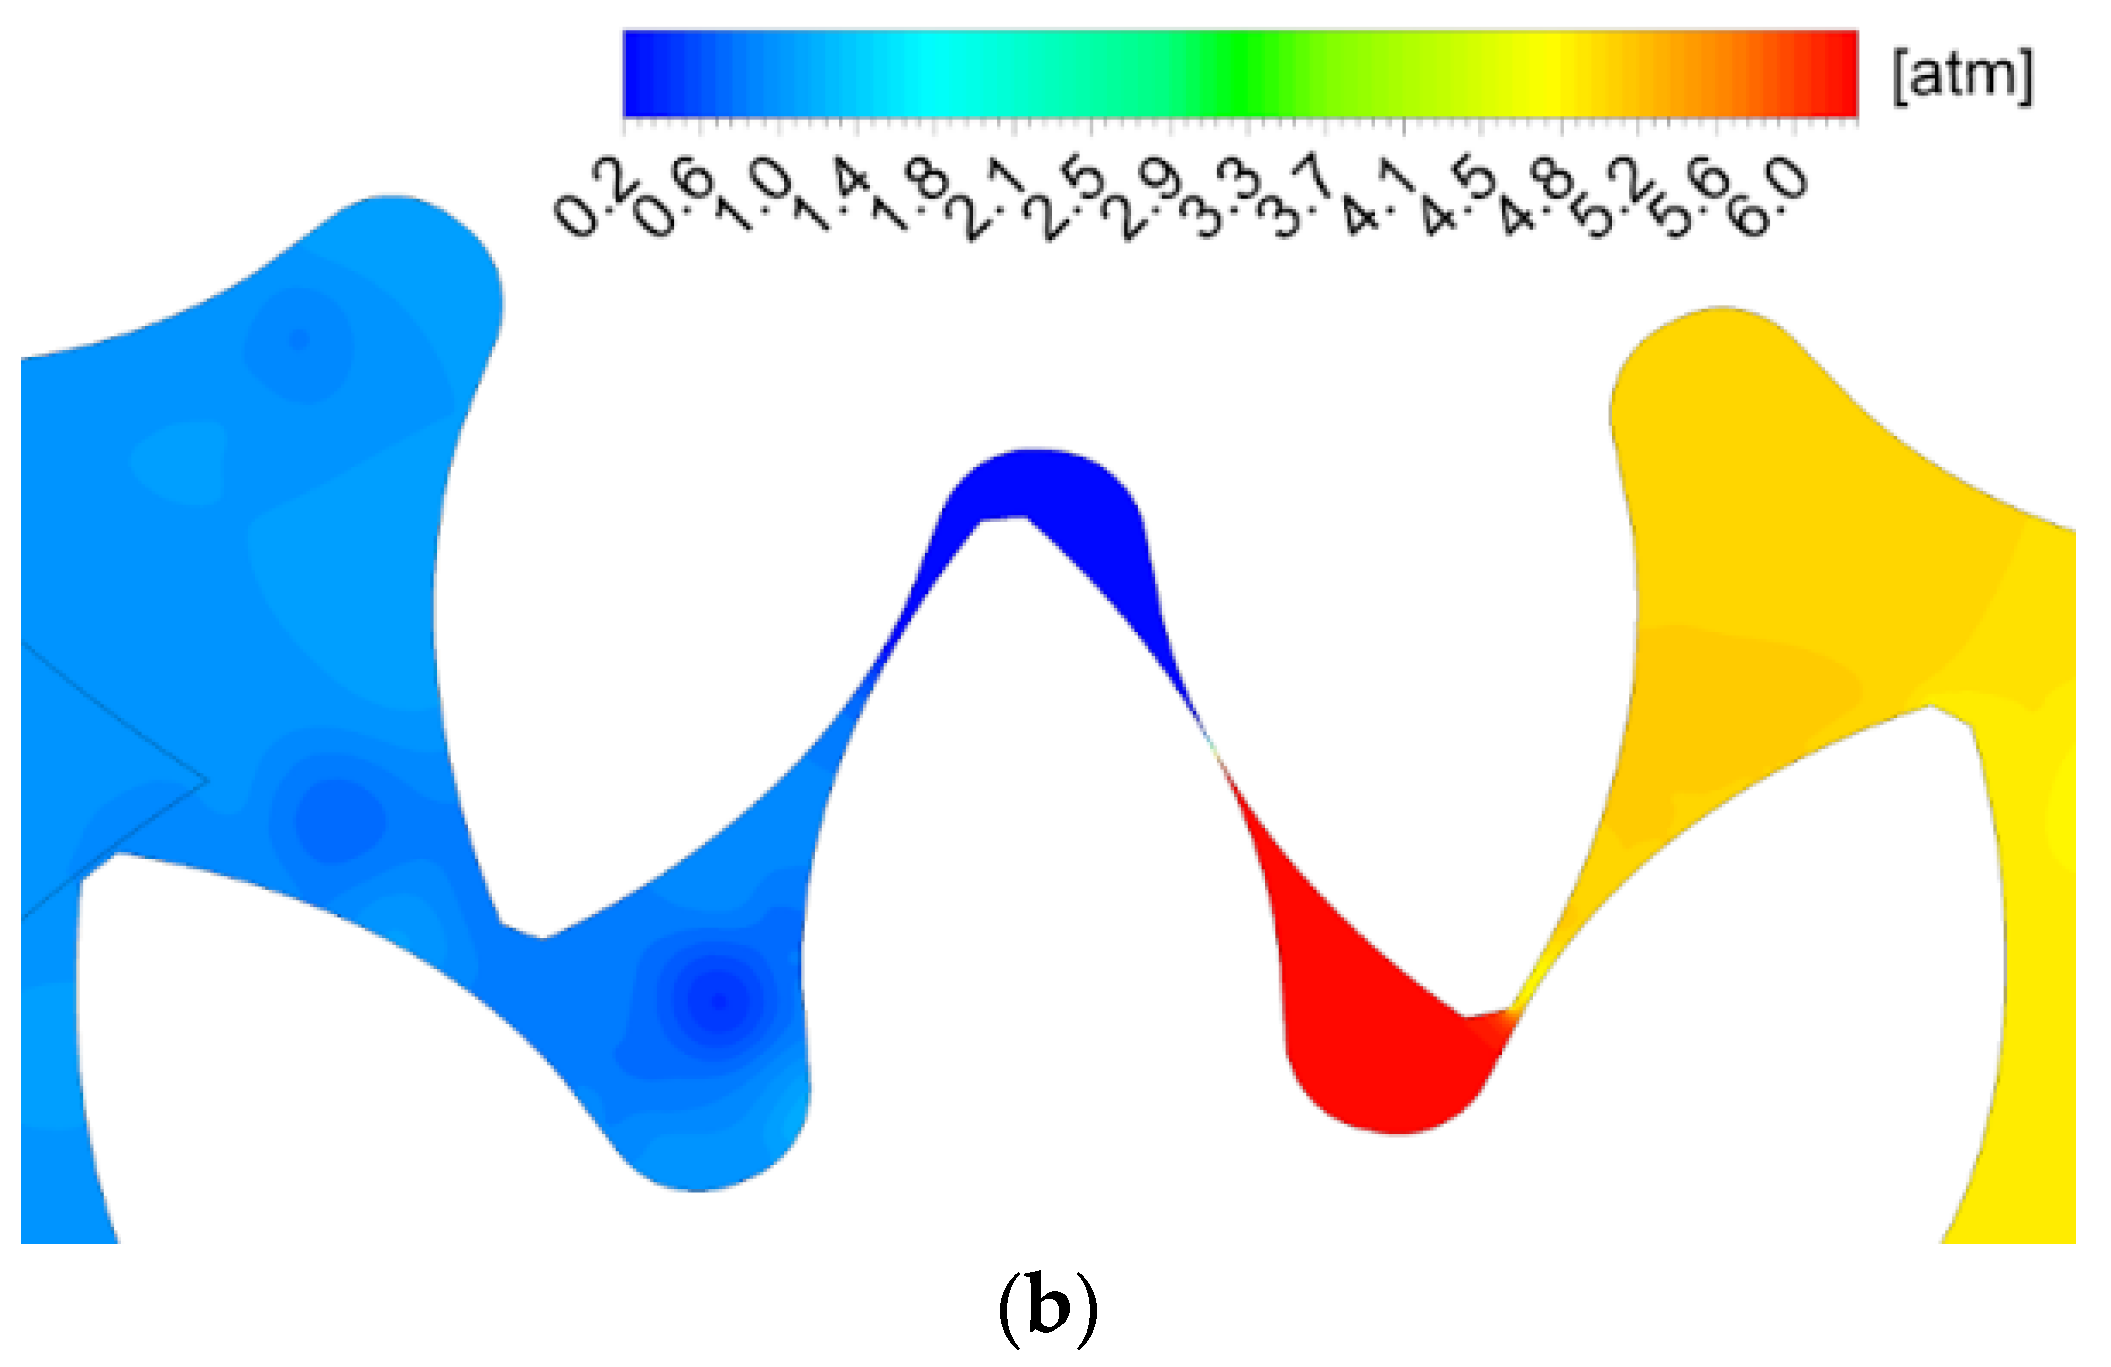
For the simulation of the fuel pump, the same rules and assumptions were established as for the oil one. Pressure and velocity fields for all previously introduced gear positions (a–e) are shown below in
Figure 12 and
Figure 13.
Unlike oil, the results of fuel calculation show a significant influence of fluid flow dynamics on the pressure field in the entire working cavity. The sections in the meshing zone show a much greater pressure drop. This corresponds to the resulting much higher velocity that is the result of two factors: a significant increase in rotation speeds up to 8000 rpm (in eight times) and a decrease in fluid viscosity by three times. Compared to the calculation of the oil pump in position (a), the vertexing of the flow is larger. The occurrence of low-pressure zones passes from position (c) to position (b). In positions (c) and (e), the negative effect of the dynamic component of fluid movement is much stronger than in the oil pump: the volume of the area with increased pressure and the area with decreased pressure increases significantly. This fluid behavior will lead to unpredictable behavior of the end gap compensation system and cavitation wear in the suction area.
The results of the fuel pump simulation were compared with the traces of cavitation wear on the end bearings of the real pump (
Figure 14). Wear traces are located in areas with minimum pressure in the suction zone, as well as in areas of vortex formation. This fact also confirms the validity of the model used.


