Article

Signal Processing Algorithm for Monopulse Noise Noncoherent Wideband Helicopter Altitude Radar

1
Aerospace Radio-Electronic Systems Department, National Aerospace University “Kharkiv Aviation Institute”, 61070 Kharkiv, Ukraine
2
National Aerospace University “Kharkiv Aviation Institute”, 61070 Kharkiv, Ukraine
3
Central Scientific Research Institute of Armament and Military Equipment of the Armed Forces of Ukraine, 03049 Kyiv, Ukraine
*
Authors to whom correspondence should be addressed.
Computation 2022, 10(9), 150; https://doi.org/10.3390/computation10090150
Submission received: 4 August 2022 / Revised: 25 August 2022 / Accepted: 26 August 2022 / Published: 31 August 2022

Abstract

:
Radio altimeters are an important component of modern helicopter on-board systems. These devices currently involve the use of narrowband deterministic signals, that limits their potential technical characteristics. Given the significant breakthrough in the development of wideband and ultra-wideband radio electronics, it is promising to create on-board radio complexes capable of obtaining the necessary information using wideband stochastic signals. At the same time, when developing such complexes, it is important to use optimal synthesis methods for radio systems, which will allow optimal signal processing algorithms and potential accuracy parameters to be obtained. In this work, the algorithm to measure flight altitude for a helicopter or an unmanned aerial vehicle based on the processing of wideband and ultra-wideband pulsed stochastic signals is synthesized for the first time by the maximum-likelihood method. When formulating the problem, the mathematical model of the signal and observation is specified, and their statistical characteristics are investigated. The peculiarity of the synthesis task is the use of a noise pulse transmitter, which implements the function of an underlying surface illuminator, as well as considering the signal structure destruction during its radiation, propagation, and reflection. This signal shape destruction makes it impossible to synthesize a radar with internally coherent processing when working on one receiving antenna. In accordance with the synthesized algorithm, a simulation model of a pulsed radar with a stochastic probing signal has been developed and the results of its modeling are presented.

Graphical Abstract

1. Introduction

Motivation: Modern trends in the development of all types of manned and unmanned aircraft indicate the importance of issues relating to ensuring flight safety and improving autopilot capabilities [1,2,3]. Solving these issues requires a comprehensive approach and the simultaneous use of a large number of on-board systems for continuous monitoring of both the condition of the aircraft itself (its speed, acceleration, roll, altitude, coordinates, etc.) and the current condition of the environment (wind speed and direction, pressure, etc). The information received from all aircraft sensors is mostly sent to a single on-board complex, processed, and further used by the pilot to make decisions and the automatic control system to generate the necessary control signals depending on the current task and the determined condition of the aircraft.
In terms of the complexity of ensuring flight safety and implementing autopilot systems, helicopters stand out among many other types of aircraft. Therefore, their use involves the possibility of flights in a wide range of speeds, heights, and directions. The information received from the on-board complex is used to make decisions about maneuvering, solving navigation problems, and avoiding dangerous situations. An important element of such a complex is an altimeter, which allows you to measure the current aircraft altitude above the ground surface with high accuracy and with a high degree of reliability.
State of the Art: Today, there is a large number of altimeters, ranging from barometric [4], to gamma ray devices. They can be based on different principles of altitude measurement, and even similar systems may involve the use of different signal types with different frequencies and work algorithms. For example, laser radiation is used and processed in lidar systems [5,6,7], there are also systems that use telecommunication signals [8,9], nonlinear algorithms for a movement trajectory processing [10,11,12], etc. Traditionally, the most reliable are radio altimeters [13,14,15], which work in the radio range of waves, which allows one to receive the necessary information regardless of the current time of day, weather conditions, and are completely autonomous. Such systems can be implemented according to different schemes, but they all have some common features, such as the use of pulsed or continuous deterministic narrowband probing signals, which limits their potential technical characteristics. At the same time, wideband and ultra-wideband measuring systems with noise signals [16,17,18], are currently of considerable interest, because in recent years the radio element base has reached a level sufficient for their implementation. Thus, advanced developers in the radio electronics field currently offer a wide selection of high-speed analog-to-digital converters [19,20], wideband amplifiers [21], antennas [22], etc.
The use of stochastic wideband signals opens up new possibilities in the aerospace-based radio vision systems design. Such systems can provide much better measurement accuracy along with a high degree of protection against extraneous radiation. The main disadvantage of such radars is the significant complexity of implementing a coherent mode of signal processing, which can be achieved only at small distances of several tens of meters [23], even with the use of correction models [24], for the atmosphere influence on signal propagation.
Therefore, the creation of on-board radio complexes capable of obtaining the necessary information using stochastic signals is an urgent task today [25,26,27]. Radio complexes that will be placed on board the helicopter are no exception. It should be noted that it is advisable to search for the algorithms of such systems using the methods of optimal synthesis [28], of radio systems, which allow to obtain both the optimal algorithm for estimating the desired parameter and the potential accuracy of this estimate.
Objectives: This work is aimed at solving the problem of statistical synthesis of the stochastic radio-signal processing algorithm for measuring the flight height of a helicopter or an unmanned aerial vehicle.

2. Materials and Methods

In Figure 1 a helicopter is shown, that moves at a speed V and is at a height h above the ground surface at a moment in time t . The antenna of the radio altimeter is marked A , and the area of radiation is marked by D . The area of the underlying surface, which is irradiated by the radiation pattern, is marked by D . Radius vectors r and r denote the positions of elementary areas within the radiation area D and the radiated area D . At the same time, the projections of these radius vectors beginning on the underlying surface coincide. The projection of the velocity V onto the underlying surface is denoted by the vector V . The project line of the path to the underlying surface is marked as S .
Helicopter altimeters often use two antennas [29,30], one for signal radiation and one for reception. The use of one antenna in the modes of operation for radiation and reception of signals is due to the fact that the intended radar will work with pulsed stochastic signals.
The purpose of the work is to synthesize an algorithm for processing wideband stochastic signals for measuring the true altitude of a helicopter.
For the signal processing algorithm synthesis, we will develop a model of a pulsed (for the implementation of a radar that will work with one antenna) stochastic signal and determine its statistical characteristics. Here and further, considering the complexity of mathematical explanations, we will use two approaches to describe the signals at once, temporal and spectral.
The following signal model has been developed:
s ( t ) = f 1 { Π ( f ) P ˙ ( f f 1 ) N ˙ ( f 1 ) d f 1 } = Π ( f ) P ˙ ( f f 1 ) N ˙ ( f 1 ) d f 1 e j 2 π f t d f = η ( t t ) P ( t ) n ( t ) d t ,
where f 1 { } is operator notation of the inverse Fourier transform with integration over a variable f ; N ˙ ( f ) = f 1 { n ( t ) } is the complex stochastic spectral density of the radiated signal amplitude, ( n ( t ) is a white Gaussian noise with zero mean, which is used as the filling of the radiated radio pulse); Π ( f ) = f 1 { η ( t ) } is the spectrum of the radio pulse envelope ( P ( t ) is radio pulse envelope); f is frequency; t is time; and τ is pulse duration in time. In the problem being solved, it is assumed that the bandwidth satisfies the condition of wideband or ultra-wideband.
Today, Equation (1) signal type can be generated by the existing radio element base [31,32].
It is assumed that the stochastic spectral density of the useful signal is a Gaussian process with zero mean, that is N ˙ ( f ) = 0 or n ( t ) = 0 , in the time domain. Here and further, parentheses denote statistical averaging. The correlation function of this process is delta-correlated by frequency N ˙ ( f 1 ) N ˙ ( f 2 ) = ( N / 2 ) δ ( f 1 f 2 ) or in the time domain n ( t 1 ) n ( t 2 ) = ( N / 2 ) δ ( t 1 t 2 ) , where δ ( ) is a delta function. Here N is the power spectral density of the probing signal.
Often, only one of these records is used in professional literature. The correctness of both entries can be easily proven by the following calculation:
N ˙ ( f 1 ) N ˙ ( f 2 ) = n ( t ) e j 2 π f 1 t d t n ( t ) × e j 2 π f 2 t d t = n ( t 1 ) n ( t 2 ) N 2 δ ( t 1 t 2 ) e j 2 π ( f 1 t 1 f 2 t 2 ) d t 1 d t 2 = N 2 e j 2 π ( f 1 f 2 ) t d t δ ( f 1 f 2 ) = N 2 δ ( f 1 f 2 ) .
With the above limitations, the full information about the signal is contained in its correlation function or power spectral density. Signal correlation function of Equation (1) has the following form:
R s ( t 1 , t 2 ) = s ( t 1 ) s ( t 2 ) = η ( t 1 t ) η ( t 2 t ) P ( t ) P ( t ) × n ( t ) n ( t ) N 2 δ ( t t ) d t d t = N 2 η ( t 1 t ) η ( t 2 t ) P 2 ( t ) d t .
The correlation function (3) depends on ( t 1 , t 2 ) and not on the difference t 1 t 2 , i.e., it describes a non-stationary signal.
The signal power spectral density can be found according to the generalized Wiener–Khinchin theorem. To do this, we perform the Fourier transformation of Equation (3):
G s ( t 1 , f ) = τ { R s ( t 1 , t 2 ) | t 2 = t 1 τ } = N 2 τ { η ( t 1 t ) η ( t 1 τ t ) P 2 ( t ) d t } = N 2 Π ˙ ( j 2 π f ) Π ˙ ( j 2 π [ f 2 + f 3 + f ] ) P ˙ ( j 2 π f 2 ) e j 2 π f 2 t 1 d f 2 P ˙ ( j 2 π f 3 ) e j 2 π f 3 t 1 d f 3 .
For the signal processing algorithm synthesis, it is important to write down the observation equation model. At the same time, various variants of the input path implementation are considered [33,34], which impose restrictions on the observation equation form, as well as the geometry of the problem. It is known from the statistical theory basics [28], that the observation equation model in this case can be described quite accurately by an additive mixture of the useful signal reflected by the underlying surface and noise [35]:
u ( t ) = D s s ( t , r ) d r + n r ( t ) + n ( t )
where s s ( t , r ) is a signal reflected by an elementary section of the underlying surface with the center coordinates determined by the end of the radius vector r ; n r ( t ) + n ( t ) is a noise additive taking into account the limitation of the receiver working bandwidth and white noise. We neglect the Doppler frequency in Equation (5), because in the considered geometry of the problem it will be close to zero [36].
Mathematical models of signal and noises can be presented as follows:
s s ( t , r ) = Π ˙ ( f ) F ˙ ( r , f ) G ˙ ( r , f ) × P ˙ ( f f 1 ) N ˙ ( f 1 ) d f 1 e j 2 π f ( t t d ( r ) ) d f = n ( t ) P ( t ) Π ˙ ( f ) F ˙ ( r , f ) G ˙ ( r , f ) × e j 2 π f ( t t t d ( r ) ) d f d t = g ( r , t ) η ( t ) n ( t ) P ( t ) f σ ( r , t t t t t d ( r ) ) d t d t d t ,
n r ( t ) = η ( t t 1 ) n ( t 1 ) d t 1 = Π ˙ ( f ) N ˙ n ( f ) e j 2 π f t d f ,
n ( t ) = N ˙ 0 ( f ) e j 2 π f t d f ,
where F ˙ ( r , f ) is the underlying surface complex reflection coefficient (we consider it a random process [28]), which depends on the frequency [37], when working with wideband signals; f σ ( ) = f 1 { F ( r , f ) } ; N ˙ n ( f ) and N ˙ 0 ( f ) are spectral densities of the complex amplitude of receiver noise and white noise; G ( r , f ) is the radiation pattern of the antenna A as a function of frequency, recalculated to the underlying surface elements with coordinates r D (the beginning of the radius vector r is located in the projection of the antenna phase center onto the underlying surface); and t d ( r ) = 2 c 1 h 2 + | r | 2 is the delay time for the signal to propagate from the phase center of the antenna to the elemental section of the underlying surface with the coordinates determined by the vector r end and in the reverse direction.
We ignore the signal attenuation coefficient during propagation in the atmosphere (for the millimeter range it is advisable [38]. to calculate it taking into account the local properties of the atmosphere), considering that it can be included in the complex radiation pattern.
The complex radiation pattern is related to the amplitude-phase distribution of the field in the antenna aperture by the following formula
G ˙ ( ϑ , f ) = f c 1 D I ˙ ( f r c 1 ) e j 2 π f ϑ r c 1 d r
and is recalculated to the underlying surface coordinates, taking into account Figure 1, as follows
G ˙ ( r , f ) = G ˙ ( [ h cos α cos γ , h t g 2 γ cos 2 α cos 2 γ ] , f )
where ϑ = ( ϑ x , ϑ y , ϑ y ) = ( cos ( α ) , cos ( β ) , cos ( γ ) ) are the direction cosines of a unit vector direction of which is characterized by the end of the vector r ; ϑ z = cos ( γ ) = 1 ϑ x 2 ϑ y 2 ; α ( 0 , π ) ; β ( 0 , π ) ; γ ( 0 , π 2 ) is the angle, that is calculated from the axis 0 z directed from the phase center of the radio altimeter antenna in the direction of the normal to the underlying surface elements.
Considering that all processes included in Equation (5) are Gaussian with zero mean, we obtain that the mathematical expectation of the observation u ( t ) = 0 . Considering the mutual uncorrelation of the signal and noise, we write the expression for the correlation function as follows:
R u ( t 1 , t 2 ) = u ( t 1 ) u ( t 2 ) = D D s s ( t 1 , r 1 ) s s ( t 2 , r 2 ) d r 1 d r 2 + n r ( t 1 ) n r ( t 2 ) + n ( t 1 ) n ( t 2 ) = R s ( t 1 , t 2 ) + R n r ( t 1 t 2 ) + R n ( t 1 t 2 ) .
In Equation (10), the partial correlation functions of noises have the following forms:
R n r ( t 1 t 2 ) = n r ( t 1 ) n r ( t 2 ) = η ( t 1 t ) η ( t 2 t ) n ( t ) n ( t ) d t d t = N r η ( t 1 t ) η ( t 2 t ) d t = N r R η ( t 1 t 2 ) ,
R η ( t 1 t 2 ) = R η ( τ ) = η ( t 1 t ) η ( t 2 t ) d t = η ( t ) η ( t τ ) d t ,
R n ( t 1 t 2 ) = n ( t 1 ) n ( t 2 ) = N δ ( t 1 t 2 )
The expression for the correlation function of the signal can be found through the spectral representation of the signal:
R s ( t 1 , t 2 ) = 1 2 D D G ˙ ( r 1 , f a ) G ˙ ( r 2 , f b ) F ˙ ( r 1 , f a ) F ˙ ( r 2 , f b ) Π ˙ ( f a ) Π ˙ ( f b ) P ˙ ( f a f 1 ) P ˙ ( f b f 2 ) × N ˙ ( f 1 ) N ˙ ( f 2 ) d f 1 d f 2 e j 2 π f a ( t 1 t d ( r 1 ) ) e j 2 π f b ( t 2 t d ( r 2 ) ) d f a d r 1 d f b d r 2 = 1 2 N D D G ˙ ( r 1 , f a ) G ˙ ( r 2 , f b ) × σ 0 ( r 1 r 2 , f a f b ) Π ˙ ( f a ) Π ˙ ( f b ) P ˙ ( f a f ) P ˙ ( f b f ) d f e j 2 π f a ( t 1 t d ( r 1 ) ) e j 2 π f b ( t 2 t d ( r 2 ) ) d f a d f b d r 1 d r 2 .
In Equation (13), it is taken into account that the complex radar cross-section correlation function is associated in space and frequency, i.e., it is written in form F ˙ ( r 1 , f a ) F ˙ ( r 2 , f b ) = σ 0 ( r 1 r 2 , f a f b ) . Parameter σ 0 ( r 1 r 2 , f a f b ) is the radar cross-section of the underlying surface as a function of frequency and space mismatch. The issue of concretizing the analytical expression for σ 0 ( r 1 r 2 , f a f b ) is quite complex and requires the solution of direct problems of radio physics. In many real situations, it is possible to assume that σ 0 ( r 1 r 2 , f a f b ) = σ 0 ( f a f b , r 1 ) δ ( r 1 r 2 ) , i.e., the effective scattering surface is uncorrelated in spatial coordinates. This can happen in practice when a real (non-mirror) underlying surface is irradiated with a millimeter wave range. Then the correlation function (13) can be written as follows
R s ( t 1 , t 2 ) | σ 0 ( f a f b ) δ ( r 1 r 2 ) = 1 2 N D G ˙ ( r , f a ) G ( r , f a Δ f ) σ 0 ( Δ f , r ) Π ˙ ( f a ) Π ˙ ( f a Δ f ) × P ˙ ( f a f ) P ˙ ( f a Δ f f ) d f e j 2 π ( Δ f t 1 + ( f a Δ f ) τ ) e j 2 π Δ f t d ( r ) d f a d Δ f d r .
Based on the obtained formulas, let us write down the final form of the observation correlation function:
R u ( t 1 , t 2 ) = R s ( t 1 , t 2 ) | σ 0 ( f a f b ) δ ( r 1 r 2 ) + R n r ( t 1 t 2 ) + R n ( t 1 t 2 ) = 1 2 N D G ˙ ( r , f a ) G ˙ ( r , f a Δ f ) × σ 0 ( Δ f , r ) Π ˙ ( f a ) Π ˙ ( f a Δ f ) P ˙ ( f a f ) P ˙ ( f a Δ f f ) d f e j 2 π ( Δ f t 1 + ( f a Δ f ) τ ) e j 2 π Δ f t d ( r ) d f a d Δ f d r + N r η ( t ) η ( t τ ) d t + N δ ( τ ) .
Equation (14) analysis makes it possible to make an important conclusion. The average value of the observation is zero u ( t ) = 0 , and the correlation function (14) contains information about both the signal delay time and the radio pulse envelop, which are converted into the desired parameter—the range.
To solve the problem of the signal processing algorithm synthesizing we use the maximum likelihood method. In this case, there is a possibility of determining the altitude parameter according to one of the two variants of range estimation; differentiation of the likelihood function by the delay time, or by the radio pulse envelope. Within the scope of this work, the search for the algorithm is carried out by differentiation by delay time.
In this work we write the natural logarithm of the likelihood function in the following form:
ln P [ u ( t ) | t d ( r ) ] = ln k ( t d ( r ) ) 1 2 0 T 0 T u ( t 1 ) W u ( t 1 , t 2 , t d ( r ) ) u ( t 2 ) d t 1 d t 2 ,
where k ( t d ( r ) ) is a coefficient, the derivative of which depends on the information parameter; W u ( t 1 , t 2 , t d ( r ) ) is a function, which is the inverse of the correlation function (14) and is found from the solution of the inversion equation
0 T R u ( t 1 , t 2 ) W u ( t 2 , t 3 ) d t 2 = δ ( t 1 t 3 )
When solving the problem, it should be noted the difficulties that naturally arise due to the fact that the underlying surface can be significantly uneven and contain significant differences in height within the area irradiated by the radiation pattern.

3. Results

3.1. Delay Time Estimation Algorithm Synthesis

To obtain the signal processing algorithm, we differentiate Equation (15) by the desired parameter and equate the differentiation result to zero. That is, it is necessary to solve the following equation
δ ln P [ u ( t ) | t d ( r ) ] δ t d ( r ) = 0
where δ δ t d ( r ) is a functional derivative of the delay time, as a function of the underlying surface coordinates.
Considering that it is possible to obtain the solution of the inversion Equation (16) in an explicit form for a rather limited class of correlation functions, we will perform calculations in the frequency or time–frequency domain [28]. To do this, we will rewrite the correlation function in the frequency (frequency–time) domain. This is due to the fact that all the factors under the integrals are symmetrical in terms of the function’s frequency. Let us find the Fourier transformation of the correlation function and write the power spectral density as follows:
G R ( f , t 1 ) = τ { R u ( t 1 , τ ) | σ 0 ( Δ f ) δ ( r 1 r 2 ) } = G s ( f , t 1 ) + G n r ( f ) + G n ( f )
where
G s ( f , t 1 ) = τ { R s ( t 1 , τ ) | σ 0 ( Δ f ) δ ( r 1 r 2 ) } = 1 2 N D G ˙ ( r , Δ f f ) G ˙ ( r , f ) σ 0 ( Δ f , r ) Π ˙ ( Δ f f ) Π ˙ ( f ) × P ˙ ( Δ f f f ) P ˙ ( f f ) d f e j 2 π Δ f t 1 e j 2 π Δ f t d ( r ) d Δ f d r ,
G n r ( f ) = τ { R n r ( τ ) } = N r | Π ˙ ( f ) | 2 ,
G n ( f ) = τ { R n ( τ ) } = N δ ( τ ) e j 2 π f τ d τ = N .
The inversion Equation (16) for a non-stationary process in the spectral domain is found in the following form:
G W ( t 3 , f ) = 2 e j 2 π f ( t 1 t 3 ) G R ( t 1 , f )
The inversion Equation (22) in the frequency domain for the statistical characteristics of non-stationary processes is obtained for the first time. Here, the minus sign at the frequency can be omitted since the autocorrelation function of observation is an even function.
The likelihood equation in the time domain can be written as follows:
1 2 0 T 0 T δ R ( t 1 , t 2 , t d ( r ) ) δ t d ( r ) W ( t 1 , t 2 , t d ( r ) ) d t 1 d t 2 1 2 0 T 0 T u ( t 1 ) δ W ( t 1 , t 2 , t d ( r ) ) δ t d ( r ) u ( t 2 ) d t 1 d t 2 = 0 .
To solve this equation, it is necessary to determine the expression for function W ( t 1 , t 2 , t d ( r ) ) . Let us rewrite likelihood equation in the spectral domain. For this, the following preliminary calculations are performed:
1 2 0 T 0 T δ R ( t 1 , t 2 , t d ( r ) ) δ t d ( r ) G W ( t 1 , f , t d ( r ) ) e j 2 π f t 2 d f d t 1 d t 2 = 1 2 0 T δ G ^ R ( t 1 , f , t d ( r ) ) δ t d ( r ) G W ( t 1 , f , t d ( r ) ) d f d t 1 , .
1 2 0 T 0 T u ( t 1 ) δ W ( t 1 , t 2 , t d ( r ) ) δ t d ( r ) u ( t 2 ) d t 1 d t 2 = 1 2 0 T u ( t 1 ) δ G W ( t 1 , f , t d ( r ) ) δ t d ( r ) U ˙ ^ ( j 2 π f ) d f d t 1 ,
where
U ˙ ^ ( j 2 π f ) = 0 T u ( t 2 ) e j 2 π f t 2 d t 2
and the sign «ˆ» does not denote the true value of the spectrum or spectral density, but its an estimate obtained through the Fourier transformation of a limited observation or correlation function realization.
Now let us write the likelihood equation in the time–frequency domain:
1 2 0 T δ G ^ R ( t 1 , f , t d ( r ) ) δ t d ( r ) G W ( t 1 , f , t d ( r ) ) d f d t 1 1 2 0 T u ( t 1 ) δ G W ( t 1 , f , t d ( r ) ) δ t d ( r ) U ˙ ^ ( j 2 π f ) d f d t 1 = 0 .
Substitute Equation (22) into the likelihood Equation (24) and take into account that
G W ( t m , f ) = 2 e j 2 π f ( t n t m ) G R ( t n , f ) | m = n = 2 G R ( t m , f )
We obtained the following calculation result:
0 T δ G ^ R ( t 1 , f , t d ( r ) ) δ t d ( r ) 1 G R ( t 1 , f , t d ( r ) ) d f d t 1 0 T u ( t 1 ) ( δ δ t d ( r ) 1 G R ( t 1 , f , t d ( r ) ) ) U ˙ ^ ( j 2 π f ) d f d t 1 = 0
Next, we find the derivatives that are included in Equation (25). To do this, we use spectral densities (18) and (19). The derivative of the power spectral density (18) has the following form:
δ G ^ R ( t 1 , f , t d ( r ) ) δ t d ( r ) = lim α 0 d d α G ^ R ( t 1 , f , t d ( r ) + α δ ( t d ( r ) t d ( r ) ) ) = j π N Δ f G ˙ ( r , Δ f f ) × G ˙ ( r , f ) σ 0 ( Δ f , r ) Π ˙ ( Δ f f ) Π ˙ ( f ) P ˙ ( Δ f f f ) P ˙ ( f f ) d f e j 2 π Δ f ( t 1 t d ( r ) ) d Δ f .
The derivative of the power spectral density, which is the inverse of the observation signal power spectral density (taking into account Equation (26)), can be written as follows:
δ δ t d ( r ) 1 G ^ R ( t 1 , f , t d ( r ) ) = j 2 π N G ^ R 2 ( t 1 , f , t d ( r ) ) Δ f G ˙ ( r , Δ f f ) G ˙ ( r , f ) σ 0 ( Δ f , r ) × Π ˙ ( Δ f f ) Π ˙ ( f ) P ˙ ( Δ f f f ) P ˙ ( f f ) d f e j 2 π Δ f ( t 1 t d ( r ) ) d Δ f .
Substitute Equations (26) and (27) into Equation (25) and obtain the likelihood equation in the frequency–time domain
0 T [ Δ f G ˙ ( r , Δ f f ) G ˙ ( r , f ) × σ 0 ( Δ f , r ) Π ˙ ( Δ f f ) Π ˙ ( f ) × P ˙ ( Δ f f f ) × P ˙ ( f f ) d f e j 2 π Δ f ( t 1 t d ( r ) ) d Δ f ] G R ( t 1 , f , t d ( r ) ) d f d t 1 = 0 T u ( t 1 ) 1 G ^ R 2 ( t 1 , f , t d ( r ) ) Δ f G ˙ ( r , Δ f f ) × G ˙ ( r , f ) σ 0 ( Δ f , r ) Π ˙ ( Δ f f ) Π ˙ ( f ) P ˙ ( Δ f f f ) P ˙ ( f f ) d f × P ˙ ( f f ) d f e j 2 π Δ f ( t 1 t d ( r ) ) d Δ f .
For further calculations, we introduce the following notation:
Q ˙ ( r , f , t 1 t d ( r ) ) = Δ f G ˙ ( r , Δ f f ) σ 0 ( Δ f , r ) Π ˙ ( Δ f f ) P ˙ ( Δ f f f ) P ˙ ( f f ) d f e j 2 π Δ f ( t 1 t d ( r ) ) d Δ f ,
Q ( r , t d ( r ) ) = 0 T [ G ˙ ( r , f ) Π ˙ ( f ) × Q ˙ ( r , f , t 1 t d ( r ) ) ] G R ( t 1 , f , t d ( r ) ) d f d t 1 .
The function Q ( r , t d ( r ) ) contains information about the delay time from each elementary section (within the area irradiated by the radiation pattern) of the underlying surface. Usually, for the practical use of altimeters, it is necessary to have a delay time from the nearest point, which can be obtained through integration over the irradiation area, that is, to change Q ( r , t d ( r ) ) to D Q ( r , t d ( r ) ) d r = Q ( t d ) . Then Equation (28) can be rewritten as follows
Q ( t d ) = D 0 T u ( t 1 ) Π ˙ ( f ) G ˙ ( r , f ) G ^ R 2 ( t 1 , f , t d ( r ) ) Δ f G ˙ ( r , Δ f f ) σ 0 ( Δ f , r ) Π ˙ ( Δ f f ) × P ˙ ( Δ f f f ) P ˙ ( f f ) d f × e j 2 π Δ f ( t 1 t d ( r ) ) d Δ f U ˙ ( j 2 π f ) d f d t 1 d r .
For further physical interpretation of the signal processing algorithm in the right part of likelihood Equation (29), we introduce some physically based assumptions:
(1)
The amplitude–phase current distribution in the antenna aperture is uniform. Then the radiation pattern of the antenna in the coordinates of the underlying surface can be represented by an expression
G ( x , f ) = G ( x ( ϑ x ) , f ) = G ( h cos α cos γ , f ) = f X c sin c ( π h cos α cos γ f X c )
where f x / c is an analogue of spatial frequencies, which in ultra-wideband radar depends on both spatial coordinates and frequency; x [ X / 2 , X / 2 ] ; X is the size of the antenna along the axis 0 x . It should be noted that according to Equation (30), the radiation pattern becomes more directional as the frequency increases, because the size of the antenna in wavelengths increases;
(2)
The function σ 0 ( Δ f , r ) for most real surfaces is described by polynomials, but for the interpretation of the algorithm it is sufficient to consider it as a constant, i.e., σ 0 ( Δ f , r ) = 1 ;
(3)
The range of operating frequencies is limited by the function Π ˙ ( f ) , which can be considered uniformly passable in the frequency range from F min to F max :
Π ( f ) = { 1 F min | f | F max ; 0 | f | < F min & | f | > F max .
(4)
Let the radio pulse envelop be uniform, then
P ( Δ f f f ) P ( f + f ) d f = T 2 sin c ( π f T )
Taking into account the introduced assumptions, the inner part of the integral (29), which can be represented in the following form
f X 2 T 2 c 2 sin c ( π h cos α cos γ f X c ) Π ˙ ( f ) e j 2 π f ( t 1 t d ( r ) ) M ˙ ( t 1 t d ( r ) ) ,
is a time–frequency–space function that describes the part of the decorrelating filter, where
M ˙ ( t 1 t d ( r ) ) = Δ f ( Δ f f ) × s inc ( π h cos α cos γ ( Δ f f ) X c ) Π ˙ ( Δ f f ) sin c ( π ( Δ f f ) T ) e j 2 π ( Δ f f ) ( t 1 t d ( r ) ) d Δ f .
Then likelihood Equation (29) should be represented as follows:
Q ( t d ) = D 0 T u ( t 1 ) Z ˙ ( f , r , t 1 t d ( r ) ) U ˙ ( j 2 π f ) e j 2 π f ( t 1 t d ( r ) ) d f d t 1 d r = D 0 T u ( t 1 ) u Z ( t 1 t d ( r ) ) d t 1 d r ,
where u Z ( t 1 t d ( r ) ) is the observation after decorrelation in a filter with an amplitude–frequency response
Z ˙ ( f , r , t 1 t d ( r ) ) = Π ˙ ( f ) G ˙ ( r , f ) G ^ R 2 ( t 1 , f , t d ( r ) ) Δ f G ˙ ( r , Δ f f ) σ 0 ( Δ f , r ) × Π ˙ ( Δ f f ) P ˙ ( Δ f f f ) P ˙ ( f f ) d f e j 2 π ( Δ f f ) ( t 1 t d ( r ) ) d Δ f .
The right part of Equation (31) contains a signal processing algorithm to determine a function that depends on the delay time. However, considering the peculiarities of the ultra-wideband signals used in the problem being solved, it is necessary to further consider this algorithm, taking into account the following considerations. The internal correlation integral 0 T u ( t 1 ) u Z ( t 1 t d ( r ) ) d t 1 is always close to zero, except for the case when the condition t 1 t d ( r ) = t 1 is fulfilled. In addition, we neglect the decorrelation operation and move from u Z ( t 1 t d ( r ) ) to u ( t 1 t d ( r ) ) . Then Equation (31) can be represented as follows:
Q ( t d ) = D 0 T u 2 ( t 1 t d ( r ) ) d t 1 d r = | t 1 t d ( r ) = z d t 1 = d z t 1 = 0 z = t d ( r ) t 1 = T z = T t d ( r ) | = D d r t d ( r ) T t d ( r ) u 2 ( z ) d z .
Algorithm (33) actually involves the calculation of a parameter proportional to the signal energy, and the averaging of the received energies from all areas of the underlying surface. However, here there is an uncertainty about the need to immediately calculate the detection threshold of the reflected signal with energy calculation in order to distinguish it from the background of the receiver’s noise energy. In practice, this threshold can be chosen based on heuristic considerations.

3.2. Simulation Results

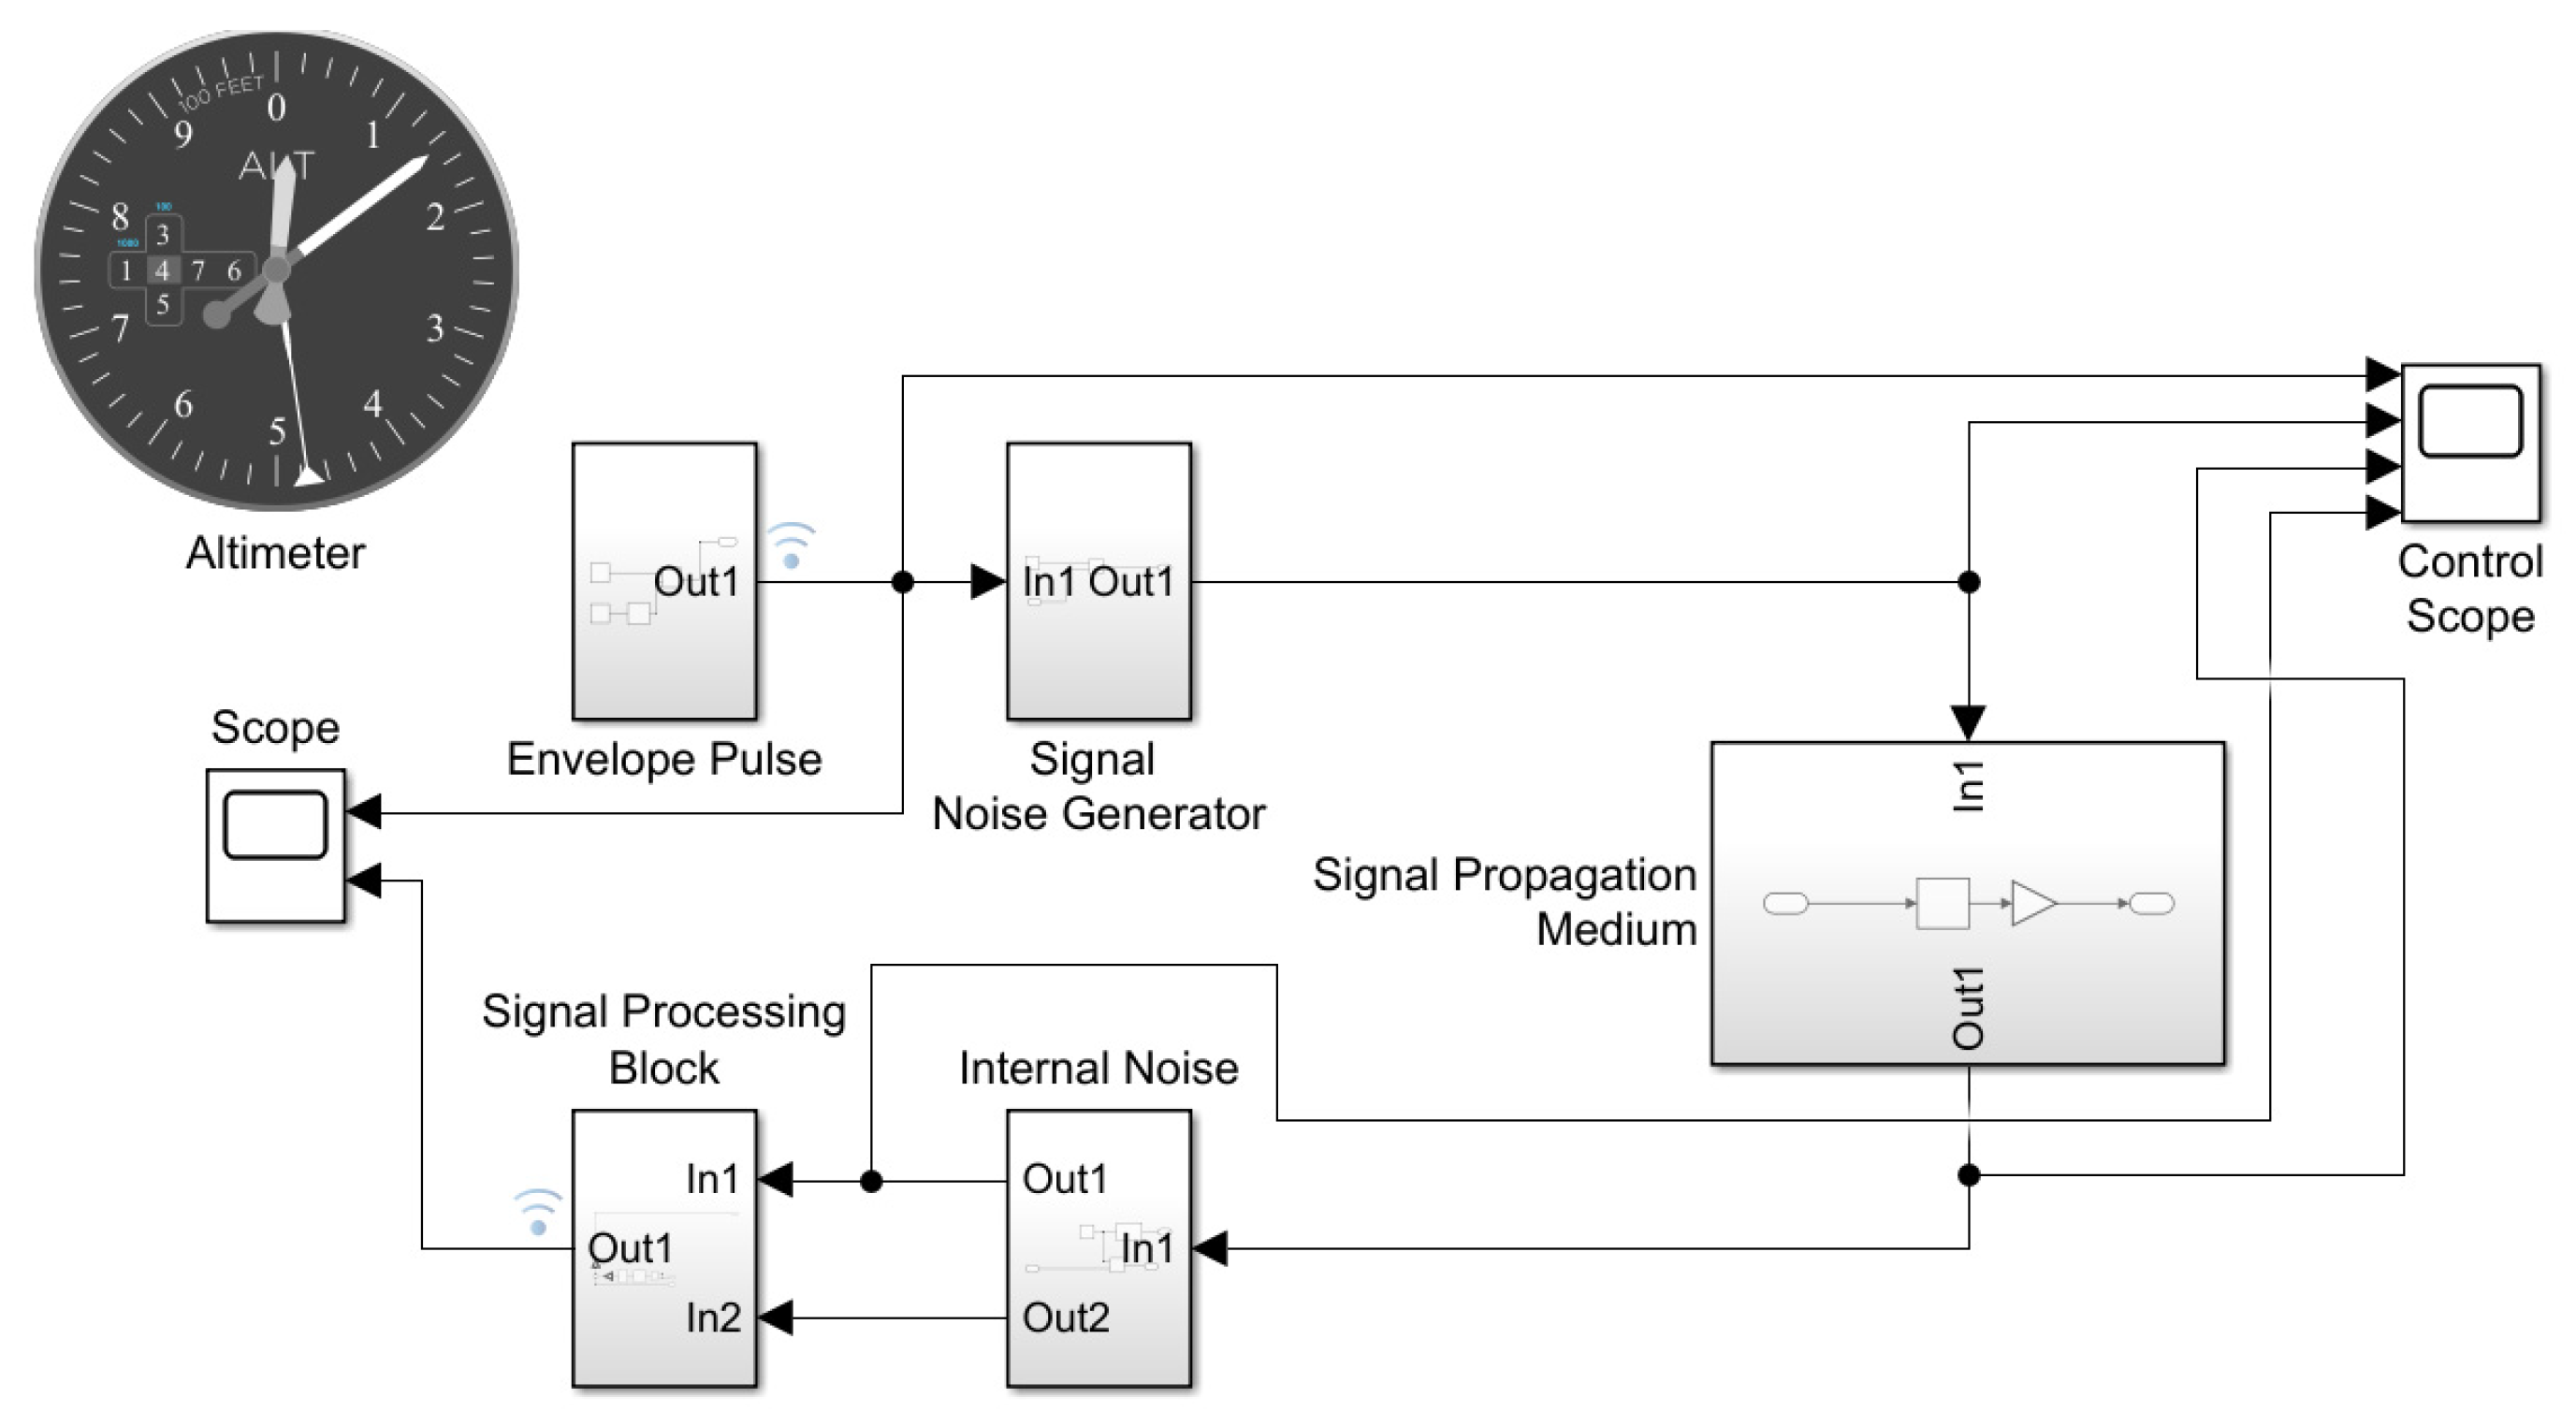
The structural diagram of the radar used for simulation is shown in Figure 2. The work of the model is as follows. The Envelop Pulse block generates an envelope of a noise pulse signal, which is then sent to the Signal Noise Generator block, which forms a wideband pulse stochastic signal. The generated radio pulse passes through the Signal propagation medium unit. In this unit, the signal is delayed for a time equivalent to a distance to the underlying surface of 1476 feet. This block also takes into account the dissipative properties of the signal propagation medium, as well as the fact that the radio pulse is reflected from the extended surface. The delayed signal is made noisy by the Internal Noise block and goes to the Signal Processing block, which performs the transformation in accordance with the algorithm (33). As mentioned earlier, algorithm (33) does not allow direct estimation of the range or the corresponding signal delay time. Thus, an envelope is observed at the output of the Signal processing block, which is further detected and based on which the delay time and the corresponding altitude to the underlying surface are calculated.
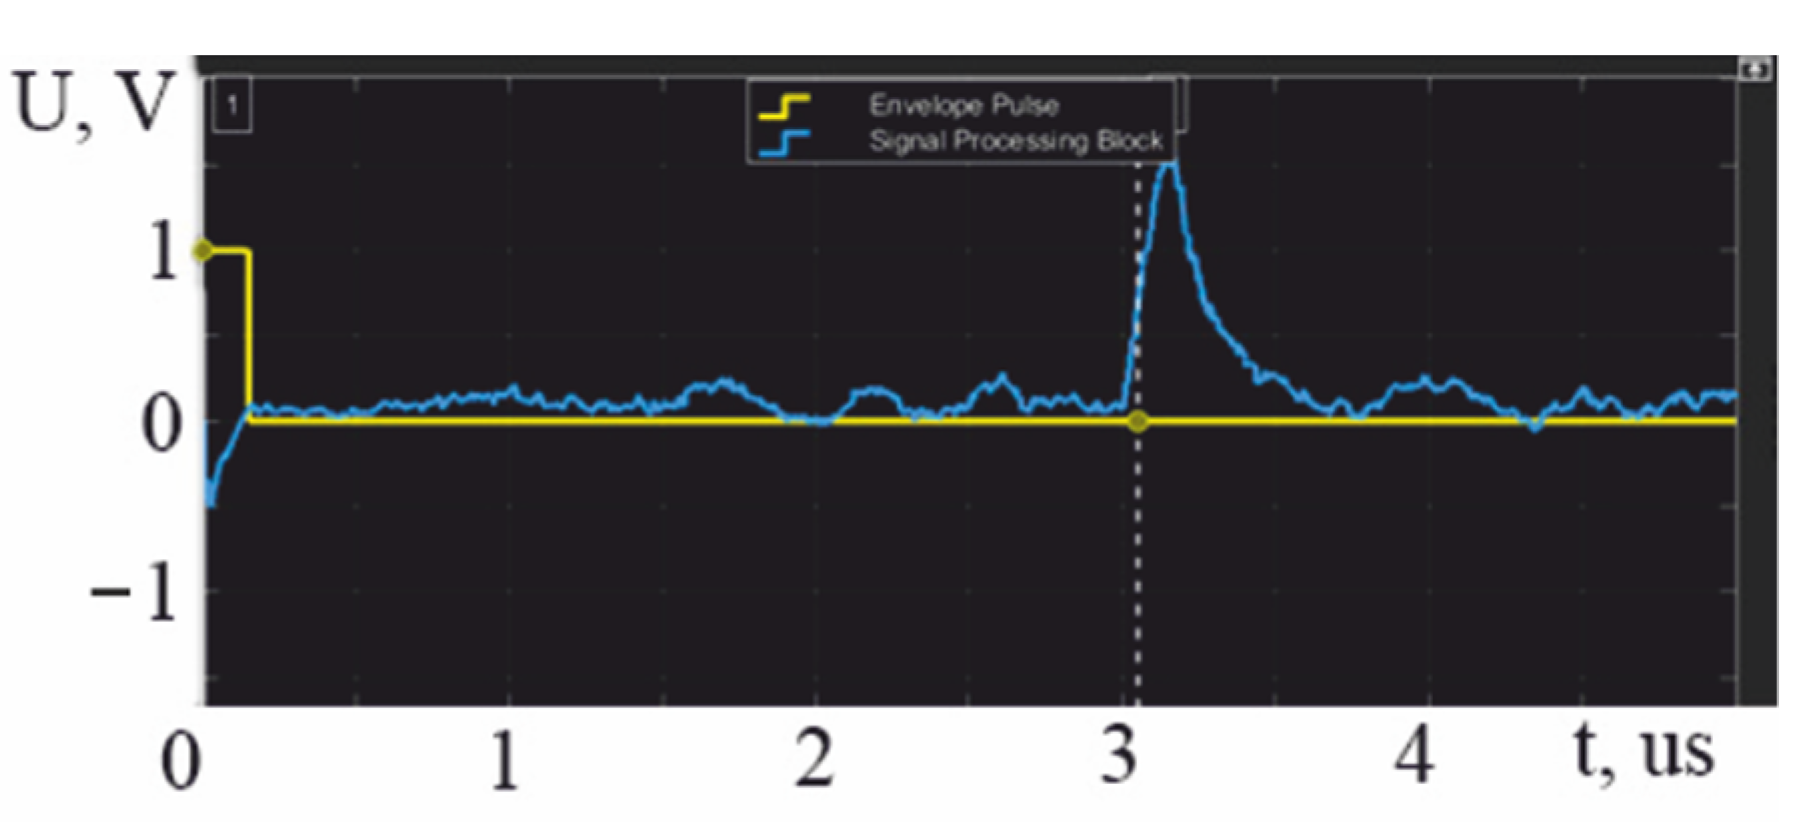
The diagrams of the circuit operation, which describe the previously mentioned sequence, are shown in Figure 3, and the result of the circuit operation is shown in Figure 4.
According to the obtained results in Figure 3 and Figure 4, it follows that considering the dissipative properties of the atmosphere and reflection from an extended source leads to the spreading of the pulse in time (Figure 3c). The envelope of the signal at the radar output has also changed its shape and its falling front is more like an exponential function.
Similar changes will be observed in the case when there is a significant difference in height within the area that reflects the signal (for example, the “forest-grassland” border). However, this fundamentally does not change the result and the height measurement will take place to the nearest front of the reflector.
The conducted modeling allows us to state that the synthesized signal processing algorithm and the scheme implemented in accordance with it fully meet the formulated task. It should also be noted that the altimeter determines the altitude according to the value specified during modeling with a certain error.

4. Discussion

One of the promising paths in the development of many types of modern radar systems is the transition from narrow-band deterministic to wide- and ultra-wideband stochastic probing signals. In airborne radio altimeters, such a transition can increase the accuracy of determining the required altitude parameter and significantly improve the overall noise immunity of the complex. However, such changes require a more detailed study and search for optimal and quasi-optimal signal processing algorithms, which is the subject of this article.
The calculation of the optimal signal processing algorithm for the mentioned system is performed using the maximum likelihood method. To obtain reliable results, this method requires the most accurate determination of the initial data, namely, the models of useful signals and noises used, their statistical characteristics and general physically reasoned assumptions. All initial data and preliminary calculations are presented in the second section of the article.
It should be noted that the transition from deterministic probing signals to stochastic ones has significantly complicated the overall solution of the optimization problem. Therefore, the desired delay time parameter (or advisory altitude) is usually present explicitly in the likelihood functional for the case of deterministic signals. However, for the current case of a stochastic probing signal, the formalization of the delay time is significantly complicated by the impossibility of representing the reference signal in the form of a model or an analytical record. As a result, in the likelihood Equation (28) there is no explicit delay time t d ( r ) , and the altitude calculation is possible using indirect parameters that depend on it. Thus, the resulting optimal algorithm (31) and quasi-optimal algorithm (33) provide for the delay time determination based on the received signal envelope Q ( t d ) calculation. The obtained result is well consistent with practice since many modern pulsed radar systems are also based on detecting the envelope of the received signal and further calculating the time between the signal emitted and received.
The main difference between the obtained optimal (31) and quasi-optimal (33) algorithms is the decorrelation operation of the received signal in a decorrelating filter with frequency response (32). The decorelation operation in the algorithm (31) improves the potential signal envelope Q ( t d ) calculating accuracy, but its implementation in practice is extremely difficult due to the high complexity of obtaining all the decorrelating filter parameters in real time, for example, the current radar cross-section σ 0 ( Δ f , r ) of the underlying surface. Therefore, in practice, it is advisable to implement algorithm (33), which is devoid of decorating filtering and requires only averaging the energies of the signals received from all sections of the underlying surface. This greatly simplifies the technical implementation at the cost of negligible loss in accuracy. However, determining the degree of degradation in accuracy requires additional research and is not the goal of this work.
The overall performance of the quasi-optimal algorithm (33) is verified by simulation using the simulation model shown in Figure 2. The general principle of the flight altitude determination algorithm is to calculate the delay time between the envelope of the emitted stochastic radio pulse and the envelope of the received one, which for the simulation case are shown in Figure 4. Therefore, the delay between the two envelopes is approximately 3 × 10 6 s , that can be converted into an altitude in feet using the well-known formula
H = 3 . 28084 c t d 2 .
In the simulation, the calculated altitude is 1476 feet, that is displayed on the altimeter block in Figure 2. From the obtained simulation results, we can conclude that the signal-processing algorithm (33) is operable, however, it requires the introduction of an additional operation to determine the delay time between the envelopes of the emitted and received radio pulses, and also assumes that the detection threshold of the received signal is known. These features can be attributed to the shortcomings of the Equation (33) implementation; however, in the practical implementation of radars, it is not difficult to implement a block for accurately determining the delay time between envelopes. The threshold for detecting the envelope of the received signal is also often determined heuristically. Thus, the implementation of an altimeter with the signal processing algorithm (33) is possible, and the accuracy of the altitude determining will largely depend on the selected received signal detecting threshold and on the accuracy of the block for determining the delay time.
It should also be noted that the obtained structure of the radar, with the exception of the use of broadband stochastic probing signals and the corresponding high-frequency paths, largely corresponds both to the theory of other authors [14], and to the existing serial samples of airborne altimeters [29,30].
Future research development. As part of further work, calculations of the potential accuracy of the obtained algorithm will be performed. Also, taking into account that the use of serial samples of radio electronic devices is quite relevant today in the technical implementation of receivers, the task of synthesizing the altitude estimation algorithm for a given system with a partially given structure of the input path will be considered. Currently, an experimental model of a radio altimeter operating in the wavelength range of 3 mm is being developed, which will allow to examine the general possibility of practical implementation of the obtained algorithms, as well as to determine the peculiarities of their implementation in final systems.

5. Conclusions

In this paper, for the first time, an algorithm for processing wideband pulsed stochastic signals in a radio altimeter is synthesized using the maximum likelihood method. The use of wideband signals in the given system led to some difficulties in solving the problem. Firstly, it concerns the difficulty of formalizing the delay time parameter in the likelihood functional for a noisy reference signal, since it could not be represented in the form of a model or an analytical equation. At the same time, due to the pulse signal being non-stationarity, it became necessary to calculate the corresponding inversion equation, that is performed for the first time. However, regardless of the formal difficulties in the approach to solving the problem, the synthesized signal processing algorithm is quite clear both for analysis and for its further technical implementation.
In accordance with the obtained algorithm, a simulation model of the radar is developed, and its simulation is carried out considering the unevenness of the underlying surface and the dispersed properties of the signal propagation medium. It is worth noting that the resulting algorithm does not allow direct estimation of the delay time parameter or the corresponding distance to the underlying surface, but only evaluates the envelope of the received signal. Therefore, its practical implementation should provide additional algorithms for estimating the delay time to the detected envelope. However, the resulting algorithm is quite convenient and understandable for technical implementation on a modern radio element base.

Author Contributions

Conceptualization, V.V., V.P. and O.O.; methodology, V.V. and S.Z.; software, E.T. and A.P.; validation, O.U., A.P. and A.H.; formal analysis, V.P. and S.Z.; investigation, O.O. and A.P.; resources, E.T.; data curation, A.H.; writing—original draft preparation, V.P. and O.O.; writing—review and editing, S.Z. and O.U.; visualization, E.T.; supervision, V.V.; project administration, V.P.; funding acquisition, O.U. All authors have read and agreed to the published version of the manuscript.

Funding

The work was funded by the Ministry of Education and Science of Ukraine, the state registration numbers of the projects are 0122U200469 and 0121U109598.

Institutional Review Board Statement

Not applicable.

Informed Consent Statement

Not applicable.

Data Availability Statement

Not applicable.

Conflicts of Interest

The authors declare no conflict of interest.

References

  1. Chen, M.; Zhang, Y.; Chen, Y. Review on civil aviation safety investment research. In Proceedings of the 2016 11th International Conference on Reliability, Maintainability and Safety (ICRMS), Hangzhou, China, 26–28 October 2016; pp. 1–5. [Google Scholar]
  2. Lungu, M.; Lungu, R. Complete landing autopilot having control laws based on neural networks and dynamic inversion. In Proceedings of the 2017 18th International Carpathian Control Conference (ICCC), Sinaia, Romania, 28–31 May 2017; pp. 17–22. [Google Scholar]
  3. Watkins, D.; Gallardo, G.; Chau, S. Pilot Support System: A Machine Learning Approach. In Proceedings of the 2018 IEEE 12th International Conference on Semantic Computing (ICSC), Laguna Hills, CA, USA, 31 January–2 February 2018; pp. 325–328. [Google Scholar]
  4. Bolanakis, D.E. MEMS barometers and barometric altimeters in industrial, medical, aerospace, and consumer applications. IEEE Instrum. Meas. Mag. 2017, 20, 30–55. [Google Scholar] [CrossRef]
  5. Kai, L.; Jun-Jie, L.; Jing, W.; Xiao-Jun, W. Research on Augmented Reality Technology of Heli-copter Aided Navigation Based on Lidar. In Proceedings of the 2021 IEEE 7th International Conference on Virtual Reality (ICVR), Foshan, China, 20–22 May 2021; pp. 373–379. [Google Scholar]
  6. Zhao, J.; Li, Y.; Hu, D.; Pei, Z. Design on altitude control system of quad rotor based on laser radar. In Proceedings of the 2016 IEEE International Conference on Aircraft Utility Systems (AUS), Beijing, China, 8–14 October 2016; pp. 105–109. [Google Scholar]
  7. Brockers, R. Autonomous Safe Landing Site Detection for a Future Mars Science Helicopter. In Proceedings of the 2021 IEEE Aerospace Conference (50100), Big Sky, MT, USA, 6–13 March 2021; pp. 1–8. [Google Scholar]
  8. Rahman, A.M.; Hossain, S.; Tuku, I.J.; Hossam-E-Haider, M.; Amin, M.S. Feasibility study of GSM network for tracking low altitude helicopter. In Proceedings of the 2016 3rd International Conference on Electrical Engineering and Information Communication Technology (ICEEICT), Dhaka, Bangladesh, 22–24 September 2016; pp. 1–8. [Google Scholar]
  9. Videmsek, A.; de Haag, M.U.; Bleakley, T. Evaluation of RADAR altimeter-aided GPS for precision approach using flight test data r. In Proceedings of the Digital Avionics Systems Conference (DASC), San Diego, CA, USA, 8–12 September 2019; pp. 1–10. [Google Scholar]
  10. Liu, B.; Meng, Z.; Zhou, Y. Nonlinear path following for unmanned helicopter. In Proceedings of the IEEE International Conference on Information and Automation, Macau, China, 18–20 July 2017; pp. 737–743. [Google Scholar]
  11. Chen, Y.; Wang, C.; Zeng, W.; Wu, Y. Horizontal Nonlinear Path Following Guidance Law for a Small UAV with Parameter Optimized by NMPC. IEEE Access 2021, 9, 127102–127116. [Google Scholar] [CrossRef]
  12. Ragi, S.; Mittelmann, H.D.; Zhou, Y. Mixed-integer nonlinear programming formulation of a UAV path optimization problem. In Proceedings of the 2017 American Control Conference (ACC), Seattle, WA, USA, 24–26 May 2017; pp. 406–411. [Google Scholar]
  13. 686-2017—IEEE Standard for Radar Definitions; IEEE: New York, NY, USA, 2017; pp. 1–54.
  14. Madhupriya, G.; Lavanya, K.S.; Vennisa, V.; Raajan, N.R. Implementation of Compressed Wave Pulsed Radar Altimeter in Signal Processing. In Proceedings of the 2019 International Conference on Computer Communication and Informatics (ICCCI), Coimbatore, India, 23–25 January 2019; pp. 1–5. [Google Scholar]
  15. Li, Y.; Hoogeboom, P.L.; Dekker, P.L.; Mok, S.-H.; Guo, J.; Buck, C. CubeSat Altimeter Constellation Systems: Performance Analysis and Methodology. IEEE Trans. Geosc. Rem. Sens. 2022, 60, 1–19. [Google Scholar] [CrossRef]
  16. Mogyla, A.; Kantsedal, V. Estimation of the Parameters of the Stochastic Probing Radio Signal Reflected by the Target. In Proceedings of the 2020 IEEE Ukrainian Microwave Week (UkrMW), Kharkiv, Ukraine, 22–27 June 2020; pp. 379–383. [Google Scholar]
  17. Ravenscroft, B.; Blunt, S.D.; Allen, C.; Martone, A.; Sherbondy, K. Analysis of spectral notching in FM noise radar using measured interference. In Proceedings of the International Conference on Radar Systems (Radar 2017), Belfast, UK, 23–26 October 2017; pp. 1–6. [Google Scholar]
  18. Wasserzier, C.; Wojaczek, P.; Cristallini, D.; Worms, J.; O’Hagan, D. Doppler-Spread Clutter Suppression in Single-Channel Noise Radar. In Proceedings of the 2019 International Radar Conference (RADAR), Toulon, France, 23–27 September 2019; pp. 1–4. [Google Scholar]
  19. Zhang, L.; Kuang, Q.; Chang, M.; Zhang, D. A 10-GS/s Sample and Hold System for High-Speed Time-Interleaved ADC. In Proceedings of the 2018 Eighth International Conference on Instrumenta-tion & Measurement, Computer, Communication and Control (IMCCC), Harbin, China, 19–21 July 2018; pp. 705–708. [Google Scholar]
  20. Genschow, D.; Kloas, J. Evaluation of a UWB radar interface for low power radar sensors. In Proceedings of the 2015 European Radar Conference (EuRAD), Paris, France, 9–11 September 2015; pp. 321–324. [Google Scholar]
  21. Wang, D. A Gm-Compensated 46–101 GHz Broadband Power Amplifier for High-Resolution FMCW Radars. In Proceedings of the 2021 IEEE International Symposium on Circuits and Systems (ISCAS), Daego, Korea, 22–28 May 2021; pp. 1–5. [Google Scholar]
  22. Rachid, E.A.; Farha, R.M. Ultra-wideband: Very simple printed antennas with Windows in K, Ka and Q bands. In Proceedings of the 2016 IEEE Conference on Antenna Measurements & Applications (CAMA), New York, NY, USA, 23–27 October 2016; pp. 1–4. [Google Scholar]
  23. Tarchi, D.; Lukin, K.; Fortuny-Guasch, J.; Mogyla, A.; Vyplavin, P.; Sieber, A. SAR Imaging with Noise Radar. IEEE Trans. Aerosp. Electron. Syst. 2010, 46, 1214–1225. [Google Scholar] [CrossRef]
  24. Ostroumov, I.; Kuzmenko, N.; Sushchenko, O.; Pavlikov, V.; Zhyla, S.; Solomentsev, O.; Zaliskyi, M.; Averyanova, Y.; Tserne, E.; Popov, A.; et al. Modelling and simulation of DME navigation global service volume. Adv. Space Res. 2021, 68, 3495–3507. [Google Scholar] [CrossRef]
  25. Pavlikov, V.; Belousov, K.; Zhyla, S.; Tserne, E.; Shmatko, O.; Sobkolov, A.; Vlasenko, D.; Kosharskyi, V.; Odokiienko, O.; Ruzhentsev, M. Radar imaging complex with sar and asr for aerospace vechicle. Radioel. Comp. Syst. 2021, 3, 63–78. [Google Scholar] [CrossRef]
  26. Pavlikov, V.; Volosyuk, V.; Zhyla, S.; Tserne, E.; Shmatko, O.; Sobkolov, A. Active-Passive Radar for Radar Imaging from Aero-space Carriers. In Proceedings of the 2016 IEEE EUROCON 2021—19th International Conference on Smart Technologies, Lviv, Ukraine, 6–8 July 2021; pp. 18–24. [Google Scholar]
  27. Zhyla, S.; Volosyuk, V.; Pavlikov, V.; Ruzhentsev, N.; Tserne, E.; Popov, A.; Shmatko, O.; Havrylenko, O.; Kuzmenko, N.; Dergachov, K.; et al. Statistical synthesis of aerospace radars structure with optimal spatio-temporal signal processing, extended observation area and high spatial resolution. Radioel. Comp. Syst. 2022, 1, 178–194. [Google Scholar] [CrossRef]
  28. Volosyuk, V.; Kravchenko, V. Theory of Radio-Engineering Systems of Remote Sensing and Radar; Fizmatlit: Moscow, Russia, 2008. [Google Scholar]
  29. Compact Radar Altimeter. Available online: https://electronics.leonardo.com/documents/16277707/18391547/Compact+Radar+Altimeter+%28MM09113%29_LQ.pdf (accessed on 18 March 2022).
  30. Radar Altimeter. Available online: https://www.freeflightsystems.com/blog/product/radar-altimeters/ (accessed on 25 March 2022).
  31. Arslan, S.; Yıldırım, B.S. A Broadband Microwave Noise Generator Using Zener Diodes and a New Technique for Generating White Noise. IEEE Microw. Wirel. Compon. Lett. 2018, 28, 329–331. [Google Scholar] [CrossRef]
  32. Pritsker, D.; Cheung, C.; Neoh, H.S.; Nash, G. Wideband Programmable Gaussian Noise Generator on FPGA. In Proceedings of the 2019 IEEE National Aerospace and Electronics Conference (NAECON), Dayton, OH, USA, 15–19 July 2019; pp. 412–415. [Google Scholar]
  33. Kravchenko, V.; Kutuza, B.; Volosyuk, V.; Pavlikov, V.; Zhyla, S. Super-resolution SAR imaging: Optimal algorithm synthesis and simulation results. In Proceedings of the 2017 Progress in Electromagnetics Research Symposium—Spring (PIERS), St. Petersburg, Russia, 22–25 May 2017; pp. 419–425. [Google Scholar]
  34. Pavlikov, V.; Zhyla, S.; Odokienko, O. Structural optimization of Dicke-type radiometer. In Proceedings of the 2016 II International Young Scientists Forum on Ap-plied Physics and Engineering (YSF), Kharkiv, Ukraine, 10–14 October 2016; pp. 171–174. [Google Scholar]
  35. Volosyuk, V.; Zhyla, S.; Pavlikov, V.; Ruzhentsev, N.; Tserne, E.; Popov, A.; Shmatko, O.; Dergachov, K.; Havrylenko, O.; Ostroumov, I.; et al. Optimal Method for Polarization Selection of Stationary Objects against the Background of the Earth’s Surface. Int. J. Electron. Telecommun. 2022, 68, 83–89. [Google Scholar]
  36. Tsopa, A.I.; Ivanov, V.K.; Leonidov, V.I.; Maleshenko, Y.I.; Pavlikov, V.V.; Ruzhentsev, N.V.; Zarudniy, A.A. The research program of millimetric radio waves attenuation characteristics on perspective communication lines of Ukraine. In Proceedings of the 2016 13th International Conference on Modern Probems of Radio Engineering, Telecommunications and Computer Science (TCSET), Lviv, Ukraine, 23–26 February 2016; pp. 638–642. [Google Scholar]
  37. Pavlikov, V.V.; Volosyuk, V.K.; Zhyla, S.S.; Van, H.N. Active Aperture Synthesis Radar for High Spatial Resolution Imaging. In Proceedings of the 2018 9th International Conference on Ultrawideband and Ultrashort Impulse Signals (UWBUSIS), Odessa, Ukraine, 4–7 September 2018; pp. 252–255. [Google Scholar]
  38. Astola, J.T.; Egiazarian, K.O.; Khlopov, G.I.; Khomenko, S.I.; Kurbatov, I.V.; Morozov, V.Y.; Totsky, A.V. Application of Bispectrum Estimation for Time-Frequency Analysis of Ground Surveillance Doppler radar Echo Signals. IEEE Trans. Instrum. Meas. 2008, 57, 1949–1957. [Google Scholar] [CrossRef]
Figure 1. Physical parameters and geometric relationships used in the synthesis of the helicopter altitude measurement algorithm.
Computation 10 00150 g001
Figure 2. A simulation model of a wideband altimeter containing a transceiver part and realizing signal distortion during its propagation in the environment and reflection from the underlying surface.
Computation 10 00150 g002
Figure 3. Signals at the blocks output: (a) pulse envelop; (b) signal noise generator; (c) signal propagation medium; and (d) internal noise.
Computation 10 00150 g003
Figure 4. The time relationship between the emitted radio pulse envelope (yellow line) and the received reflected radio pulse envelope (blue line), the delay between which allows you to calculate the altitude to the underlying surface.
Computation 10 00150 g004
Publisher’s Note: MDPI stays neutral with regard to jurisdictional claims in published maps and institutional affiliations.