Article

Ultrashort Echo Time and Fast Field Echo Imaging for Spine Bone Imaging with Application in Spondylolysis Evaluation

1
Department of Radiology, University of California-San Diego, San Diego, CA 92103, USA
2
Canon Medical Systems Corporation, Otawara 324-0036, Tochigi, Japan
3
Department of Family Medicine, University of California-San Diego, San Diego, CA 92103, USA
4
Department of Radiology, VA San Diego Healthcare System, San Diego, CA 92161, USA
*
Author to whom correspondence should be addressed.
Computation 2024, 12(8), 152; https://doi.org/10.3390/computation12080152
Submission received: 8 June 2024 / Revised: 15 July 2024 / Accepted: 22 July 2024 / Published: 24 July 2024
(This article belongs to the Special Issue Computational Medical Image Analysis—2nd Edition)

Abstract

:
Isthmic spondylolysis is characterized by a stress injury to the pars interarticularis bones of the lumbar spines and is often missed by conventional magnetic resonance imaging (MRI), necessitating a computed tomography (CT) for accurate diagnosis. We compare MRI techniques suitable for producing CT-like images. Lumbar spines of asymptomatic and low back pain (LBP) subjects were imaged at 3-Tesla with multi-echo ultrashort echo time (UTE) and field echo (FE) sequences followed by simple post-processing of averaging and inverting to depict spinal bones with a CT-like appearance. The contrast-to-noise ratio (CNR) for bone was determined to compare UTE vs. FE and single-echo vs. multi-echo data. Visually, both sequences depicted cortical bone with good contrast; UTE-processed sequences provided a flatter contrast for soft tissues that made them easy to distinguish from bone, while FE-processed images had better resolution and bone–muscle contrast, which are important for fracture detection. Additionally, multi-echo images provided significantly (p = 0.03) greater CNR compared with single-echo images. Using these techniques, progressive spondylolysis was detected in an LBP subject. This study demonstrates the feasibility of using spine bone MRI to yield CT-like contrast. Through the employment of multi-echo UTE and FE sequences combined with simple processing, we observe sufficient enhancements in image quality and contrast to detect pars fractures.

Graphical Abstract

1. Introduction

Low back pain (LBP) affects a significant proportion of young athletes, with up to 36% reporting it annually [1]. Isthmic spondylolysis [2] is characterized by a stress injury to the pars interarticularis of the vertebral arch of the lumbar spine [3,4]. It is a prevalent condition among young athletes engaged in activities that place repetitive stress on the lumbar spine. While the exact incidence of isthmic spondylolysis is not well documented, studies have reported it as a frequent cause of low back pain in young athletes, with prevalence rates ranging from 20% to 50% [5]. These findings highlight the need for accurate, radiation-free diagnostic tools for young individuals.
Isthmic spondylolysis presents with varying severity, necessitating different imaging techniques for its accurate assessment. In the initial stage of stress injuries to the pars interarticularis characterized by bone marrow edema without fracture, magnetic resonance imaging (MRI) is the most sensitive tool for detecting bone stress reactions [6,7]. As the condition progresses, both bone stress reactions and fractures may be present, while the terminal stage involves only fractures. Computed tomography (CT) is superior for visualizing bone fractures. This variability in presentation makes it challenging for a single imaging modality to fully characterize the stage of isthmic spondylolysis. Both MRI and CT play crucial roles in the evaluation, and frequently, both modalities are necessary for a definitive diagnosis.
Due to concerns about ionizing radiation exposure in young patients, particularly those of reproductive age, MRI is the preferred initial imaging modality for detecting isthmic spondylolysis. However, due to the limited ability to visualize bone detail, conventional MRI frequently fails to identify a significant number of bone fractures that are later detected by CT scans [6,7,8]. A follow-up CT scan, providing excellent contrast and visualization for fine bone details [9], is then needed to ascertain the diagnosis for bone fracture at the pars. While multiple CT scans are detrimental for the long-term health of adolescent subjects, increasing the risk of cancer [10,11,12], it can be unavoidable in those who sustain recurrent low back injury, known to occur in as many as 33% of sport back injury patients within a year [13]. Reduction or avoidance of radiation would be highly beneficial for the imaging of young athletes suffering from low back pain.
Newer MRI techniques are gradually being adapted for bone imaging, with the development of sequences like ultrashort echo time (UTE) [14] and zero echo time (ZTE) [15]. These techniques have shown potential in visualizing the bone structure in several joints, including the knee [15,16], shoulder [17], and lumbar spine [18]. Nonetheless, they are hampered by inherent limitations, such as a low signal-to-noise ratio (SNR) and lower resolution, compared with CT. Thus, the continued study and development of bone-oriented MR techniques is warranted.
In this study, our objective was to introduce and compare two MRI techniques for imaging bone—multi-echo UTE and multi-echo field echo (FE) acquisitions—combined with simple post-processing to enhance appearance, SNR, and image contrast, with the aim of providing CT-like image characteristics. The use of multi-echo images to improve SNR has been proposed previously [19,20], and it will likely benefit UTE imaging for depicting cortical bone. FE sequences have also been suggested for bone imaging [21], with notable strengths including the wide availability of the sequence from major MRI vendors, high spatial resolution, and high contrast between muscle and bone, which are useful for bone visualization. In this study, we combined UTE and FE acquisitions with simple post-processing techniques to provide a CT-like appearance and to improve image quality.

2. Materials and Methods

2.1. Subjects

Lumbar spines of four subjects (1 male, 3 females; 19.5 ± 5.5 years old) were imaged at 3-T (Canon Galan) with a posterior spine coil. Two health volunteers were recruited with the inclusion criteria of no low back pain or history of low back surgery. Two of the subjects were adolescent (16 yo female, 14 yo male) athletes with non-specific and non-radiating low back pain for the past 4–8 weeks. The symptoms did not improve with conservative treatment, and the patients’ primary care physician referred them to be evaluated for the presence of spondylolysis.

2.2. MRI

The subjects were imaged with a 3-Tesla MRI scanner (Galan, Canon Medical Systems Corp., Otawara, Japan) fitted with a posterior receive-only spine coil. One anatomical sequence and two bone-oriented sequences were used to image each subject. The anatomical sequence was a sagittal T2-weighted fast spin echo (FSE T2) with fat suppression with the following scanning parameters: repetition time (TR) = 5600 milliseconds (ms), echo time (TE) = 80 ms, field of view (FOV) = 220 millimeters (mm), image matrix = 320 × 416, slice thickness = 3 mm, and echo train length (ETL) = 19. The bone-oriented sequences were (1) an axial 3D UTE multi-echo sequence with scan parameters of TR = 16.7 ms; TE = 0.1, 2.7, 5.3 ms; number of projections = 19,968; FOV = 300 ms; matrix = 320 × 320; and slice = 1 mm, reformatted to the sagittal plane and (2) a sagittal 3D field echo (FE) multi-echo sequence with scan parameters of TR = 21.8 ms; TE = 4, 8.6, 13.2 ms; FOV = 170 mm; matrix = 320 × 240; and slice = 1 mm. The source images are shown in Figure 1. While no formal optimization was performed, we initially tried different numbers of radial projections for the 3D UTE, and different TE values for the 3D FE.

2.3. CT-like Image Processing

To create a CT-like appearance from the bone-oriented MRIs, and to demonstrate the advantage of using multiple images from multi-echo acquisition, the images were processed directly on the scanner console in the following 2 ways. First, a set of CT-like images were created from the first-echo images from the UTE (TE = 0.1 ms, Figure 1B) and FE (TE = 4 ms; Figure 1D) were simply inverted (Equation (1)) to make the bone tissues bright and the surrounding tissues dark (Figure 2A,C).
F i r s t   E c h o   C T - l i k e   I m a g e = 1 S o u r c e   I m a g e
A second set of CT-like images were created from all images (with varying TEs) in the multi-echo series. For each sequence of the UTE and the FE, all of the source images from different TEs were averaged and then inverted to yield the final CT-like images (Figure 2B,D) following Equation (2), where i = the source images corresponding to each TE and n = the number of TEs.
M u l t i - E c h o   C T - l i k e   I m a g e = n i = 1 n S o u r c e   I m a g e i
The intention was that the averaging would reduce the noise, and the inversion would provide high signal intensity to the bone. Representative processed images from both approaches using the UTE and the FE are shown in Figure 2.

2.4. Signal-to-Noise Ratio (SNR) and Contrast-to-Noise Ratio (CNR)

Regions of interest (ROI) were drawn on a sagittal slice of the processed CT-like images that depicted cortical bone of the pars interarticularis and the surrounding paraspinal muscles (Figure 3). The ROIs were placed manually by a scientist with over 10 years of experience in imaging research. ROIs for the bone were placed along the pars interarticularis, and ROIs for the muscle were placed in the adjacent paraspinal muscle posterior to the bone ROI. Within each ROI, we determined the mean signal intensity (SImean). An ROI was also placed in the background (air) to determine the standard deviation (SISD) of the noise signal intensity. We evaluated slice-to-slice variability by the coefficient of variation in the mean signal intensity of bone ROIs in 5 consecutive slices of two datasets and found less than 2% variability, regardless of the sequence used.
The SNR was determined from the mean signal intensity divided by the standard deviation of the noise in the air [22] (Equation (3)).
S N R 1 = S I m e a n 1 S I S D n o i s e
The CNR was determined from the difference in mean signal intensity between selected ROIs divided by the standard deviation of the noise [23] (Equation (4)).
C N R 1 2 = S I m e a n 1 S I m e a n 2 S I S D n o i s e

2.5. Statistics

SNR and CNR values between the four types of CT-like images (processed from UTE 1st-echo, UTE multi-echo, FE 1st-echo, and FE multi-echo images) were compared using fully-factorial two-way ANOVA [24,25] to determine the effects of the sequence (UTE vs. FE) and the use of 1st-echo image vs. all three images from the multi-echo processing. The Systat statistical analysis software (v12, Grafiti LLC, Palo Alto, CA, USA) was used. The significance level was set at 5%.

2.6. Spondylolysis Evaluation

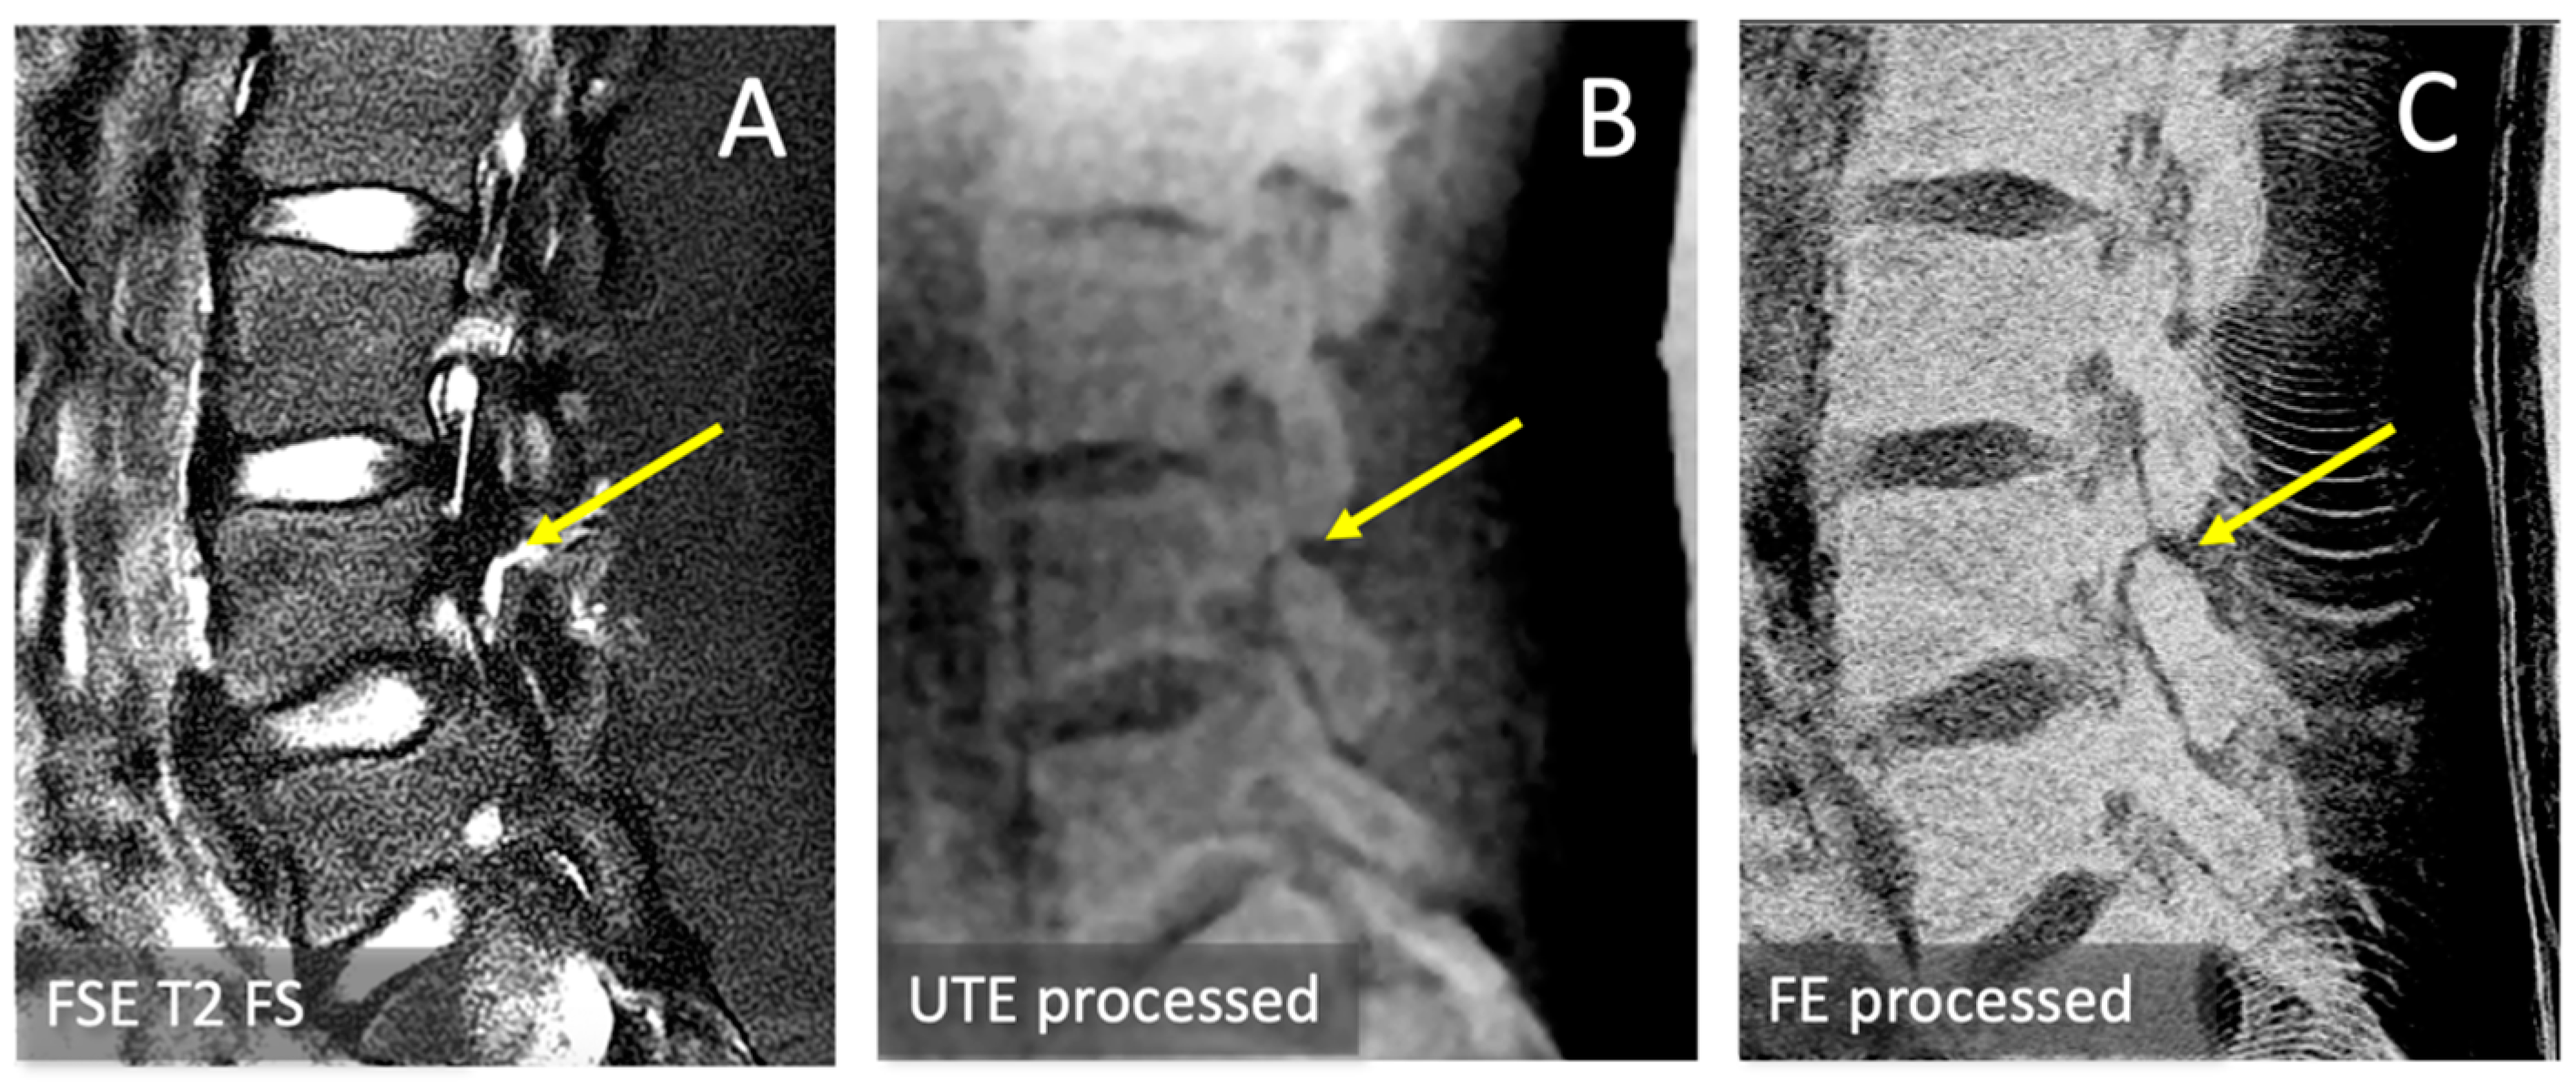
For the two subjects with low back pain, we compared the conventional SE T2, multi-echo-processed UTE, and multi-echo-processed FE images to evaluate the presence of spondylolysis (Figure 4).

3. Results

3.1. Observations

Compared with FSE T2 (Figure 1A), CT-like processed images from first-echo (Figure 2A,C) and multi-echo (Figure 2B,D) UTE and FE images all depicted spinal bone distinctly with high signal intensity, similar to CT. UTE (Figure 2A,B) and FE (Figure 2B,C) images, while both providing CT-like contrast, had notable differences. UTE images were softer, while providing a flatter contrast for the soft tissue, making it easier to distinguish the bone if the reader is unfamiliar with the anatomy. In contrast, FE images were markedly sharper and depicted bone with a higher contrast. But FE images depicted many non-bone tissues (e.g., fascia of muscle) with a similarly high signal intensity as bone. This makes FE imaging less desirable for tasks such as the automatic segmentation and visualization of bone but more desirable for evaluating small features such as hairline fractures. When comparing CT-like images from first-echo (Figure 2A,C) vs. multi-echo (Figure 2B,D), the multi-echo images showed an improvement, with less noise and better contrast for bone overall.

3.2. SNR and CNR

Table 1 summarizes the SNR and CNR values for the CT-like processed images. CT-like images from the UTE data had mean SNR values for the bone ranging from 90 to 100, which were significantly higher (p = 0.0002) than the values from the FE data (mean SNR range of 38 to 53). However, the CNR (bone–muscle) values were slightly higher (p = 0.09) for FE (mean CNR ranging from 15 to 22) compared with UTE (CNR of 13 to 16). The use of multi-echo images, for both UTE and FE data improved the CNR values significantly (p = 0.03): for UTE, the CNR on average improved by 2.7, while for FE, the CNR improved by 6.9. This corroborates the visual improvements in bone contrast observed in the image comparison in Figure 2.

3.3. Spondylolysis Depiction

In one of the low back pain subjects, we detected progressive spondylolysis with a moderate-sized bone defect seen as a gap with high signal intensity in FSE T2 (Figure 4A, arrow) and a clear non-union in both the multi-echo-processed UTE (Figure 4B, arrow) and multi-echo-processed FE (Figure 4C, arrow) images. We also measured the signal profile across the bone defect in UTE-processed and FE-processed images. The defect widths, measured as full width at half maximum, were 2.75 mm and 2.39 mm for UTE and FE, respectively.

4. Discussion

This study has demonstrated the feasibility of spine bone MRI to yield CT-like contrast. Through the employment of multi-echo UTE and FE sequences combined with straightforward image processing techniques, we have observed discernible enhancements in image quality and bone contrast compared with using single-echo approaches. Our findings are encouraging, suggesting that these approaches can be used to obtain CT-like images useful for evaluating spondylolysis, albeit with limitations.
Our study compared multi-echo UTE and multi-echo 3D FE sequences and demonstrated that, while both sequences can depict cortical bone reasonably well, UTE imaging provided a flatter contrast for soft tissues that made distinguishing bone (appearing dark) from surrounding tissues (appearing bright) easier, while FE images had greater spatial resolution and bone–muscle contrast than UTE, which will be invaluable for detecting finer fractures. We also showed that processing all images from multi-echo acquisition provided significantly a greater CNR for bone for both UTE and FE acquisitions.
Our study builds upon past studies with a similar purpose of imaging bone using MRI. Many utilized a similar approach of acquiring images that depict bone with a signal void and surrounding tissue with higher signal intensity and inverting the image to provide a CT-like appearance [21,26,27]. These studies have demonstrated that these conventional sequences can indeed provide a good depiction of cortical bone structure, and in one study [27], high accuracy (>90%) in detecting bone fractures was demonstrated. Our result generally corroborated these past results and suggested the benefit of using multi-echo images for improving image quality. While we did not formally investigate the effect of different processing techniques, our simple averaging and inverting approach can be performed on any MRI console using built-in image processing tools. Various other processing techniques such as rescaled echo subtraction [28], simple inversion of a single echo [27], or summation of all but the last echo followed by the last echo [21] have been attempted with varying degrees of success. There are even more advanced approaches available, such as using deep learning to create CT-like (pseudo-CT) images from MRI [18,29,30], but these currently require extensive off-line processing that may delay clinical evaluation.
This is an early study with many limitations. While the feasibility has been shown, a comparative study using CT reference images is needed. Since it is difficult to acquire both CT and MRI images without a clinical need, an initial study could utilize cadaveric specimens, as performed previously [18]. Also, the number of subjects used was very small, but this is typical in early technical development. Nonetheless, a larger study will be needed in the future to confirm the present findings and to make the results generalizable for the intended application. We found that the differences in the SNR and the CNR between MR sequences were substantial, and the trend will likely be similar with a greater number of subjects, since the signal intensity of cortical bone and muscle may not vary markedly between subjects without a particular pathology. While it would have been ideal to involve radiologists to compare the image quality and the diagnostic performance for detecting pars fractures, that would have required quite a large number of subjects, as well as reference CT images. This is a likely future extension of the current work. As an early study, we were able to enroll two young athletes with persistent low back pain and positively showed spondylolysis in one of them in Figure 4, demonstrating the clinical feasibility.
Despite advances in pulse sequences and post-processing techniques, there is still no MRI-based method that can produce images equivalent to CT scans. In terms of techniques appropriate for bone fracture evaluation at the pars, both techniques discussed in this paper, along with past similar approaches based on conventional image processing [19,21,27], might provide value. The use of artificial intelligence to synthesize pseudo-CT images from MRI images [18,31,32], while yielding the best bone contrast (reaching CNRs of 100 to 150 [18], compared with about 20 in this study) and CT-like appearance, are not yet practical. Future work will explore the possibility of improving bone imaging by using more advanced image processing and/or deep learning techniques.

5. Conclusions

In conclusion, this study has demonstrated the feasibility of two MRI techniques to provide a radiation-free alternative for the evaluation of spondylolysis, with their clinical application shown on a young subject with a pars defect. Further advancements in MRI technology with multi-echo UTE and FE have the potential to transform the standard of care for adolescent athletes and others with isthmic spondylolysis, offering a safer, equally effective, and radiation-free imaging alternative.

Author Contributions

Conceptualization: W.C.B., S.A., V.M. and M.M.; methodology, W.C.B., V.M., Y.Y. and M.M.; software, W.C.B., V.M. and Y.Y.; validation, W.C.B. and S.A.; formal analysis, D.V. and W.C.B.; investigation, W.C.B., M.M., S.A., Y.Y., T.Y., A.M. and D.V.; resources, A.M., T.Y. and D.V.; data curation, W.C.B.; writing—original draft preparation, W.C.B., S.A. and M.M.; writing—review and editing, V.M., A.M., T.Y., S.A., D.V. and W.C.B.; visualization, W.C.B.; supervision, M.M. and W.C.B.; project administration, A.M. and W.C.B.; funding acquisition, M.M. and W.C.B. All authors have read and agreed to the published version of the manuscript.

Funding

Won C. Bae received research funding from Canon Medical Systems, USA. Mitsue Miyazaki received research funding from Canon Medical Systems Corporation, Japan (35938). The funding agencies had no role in the study design, data collection, interpretation, or the decision to submit this work for publication.

Institutional Review Board Statement

The study was conducted in accordance with the Declaration of Helsinki and approved by the Institutional Review Board of University of California, San Diego (protocol #200335, approval date 17 October 2023).

Informed Consent Statement

Informed consent was obtained from all subjects involved in the study.

Data Availability Statement

The data that support the findings of this study are not publicly available due to reasons of sensitivity. Anonymized data may be available from the corresponding author upon a review of the request. Data are located in controlled-access data storage at the corresponding author’s institution.

Conflicts of Interest

Yuichi Yamashita is an employee of Canon Medical Systems, Japan. The remaining authors declare no conflicts of interest.

References

  1. Olsen, T.L.; Anderson, R.L.; Dearwater, S.R.; Kriska, A.M.; Cauley, J.A.; Aaron, D.J.; LaPorte, R.E. The epidemiology of low back pain in an adolescent population. Am. J. Public Health 1992, 82, 606–608. [Google Scholar] [CrossRef] [PubMed]
  2. Wiltse, L.L.; Newman, P.H.; Macnab, I. Classification of spondylolisis and spondylolisthesis. Clin. Orthop. Relat. Res. 1976, 117, 23–29. [Google Scholar] [CrossRef]
  3. Fredrickson, B.E.; Baker, D.; McHolick, W.J.; Yuan, H.A.; Lubicky, J.P. The natural history of spondylolysis and spondylolisthesis. J. Bone Jt. Surg. Am. 1984, 66, 699–707. [Google Scholar] [CrossRef]
  4. Bechtel, W.; Griffiths, H.; Eisenstadt, R. The Pathogenesis of Spondylolysis. Investig. Radiol. 1982, 17, S29. [Google Scholar] [CrossRef]
  5. Li, J.; Liang, J.; Xu, Y.; Du, D.; Feng, F.; Shen, J.; Cui, Y. Incidence of lumbar spondylolysis in athletes with low back pain: A systematic evaluation and single-arm meta-analysis. Medicine 2023, 102, e34857. [Google Scholar] [CrossRef]
  6. West, A.M.; d’Hemecourt, P.A.; Bono, O.J.; Micheli, L.J.; Sugimoto, D. Diagnostic Accuracy of Magnetic Resonance Imaging and Computed Tomography Scan in Young Athletes With Spondylolysis. Clin. Pediatr. 2019, 58, 671–676. [Google Scholar] [CrossRef] [PubMed]
  7. Yamane, T.; Yoshida, T.; Mimatsu, K. Early diagnosis of lumbar spondylolysis by MRI. J. Bone Jt. Surg. Br. 1993, 75, 764–768. [Google Scholar] [CrossRef] [PubMed]
  8. Ulmer, J.L.; Mathews, V.P.; Elster, A.D.; Mark, L.P.; Daniels, D.L.; Mueller, W. MR imaging of lumbar spondylolysis: The importance of ancillary observations. AJR Am. J. Roentgenol. 1997, 169, 233–239. [Google Scholar] [CrossRef]
  9. Leone, A.; Cianfoni, A.; Cerase, A.; Magarelli, N.; Bonomo, L. Lumbar spondylolysis: A review. Skelet. Radiol. 2011, 40, 683–700. [Google Scholar] [CrossRef]
  10. Journy, N.; Roue, T.; Cardis, E.; Le Pointe, H.D.; Brisse, H.; Chateil, J.F.; Laurier, D.; Bernier, M.O. Childhood CT scans and cancer risk: Impact of predisposing factors for cancer on the risk estimates. J. Radiol. Prot. 2016, 36, N1–N7. [Google Scholar] [CrossRef]
  11. Berrington de Gonzalez, A.; Pasqual, E.; Veiga, L. Epidemiological studies of CT scans and cancer risk: The state of the science. Br. J. Radiol. 2021, 94, 20210471. [Google Scholar] [CrossRef] [PubMed]
  12. Wang, W.H.; Sung, C.Y.; Wang, S.C.; Shao, Y.J. Risks of leukemia, intracranial tumours and lymphomas in childhood and early adulthood after pediatric radiation exposure from computed tomography. CMAJ 2023, 195, E575–E583. [Google Scholar] [CrossRef]
  13. Carey, T.S.; Garrett, J.M.; Jackman, A.; Hadler, N. Recurrence and care seeking after acute back pain: Results of a long-term follow-up study. North Carolina Back Pain Project. Med. Care 1999, 37, 157–164. [Google Scholar] [CrossRef] [PubMed]
  14. Bae, W.C.; Biswas, R.; Chen, K.; Chang, E.Y.; Chung, C.B. UTE MRI of the Osteochondral Junction. Curr. Radiol. Rep. 2014, 2, 35. [Google Scholar] [CrossRef] [PubMed]
  15. Bharadwaj, U.U.; Coy, A.; Motamedi, D.; Sun, D.; Joseph, G.B.; Krug, R.; Link, T.M. CT-like MRI: A qualitative assessment of ZTE sequences for knee osseous abnormalities. Skelet. Radiol. 2022, 51, 1585–1594. [Google Scholar] [CrossRef] [PubMed]
  16. Cheng, K.Y.; Moazamian, D.; Ma, Y.; Jang, H.; Jerban, S.; Du, J.; Chung, C.B. Clinical application of ultrashort echo time (UTE) and zero echo time (ZTE) magnetic resonance (MR) imaging in the evaluation of osteoarthritis. Skelet. Radiol. 2023, 52, 2149–2157. [Google Scholar] [CrossRef] [PubMed]
  17. Breighner, R.E.; Endo, Y.; Konin, G.P.; Gulotta, L.V.; Koff, M.F.; Potter, H.G. Technical Developments: Zero Echo Time Imaging of the Shoulder: Enhanced Osseous Detail by Using MR Imaging. Radiology 2018, 286, 960–966. [Google Scholar] [CrossRef] [PubMed]
  18. Achar, S.; Hwang, D.; Finkenstaedt, T.; Malis, V.; Bae, W.C. Deep-Learning-Aided Evaluation of Spondylolysis Imaged with Ultrashort Echo Time Magnetic Resonance Imaging. Sensors 2023, 23, 8001. [Google Scholar] [CrossRef]
  19. Jang, U.; Hwang, D. High-quality multiple T2(*) contrast MR images from low-quality multi-echo images using temporal-domain denoising methods. Med. Phys. 2012, 39, 468–474. [Google Scholar] [CrossRef]
  20. Jang, U.; Nam, Y.; Kim, D.H.; Hwang, D. Improvement of the SNR and resolution of susceptibility-weighted venography by model-based multi-echo denoising. Neuroimage 2013, 70, 308–316. [Google Scholar] [CrossRef]
  21. Johnson, B.; Alizai, H.; Dempsey, M. Fast field echo resembling a CT using restricted echo-spacing (FRACTURE): A novel MRI technique with superior bone contrast. Skelet. Radiol. 2021, 50, 1705–1713. [Google Scholar] [CrossRef] [PubMed]
  22. Goerner, F.L.; Clarke, G.D. Measuring signal-to-noise ratio in partially parallel imaging MRI. Med. Phys. 2011, 38, 5049–5057. [Google Scholar] [CrossRef]
  23. Edelstein, W.; Bottomley, P.; Hart, H.; Leue, W.; Schenck, J.; Redington, R. NMR imaging at 5.1 MHz: Work in progress. In International Symposium on NMR Imaging; Witcofski, R., Karstaedt, N., Partain, C., Eds.; Bowman Gray School of Medicine: Winston-Salem, NC, USA, 1982; pp. 139–145. [Google Scholar]
  24. Mishra, P.; Singh, U.; Pandey, C.M.; Mishra, P.; Pandey, G. Application of student’s t-test, analysis of variance, and covariance. Ann. Card. Anaesth. 2019, 22, 407–411. [Google Scholar] [CrossRef] [PubMed]
  25. McHugh, M.L. Multiple comparison analysis testing in ANOVA. Biochem. Med. 2011, 21, 203–209. [Google Scholar] [CrossRef] [PubMed]
  26. Tsuchiya, K.; Gomyo, M.; Katase, S.; Hiraoka, S.; Tateishi, H. Magnetic resonance bone imaging: Applications to vertebral lesions. Jpn. J. Radiol. 2023, 41, 1173–1185. [Google Scholar] [CrossRef] [PubMed]
  27. Schwaiger, B.J.; Schneider, C.; Kronthaler, S.; Gassert, F.T.; Bohm, C.; Pfeiffer, D.; Baum, T.; Kirschke, J.S.; Karampinos, D.C.; Makowski, M.R.; et al. CT-like images based on T1 spoiled gradient-echo and ultra-short echo time MRI sequences for the assessment of vertebral fractures and degenerative bone changes of the spine. Eur. Radiol. 2021, 31, 4680–4689. [Google Scholar] [CrossRef] [PubMed]
  28. Du, J.; Bydder, M.; Takahashi, A.M.; Carl, M.; Chung, C.B.; Bydder, G.M. Short T2 contrast with three-dimensional ultrashort echo time imaging. Magn. Reson. Imaging 2011, 29, 470–482. [Google Scholar] [CrossRef]
  29. Largent, A.; Barateau, A.; Nunes, J.C.; Mylona, E.; Castelli, J.; Lafond, C.; Greer, P.B.; Dowling, J.A.; Baxter, J.; Saint-Jalmes, H.; et al. Comparison of Deep Learning-Based and Patch-Based Methods for Pseudo-CT Generation in MRI-Based Prostate Dose Planning. Int. J. Radiat. Oncol. Biol. Phys. 2019, 105, 1137–1150. [Google Scholar] [CrossRef] [PubMed]
  30. Bourbonne, V.; Jaouen, V.; Hognon, C.; Boussion, N.; Lucia, F.; Pradier, O.; Bert, J.; Visvikis, D.; Schick, U. Dosimetric Validation of a GAN-Based Pseudo-CT Generation for MRI-Only Stereotactic Brain Radiotherapy. Cancers 2021, 13, 1082. [Google Scholar] [CrossRef]
  31. Florkow, M.C.; Willemsen, K.; Mascarenhas, V.V.; Oei, E.H.G.; van Stralen, M.; Seevinck, P.R. Magnetic Resonance Imaging Versus Computed Tomography for Three-Dimensional Bone Imaging of Musculoskeletal Pathologies: A Review. J. Magn. Reson. Imaging 2022, 56, 11–34. [Google Scholar] [CrossRef]
  32. Morbee, L.; Vereecke, E.; Laloo, F.; Chen, M.; Herregods, N.; Jans, L. MR Imaging of the Pelvic Bones: The Current and Cutting-Edge Techniques. J. Belg. Soc. Radiol. 2022, 106, 123. [Google Scholar] [CrossRef] [PubMed]
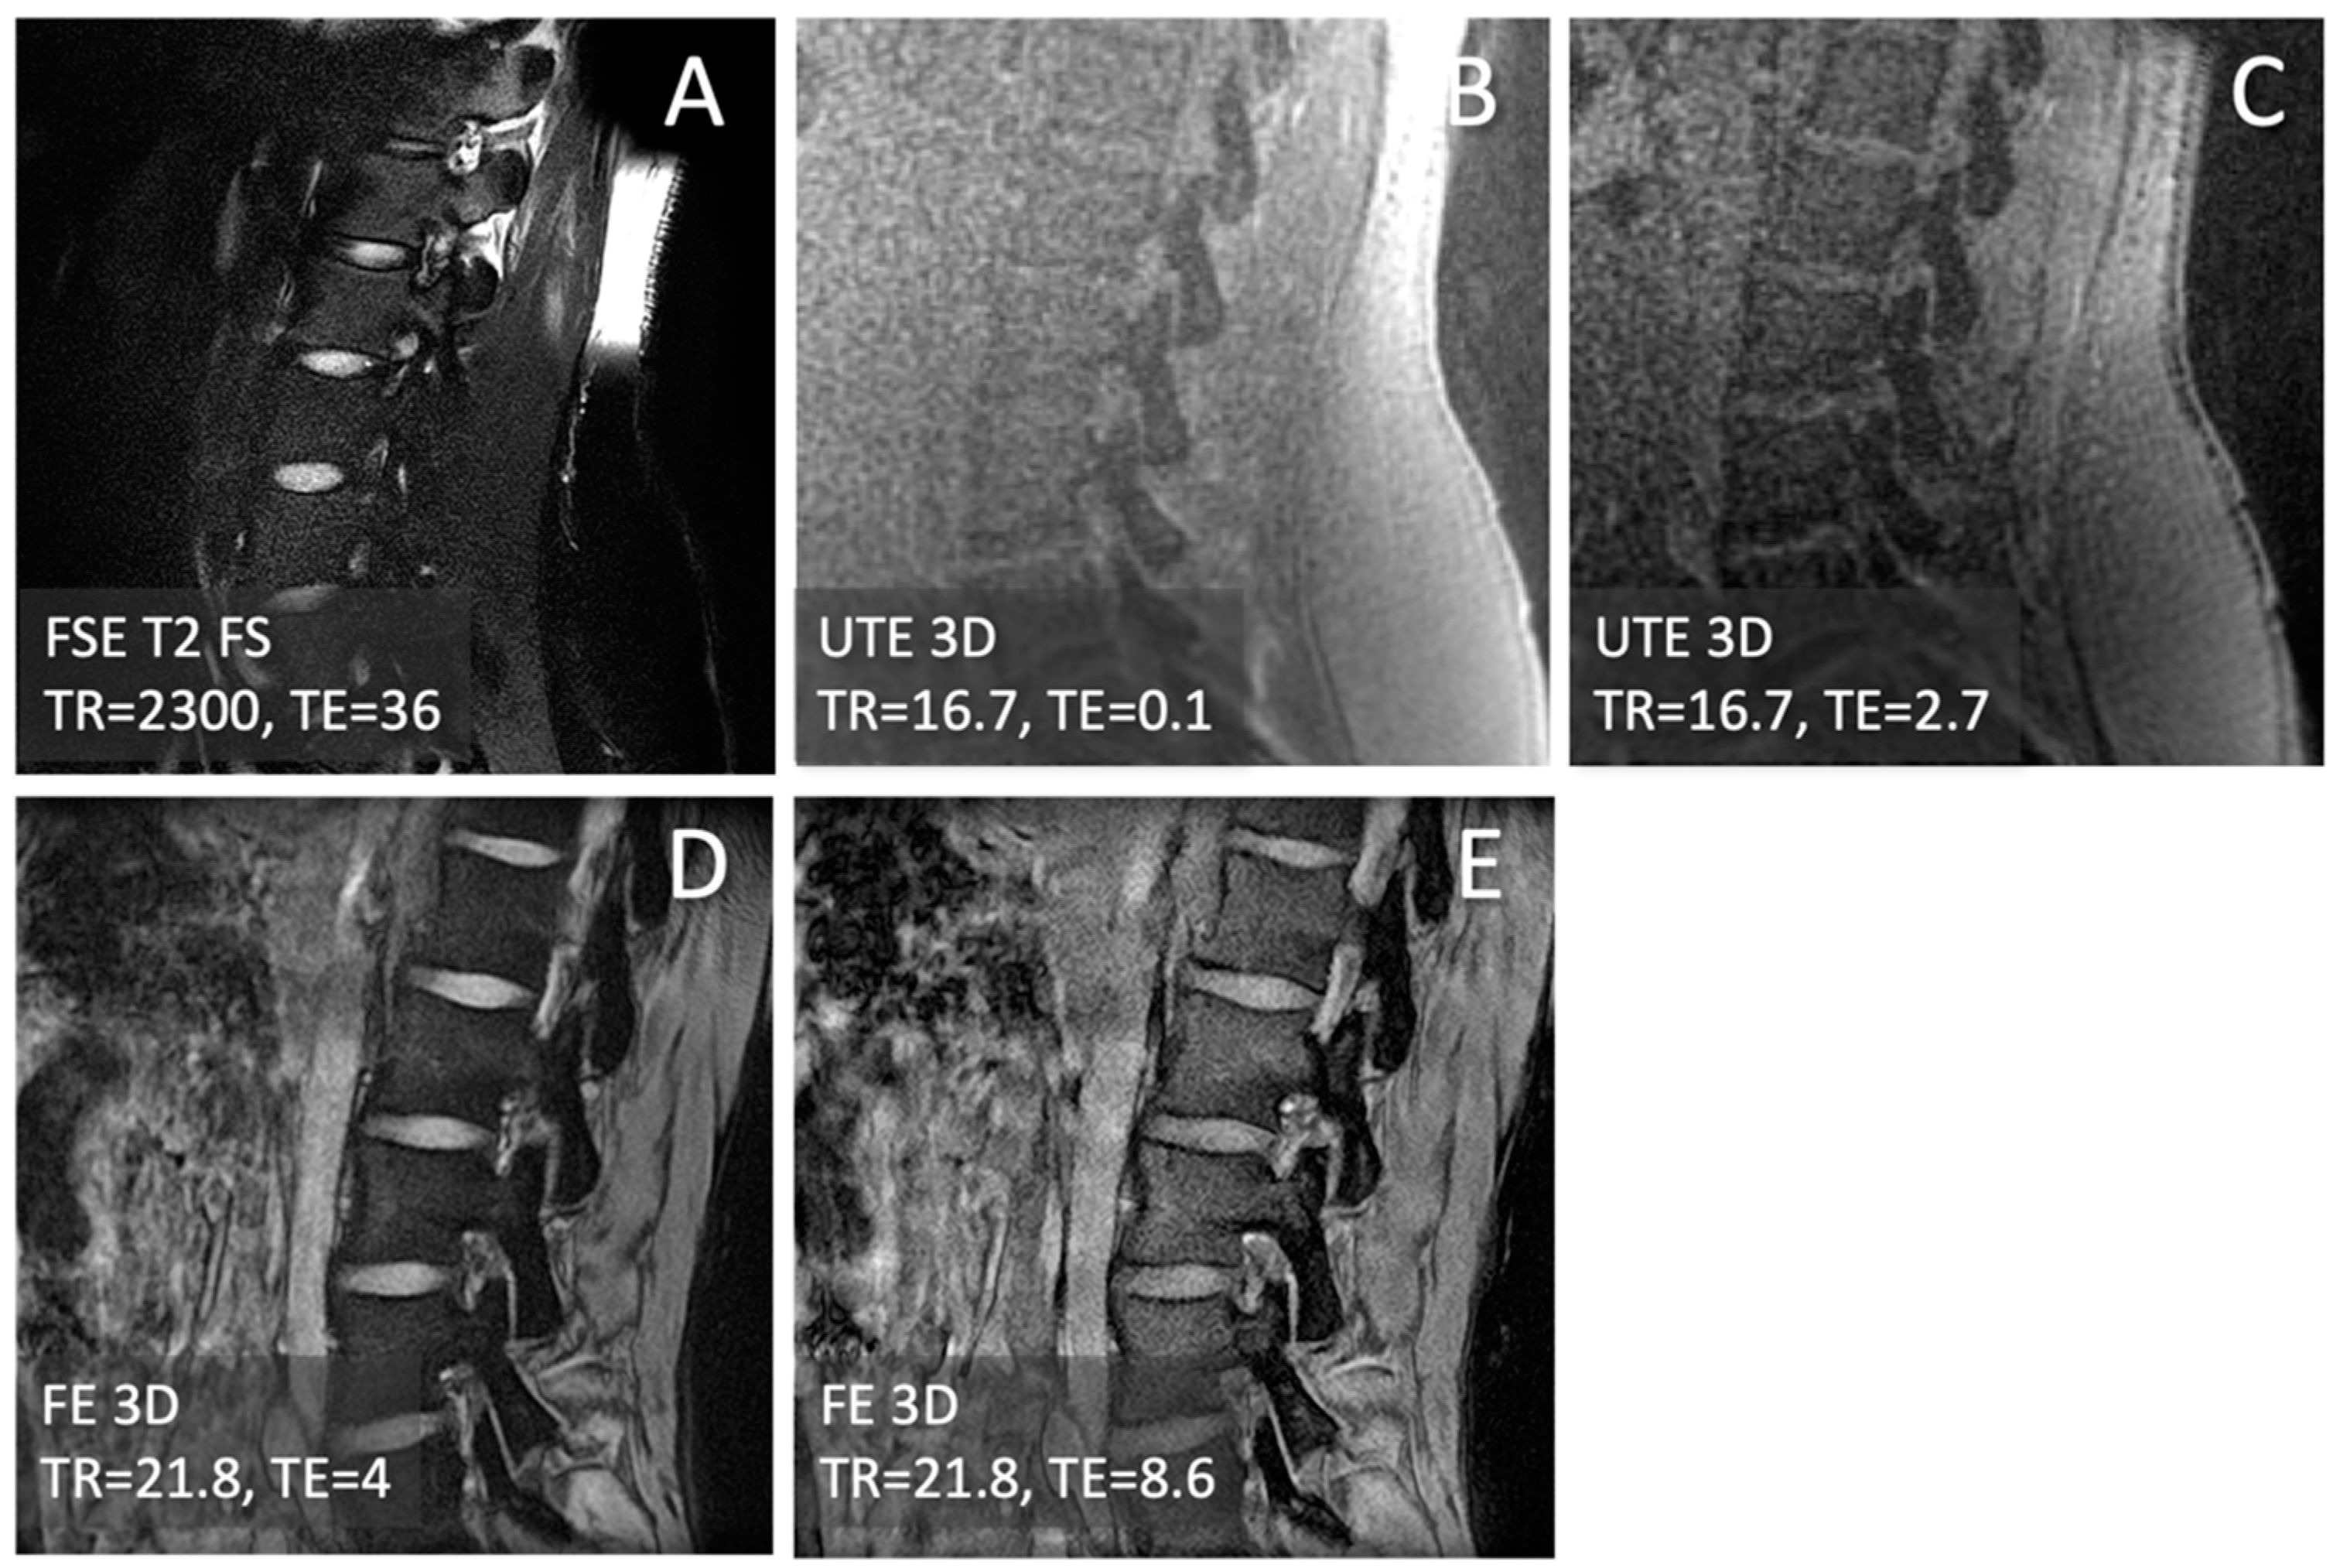
Figure 1. Raw MRI images of a lumbar spine acquired by (A) T2-weighted fat-suppressed fast spin echo (FSE T2 FS), (B,C) 3D ultrashort echo time (UTE) at varying echo times (TEs), and (D,E) 3D field echo (FE) at varying TEs.
Computation 12 00152 g001
Figure 2. Processed images to create CT-like contrast from (A) the UTE 1st-echo image, (B) UTE multi-echo images, (C) the FE 1st-echo image, and (D) FE multi-echo images. Differences between sequences (UTE vs. FE) and improvements in contrast and image quality from multi-echo processing are apparent.
Computation 12 00152 g002
Figure 3. Regions of interest (blue-enclosed areas), including bone of the pars interarticularis, paraspinal muscles, and air, which were analyzed to determine the SNR and CNR.
Computation 12 00152 g003
Figure 4. Detection of a moderately sized pars defect (arrows) in an adolescent athlete with persistent low back pain using FSE T2 FS (A), UTE multi-echo processing (B), and FE multi-echo processing (C). The processed images may enable an easier and more confident diagnosis of isthmic spondylolysis.
Computation 12 00152 g004
Table 1. (Top) Mean and standard deviation of SNR and CNR values from various regions of interest. (Bottom) p-values from two-way ANOVA to assess the effects of sequence (UTE vs. FE) and processing (first-echo vs. multi-echo) on the SNR and CNR. Bold faced p-value indicates statistical significance (p < 0.05).
Mean (+/− Std. Dev.) Values for Each Sequence
MeasurementUTE 1st EchoUTE MultiFE 1st EchoFE Multi
Bone SNR107 (66)89.8 (29.5)38.1 (10.3)53.3 (16.3)
Muscle SNR94.4 (65.4)74.0 (32.8)23.4 (7.0)31.9 (14.2)
Bone–Muscle CNR13.0 (5.2)15.7 (5.0)14.6 (4.2)21.5 (8.5)
Two-Way ANOVA: Effect of
MeasurementUTE vs. FE1st- vs. Multi-echoInteraction
Bone SNR0.00040.92890.2235
Muscle SNR0.00020.65560.2864
Bone–Muscle CNR0.09350.03110.3327
Disclaimer/Publisher’s Note: The statements, opinions and data contained in all publications are solely those of the individual author(s) and contributor(s) and not of MDPI and/or the editor(s). MDPI and/or the editor(s) disclaim responsibility for any injury to people or property resulting from any ideas, methods, instructions or products referred to in the content.