Article

The Development of a Novel Transient Signal Analysis: A Wavelet Transform Approach

by
Eduardo Gómez-Luna
1,
Dixon E. Cuadros-Orta
1,
John E. Candelo-Becerra
2 and
Juan C. Vasquez
3,*
1
Grupo de Investigación en Alta Tensión—GRALTA, Escuela de Ingeniería Eléctrica y Electrónica Universidad del Valle, Cali 760015, Colombia
2
Departamento de Energía Eléctrica y Automática, Facultad de Minas, Universidad Nacional de Colombia, Sede Medellín, Carrera 80 No. 65-223, Medellín 050041, Colombia
3
Center for Research on Microgrids (CROM), AAU Energy, Aalborg University, 9220 Aalborg, Denmark
*
Author to whom correspondence should be addressed.
Computation 2024, 12(9), 178; https://doi.org/10.3390/computation12090178
Submission received: 22 July 2024 / Revised: 22 August 2024 / Accepted: 28 August 2024 / Published: 3 September 2024
(This article belongs to the Section Computational Engineering)

Abstract

:
This paper presents a new method for the analysis of transient signals in the frequency domain based on the Continuous Wavelet Transform (CWT). The proposed case study involves test signals measured from an electronic switch considering open and close operations. The source is connected to inductive, resistive, and capacitive loads. Resonance behaviors are introduced and compared with the Discrete Fourier Transform (DFT). Multiple factors, such as reliability, repeatability, high noise attenuation, and the smoothing of the analyzed spectrum, are considered in this study. This proposed study highlights the effectiveness of CWT in signal processing, especially in obtaining a detailed spectrum that reveals the behavior of electrical circuits. Resonance behaviors were analyzed, demonstrating that the signal processing performed by CWT is better for spectrum analysis than DFT. This study shows the potential of CWT to analyze transient electrical signals, specifically for identifying and characterizing the behavior of load connections and disconnections.

1. Introduction

Electrical magnitudes can usually be represented by signals in the time domain. Time is the independent variable, and amplitude is the dependent variable. However, sometimes the information extracted from a time-domain signal is inadequate or very difficult to understand. Some engineering analysis becomes easier when the signal information is observed in the frequency domain. Therefore, mathematical tools are necessary to transform temporal signals into the frequency domain for further analysis.
The Fourier transform (FT) has been the most important spectral analysis tool in the past [1]. It decomposes a continuous signal into sinusoidal components to obtain spectrum information. However, when this transform is employed for transient signal analysis, problems arise because the results are limited to an analysis window. Transient signal analysis often requires advanced techniques to accurately capture the time-varying characteristics of signals. The FT is a fundamental tool in signal processing, but it has limitations when dealing with non-stationary signals such as transients [2]. The Short-Time FT (STFT) addresses some of these limitations by providing time-frequency localizations of signals [3]. However, STFT has fixed window parameters that may not be suitable for all transient signals [4]. In contrast, the Wavelet Transform (WT) and Hilbert–Huang Transform (HHT) have been shown to be effective in analyzing non-stationary signals by providing time-frequency analysis capabilities [5,6].
Moreover, FT is known to struggle in effectively capturing transient frequencies [2]. To overcome this, researchers have developed alternative methods, such as high-order biorthogonal FT (HBFT), to expand the capabilities of traditional FT analysis [7]. Additionally, the Hartley transform has been proposed as a symmetrical alternative to the FT for steady-state and transient signal analysis [8].
WT has proven to be useful for the study of transient signals because it can analyze signals, changing resolutions in both the time and frequency domains [9,10,11,12]. This change occurs because the WT allows for a good resolution for analyzing the slowly varying components (60Hz) and the rapidly varying components that are normally associated with high-frequency events [13]. WT as a mathematical tool has been of great relevance for the study of electrical signals due to its effectiveness when analyzing voltage and current transients during turbulence in the power system.
Similarly to FT, WT decomposes a signal into each of its frequency components [14]. WT is a powerful tool for analyzing transient signals in various fields, such as fault detection, power signal analysis, and vibration signature detection [15]. The ability of WT to decompose and reconstruct signals through Wavelet functions enables the extraction of signal features at different scales, making it particularly effective for the identification of transient impulses [16]. Researchers have highlighted the importance of using appropriate bases in wavelet analysis, as different bases can lead to varying results when analyzing the same signal [17]. Studies have shown that wavelet analysis is highly suitable for detecting and analyzing transient disturbances, outperforming various other detection algorithms [4]. The effectiveness of WT in transient analysis has led to its combination with other techniques to enhance the reliability of detection schemes [18]. Furthermore, WT has been employed successfully to extract important information from transient signals in both the time and frequency domains, aiding in fault diagnosis and condition detection [19,20].
Previous works have also considered WT application in various domains, such as power quality analysis, acoustic signal processing, and seismic signal analysis [21,22,23]. The unique ability of WT to provide time-frequency localization makes it a valuable tool for analyzing nonstationary signals with transient characteristics [24,25]. Furthermore, the energy method based on wavelet packets has been utilized to calculate the energy of received signals in structural analysis [26]. The discrete WT is widely employed to eliminate noise and discrete transient signals. This is done through multiresolution analysis (MRA), which can decompose a signal using high-pass and low-pass filters [14].
The most widely employed tool has been the fast FT (FFT). However, the studies carried out in [10] demonstrate that the WT gives better results when obtaining the frequency content of the signals through their continuous WT (CWT) and eliminating noise through multiresolution analysis (MRA), which is one of the applications of the discrete WT (DWT).
This paper presents a new approach of CWT for the analysis of electrical transient signals. The signals were generated by electronic switch opening and closing operations with different RLC circuits. This research presents the following contributions:
  • The proposed CWT analyzes transient signals, and it is tested according to events presented in a typical circuit more accurately than conventional approaches.
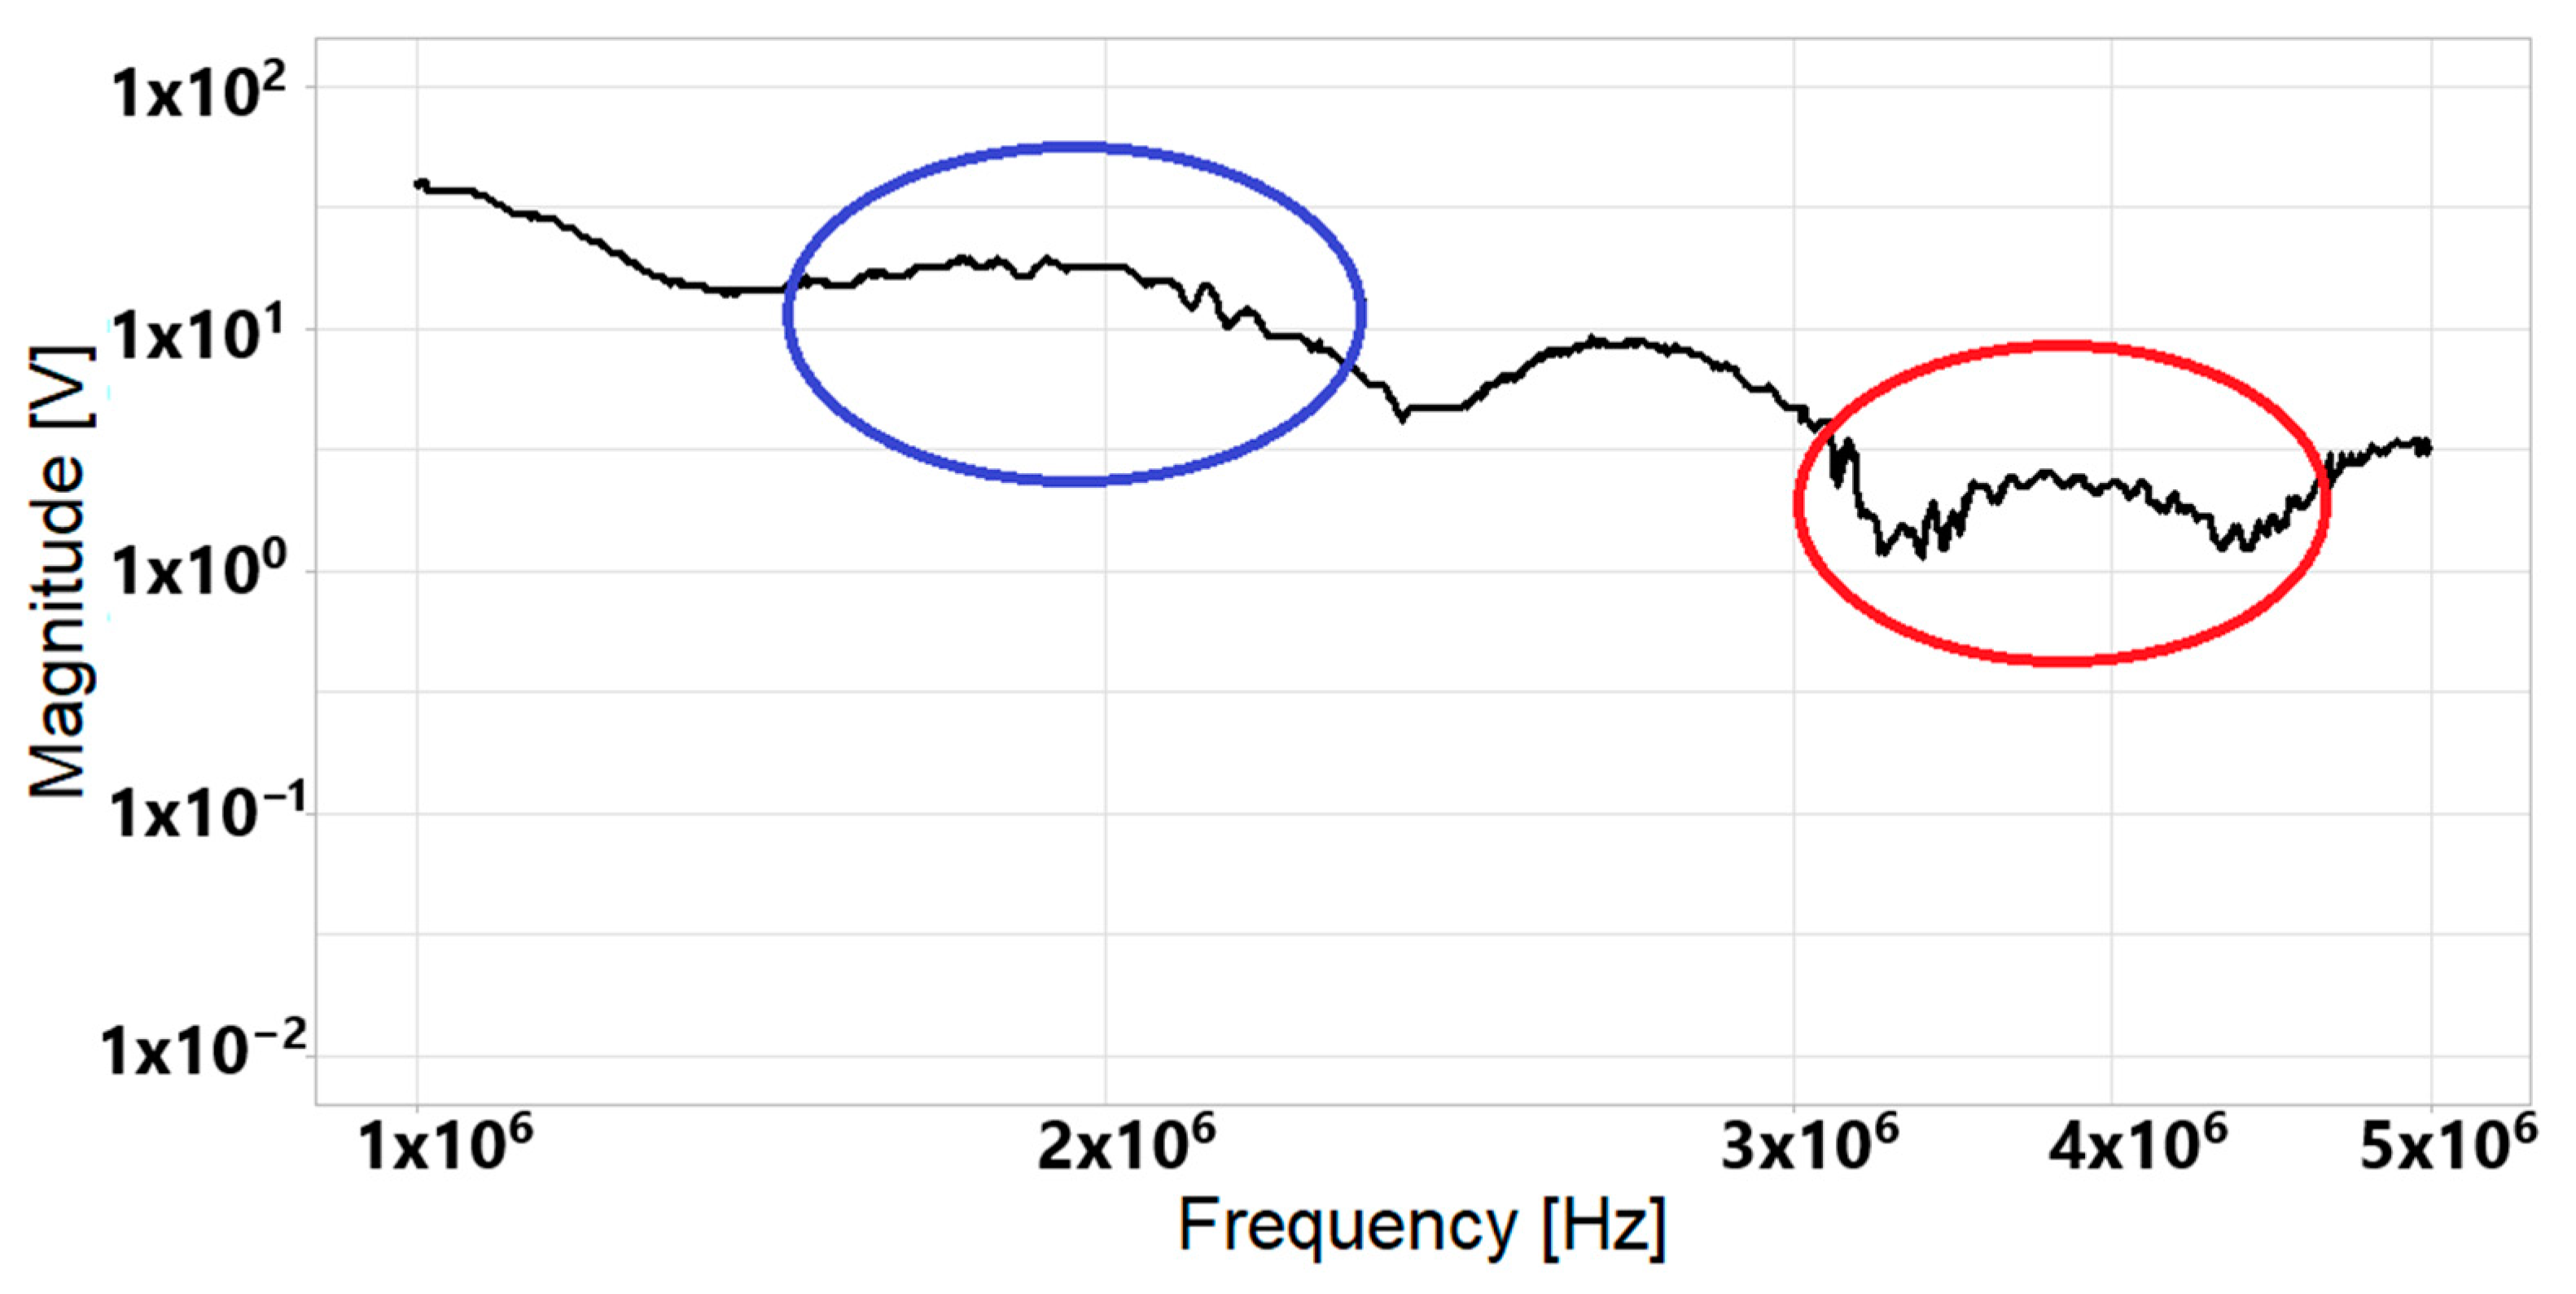
  • A comparison between CWT and the Discrete Fourier Transform (DFT) is performed in terms of data reliability, repeatability, and spectrum smoothing.
  • The proposed study highlights the effectiveness of CWT in signal processing, particularly in obtaining a detailed spectrum that reveals the behavior of electrical circuits.

2. Materials and Methods

2.1. General Procedure

Figure 1 shows a flowchart of the general procedure for analyzing time signals in the frequency domain. The analysis of the transient signal can be performed by the traditional method using the DFT and the proposed method using the CWT. The advantages and disadvantages of each method can be compared in relation to the reliability, repeatability, and smoothing of the spectrum.
In step 1, the aim is to record the signal in the time domain, including the transient signal. In step 2, once the signal is in the time domain, an analysis window is selected to study only the transient signal; the window must contain the entire transient. Step 3 is employed to define the spectrum of the signal under analysis in the frequency domain and to characterize the transient signal. In step 4, the type of analysis is defined, such as CWT and DFT analysis. In step 5, DFT is used to study the resonance, the smoothness of the curve, and the noise. In Step 6, CWT is used to study the resonance, the smoothness of the curve, and the noise. In step 7, a comparison of the results obtained with DFT and CWT is performed to obtain the best spectrum.

2.2. Continuos WT (CWT)

The WT is an important tool for transient signal processing and for many other applications, as shown in Figure 2 [10,27,28,29,30,31].
In the CWT, the basis function and window function concepts are combined to allow the problem to be solved. The CWT uses a mother wavelet ψ (t) as the base function and decomposes a signal into different frequency components as a family of functions that are mother wavelet translations and dilations. Figure 3 shows the processing steps of the WT signal [10,32].
CWT is employed for transient signal analysis, moving, and stretching the mother function ψ (t) through the time signal and bringing it to the scale domain [9]. The mathematical formulation employed for the CWT is similar to that applied in [10], as presented in Equation (1).
C W T τ , a = 1 a i n f i n f   f ( t ) ψ * t τ a d t
For Equation (1), the asterisk denotes the conjugate of the function ψ (t), f (t) is the transient signal, and τ and a represent the translation and dilation factors of the mother function (scale). The CWT results are called wavelet coefficients. A high value of the wavelet coefficient denotes high similarity between the signal f (t) and the parent function ψ (t), which shows high correlation. It is possible to obtain a time signal spectrum using the following procedure [9,10]:
  • Select a mother wavelet considering the transform application field and its relationship to the analyzed signal.
  • Obtain the initial values of τ and a and calculating the coefficient C ψ , a using Equation (1).
  • Move and stretch the mother wavelet in the positive direction of the time axis, calculating the coefficients for each scale until the entire signal is covered.
It should be noted that, with C W T , the parameters τ and a continuously vary during the process. To achieve a discretized C W T , it is necessary to choose a small enough step for a continuous variation of parameters during computational analysis. To obtain the spectrum after obtaining the function in the scale domain, it is necessary to consider Equation (2) [10].
f a = f c a Δ t
The term f a is the frequency component associated with a specific scale. The term f c is the central frequency of the mother wavelet. The term a is the sampling period of the analyzed signal. The signal F ( t ) could be related with its coefficient at each wavelet scale level, as shown by Equations (3) and (4), where F a ( t ) is the signal analyzed at each scale level.
F a ( t ) = τ i τ f   C ( τ , a ) ψ a , τ ( t )
F ( t ) = a i a f   F a ( t )
The energy of the wavelet coefficients is calculated according to the Parseval theorem. It proposes that the energy of a signal in a given domain is equal to the energy of the signal in the transform domain. Therefore, Equation (5) allows for obtaining the energy associated with each scale coefficient.
E a = τ i τ f   C ( τ , a ) 2
Finally, the magnitude of the electrical signal in the frequency domain (spectrum) F a is obtained using Equation (6).
F a = τ i τ f   C ( τ , a ) 2

3. Results and Analysis

Figure 4 shows the circuit employed to measure voltage and current signals. This circuit considers an alternating current (AC) source connected to a load. The load was modeled as an RLC circuit composed of a resistor, an inductor, and a capacitance. In addition, an electronic switch is employed to create transient conditions with opening and closing sequences [33]. Moreover, Figure 4 shows that a voltage measurement identified as V and a current measurement identified as I are employed to record the electrical behavior of the circuit.
Figure 5 shows the physical circuit employed for the experimental test. The figure shows the RLC circuit, the AC source, and the electronic switch. The tests were performed in the laboratory of the electrical and electronic engineering school of Universidad del Valle. The objective of the tests was to characterize the type of transient that occurs when connecting any type of RLC load or an electrical machine to the power system; this is essential to analyze the different electromagnetic transients present in the loads or an electrical machine connected to the power system. Voltage and current sensors with a frequency spectrum of up to 10MHz were employed for the tests, and an oscilloscope with a high sampling frequency was utilized for the recordings.
Approximately 80 sequences were performed for the test. Frequency spectrum analysis was performed for a bandwidth between 1 kHz and 5 MHz because most energy is concentrated in this frequency range. Figure 6 and Figure 7 show the temporal voltage and current signals analyzed. The pulses produced by the switching sequence are superimposed over the 60 Hz signal.
An analysis window of 1 ms was employed to obtain the spectrum for the RLC circuit. This time is enough to obtain all the necessary transient frequency content. Figure 8 and Figure 9 show the analysis window used.
Figure 10 and Figure 11 show the frequency spectrum obtained using DFT and CWT for the transient voltage signal of Figure 8.
After comparing the DFT processing shown in Figure 10 and the CWT processing presented in Figure 11, some differences were found. The red circles in Figure 10 and Figure 11 show that the curve obtained with CWT presents a smoother spectrum than the obtained with DFT.
When zooming in on the marked zone of the previous figures, differences were found in the 1 MHz to 5 MHz range due to signal processing. Figure 12 shows a zoomed-in image of the zone marked in Figure 10. Figure 13 shows the CWT signal of the marked zones in Figure 11. Figure 12 and Figure 13 show two zones that are marked with blue and red circles. When the zones in the blue circles and red circles are compared, the results show that some disturbances are displayed in the signal obtained with DFT, while those disturbances disappear when using CWT.
Figure 13 shows that the CWT signal offers better spectrum analysis because there is less ambiguity in the data, which could be the result of electrical noise and other variables. For temporary current signals, spectrums were also obtained using both DFT and CWT. The spectrums of the temporal current signal are shown in Figure 14 and Figure 15 using the DFT and CWT.
Figure 14 and Figure 15 show similar results to those mentioned above. The smoothing of the spectrum obtained with the CWT is highlighted in comparison to that of the DFT. Figure 14 and Figure 15 show a zoomed-in image of the marked zone of the spectrums in a bandwidth between 100 kHz and 1 MHz. These figures show some differences attributed to signal processing. The zones marked with the red circles show that the signal obtained with CWT is smoother than that obtained with DFT.
Figure 16 and Figure 17 show zoomed-in images of the images presented in Figure 14 and Figure 15. These two figures contain some zones marked with green, orange, blue, and red circles. Each zone of the curve marked with a color is compared for the DFT and CWT techniques.
After comparing each color circle drawn in both figures, the result shows that the spectrums of the signals may have distortions depending on the signal processing. CWT signal processing obtains a clearer spectrum versus that of DFT signal processing. To reinforce the previous statement, the same process was performed for other cases by varying the R, L, and C values and having different signals. The results for the different cases are shown in Figure 18, Figure 19, Figure 20 and Figure 21.
For the analysis of repeatability, three opening and closing sequences were executed in the same RLC circuit. The spectrum for this case should be the same, so the variations between the responses can be considered due to their data processing. Figure 22 and Figure 23 show the spectrums of three transient voltage signals obtained with DFT and CWT.
The mean relative error (MRE) was used to assess the spectrums of the voltage signals obtained using the DFT and CWT. In addition, repeatability was also analyzed. For the DFT voltage spectrums, a 47.36% MRE was obtained, and for the CWT voltage spectrums, a 13.45% MRE was obtained. The same analysis was conducted for the spectrums of current signals using DFT and CWT, and the results are shown in Figure 24 and Figure 25.
For the spectrums of the DFT current, a 32.89% MRE was obtained, and for the spectrums of the CWT current, a 17.38% MRE was obtained. Comparing the mean relative error obtained when using both DFT and CWT, it is observed that the mean relative error for CWT is 25% less than the error using DFT, indicating that the repeatability is better when using CWT, presenting less variation due to signal processing.
When the spectrums are analyzed and compared using the DFT and CWT, processing can be evaluated under different criteria. Table 1 reviews the analysis performed in this paper, showing the advantages and disadvantages.

4. Conclusions

This paper presented a new application of CWT for the analysis of transient signals. The signals studied were generated by electronic switch opening and closing sequences connected to an RLC circuit. After performing the tests, the following conclusions were obtained derived from this research:
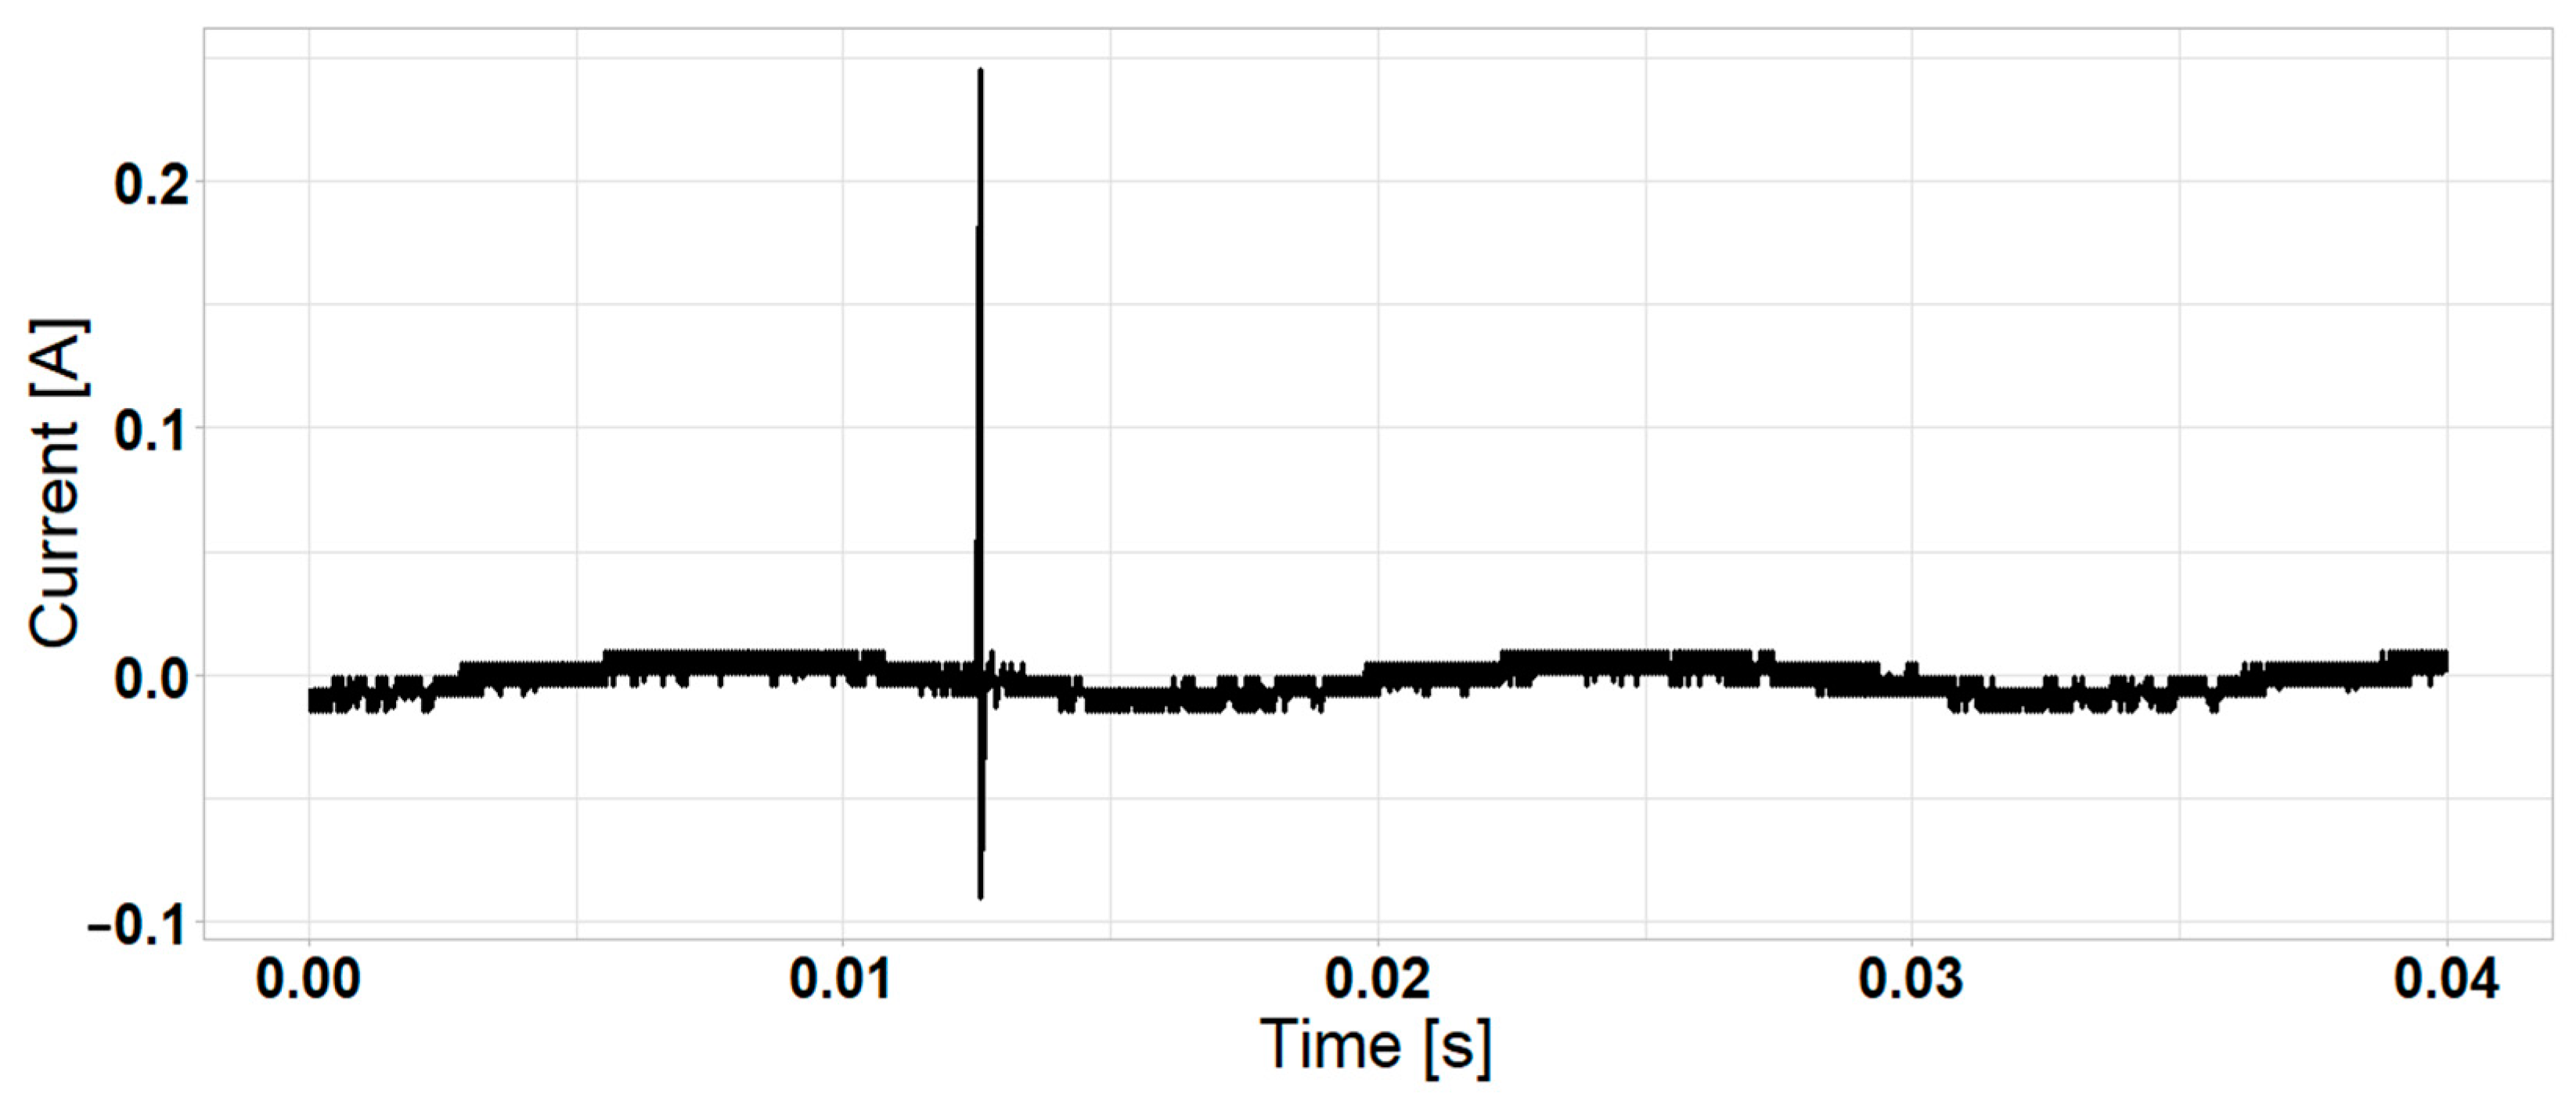
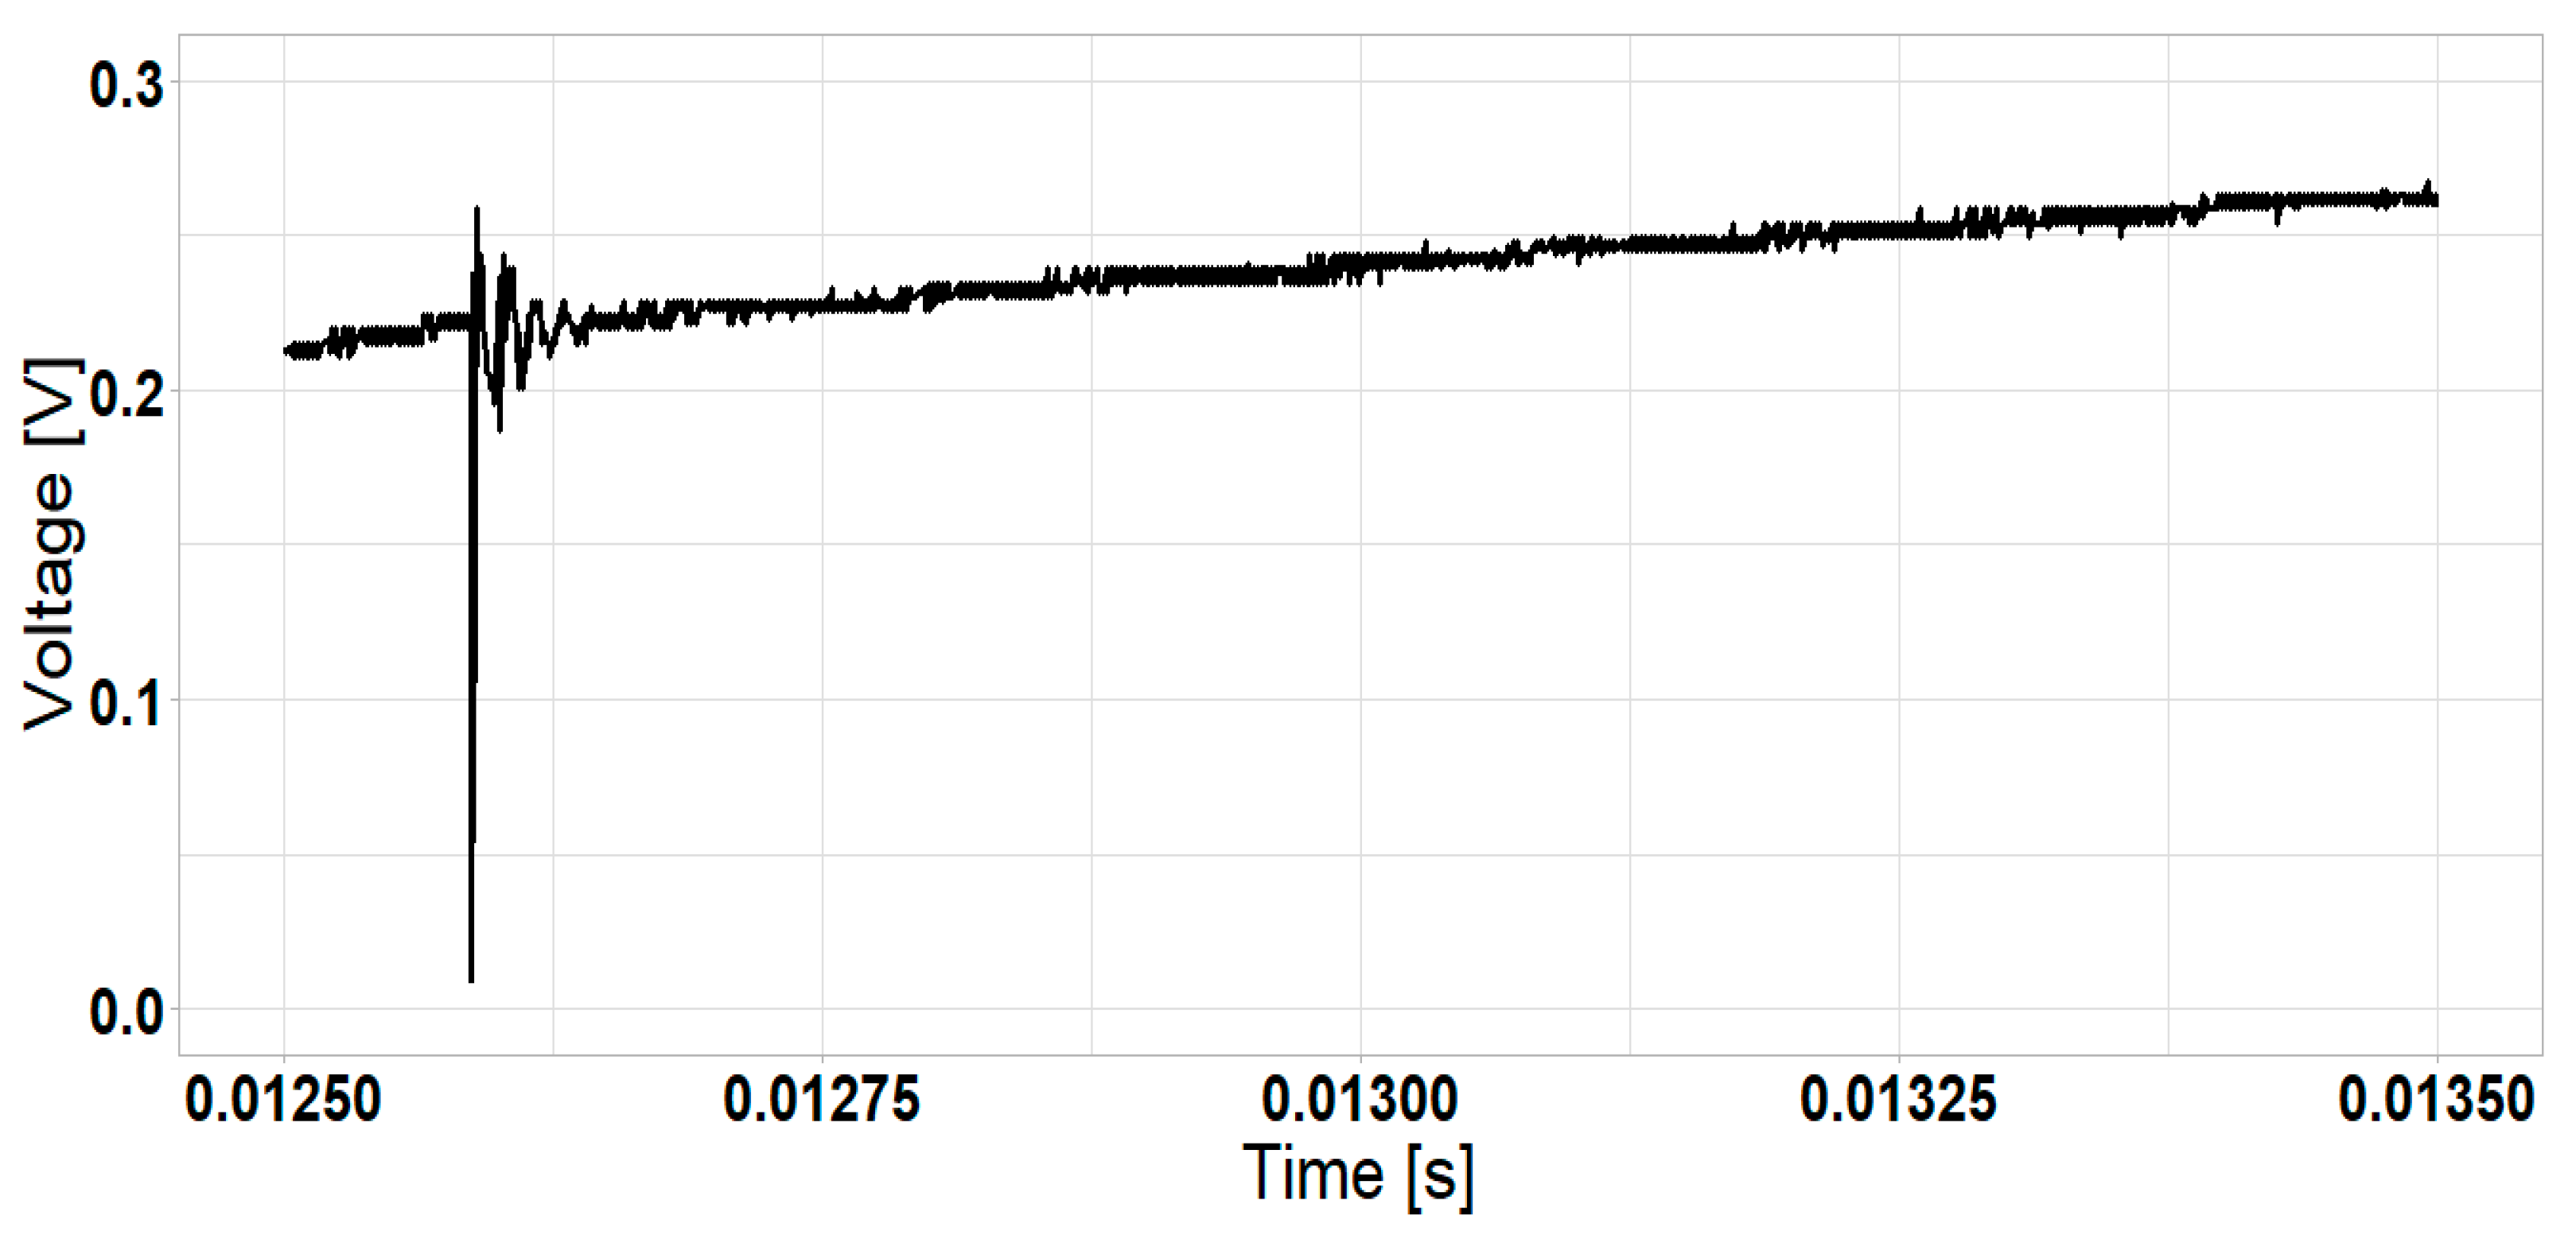
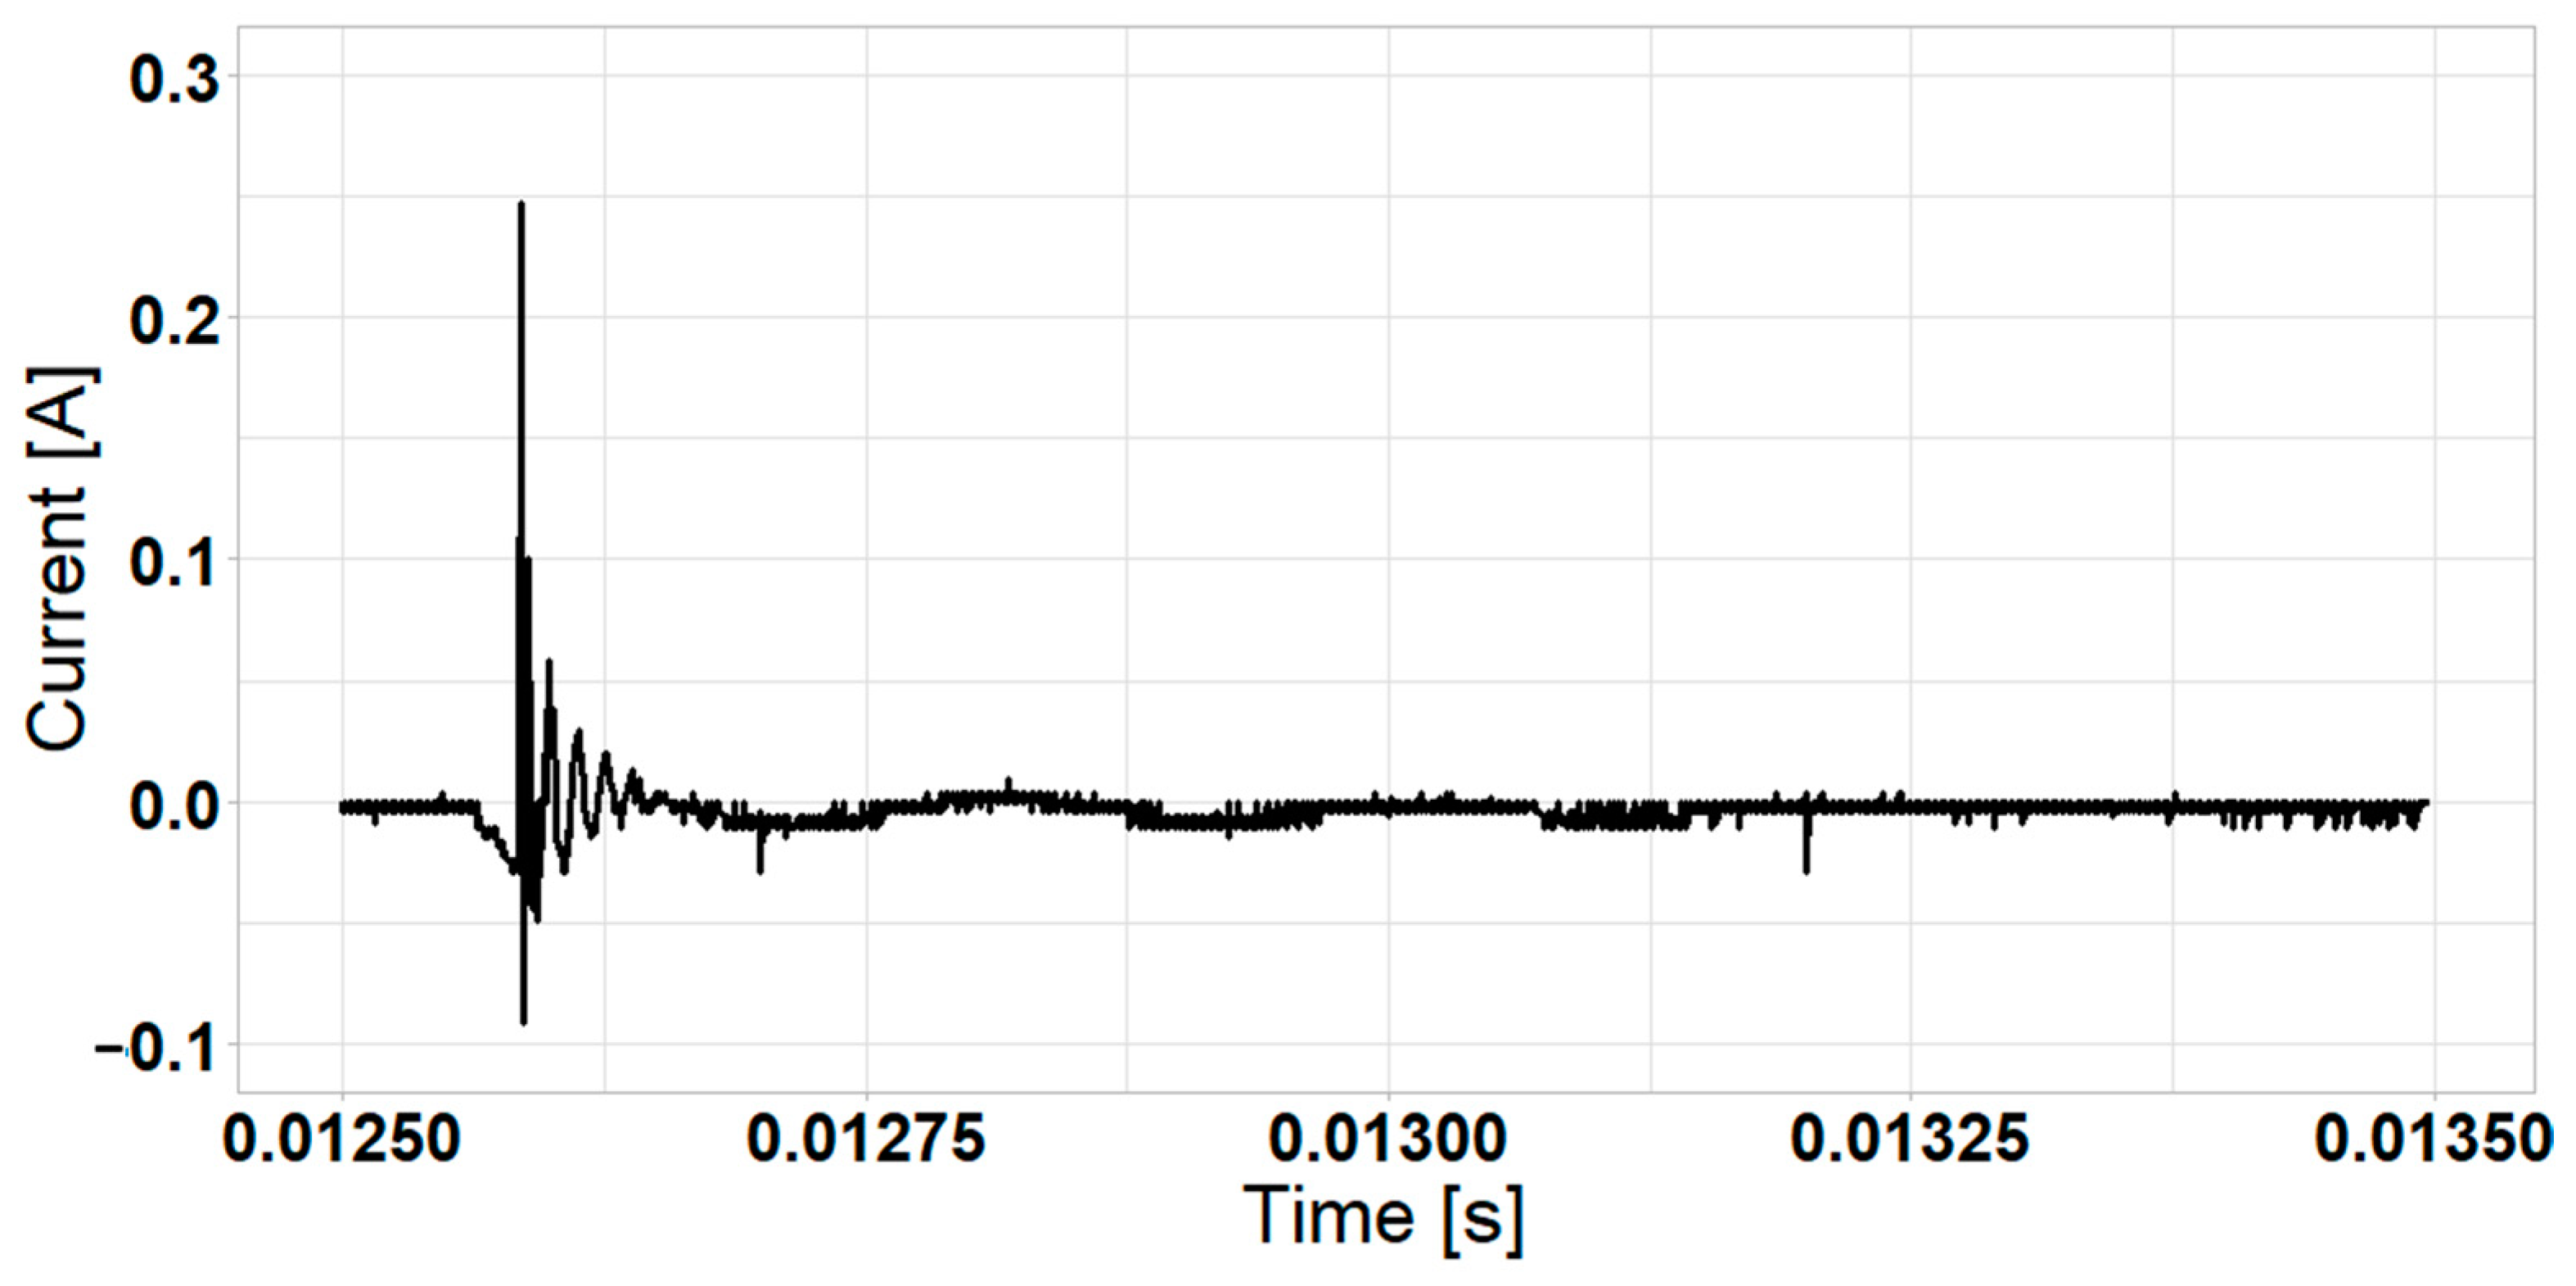
  • The electrical circuit generates a unique spectrum of voltage and current signals, which was registered through the application of CWT and DFT. This study showed the spectrum analysis of transient electrical signals created by the opening and closing sequences of two switches in an RLC circuit. Therefore, this method is useful for other electrical circuits in a power system where similar transient events are observed.
  • This study concluded that the CWT outperforms the DFT in terms of repeatability and distortion, suggesting its usefulness in the analysis of the transient signal spectrum.
  • This study shows the potential of WT for analyzing transient signals, specifically its ability to analyze load connection and disconnection characteristics.
  • The mean relative error is effective in identifying variations in the online FRA curve and is a key element in evidencing slight variations in the online FRA curve. This tool was of great importance when verifying the potential of the proposed method.
Future work should consider performing an in-depth analysis of the variations detectable by the method, changing the type of load, or performing specific internal faults that allow for the verification of the potential of the method for detecting faults. In addition, it would be useful to test the method on real transformers that allow for variations of internal and external parameters and to follow the procedure to evaluate its effectiveness.

Author Contributions

Conceptualization, investigation, writing—original draft preparation, and methodology, D.E.C.-O., E.G.-L. and J.E.C.-B.; Validation, formal analysis, writing—review & editing, E.G.-L., J.E.C.-B. and J.C.V. All authors have read and agreed to the published version of the manuscript.

Funding

This research received no external funding.

Institutional Review Board Statement

Not applicable.

Informed Consent Statement

Not applicable.

Data Availability Statement

The original contributions presented in the study are included in the article. Further inquiries can be directed to the corresponding author.

Acknowledgments

The Authors thank the GRALTA research group of the Universidad del Valle, Colombia, for their contributions during the development of this paper. The authors would also like to thank the Universidad Nacional de Colombia, Sede Medellín. This work was co-supported by VILLUM FONDEN under the VILLUM Investigator Grant (no. 25920): Center for Research on Microgrids (CROM), AAU energy, Denmark. The authors of this work would like to thank the GRALTA research group at Universidad del Valle, Colombia, for the facilities, equipment, and support provided for the completion of the tests and the contributions to the research carried out. John E. Candelo-Becerra thanks the Universidad Nacional de Colombia, Sede Medellín, for the time provided to perform this research.

Conflicts of Interest

The authors declare no conflicts of interest.

References

  1. Aslam, M.; Haq, I.U.; Rehan, M.S.; Ali, F.; Basit, A.; Khan, M.I.; Arbab, M.N. Health Analysis of Transformer Winding Insulation Through Thermal Monitoring and Fast Fourier Transform (FFT) Power Spectrum. IEEE Access 2021, 9, 114207–114217. [Google Scholar] [CrossRef]
  2. Ieng, S.-H.; Lehtonen, E.; Benosman, R. Complexity Analysis of Iterative Basis Transformations Applied to Event-Based Signals. Front. Neurosci. 2018, 12, 373. [Google Scholar] [CrossRef] [PubMed]
  3. Stanković, L.; Lerga, J.; Mandic, D.; Brajović, M.; Richard, C.; Daković, M. From Time–Frequency to Vertex–Frequency and Back. Sci. China Ser. A Math. 2021, 9, 1407. [Google Scholar] [CrossRef]
  4. Liu, D.; Zhu, W.; Wang, Y.; Chang, Z.; Xie, K.; Wang, S. Power Quality Transient Disturbances Detection System Based on Db5 Wavelet. J. Phys. Conf. Ser. 2023, 2564, 012010. [Google Scholar] [CrossRef]
  5. Gawedzki, W. Decomposition of Mechanical Vibration Signals: The Hilbert-Huang Transform in the Time Domain and the Fourier Transform in the Frequency Domain. Prz. Elektrotech. 2016, 1, 69–72. [Google Scholar] [CrossRef]
  6. Li-mei, Y.; Qi-hao, T. Research on the Transient Power Quality Disturbance Detection Based on HHT. IOSR J. Mech. Civ. Eng. 2016, 13, 09–14. [Google Scholar] [CrossRef]
  7. Wang, H.; Li, Y.-H.; Wang, B.-Q. High-Order Bi-Orthogonal Fourier Transform and Its Applications in Non-Stability Signal Analysis. IEICE Trans. Inf. Syst. 2015, 98, 189–192. [Google Scholar] [CrossRef]
  8. Malik, N.A.; Ahmad, F.; Jain, D.K. The Theoretical Overview of the Hartley Transform and the Generalized R-Function. Jnanabha 2020, 50, 158–163. [Google Scholar] [CrossRef]
  9. Chiam, D.H.; Lim, K.H.; Law, K.H. Detection of Power Quality Disturbances Using Wavelet-Based Convolutional Transformer Network. In Proceedings of the 2022 International Conference on Green Energy, Computing and Sustainable Technology (GECOST), IEEE, Miri Sarawak, Malaysia, 26 October 2022; pp. 150–154. [Google Scholar]
  10. Gomez-Luna, E.; Mayor, G.A.; Guerra, J.P. Application of Wavelet Transform to Obtain the Frequency Response of a Transformer From Transient Signals—Part II: Practical Assessment and Validation. IEEE Trans. Power Deliv. 2014, 29, 2231–2238. [Google Scholar] [CrossRef]
  11. Jiménez-Aparicio, M.; Reno, M.J.; Pierre, J.W. The High-Resolution Wavelet Transform: A Generalization of the Discrete Wavelet Transforms. In Proceedings of the 2022 IEEE 13th Annual Ubiquitous Computing, Electronics & Mobile Communication Conference (UEMCON), New York, NY, USA, 26 October 2022; pp. 0395–0401. [Google Scholar]
  12. Reffas, A.; Aissa, O.; Bennia, A.; Talhaoui, H.; Beroual, A.; Moulai, H. Experimental Analysis of Streamer Currents Under Lightning Impulse Voltage Using Fast Fourier and Discrete Wavelet Transform Methods. IEEE Trans. Dielectr. Electr. Insul. 2023, 30, 1032–1039. [Google Scholar] [CrossRef]
  13. Rahmati, A.; Adhami, R.; Dimassi, M. Real-Time Electrical Variables Estimation Based on Recursive Wavelet Transform. Int. J. Electr. Power Energy Syst. 2015, 68, 170–179. [Google Scholar] [CrossRef]
  14. Gómez-Luna, E.; Aponte, G.; Pleite, J. Non-Invasive Monitoring of Transformers Using the Frequency Response from Controlled Transient Signals. Ing. Compet. 2013, 15, 23–33. [Google Scholar]
  15. Guo, J.; Shi, Z.; Zhen, D.; Meng, Z.; Gu, F.; Ball, A. Modulation Signal Bispectrum with Optimized Wavelet Packet Denoising for Rolling Bearing Fault Diagnosis. Struct. Health Monit. 2021, 21, 984–1011. [Google Scholar] [CrossRef]
  16. Zhou, K. Power Quality Disturbance Detection Based on Partitioning-Improved Empirical Wavelet Transform. J. Phys. Conf. Ser. 2023, 2659, 012023. [Google Scholar] [CrossRef]
  17. Ling, T.; Zhang, S.; Chen, Q.; Li, J. Wavelet Basis Construction Method Based on Separation Blast Vibration Signal. J. Cent. S. Univ. Technol. 2015, 22, 2809–2815. [Google Scholar] [CrossRef]
  18. Shu, Z.; Xiao, X.; He, Z. Detection of High-impedance Fault in Distribution Network Based on Time–Frequency Entropy of Wavelet Transform. Ieej Trans. Electr. Electron. Eng. 2020, 15, 844–853. [Google Scholar] [CrossRef]
  19. Banerjee, M.; Khosla, A. Differential Protection of Power Transformer Using Wavelet Transform. Int. J. Recent Technol. Eng. 2019, 8, 7627–7630. [Google Scholar] [CrossRef]
  20. Sendil Kumar, S.; Kavaskar, S. Identification of Internal Fault from Power Transformer Using Wavelet Transform and ANFIS. Int. J. Eng. Res. Appl. 2018, 6. [Google Scholar] [CrossRef]
  21. Chen, J.; Li, G. Tsallis Wavelet Entropy and Its Application in Power Signal Analysis. Entropy 2014, 16, 3009–3025. [Google Scholar] [CrossRef]
  22. Ghazali, M.I.; Samta, A.K. Leakage Detection in Pipeline Using Wavelet Transform Method. J. Sci. Appl. Eng. 2019, 2, 29–34. [Google Scholar] [CrossRef]
  23. Saritha, A.; Ramesh, K.S.; Rao, S.K. Application of Klauder Wavelet for Generation of Synthetic Seismic Signals. Int. J. Eng. Technol. 2018, 7, 903. [Google Scholar] [CrossRef]
  24. Hariramakrishnan, P.; Sendilkumar, S. Study of Transients Using Wavelet Transform. Int. J. Eng. Technol. 2017, 9, 3158–3163. [Google Scholar]
  25. Sandhya, B.; Shetty, D. Classification of Transmission Line Faults Using Wavelet Transform. Int. J. Innov. Res. Electr. Electron. Instrum. Control. Eng. 2016, 4, 147–151. [Google Scholar]
  26. She, Y.; Cai, G. Damage Detection Test of GFRP Composite Civil Materials Based on Piezoelectric Ceramic Sensors. Proc. Int. Wirel. Commun. Mob. Comput. Conf. 2022, 1, 5850187. [Google Scholar] [CrossRef]
  27. Gupta, P.; Mukhopadhyay, S. Wavelet Based Adaptive Thresholding Technique to Remove Earthquakes and Other Transient Signals from Continuous Ambient Noise Records. In Proceedings of the 2022 IEEE International Symposium on Smart Electronic Systems (iSES), IEEE, Warangal, India, December 2022; pp. 169–174. [Google Scholar]
  28. Latran, M.B.; Teke, A. A Novel Wavelet Transform Based Voltage Sag/Swell Detection Algorithm. Int. J. Electr. Power Energy Syst. 2015, 71, 131–139. [Google Scholar] [CrossRef]
  29. Liu, D.; Li, P.; Chen, Y. Dry-Type AMDT Fault Detection Based on Vibration Signal Analysis by Wavelet Packet. CES Trans. Electr. Mach. Syst. 2023, 7, 341–349. [Google Scholar] [CrossRef]
  30. Mohammadi, A.; Jannati, M.; Shams, M. Using Deep Transfer Learning Technique to Protect Electrical Distribution Systems Against High-Impedance Faults. IEEE Syst. J. 2023, 17, 3160–3171. [Google Scholar] [CrossRef]
  31. Talhaoui, H.; Ameid, T.; Aissa, O.; Kessal, A. Wavelet Packet and Fuzzy Logic Theory for Automatic Fault Detection in Induction Motor. Soft Comput. 2022, 26, 11935–11949. [Google Scholar] [CrossRef]
  32. Liu, H.; Huang, W.; Wang, S.; Zhu, Z. Adaptive Spectral Kurtosis Filtering Based on Morlet Wavelet and Its Application for Signal Transients Detection. Signal Process. 2014, 96, 118–124. [Google Scholar] [CrossRef]
  33. Ray, P.K.; Puhan, P.S.; Panda, G. Real Time Harmonics Estimation of Distorted Power System Signal. Int. J. Electr. Power Energy Syst. 2016, 75, 91–98. [Google Scholar] [CrossRef]
Figure 1. Procedure for time signal analysis in the frequency domain.
Computation 12 00178 g001
Figure 2. WT applications.
Computation 12 00178 g002
Figure 3. Graphical representation of WT analysis.
Computation 12 00178 g003
Figure 4. Circuit employed for the research composed of an RLC load and two switches with opening and closing sequences.
Computation 12 00178 g004
Figure 5. Physical circuit composed of an RLC load and two switches with opening and closing sequences.
Computation 12 00178 g005
Figure 6. Temporary voltage signal obtained from an opening and closing sequence.
Computation 12 00178 g006
Figure 7. Temporary current signal obtained from an opening and closing sequence.
Computation 12 00178 g007
Figure 8. Analysis window employed to obtain the frequency spectrum of the voltage signal.
Computation 12 00178 g008
Figure 9. Analysis window employed to obtain the frequency spectrum of the current signal.
Computation 12 00178 g009
Figure 10. Spectrum of the transient voltage signal obtained using DFT.
Computation 12 00178 g010
Figure 11. Spectrum of the transient voltage signal obtained using CWT.
Computation 12 00178 g011
Figure 12. Spectrum of the transient voltage signal obtained using the DFT between 1-MHz and 5-MHz.
Computation 12 00178 g012
Figure 13. Spectrum of the transient voltage signal obtained using the CWT in the 1 MHz to 5 MHz range.
Computation 12 00178 g013
Figure 14. Spectrum of the transient current signal obtained using DFT.
Computation 12 00178 g014
Figure 15. Spectrum of the transient current signal obtained using CWT.
Computation 12 00178 g015
Figure 16. Spectrum of the transient current signal obtained from an opening and closing sequence of an electronic switch using the DFT in a 100 kHz to 1 MHz range.
Computation 12 00178 g016
Figure 17. Spectrum of the transient current signal obtained from an opening and closing sequence of an electronic switch using the CWT in a 100 kHz to 1 MHz range.
Computation 12 00178 g017
Figure 18. Spectrum of the transient voltage signal obtained from an opening and closing sequence of an electronic switch using the DFT.
Computation 12 00178 g018
Figure 19. Spectrum of the transient voltage signal obtained from an opening and closing sequence of an electronic switch using the CWT.
Computation 12 00178 g019
Figure 20. Spectrum of the transient current signal obtained from an opening and closing sequence of an electronic switch using the DFT.
Computation 12 00178 g020
Figure 21. Spectrum of the transient current signal obtained from an opening and closing sequence of an electronic switch using the CWT.
Computation 12 00178 g021
Figure 22. Spectrum of the three transient voltage signals obtained with DFT.
Computation 12 00178 g022
Figure 23. Spectrum of the three transient voltage signals obtained with CWT.
Computation 12 00178 g023
Figure 24. Spectrum of three transient current signals, with the opening and closing sequence of an electronic switch, obtained with DFT.
Computation 12 00178 g024
Figure 25. Spectrum of three transient current signals, with the opening and closing sequence of an electronic switch, obtained with CWT.
Computation 12 00178 g025
Table 1. Comparison of the relevant aspects in obtaining spectrums using the DFT and CWT.
FeaturesCWTDFT
Noise Attenuation High attenuation of electrical noise due to measurements. More complex external methods are needed.
Filtering It does not need external processing. It does not depend on the sampling frequency. It depends on the sampling frequency and the analysis window.
Repeatability Low sensitivity to electrical noise due to the measurements. It is very sensitive to electrical noise due to the measurements. Repeatability is low.
Disclaimer/Publisher’s Note: The statements, opinions and data contained in all publications are solely those of the individual author(s) and contributor(s) and not of MDPI and/or the editor(s). MDPI and/or the editor(s) disclaim responsibility for any injury to people or property resulting from any ideas, methods, instructions or products referred to in the content.

