Article

Performance Analysis and Optimization of a Channeled Photovoltaic Thermal System with Fin Absorbers and Combined Bi-Fluid Cooling

1
Laboratory of Energy Applications and Renewable Energy Efficiency (LAPER), Faculty of Sciences of Tunis, University of Tunis El Manar, Rommana 1068, Tunisia
2
Department of Electrical and Information Engineering, Polytechnic University of Bari, St. E. Orabona 4, I-70125 Bari, Italy
3
Thermal Processes Laboratory, Research and Technology Center of Energy (CRTEn), BP.95, Hammam-Lif 2050, Tunisia
*
Author to whom correspondence should be addressed.
Computation 2024, 12(9), 188; https://doi.org/10.3390/computation12090188
Submission received: 15 August 2024 / Revised: 8 September 2024 / Accepted: 12 September 2024 / Published: 15 September 2024
(This article belongs to the Section Computational Engineering)

Abstract

:
The conversion efficiency of photovoltaic (PV) cells can be increased by reducing high temperatures with appropriate cooling. Passive cooling systems using air, water, ethylene glycol, and air/water+TiO2 nano bi-fluid froth in the duct channel have been studied, but an overall assessment is essential for its possible application. In the present work, a numerical study is adopted to investigate the impact of the fluid-duct channel type on the electrical and thermal efficiency of the photovoltaic thermal (PVT) collector. Such investigation is achieved by means of a MATLAB R2022b code based on the Runge–Kutta (RK4) method. Four kinds of fluid duct channels are used to optimize the best fluid for improving the overall efficiency of the investigated PVT system. The numerical validation of the proposed model has been made by comparing the numerical and experimental results reported in the literature. The outcomes indicate that varying the duct channel nature affects mainly the electrical and thermal efficiency of the PVT collector. Our results validate that the nature of the fluid affects weakly the electrical efficiency, whereas the thermal efficiency is strongly affected. Accordingly, it is observed that PVT collectors based on nano bi-fluid air/water+TiO2 give the best performance. In this context, an appreciable increase in the overall efficiency of 22% is observed when the water+TiO2 fluid is substituted by air/ water+TiO2 nano bi-fluid. Therefore, these motivating results make the PVT nano bi-fluid efficient and suitable for solar photovoltaic thermal applications since this system exhibits a daily overall efficiency of about 56.96%. The present work proves that controlling the design, cooling technique, and nature of the cooling fluid used is a crucial factor for improving the electrical, thermal, and overall efficiency of the PVT systems.

Graphical Abstract

1. Introduction

Recently, renewable energy has received much consideration worldwide due to environmental pollution and energy shortages [1]. Nowadays, solar energy is considered among the greatest forms of renewable energy due to its many advantages, including abundant resources, cleanliness, safety, and cost-effectiveness. According to previous reports, it is found that both photothermal and photovoltaic tools are the greatest, most popular, and most mature tools for solar energy operation [2]. Over the past century, the concept of PVT technology has been developed to enhance the optimal conditions for improving the conversion efficiency of photovoltaic cells [1,2]. The technology associates the PV cells and the solar thermal components in a single collector to produce both electrical and thermal energy, thereby increasing the overall efficiency [3,4]. The cooling medium (such as air, water, and so on) in a PVT system can decrease the temperature of its PV cells and expand the total photovoltaic efficiency. Accordingly, it is observed that the PVT collector systems play a significant role in the renewable energy sector [5]. Furthermore, solar photovoltaic energy holds significant potential as a leading contributor to the future of clean energy sources, as studied by [6]. PVT gas collection can be installed within a building as a heat pump source, further reducing the building’s energy by reducing heating or cooling loads. Subsequently, a study conducted by [7] designed a BIPVT roof structure and found that the experimental electrical and thermal efficiency are 7.2% and 69.3%, respectively. To further enhance the efficiencies of PV technologies, ref. [8] designed PVT-air systems with different geometric configurations, including concave spheres, and found that the heat output increased by 15.77% across three different configurations compared to the unmodified system. According to a study carried out by [9], the addition of porous plates to the bi-fluid PVT collector results in the highest thermal and energy efficiency of 70.59% and 81.61%, respectively. In addition, the design of PVT collectors is suddenly separated from the generation of PVT collectors, such as spectral beam splitting PVT collectors, PVT collectors, phase change material PVT collectors, microchannel heat pipe PVT collectors, a-si PVT collectors, etc. These investigations are reliable confirmations of the generation of PVT collectors and show great prospects for future PVT collector applications.
Although PVT collectors exhibit the benefits of combining heat and electricity generation while saving space [10], their applications are still limited. The main cause of this problem is heat stroke [11]. In cold conditions, the higher the PVT, the lower the temperature, making it difficult to maintain the correct temperature [12]. Extreme heat loss can cause frost damage to the PVT [13,14]. Additionally, most of the PVT structure is designed to provide low temperatures (<40 °C) due to increased heat transfer as operating temperatures rise [15]. However, some heating only meets the needs of small end-uses, such as heating swimming pools, which account for only a small portion of global heating [16]. Therefore, PVT collectors cannot be used in cold areas or to obtain more energy, which limits their use. PVT collectors are intended to make full use of solar energy. Therefore, it is very significant to reduce the temperature of the collector [17]. The heat loss of PVT collectors is divided into three types: atmospheric heat loss, passive heat loss, and effective heat loss. In traditional PVT systems, using the air space between the PVT pump and the glass cover diminishes heat transfer and heat loss thanks to the small air volumes and the air thickness [18]. Nevertheless, conductive heat and cooling remain constant even when atmospheric changes are introduced. Since vacuum is a good way to prevent both convective and conductive heat, some scientists have adopted the vacuum technology to decrease the overall heat loss of PVT collectors [19]. Italy’s PVT Solar has developed a solar collector that can operate at moderate temperatures, producing hot water or steam of 80–180 °C with temperatures as high as 64.5%, providing heat source operators for mechanical or industrial refrigeration [20,21]. In addition, a study was carried out by [22,23] on the Solar Heating and Cooling (SHC) system incorporating PVT collectors, considering a novel poly generation system operating up to 80 °C. According to the experimental results and numerical simulations by [24], it can be seen that the average plate collector temperature is 90.18%, which is greater than that of other solar collector systems. This shows that the vacuum environment has an excellent heat-reducing ability and improves the quality of the collector. After this, some researchers have tried to use a vacuum type for PVT collectors [25]. Moreover, through experimental results and numerical simulations, a comparative study of the power of hybrid flat-plate vacuum PVT collectors and air gap PVT collectors reveals that both the thermal efficiency and overall efficiency increased by 9.5% and 16.8%, respectively [25]. However, the electrical efficiency of the vacuum PVT collector is diminished by around 0.02%.
Furthermore, to improve the efficiencies of both kinds of PVT collector systems, more studies are focusing on cooling the internal system by utilizing both passive and active cooling means [26], including CPVT and FL. The literature results show that passive cooling improves thermal efficiency by 18.05% and electrical efficiency by 0.34%. Active cooling, on the other hand, results in a 33.15% enhancement in thermal efficiency and a 0.73% increase in electrical efficiency. Researchers are exploring various methods to enhance PVT system performance, particularly focusing on condenser and cooling technologies like water and nanofluid cooling, optical components, and thermal energy storage. Reference [27] uses water as the cooling fluid for the PVT system and reported an overall efficiency of 53%. The combined fluid cooling using water and ethylene glycol is found to achieve efficiencies of 18.5% and 14.6% for electrical efficiency, and 65.2% and 39.1% for thermal efficiency [28,29], respectively. Extensive research in solar energy cogeneration underscores the ongoing efforts to optimize the efficiency of PVT systems. Studies indicate that the focus is on utilizing one or a combination of these elements to improve the efficiency of PVT systems. The proposed geometric design of this PVT system, featuring 20 finned absorbers integrated into the air duct channel, offers a unique method for improving performance. This study aimed to enhance the efficiency of a PVT system using a bi-fluid combination as the cooling fluid. The choice of working fluid significantly impacts the internal temperature of the system, thereby increasing the efficiency of the PVT collector. Consequently, the electrical and thermal efficiency of the PVT system was examined and compared to various recent works. Furthermore, both the thermal and electrical efficiencies of the PVT collector were investigated using various cooling fluids, including air, water, ethylene glycol, and a combination of bi-fluid (air/water+TiO2) as the working bi-fluid at an optimum flow rate. In this work, we aim to investigate the impact of the fluid duct channel characteristics using a numerical Runge–Kutta method. Our results indicate that changing the nature of the fluid primarily affects the overall efficiency and power of the system.
This paper is organized as follows. Section 2 presents our specification of the geometric design, thermal, and heat exchange modeling of the PVT collector with 20 finned absorbers. Section 3 details the methodology and the properties of the fluid types used in the simulation. Section 4 focuses on the results and discussion, presenting the strategy for choosing the best combination of a bi-fluid pair. A comparison with previous works is also presented.

2. Materials and Modeling

2.1. Description of the PVT System

In this study, a 5BB 60-cell polycrystalline module (model IF-P280-60) is utilized as part of a hybrid PVT collector system [30]. The PVT hybrid solar system consists of a PV module with three layers: a tempered glass layer, PV cells encapsulated in EVA, and a Tedlar adhesive layer. Additionally, the solar thermal module includes an air conduit channel positioned between the Tedlar adhesive layer and the insulation layer. The integration of these two modules forms the hybrid PVT system, illustrated in Figure 1 [31].
This examination presents the implementation of a comprehensive simulation of a hybrid collector. The technical specifications of the proposed PV module and the electrical data at standard test conditions (STC), i.e., solar irradiance of 1000 W/m² and cell temperature of 25 °C, are detailed in Table 1. Obviously, the real conditions are usually different from the STC, but these values allow the possibility of comparing the behavior and the effects under different environmental conditions [32,33,34].
The enhancement in the performance of this hybrid PVT collector is attributed to its geometric design, which includes factors such as height, width, thickness, and the number of fins, as well as the selection of the internal cooling fluid. This geometric design allowed the creation of a fin-based thermal radiator, optimizing the cooling of PV cells and enabling effective thermal energy recovery.

2.2. Thermal Modeling

This subsection introduces the thermal modeling of the PVT system described in the previous subsection. The proposed geometric design of the PVT system incorporates longitudinal fins, extending the full length of the air duct channel to serve as a heatsink. These fin absorbers facilitate the transfer of waste heat from the PV cells through convection, radiation, and conduction within the thermal sensor channel. The prospective system has been verified on a real measured meteorological database in a MATLAB R2022b environment. It includes measurements of solar radiation from the literature and our experimental results, wind speed, and ambient temperature.
In the PVT system, thermal exchange occurs through three well-known heat transfer modes: conduction, convection, and radiation. The thermal resistance diagram of the hybrid collector, based on the electrical analogy, is shown in Figure 2.
The mentioned hra, hcv, and hcd parameters are the heat transfer coefficient (thermal resistances) related to radiation, convection, and conduction between different layers of the system, respectively. P e l designates to the electrical power produced by PV cells, whereas P t h presents the thermal power produced by the system. The equation number, where each parameter is calculated, is also reported.

2.2.1. The Convection Heat Transfer Coefficient

The convective heat transfer coefficient due to the wind is typically described by using the McAdam’s correlation [35]:
h w = 5.69 + 3.81   V w
with V w defining the wind velocity [ms−1].
The combined influence of the heat conduction through the insulation material and the surface convection caused by wind is the following [36]:
h c v , i a = [ λ i e i + 1 h w ] 1
The convective heat transfer coefficient for the front surface of the hybrid collector inclined with an angle φ is defined by the following relation [37]:
h c v , a g = 1.247 · T g T a c o s φ 1 3 + 2.658 · V w
where Ta represents the ambient temperature and Tg is the temperature of the glass layer.
The overall convective heat transfer coefficient between the fluid and each layer (j) is defined as follows:
h c v , f j = [ λ j e j + 1 h c v , a b ] 1
where ej denotes the thermal conductivity of the jth layer [Wm−1K−1], λ j the thickness of the jth layer [m], and h c v , a b the convective heat transfer coefficient of fins [Wm−2K−1].
Inside the air gap, the convective heat transfer coefficient is related to the Nusselt number (Nu) and can be calculated by using the following equation [38]:
h c v , a b = N u . e f D h
where D h represents the width of the channel [m], while ef represents the thermal conductivity of the fluid [Wm−1K−1].
The Nusselt number is a dimensionless parameter utilized to determine the heat transfer coefficient within an air duct channel featuring finned absorbers. It serves to quantify the efficiency of heat transfer in the fluid flow. The formula proposed by [38] is:
N u = 0.018 · P r 0.4 · R e 0.8
The Reynolds (Re) number and Prandtl number (Pr) are two dimensionless factors given by Equations (7) and (8) [36], respectively:
R e = σ f . D h µ f . V f
P r = C f . µ f e f
where σ f , µ f , Vf, and Cf are the density [Kgm−3], the dynamic viscosity [Kgs−1m−1], the velocity [ms−1], and the specific heat capacity [JKg−1K−1] of the fluid.

2.2.2. The Radiative Heat Transfer Coefficient

The radiative heat transfer coefficient between the glass cover and the sky is calculated as [30]:
h r a , g s k y = σ . ε g . ( T g 2 . T s k y 2 ) . ( T g + T s k y )
with σ denoting the Stefan–Boltzmann constant 5.67 · 10−8 [Wm−2K−4], ε g the emissivity of the glass cover (dimensionless), and Tsky the sky temperature [K].
The sky temperature is determined by using the Swinbank relation [39]:
T s k y = 0.0552 · T a 1,5
The radiative heat transfer coefficient between the Tedlar and the insulation is given as follows [30]:
h r a , i t e d = σ · T t e d + T i . ( T t e d 2 + T i 2 ) 1 ε t e d + 1 ε i 1
with ε t e d and ε i the emissivity of the Tedlar and the insulation layers, respectively. T t e d is the temperature of the Tedlar layer while T i is the temperature of the insulation.
The radiative heat transfer coefficient between the ground and the insulation layer of the hybrid collector is described as follows:
h r a , g r i = 0.5 σ · ε i · 1 + c o s φ · ( T g r 2 + T i 2 ) · ( T g r + T i )
where Tgr denotes the temperature of the ground [K] and φ is the inclination angle of the PVT collector [rad].

2.2.3. The Conduction Heat Transfer Coefficient

The conduction heat transfer coefficient between two neighboring component layers (m and n) is determined as follows [35]:
h c d , m n = [ λ m e m + λ n e n ] 1
where λ is the thickness [m] and e denote the heat thermal conductivity [Wm−1K−1].

2.3. Heat Exchange Modeling

This third subsection involves the development of a comprehensive numerical simulation model for a hybrid PVT collector. Energy balance equations for each layer of the system were used to describe the operation over time of all system components [30]. In the modeling process, the energy balance equation across the layers of the hybrid collector, the temperature of each layer, and the temperature of the heat transfer fluid within the air gap are considered average. The hypotheses made for the modeling and formulation of the energy balance equation across the layers of the hybrid collector are as follows [30]:
  • The physical properties of the materials are constant.
  • The energy transfer is quasi-steady.
  • The airflow velocity along the collector is not influenced by the geometry of the duct.
  • The junction temperature of the fin absorbers is equal to the temperature of the fins at both the bottom and the top.
  • The temperature gradient within each layer is only in the direction of the airflow.
  • A uniform heat transfer coefficient (Ufin) is applied over the entire fin surface, assuming that the fin absorber material is homogeneous.
The principle of energy conservation is employed to estimate the internal temperature of a system and determine its electrical and thermal properties. For this purpose, power calculation equations can be employed for each phase of the hybrid collector. This equation provides a complete evaluation of the energy transfer occurring in the system, including the power input and output [30]. By examining these currents, the temperature can be predicted, and several electrical and thermal properties of the system can be calculated. It must be renowned that the precise equation used to calculate the power consumption depends on the design and unique aspect of the hybrid collector. For each part of the PVT system, various relations are well used for describing the energy difference between the different PVT layers. Accordingly, the energy balance equation for the external glass cover layer is given by the following equations [36], where the three modes of heat transfer are represented by the mentioned parameters h r a , g s k y , h c v , a g , and h c d , g c :
M g C g d T g d t = A · α g G + h r a , g s k y · T s k y T g + h c v , a g · T a T g h c d , g c · T g T c
where α g is the absorption coefficient of the glass cover layer (dimensionless), A is the surface area of the PVT collector [m2], and G represents the solar radiation in [Wm−2]. M g is the mass of the glass [Kg], and C g is the specific heat capacity of the glass cover [JKg−1K−1].
The mathematical description of the PV cells layer is mainly described using the relation:
M c C c d T c d t = A · τ g α c G . F + h c d , g c · T g T c + h c d , c t e d · T c T t e d P e l
where Mc and Cc are the mass [Kg] and the specific heat capacity [JKg−1K−1] of the PV cells.
The parameter α c represents the absorption solar cell radiation coefficient. The factor τ g is the glass transmittance, and F = 0.83 is the packing factor.
For the Tedlar layer, the following equation defines the differential energy balance [36]:
M t e d C t e d d T t e d d t = A · τ c τ g α t e d   G · F + τ g α t e d · G 1 F + h c d , c t e d · T c T t e d h c v , f t e d · T t e d T f h r a , i t e d · T t e d T i
with Mted the Tedlar mass [Kg], and Cted the specific heat capacity of the Tedlar [JKg−1K−1].
However, for the employed fluid gap, the energy balance equation is the following:
σ f . v f . C f d T f d t = A . h c v , f t e d T t e d T f + A . U f i n T t e d T f A . h c v , f i T f T i P t h
with σ f the density of the fluid [Kgm−3], v f the fluid volume [m3], T f the fluid temperature [K], and C f the specific heat capacity of the fluid [JKg−1K−1].
The thermal power produced by the system is defined as follows:
P t h = m f · C f · T f = m f · C f · T f , o u t T f , i n
where mf is the mass flow rate of the fluid [Kgs−1], T f , i n and T f , o u t the inlet and the outlet fluid temperature, respectively.
The overall heat transfer coefficient of the finned surface [Wm−2K−1] follows [31]:
U f i n = N A f 2 e a b A a b L h c v , a b 0.5 · tanh M H
N is the number of fin absorbers, while the parameter H refers to the height of the fin, and A f is the total fin surface area available for heat transfer.
The parameter M can be calculated as [31]:
M = 2 L · h c v , a b e a b A a b 0.5
where e a b , A a b and L are the thermal conductivity of the fin absorber, the cross-sectional area of the fin, and the length of the fin along the hybrid collector, respectively.
Finally, the dynamic equation of the insulation layer is the following:
M i C i d T i d t = A · h r a , i t e d ( T i T t e d ) h c v , i a T i T a h r a , g r i T i T g r h c v , f i ( T i T f )
with Mi the mass of the insulation [Kg], and Ci the specific heat capacity of the insulation layer [JKg−1K−1].

3. Methodology and Approach

3.1. Methodology

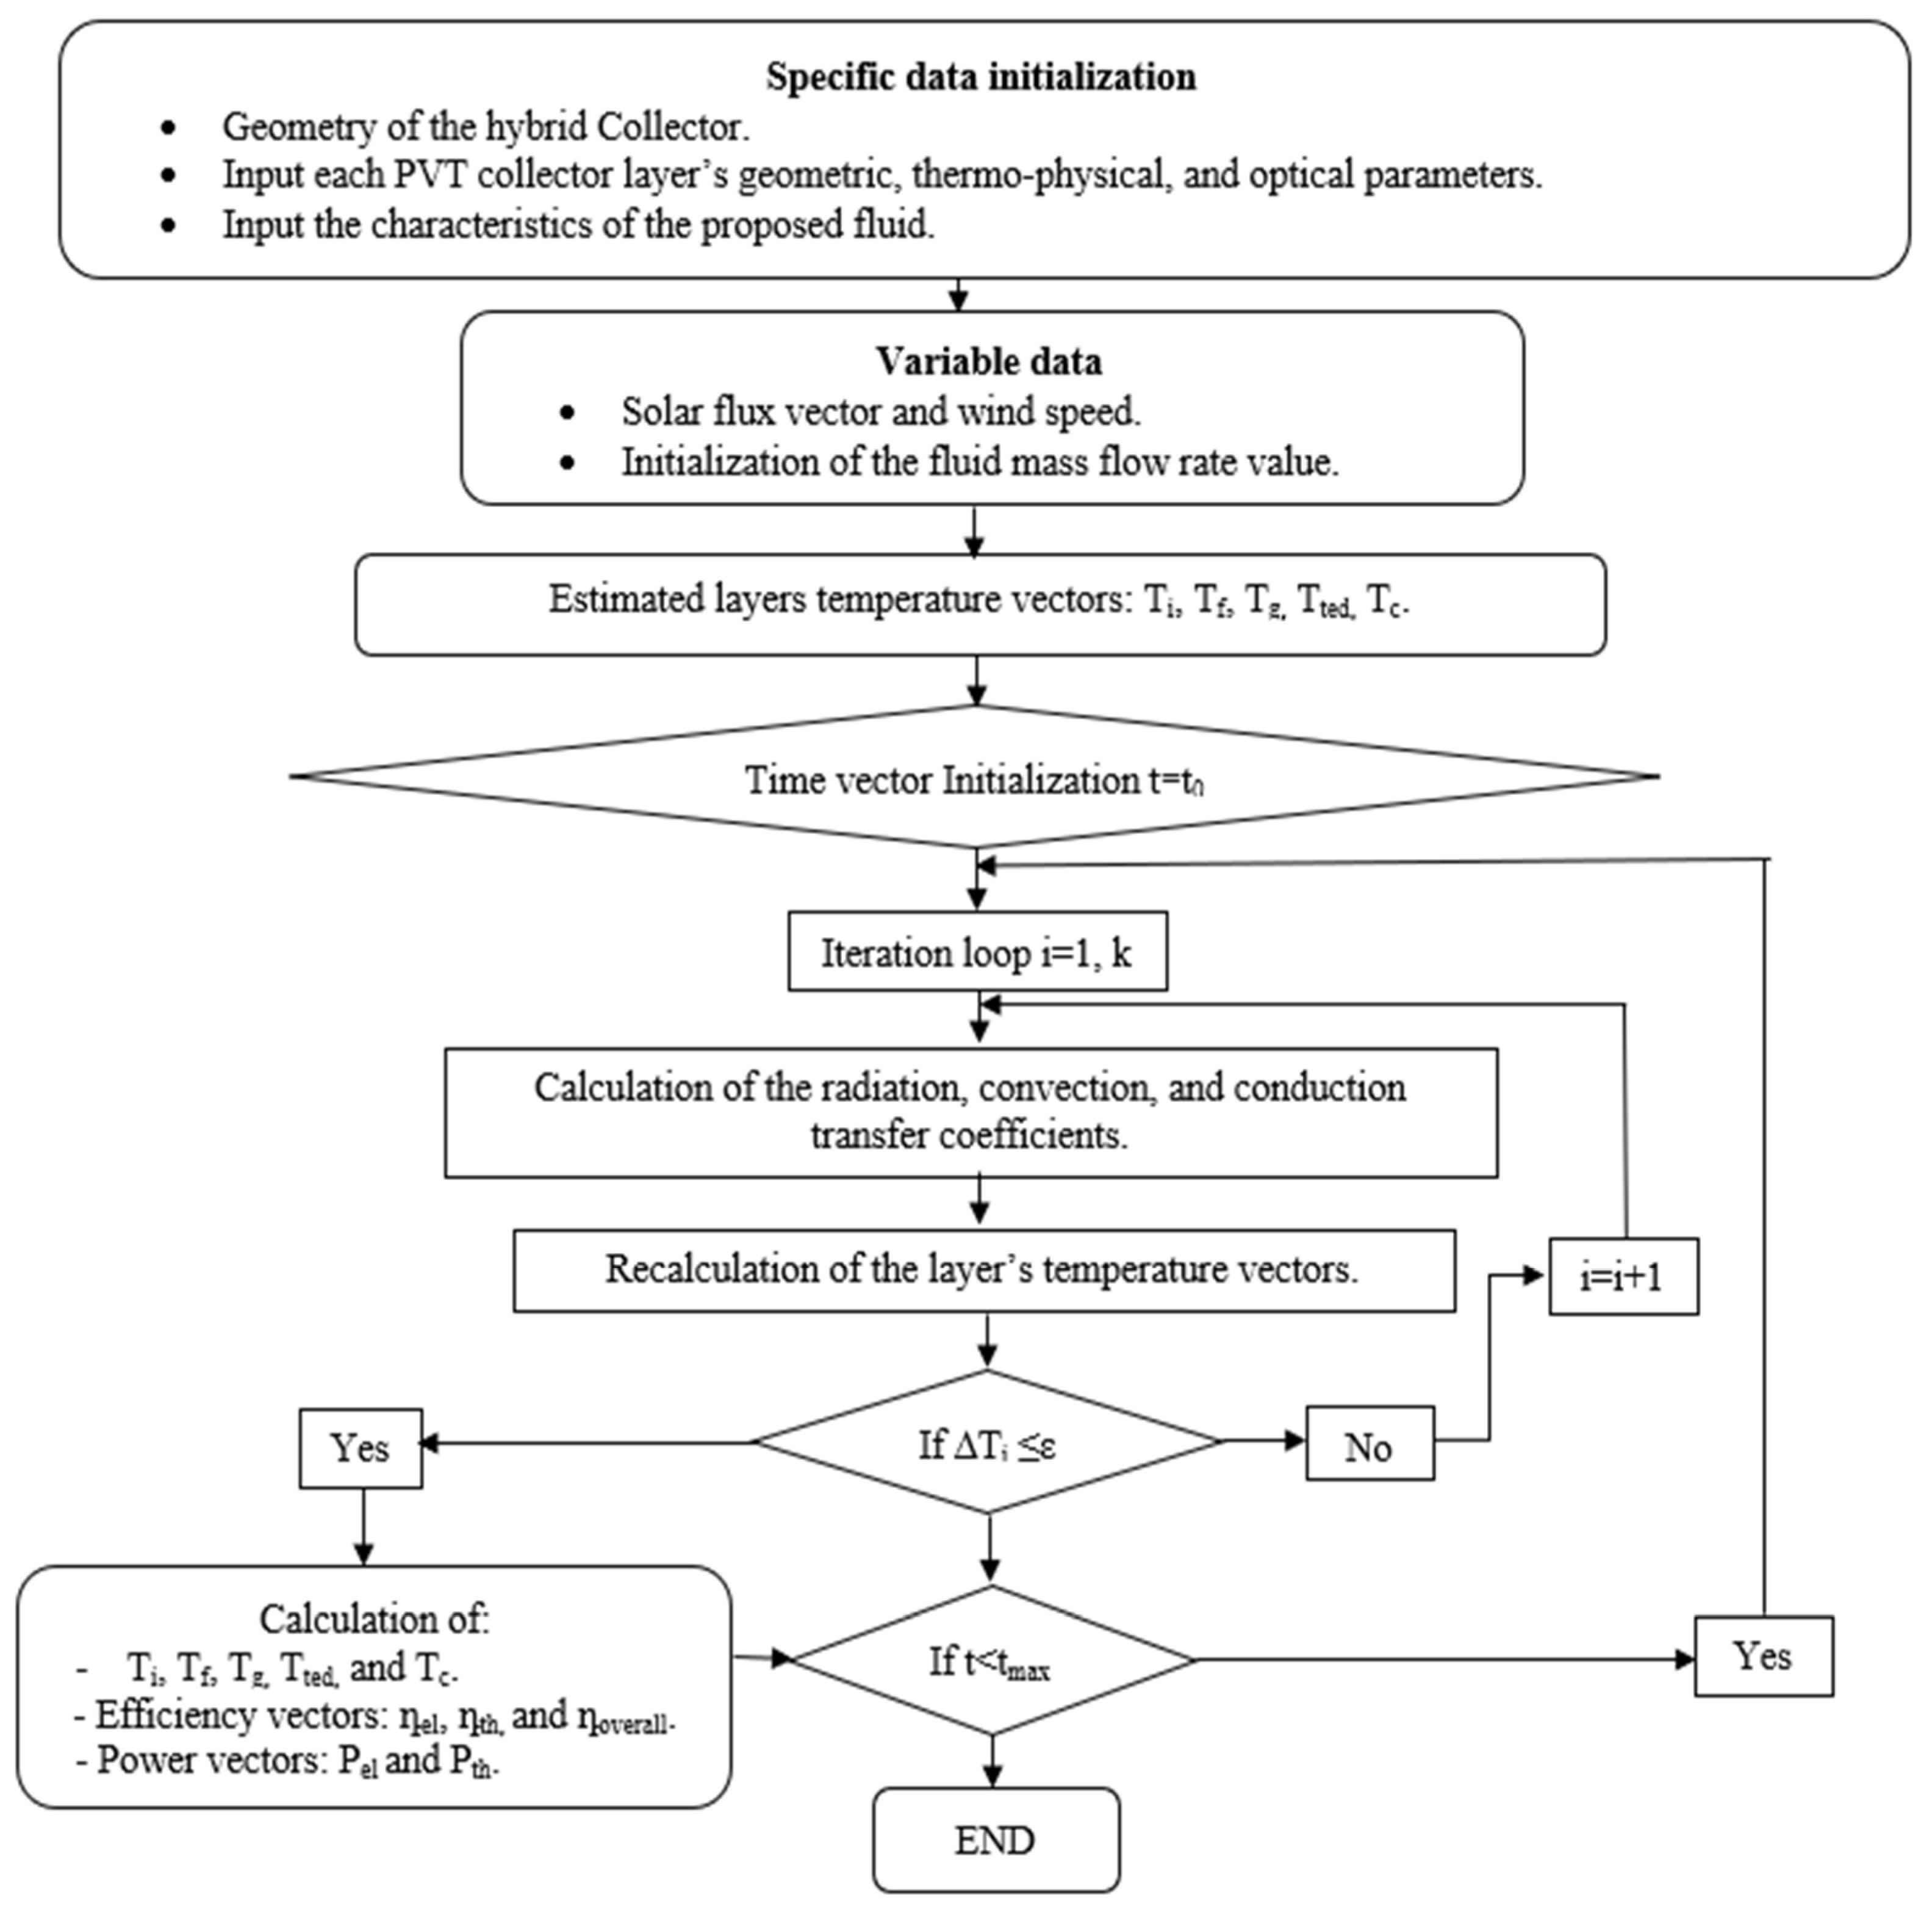
The proposed methodology allows calculating both the electrical and thermal efficiency of the PVT collector with fin absorbers, depending on the types of used fluids. Several studies have established that specific fluids, such as nanoparticle materials, can enhance the system’s performance. The geometric design was manufactured by us experimentally in [30] and validated numerically in [31], where only one type of fluid duct channel (air) was considered with a fixed Tedlar thickness of 5 mm. It retains our unique optimization of the hybrid collector with 20 fin absorbers which will place equidistance in the air-cooling channel. Instead, in this paper, we suggest a combination of a biofluid mixture (Water+TiO2) with air as the cooling liquid for the internal PVT collector system. This paper makes a significant contribution by combining the geometric fin absorber design with a combination of bi-fluid cooling optimization for the hybrid PVT collector, thereby enhancing the system’s electrical and thermal production efficiencies. To achieve the numerical simulation of the phenomena, using the Runge Kutta method (RK4) and based on the MATLAB R2022b software, 20 fin absorbers are added to the air duct channel of the PVT collector. Specifically, they are inserted between the Tedlar and the insulation layer, based on our recent experimental investigation [30]. The numerical steps to calculate the temperatures, the electrical and thermal power, and the efficiency are illustrated in Figure 3.
Three main contributions to the optimization of PVT collector systems are carried out by the proposed methodology. Firstly, it focuses on improving the overall power produced by the system by affecting the geometric design of the system. Secondly, it focuses on developing various heat exchange mechanisms by enhancing internal cooling within the hybrid collector to achieve optimal performance. Third, it proposes a new strategy that combines the use of a bi-fluid (air/water+TiO2) as a coolant with the addition of an optimized geometric design featuring finned absorbers. This comprehensive approach is designed to improve the hybrid collector’s performance optimization strategy, ensuring optimal efficiency. The main points are as follows:
  • The geometry of the hybrid collector involves its structure and operation to achieve energy efficiency, maximize the production of thermal and electrical power, and minimize the internal temperature of the system.
  • A modeling optimization technique for the PVT system consists of adding twenty finned absorbers to recover the most heat produced by the system.
  • Heat transfer mechanisms were examined to establish the ideal internal temperature conditions for the system when working.
  • The combination of bi-fluid (air/water+TiO2) is identified as the most effective internal cooling solution for the system under investigation.

3.2. Performance Study Approach

For the studied PVT system, improving the electrical and thermal efficiency means increasing the photovoltaic efficiency (the electrical power generation) and the thermal efficiency (the heat production). In addition, strength and thermal capacity can be improved while considering other factors such as cost, durability, and environmental impact. To improve the power generation and/or the heat production of the systems, three different kinds of fluids (air, water, and ethylene glycol) have been used. The parameters of the employed model (thermal resistance and thermal conductivity) are calculated based on the geometric design data of the PVT collector and on the physical thermal properties of each component (thermal conductivity, specific heat, density, absorber coefficient, transmittance, and emissivity). Previous studies have established that the electrical and thermal efficiency can be optimized, considering the temperature factors [19].

3.2.1. Thermal Efficiency

In this research, a conjugate heat transfer model was developed utilizing an enthalpy-based approach. The changes in enthalpy and entropy of the fluid flow can be calculated as [40]:
g = g o u t g i n = C f ( T f , o u t T f , i n ) G · A
s = s o u t s i n = C f . l n ( T f , o u t T f , i n )
where g is the enthalpy value [JKg−1] and s is the entropy [JKg−1K−1].
Assuming the PVT system is well insulated, the temperature ( T a d i a b a t i c ) can be estimated as follows:
T a d i a b a t i c = T i n i t i a l + ( Q s o l a r m . C f )
where T i n i t i a l is the initial temperature of the fluid [K] and Q s o l a r is the amount of solar energy absorbed.
The thermal efficiency can be optimized by changing the fluid temperature. This parameter is directly influenced by the fluid duct channel design, the thickness and number of particulate matter absorbers, the nature and the properties of the employed cooling fluid (e.g., air, ethylene glycol, water…), and the mass flow rate in the air duct. In this case, the temperature dependence of thermal efficiency is calculated by the following equation:
η t h = m f C f ( T f , o u t T f , i n )   G · A
Cf is the specific heat fluid capacity [JKg−1K−1], T f , o u t represents the air outlet temperature [K], T f , i n is the inlet air temperature [K], and mf denotes the mass flow rate of the employed fluid [Kgs−1], which is represented as follows:
m f = A f · ρ f · V f
With ρ f the fluid density [Kg m−3], V f the fluid velocity [ms−1], and A f the cross-sectional area through which the fluid flows [m2].
The daily thermal efficiency represents the average efficiency per day and is calculated as follows:
η t h , d a i l y ( % ) = i = 1 K η t h ( K ) K
where K corresponds to the total number of daily numerical simulations.

3.2.2. Electrical Efficiency

The nature of the fluid duct channel can also indirectly affect the electrical efficiency of the PVT collector. Accordingly, the fluid characteristics impact strongly on the cell layer temperature that, in turn, governs the electrical efficiency of the system. In this case, the electrical efficiency of the hybrid PVT collector is given by the following equation [31]:
η e l = η r e f · 1 β P V . ( T c T c , r e f ) + ɣ   ln   ( G G S T C )
where η r e f is reference efficiency, T c , r e f [K] and G S T C [Wm−2] are the solar cell temperature and the solar irradiance under standard test conditions, respectively, and β P V is the temperature coefficient of the PV cell [K−1]. Various alternatives have been considered to determine the coefficient used in the following equations, posing ɣ = 0 where the values of β P V and η r e f have been posed to be 0.0045 and 15%, respectively.
The daily electrical efficiency represents the average efficiency per day and is calculated as follows:
η e l , d a i l y ( % ) = i = 1 K η e l ( K ) K

3.2.3. Overall Efficiency

The overall efficiency (ηoverall), when assessing the PVT system [41], is defined as the sum of the thermal and electrical efficiencies as follows:
η o v e r a l l = η e l + η t h
with η e l the electrical efficiency and η t h the thermal efficiency.
The daily overall efficiency represents the average efficiency per day and is calculated as follows:
η o v e r a l l , d a i l y ( % ) = i = 1 K η o v e r a l l ( K ) K

4. Result and Discussions

Utilizing several working fluids in a PVT system can optimize and boost performance, but it also introduces challenges like an increase in the system complexity, greater maintenance requirements, higher costs, and potential environmental impacts. Therefore, choosing the right working fluid requires a thorough evaluation of the specific application, operational conditions, and the trade-offs that the system designer is willing to accept. The optimal working fluid combination for a PVT system depends on balancing heat transfer efficiency, system complexity, cost, and application-specific requirements. Water-glycol mixtures, refrigerants, and nanofluids are among the most promising options, each suited to different operational contexts. In this work, the Runge–Kutta method is employed to determine and analyze the efficiencies of the PVT system. In addition, the proposed simulation incorporated key parameters of the system, including thermal and electrical properties, fluid flow characteristics, and boundary conditions. By iteratively solving the governing equations of the PVT system, the model is able to predict the temperature distribution, heat transfer rates, and overall system efficiency. The choice of the Runge–Kutta method provides a balance between computational efficiency and precision, making it suitable for capturing the dynamic behavior of the PVT collector under various operating conditions. Different tests were conducted to compare the predicted temperature signals with those collected during the tests. For each simulation, the following parameters are modeled: layers temperature [°C], electrical and thermal efficiency [%], and electrical and thermal power [W]. Three kinds of fluid are employed to optimize and improve the performances (power and efficiency) of the solar cells for energy generation applications. For PVT collectors, optimizing both the electrical and thermal efficiency is a target to realize the best overall system performance.
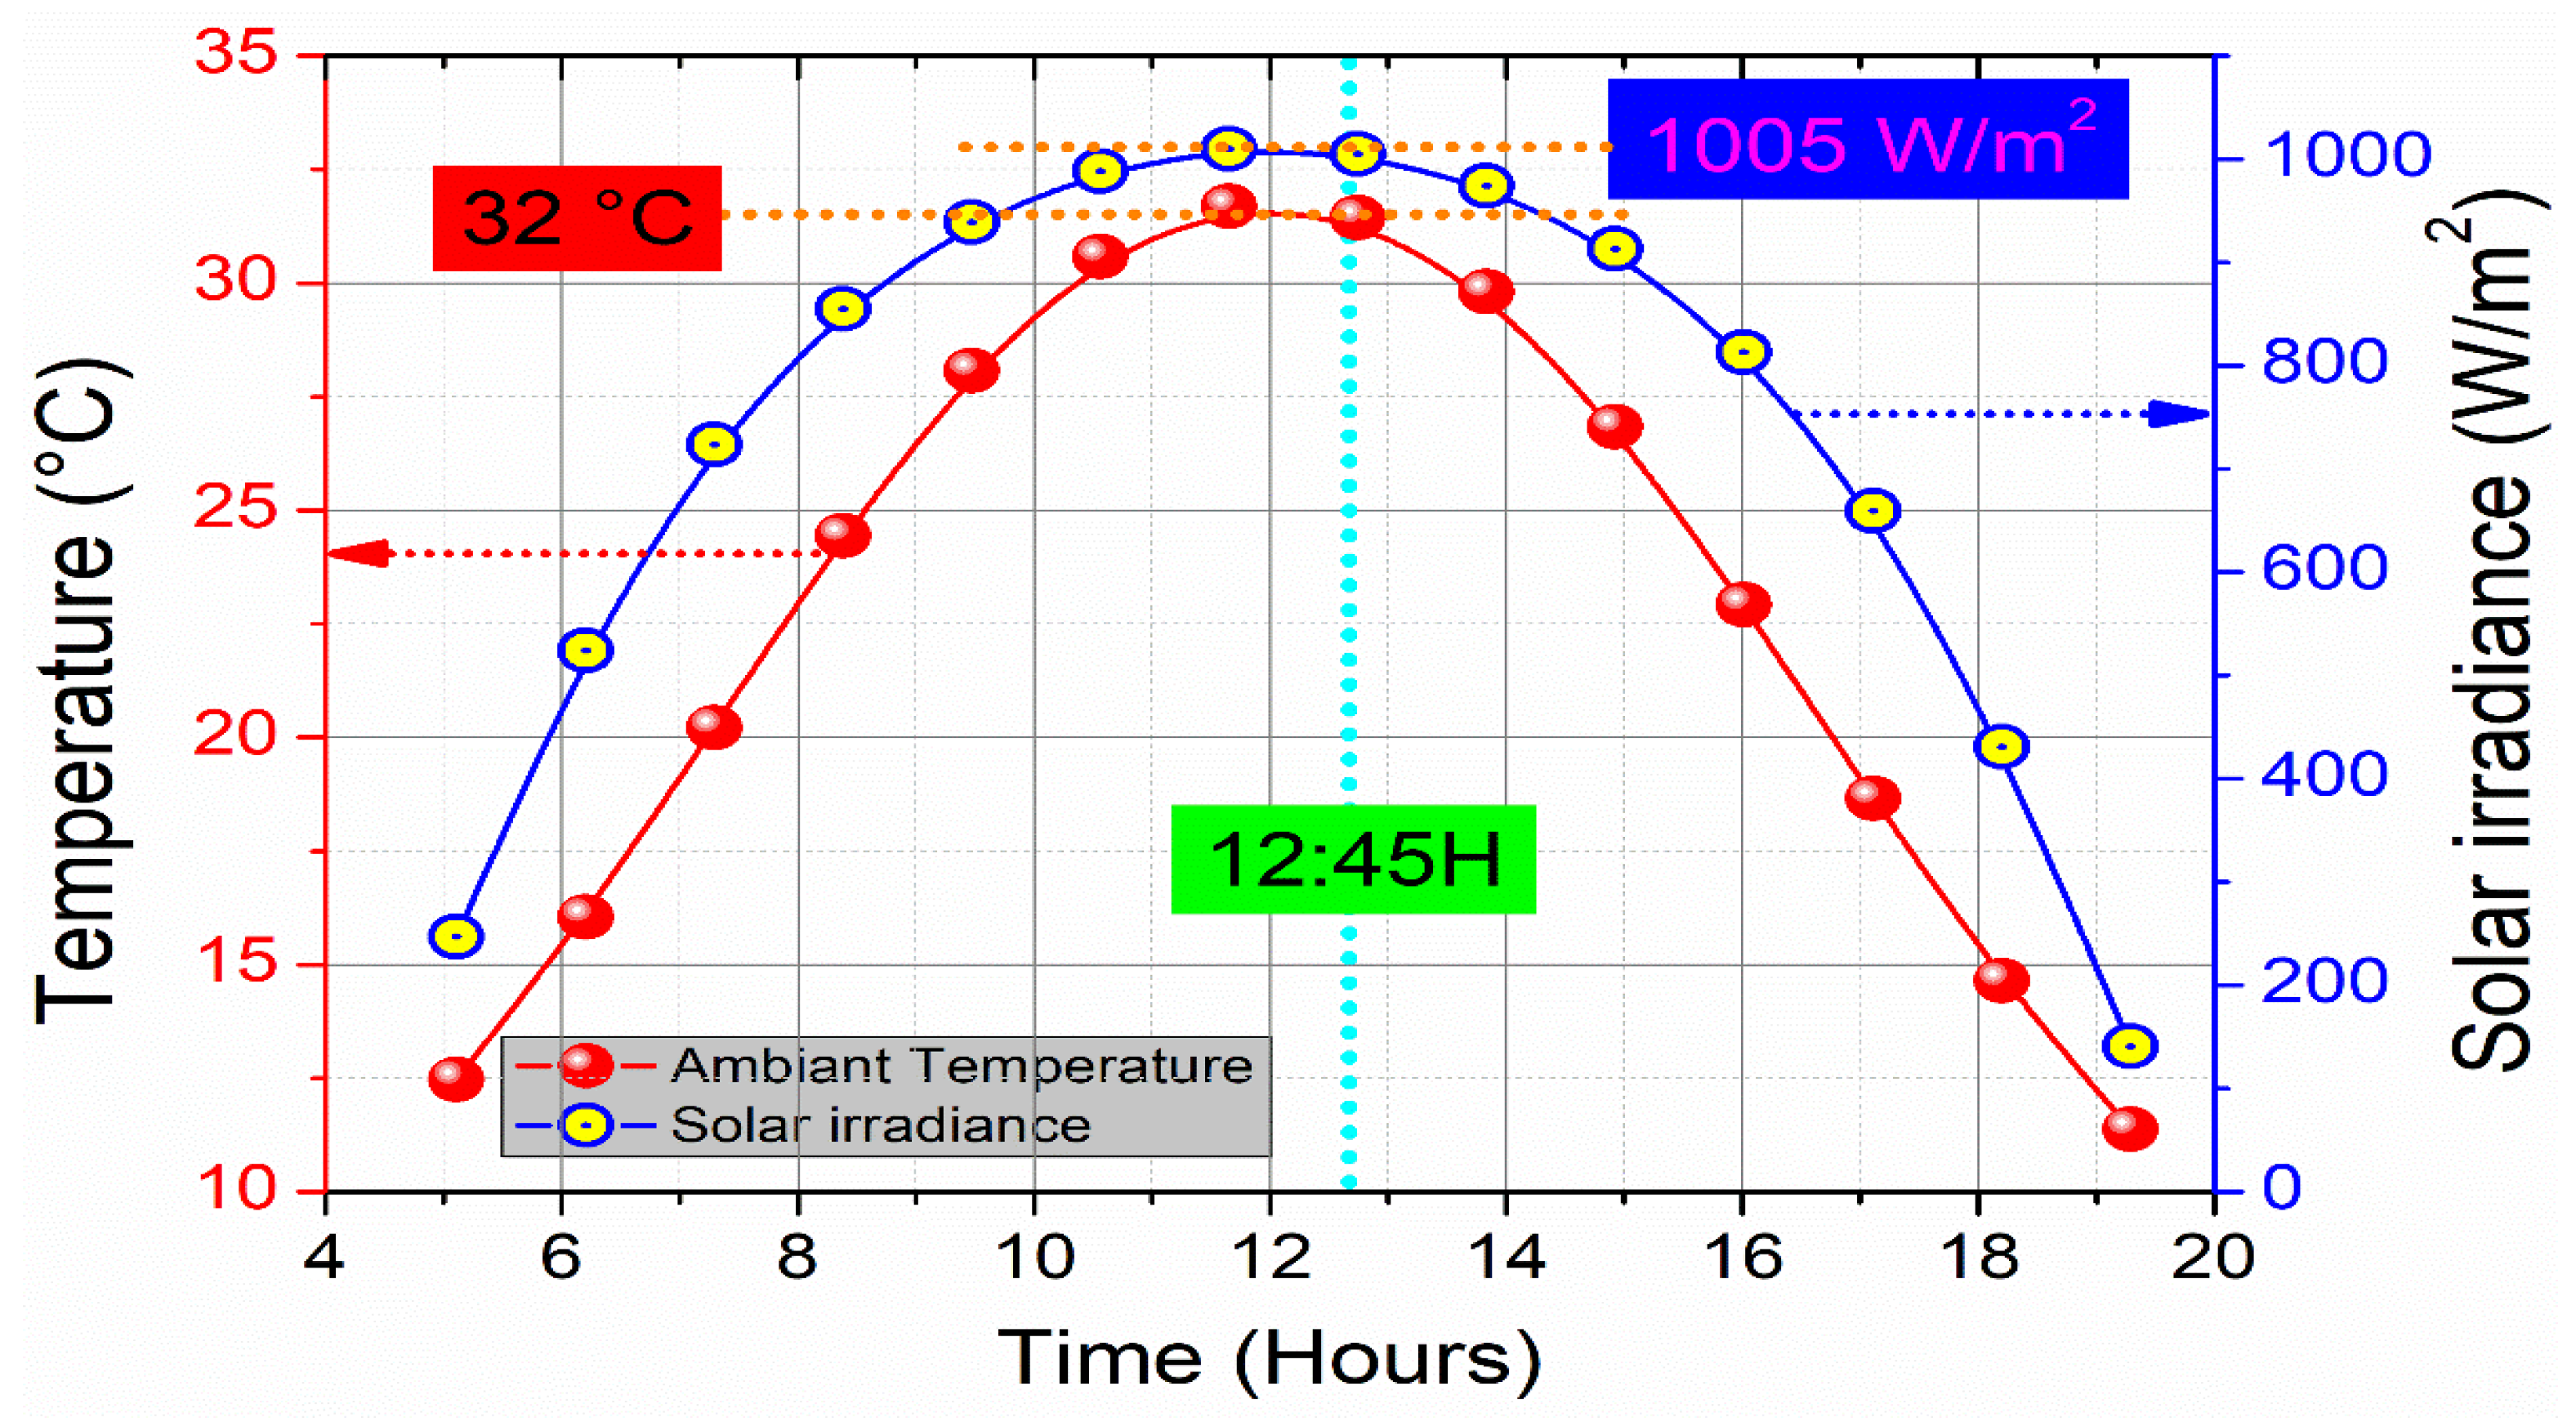
For a range of the day from 5 h to 19 h, the series of the solar irradiance and the temperature are represented in Figure 4.
Both the solar irradiance and temperature are found to increase until they plateau between 11:30 h and 13:00 h. After this, the temperature and solar radiation decrease. Moreover, the irradiance attains its maximum of 1010 W/m2 at around 12:00 h, which directly touches the temperature that attains its maximum of 31.7 °C at the same time. To improve the efficiency of the investigated PVT fluid duct channel, it is important to control the PV solar cells by reducing their temperature and enhancing their electrical efficiency by varying the cooling source that exists in the fluid channel zone.
This study concludes with a numerical analysis that examines the electrical and thermal outputs of the hybrid collector, along with its electrical and thermal efficiencies. It also includes a comparison with the recent literature on other cooling techniques, the type of fluid used, and their impact on the performance of hybrid PVT systems. The use of the bi-fluid is notable for its superior effectiveness in cooling and enhancing the overall thermal efficiency of the system. Table 2 presents the specific properties of the fluids used in the simulation.
The studied PVT collector uses glass as the top layer, polycrystalline solar cells to control power generation, and a Tedlar layer to ensure the protection of the film. The purpose of this study is to discuss the cell temperature effect of changing the fluid nature, the electrical and the thermal efficiencies. The investigated structure uses air, water, and ethylene glycol fluids to modify both the mass flow rate and temperature of the cells in the system under investigation.
The used internal cooling fluids would pass through the fluid duct channel with finned absorbers. Finally, the insulation layer serves to maintain the temperature of the fluid within the air duct. Figure 5 illustrates a study on the dynamics of the temperature of each layer in the PVT system as the type of cooling fluid is modified (air (a), water (b), and ethylene glycol (c)).
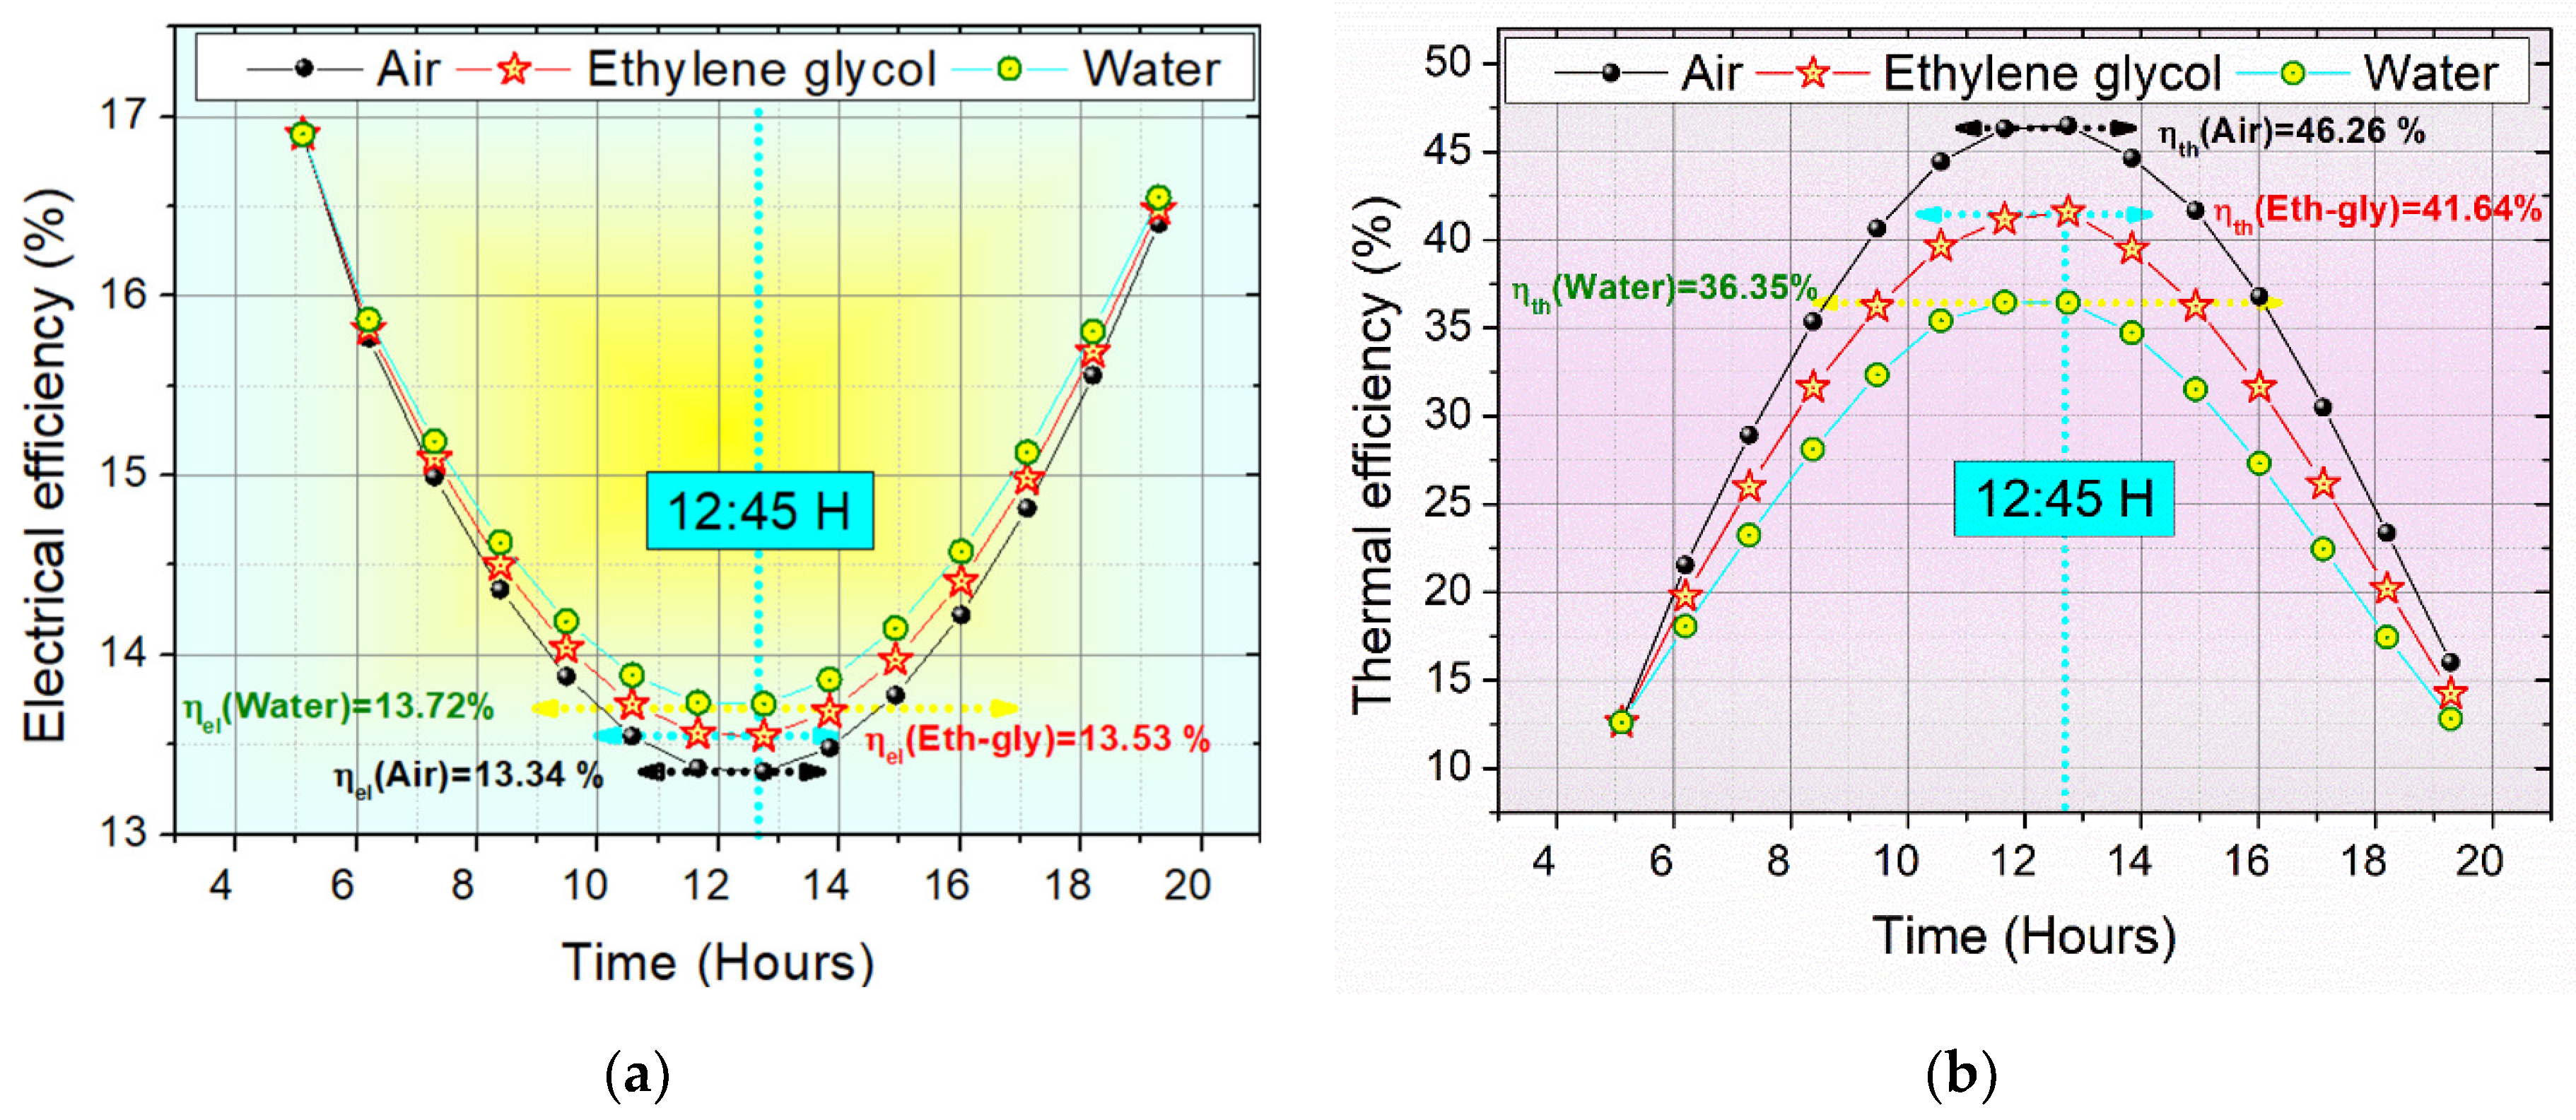
All the curves exhibit the same dynamics. Accordingly, the temperature reaches a maximum at around 12:45 h. For all the employed cooling fluids, the maximum temperature value is attained for the PV cells. For each layer, a maximum temperature value of 61.81 °C is observed when air is used as a cooling fluid. In addition, the results indicate that the minimum temperature value of 56.57 °C can be obtained in this layer when the water fluid is used. In this case, the water fluid is a good candidate for the cooling process of the PV cell layer and for enhancing its electrical efficiency. In the fluid layer, a maximum value of temperature (46 °C) is attained when air is used as a cooling fluid. The second value is reported for the case of the ethylene glycol 41.12 °C. In this case, air is an effective fluid for enhancing the thermal efficacy of the system. Compared with air fluid, ethylene glycol can be considered among the most effective cooling fluids. Therefore, when this fluid passes through the absorbent fins, the entire layer of the system will be cooled. As a result, there is a reduction in the temperature of the interior layers of the hybrid PVT collector. Thus, our system necessarily has opposing properties (electrical and thermal efficiency), and it is difficult to increase its electrical efficiency without reducing its thermal efficiency, and vice versa. Figure 6 presents the electrical and thermal efficiency of the hybrid PVT collector for different fluid cooling (water, eth-glycol, and air).
To confirm the hypotheses, a series of both electrical and thermal efficiencies for the three different fluids was considered. Figure 6 shows the series of the electrical (a) and thermal (b) efficiency for three mean types of cooling fluids. From Figure 6a, the curves reveal an optimum value at 12:45 h. In addition, the maximum value of the electrical efficiency is observed for water cooling fluid (ηel(water) = 13.72% > ηel(eth-gly) = 13.53% > ηel(Air) = 13.34%). From Figure 6b, the thermal efficiency reaches its maximum value at 12:45 h, when air is used as cooling fluid (ηth(air) = 46.26% > ηth(eth-gly) = 41.64% > ηth(water) = 36.35%). Consequently, Figure 7 presents the series of the overall efficiency of the system.
Figure 7 displays the time-domain series of the overall efficiency for three different fluid types. An extreme overall efficiency value ηoverall(Air) = 60% is reported for the air fluid. This makes such fluid an effective candidate for improving the power characteristics of PVT systems.
To gain more information about the influence of the cooling fluid nature on the energy generation performance of the studied system, the series of the electrical and thermal power are plotted in Figure 8a,b.
From Figure 8a, the maximum electrical power is observed at 12:45 h and varies between Pel(air) = 245 W and Pel(water) = 251 W. In this case, the nature of the cooling fluid weakly affects the electrical power of the system. Nevertheless, this factor has strongly modified the thermal power of the PVT collector system. Accordingly, from Figure 8b, the thermal power increases from Pth(water) = 602 W for the water to reach its maximum of Pth(air) = 767 W for the air-cooling fluid. From these results, we can conclude that air is the best fluid to enhance the overall efficiency and power performance of the investigated PVT collector compared with the two other fluids used.
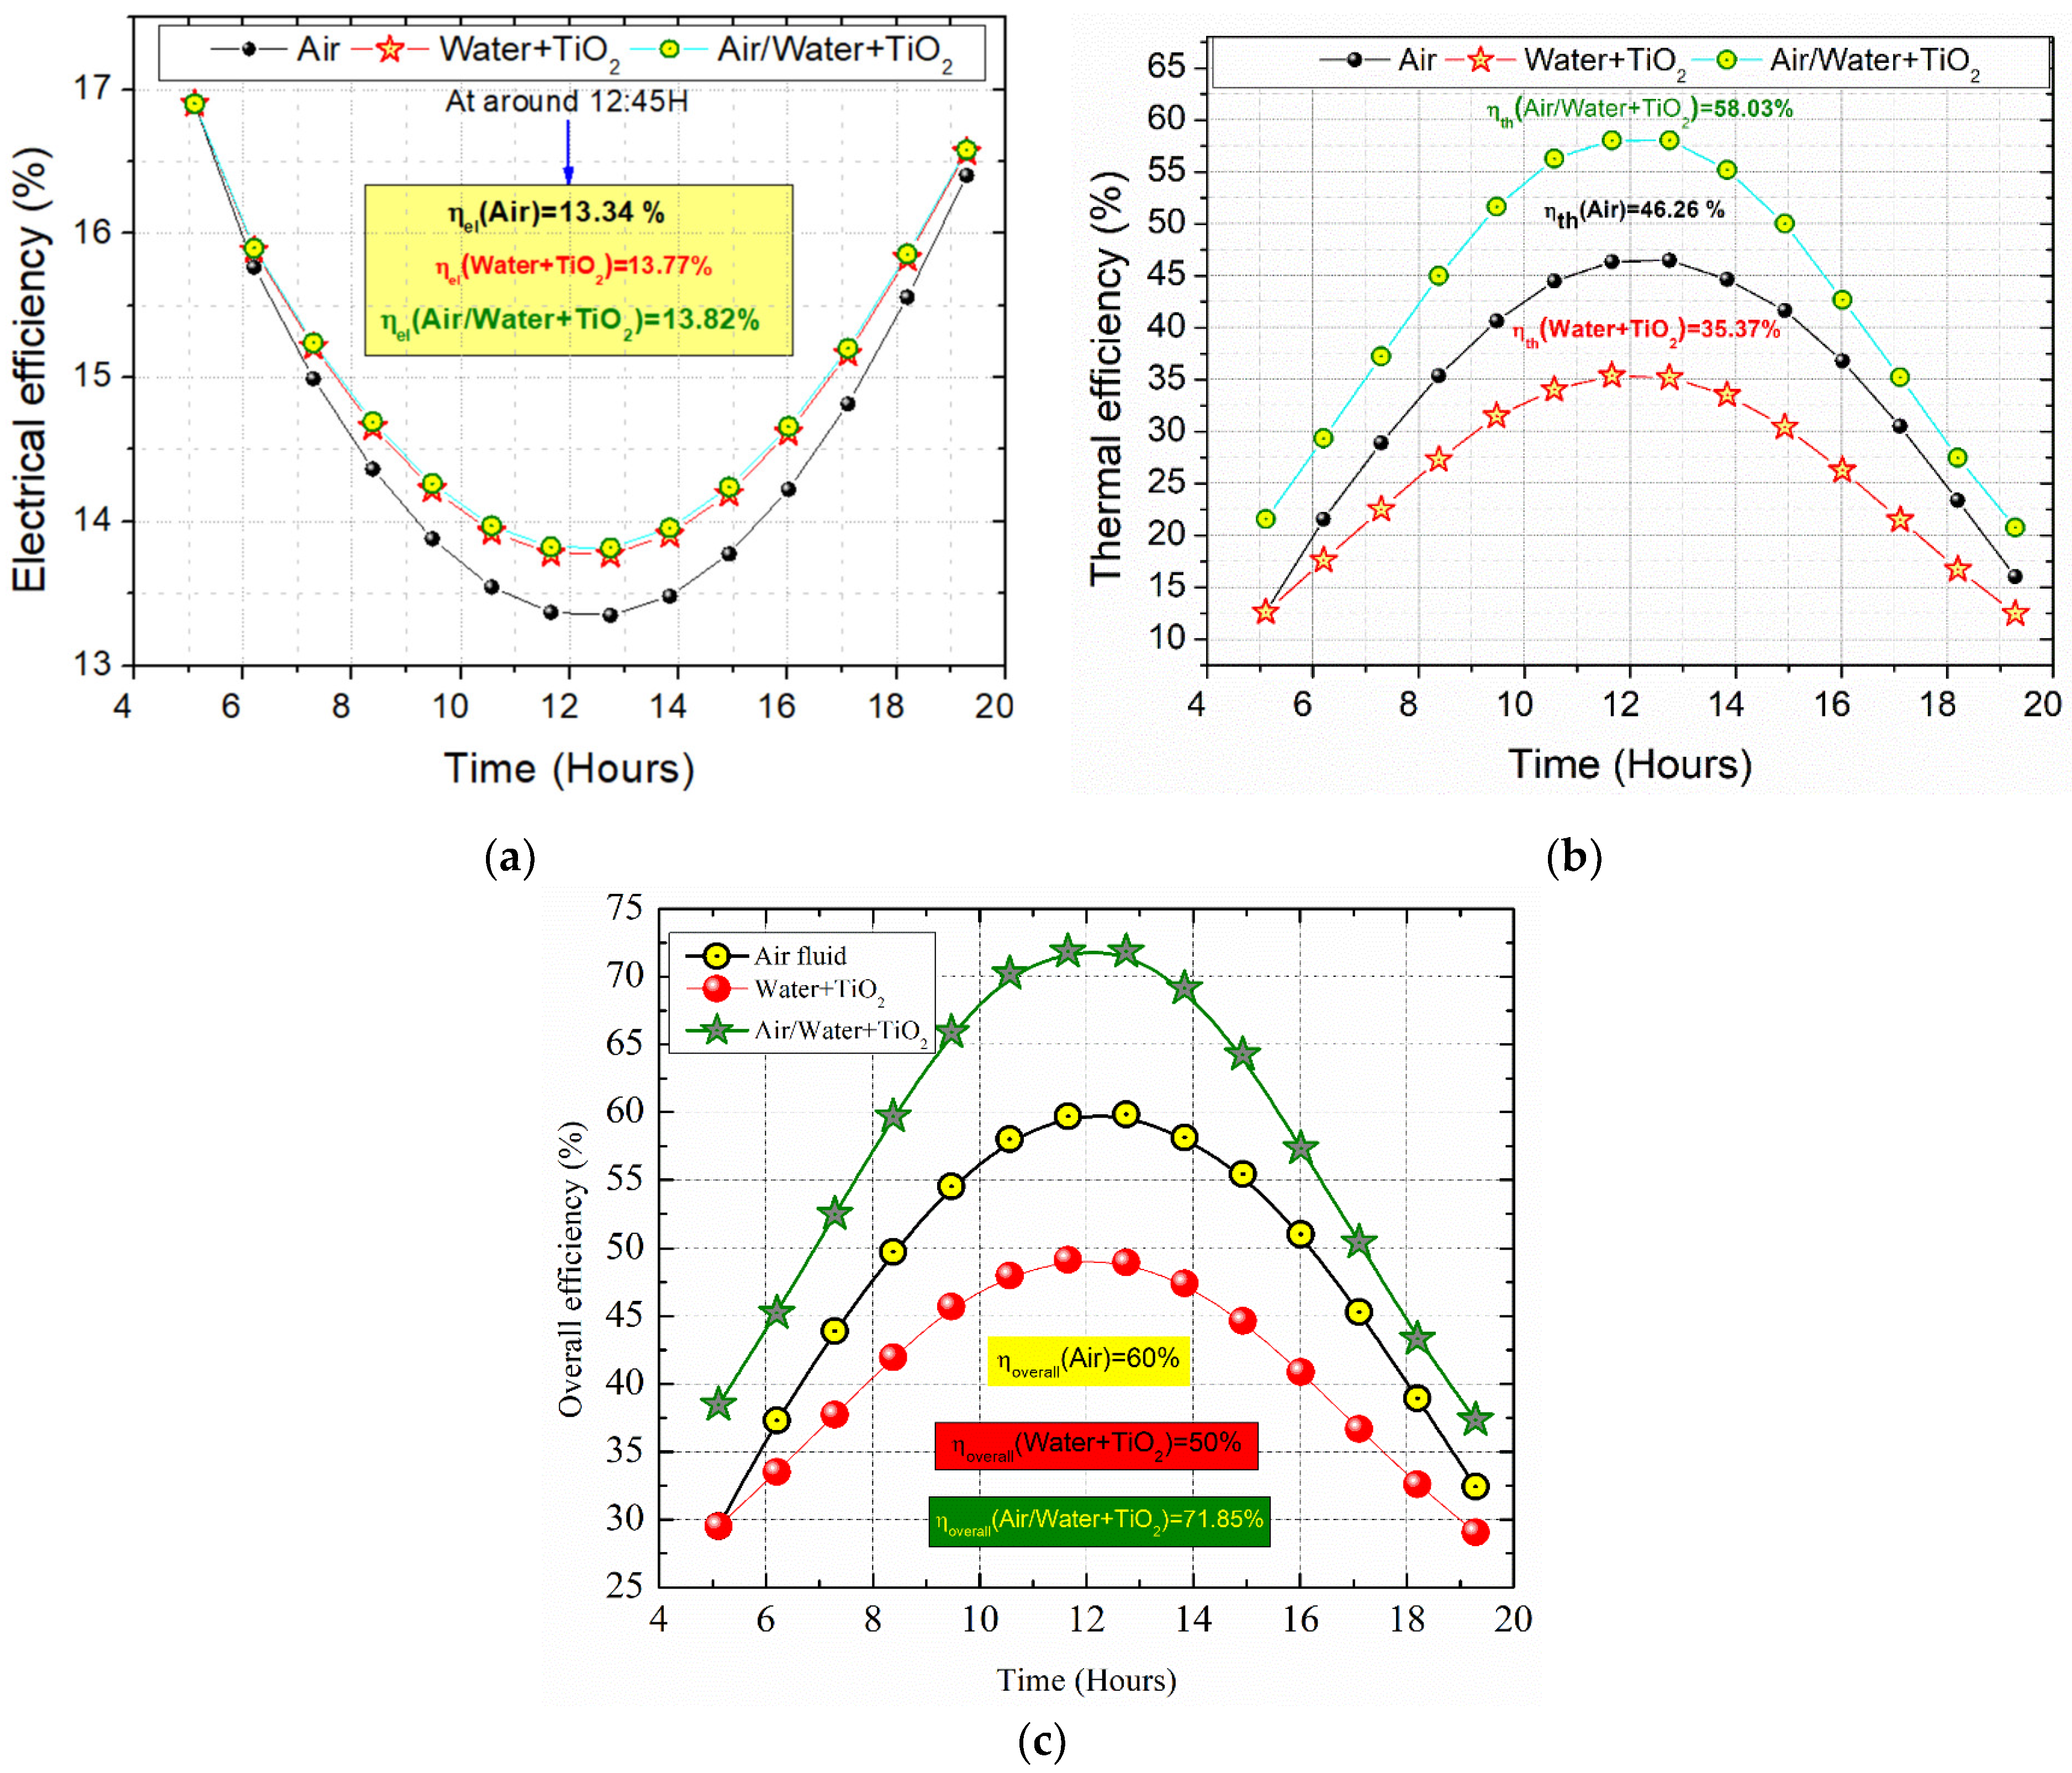
After these preliminary results, we propose to combine the air fluid with the water+TiO2 nano-fluid as a cooling source, based on [45]. Earlier research has investigated cooling and heating techniques such as liquid or nano-fluid cooling, beam splitting, optical devices, and thermal energy storage [45]. This PVT system design represents a unique approach to improving its performance. A PVT collector with a solar tracking system and a water nano-fluid filter can combine heat and electricity. Other kinds of fluids like Fe3O4 [26], Zn-H2O [46], CoSO4 [47], and Al2O3 [48] are equally employed to improve the efficiency of the PVT systems. Figure 9 illustrates the evolution of electrical (a), thermal (b), and overall (c) efficiencies for fluids (air, water+TiO2, and air/water+TiO2), respectively.
In this case, the electrical, thermal, and overall efficiency of air, water+TiO2, and air/water+TiO2 fluids are illustrated in Figure 9a–c. On the one hand, we found that air/water+TiO2 nano bi-fluid exhibits the most elevated electrical, thermal, and overall efficiency values. Accordingly, the overall efficiency attains a value of approximately ηoverall = 72%, which is very high compared with the results obtained when a single cooling fluid like water (ηoverall = 50%) is used. These results are in good agreement with the literature. Accordingly, the authors of [48] determined both the electrical and thermal characteristics of an Al2O3 nano-fluid-based PVT collector and found that the PVT using nano-fluid had 15.14% higher efficiency than a PVT collector system using only water fluid.
For the studied system, the enhanced thermal efficiency can be attributed to the improved thermal conductivity of the used nano bi-fluid. The latter exhibits thermo-physical properties that increase their convective heat transfer characteristics. Mainly, the thermal conductivity of nano-fluids can be modified via various parameters like the fluid type, nanoparticle shape, nanoparticle size, nanoparticle concentration, and temperature. Table 3 reveals the daily electrical efficiency, thermal efficiency, and overall efficiency of the proposed cooling fluids (air, water, Ethylene Glycol, Water+TiO2, and Air/Water+TiO2).
As compared with the recently reported investigation by [42], we find that the PVT collector geometry and the fluid nature mainly impact the daily efficiency of the PV system. Accordingly, these results show that the usefulness of air duct channel fluid as a cooling source gives an overall efficiency of about 48.12%, which is greatly improved as compared with the proposed investigation [42] (ηoverall < 14.05). In this case, the enhancement of the overall efficiency can be attributed to the increase in the number of fins in the duct channel and the design geometry modification. Another factor directly affects the efficiency of thermal PVT systems. For the studied system, the presence of 20 fins and duct channels in the PVT collector system has significantly improved the efficiency. Mainly, the existence of fins makes the surface area accessible for the heat transfer process. By covering the primary surface, the fins allow better heat dissipation from the PV cells to the nearby medium (typically air or water). This helps reduce the temperature of the PV cells, thereby saving energy, since the PV cells work better at lower temperatures. A comparative study is reported in Table 4.
Table 4 provides a comparison between the proposed cooling technique and other available methods. Some systems achieve higher overall efficiencies than the present research, which has an efficiency of 71.85%.
Current cooling techniques offer advantages in terms of compactness and ease of fabrication in this regard, as discussed in [57]. However, some of these systems are complex and incorporate cooling of both upper and lower surfaces, like the approach discussed in [57]. Based on the reported results in Table 4, it appears that the type of fluid and the cooling technique used for the cooling process affects mainly the electrical, thermal, and overall efficiency. Accordingly, for the water fluid type with different cooling techniques, we found variations of the overall efficiency from 68.1 to 59, when the cooling technique is changed from jet cooling in a compact module to serpentine with an absorber plate. For a PVT system with a water duct channel and the corrugated channel cooling technique, the overall efficiency does not exceed 21% [55]. Equally, we found from the same table that the nature of the fluid modifies all efficiencies. Accordingly, for PVT systems with an air duct channel cooling collector, we find that the overall efficiency attains a value of about 62% [50]. From reference [52], we find that using nanofluid duct channels improves mainly the thermal and overall efficiency, which attain 78% and 95%, respectively. This result is in good agreement with our investigation, which shows an increase in the thermal and overall efficiency (ηoverall = 71.85%) by using an air/water+TiO2 nanofluid. This result is more motivating than the various results from the literature [54,56,58,59,60]. In addition, compared with our results, the electrical, thermal, and overall efficiency can also be modified by changing the cooling method and solar concentration technique. Accordingly, it is found in reference [27] that using linear Fresnel lenses (FL) in a concentrated PVT system reduces the electrical efficiency of PV cells from 10.9% to 7.63%. However, it increases the thermal efficiency from 46.6% for a natural thermal system to 53% for a concentrated PVT system. Moreover, the efficiency of each PVT system is strongly affected by the cooling method. Reference [26] shows that passive cooling improves thermal efficiency by 18.05% and electrical efficiency by 0.34%, while active cooling provides greater enhancements, increasing ηth by 33.15% and ηel by 0.73%. Reference [29] studied a standalone thermal system and a concentrator PVT system with a dual-phase concentrator and copper plates and found that the standalone thermal system achieves a net efficiency of 47.61%, whereas the concentrated PVT system with dual-phase concentration reaches 53.7%. The results in reference [46] show that the use of an active cooling system with a heat exchanger and zinc-water (Zn-H2O) nanofluids improves both thermal efficiency by 60% and electrical efficiency by 6.5%. Reference [61] investigates a concentrator PVT system using a Fresnel lens (FL) and Cu9S5 nanofluid placed over a PV panel. The system achieves an electrical efficiency of 12.6%, a thermal efficiency of 19.4%, and an overall efficiency of 34.2%. Reference [62] demonstrates the performance of a concentrator PVT system with an electrical efficiency of 6.03%, a thermal efficiency of 40.74%, and a total efficiency of 46.77%. Reference [48] examines a concentrator PVT system utilizing a reflective Fresnel lens with a combination of C-14 n-alkane, industrial white oil, and CoSO4 nanofluid. The system reports electrical, thermal, and total efficiencies of 9.1%, 40.75%, and 49.88%, respectively. Reference [49] focuses on a fluid-based PVT collector using Al2O3 nanofluid. The study finds that the use of nanofluid increases the thermal efficiency by 15.14% compared to a system using only water.
References [48,49,61] explore the use of nanofluids in concentrator PVT systems. The system in [49] shows a significant improvement in thermal efficiency with Al2O3 nanofluid, while [61] reports a balanced enhancement in both electrical and thermal efficiencies with Cu9S5 nanofluid. Overall, these studies highlight the importance of selecting appropriate cooling methods, nanofluids, and concentration techniques to improve the performance of PVT systems. Active cooling, particularly with nanofluids, consistently provides significant gains in thermal and electrical efficiency, while the choice of concentrators and fluids plays a critical role in optimizing the system’s performance.
Compared with other works in which the used fluid duct channel does not contain nanofluids, we find that the efficiency of our proposed system is strongly improved. This improvement can be related to changes in the heat transfer mechanisms, which strongly enhance the efficiency and power of the PVT system when such a mechanism is associated with the usefulness of the nano-fluid in the duct channel of the PVT system [63]. Typically, when nano-fluids are used in such PVT systems, the enhancement in heat transfer is attributed to several factors, such as the increased thermal conductivity, Brownian motion of nanoparticles, surface area increase, and an improved convection process. Accordingly, nano-fluids, which consist of nanoparticles dispersed in a base fluid (like water), generally reveal a higher thermal conductivity than the base fluid alone. The increased thermal conductivity enables more efficient heat transfer from the photovoltaic cells to the fluid. In addition, the presence of nanoparticles can improve the convective heat transfer coefficient, resulting in more effective heat removal from the studied PVT system. Due to the random motion of nanoparticles, the latter can disrupt the thermal boundary layer at the fluid–solid interface, further improving the heat transfer in the PVT system. Likewise, since nanoparticles provide a larger surface area for heat exchange, such condition contributes mainly to the improvement of the overall heat transfer rate. When nano-fluids are employed in PVT systems, all the mentioned mechanisms collectively contribute to the improvement of the efficiency of the studied PVT system.

5. Conclusions

Currently, bi-fluid PVT systems provide efficient ways to generate electricity and heating in residential buildings. Therefore, the present study aims to comprehensively study the thermal performance of a bi-fluid PVT, expanding and embedding the system through ribbed cooling channel structures air/water+TiO2 nano-double fluid with 20 fin absorbers. Thermal examinations are performed via computational Runge–Kutta simulation over a modeling tool by means of MATLAB R2022b software. The PVT collector is cooled from the back of the PVT module by flowing air, water, ethylene glycol, and water+TiO2 nano-fluids via a duct channel that contains 20 equidistant fins with a thickness of 2 cm. Air flows through channels that contain aluminum fins welded to absorber plates and adjacent to ducts. The effects of the fluid cooling nature, bi-fluid air/water+TiO2 association, and natural airflow on both efficiencies are studied in detail.
The developed PVT configuration with front white glass (with 4 mm of thickness), 60 polycrystalline cells (with 1649 mm of height, 1000 mm of width, and 0.35 mm of thickness), Tedlar (with 5 mm of thickness), and 20 parallel longitudinal fins (with 2 cm of thickness) outperformed the studied configuration in terms of maximum daily system efficiency and power. For the studied PVT system, the obtained electrical, thermal, and overall efficiency are, respectively, ηel = 13.82%, ηth = 58.03%, and ηoverall = 71.85%, showing that the proposed nano bi-fluid duct channel (Air/Water+TiO2) is adequate for improving the PVT collector’s performance.
As a conclusion, the present research work provides valuable insights into the power and efficiency (electrical, thermal, and overall) of numerous PVT systems, highlighting the advantages of employing a nano-fluid-based working duct channel for the cooling mechanism, the effectiveness of the PVT design, and the promising developments in nano-fluid applications. The findings suggest that continued research in the renewable energy field could lead to additional progress and developments in PVT system efficiency and power.
The investigation on improving PVT solar collectors with nano-fluids offers important practical implications and economic benefits for real-world industrial applications. By enhancing the efficiency, power, and lifespan of a PVT system, industries can achieve energy independence and substantial cost savings. The potential applications of bi-fluid PVT systems are vast, from industrial cooling and heating to integration with smart grids and remote energy solutions. The present research paves the way for more maintainable and economically viable industrial energy solutions, contributing to broadening the areas of renewable energy adoption and energy efficiency.

Author Contributions

Conceptualization, H.N., J.R. and H.O.; Methodology, H.N., J.R., H.O. and S.V.; Software, H.N. and J.R.; Validation, H.O., H.T. and S.V.; Formal analysis, S.V. and H.T.; Investigation, J.R., H.N. and H.O.; Writing—original draft, H.N.; Writing—review and editing, S.V.; Visualization, H.N. and H.O.; Supervision, H.T. and S.V. All authors have read and agreed to the published version of the manuscript.

Funding

This research was supported by the Renewable Energy Laboratory (RELAB) of the Polytechnic University of Bari, the Laboratory of Energy Applications and Renewable Energy Efficiency (LAPER), the University of Tunis El Manar, Tunisia, and the Thermal Processes Laboratory Research and Technology Center of Energy (CRTEn) in BP.95 Hammam-Lif 2050, Tunisia.

Data Availability Statement

Data are unavailable due to privacy concerns. They can be requested for personal use.

Acknowledgments

This research received support from the Thermal Process Laboratory Research and Technology Center of Energy Borj Cedria (CRTEn), which provided access to experimental databases. Additionally, the Laboratory of Energy Applications and Renewable Energy Efficiency (LAPER) and the Renewable Energy Laboratory (RELab), overseen by the University of Tunis El Manar (Tunisia) and the Polytechnic University of Bari (Italy), contributed to the supervision of this work.

Conflicts of Interest

The authors declare no conflicts of interest.

Abbreviations

The following abbreviations are used in this manuscript:
Asurface area of the hybrid collectorm2
Cspecific heatJ·Kg−1·K−1
Fpacking factordimensionless
Gsolar radiationW·m−2
hheat transfer coefficientW·m−2·K−1
MmassKg
TtemperatureK
ttimes
mmass flow rateKg·s−1
Vspeedm·s−1
NuNusselt numberdimensionless
PrPrandtl numberdimensionless
ReReynold numberdimensionless
Greek symbols
αabsorption coefficientdimensionless
βsolar cell temperature coefficientK−1
σdensityKg·m−3
τtransmittancedimensionless
η efficiencydimensionless
εemissivitydimensionless
λ thicknessm
σ Stefan–Boltzmann constantW·m−2·K−4
e heat thermal conductivityW·m−1·K−1
Subscripts
aambient
abfin absorbers
csolar cell
cdconduction
cvconvection
elelectrical
ftransfer fluid
gglass cover
grground
raradiative
ththermal

References

  1. Mittal, A.; Brajpuriya, R.; Gupta, R. Solar steam generation using hybrid nanomaterials to address global environmental pollution and water shortage crisis. Mater. Today Sustain. 2023, 21, 100319. [Google Scholar] [CrossRef]
  2. Wu, G.; Fang, H.; Zhang, Y.; Li, K.; Xu, D. Photothermal and Photovoltaic Utilization for Improving the Thermal Environment of Chinese Solar Greenhouses: A Review. Energies 2023, 16, 6816. [Google Scholar] [CrossRef]
  3. Khodadadi, M.; Sheikholeslami, M. Review on poly-generation application of photovoltaic/thermal systems. Sustain. Energy Technol. Assess. 2022, 52, 102172. [Google Scholar] [CrossRef]
  4. Kang, A.; Korolija, I.; Rovas, D. Photovoltaic Thermal District Heating: A review of the current status, opportunities and prospects. Appl. Therm. Eng. 2022, 217, 119051. [Google Scholar] [CrossRef]
  5. Bandaru, S.H.; Becerra, V.; Khanna, S.; Radulovic, J.; Hutchinson, D.; Khusainov, R. A review of photovoltaic thermal (PVT) technology for residential applications: Performance indicators, progress, and opportunities. Energies 2021, 14, 3853. [Google Scholar] [CrossRef]
  6. Chala, G.T.; Al Alshaikh, S.M. Solar photovoltaic energy as a promising enhanced share of clean energy sources in the future a comprehensive review. Energies 2023, 16, 7919. [Google Scholar] [CrossRef]
  7. Shao, N.; Ma, L.; Zhang, J. Experimental study on electrical and thermal performance and heat transfer characteristic of PV/T roof in summer. Appl. Therm. Eng. 2019, 162, 114276. [Google Scholar] [CrossRef]
  8. Tuncer, A.D.; Khanlari, A.; Afshari, F.; Sözen, A.; Çiftçi, E.; Kusun, B.; Şahinkesen, İ. Experimental and numerical analysis of a grooved hybrid photovoltaic-thermal solar drying system. Appl. Therm. Eng. 2023, 218, 119288. [Google Scholar] [CrossRef]
  9. Aghakhani, S.; Afrand, M. Experimental study of the effect of simultaneous application of the air-and water-cooled flow on efficiency in a Photovoltaic thermal solar collector with porous plates. Appl. Therm. Eng. 2022, 217, 119161. [Google Scholar] [CrossRef]
  10. Shahsavar, A.; Arıcı, M. Multi-objective energy and exergy optimization of hybrid building-integrated heat pipe photovoltaic/thermal and earth air heat exchanger system using soft computing technique. Eng. Anal. Bound. Elem. 2023, 148, 293–304. [Google Scholar] [CrossRef]
  11. Yao, W.; Kong, X.; Han, X.; Wang, Y.; Cao, J.; Gao, W. Research on the efficiency evaluation of heat pipe PV/T systems and its applicability in different regions of China. Energy Convers. Manag. 2022, 269, 116136. [Google Scholar] [CrossRef]
  12. Wu, L.; Zhao, B.; Ao, X.; Yang, H.; Ren, X.; Yu, Q.; Pei, G. Performance analysis of the aerogel-based PV/T collector: A numerical study. Sol. Energy 2021, 228, 339–348. [Google Scholar] [CrossRef]
  13. Yuan, W.; Ji, J.; Li, Z.; Zhou, F.; Ren, X.; Zhao, X.; Liu, S. Comparison study of the performance of two kinds of photovoltaic/thermal (PV/T) systems and a PV module at high ambient temperature. Energy 2018, 148, 1153–1161. [Google Scholar] [CrossRef]
  14. Kumar, S.; Thakur, R.; Singhy, A.; Tripathi, R.K.; Sethi, M. A review of heat removal mechanism in concentrated PVT systems using beam splitter. Mater. Today Proc. 2022, 50, 952–961. [Google Scholar] [CrossRef]
  15. Hamzat, A.K.; Sahin, A.Z.; Omisanya, M.I.; Alhems, L.M. Advances in PV and PVT cooling technologies: A review. Sustain. Energy Technol. Assess. 2021, 47, 101360. [Google Scholar] [CrossRef]
  16. Pomianowski, M.Z.; Johra, H.; Marszal, P.A.; Zhang, C. Sustainable and energy-efficient domestic hot water systems: A review. Renew. Sustain. Energy Rev. 2020, 128, 109900. [Google Scholar] [CrossRef]
  17. Bassam, A.M.; Sopian, K.; Ibrahim, A.; Al-Aasam, A.B.; Dayer, M. Experimental analysis of photovoltaic thermal collector (PVT) with nano PCM and micro-fins tube counterclockwise twisted tape nanofluid. Case Stud. Therm. Eng. 2023, 45, 102883. [Google Scholar] [CrossRef]
  18. Miglioli, A.; Aste, N.; Del Pero, C.; Leonforte, F. Photovoltaic-thermal solar-assisted heat pump systems for building applications: Integration and design methods. Energy Built Environ. 2023, 4, 39–56. [Google Scholar] [CrossRef]
  19. Yu, Q.; Chan, S.; Chen, K.; Zhao, B.; Ren, X.; Pei, G. Numerical and experimental study of a novel vacuum Photovoltaic/thermal (PV/T) collector for efficient solar energy harvesting. Appl. Therm. Eng. 2024, 236, 121580. [Google Scholar] [CrossRef]
  20. TPV Solar. Available online: https://www.tvpsolar.com/attach/MT-Power%20Datasheet%20(v4%20SK).pdf (accessed on 27 June 2024).
  21. Herrando, M.; Pantaleo, A.M.; Wang, K.; Markides, C.N. Solar combined cooling, heating and power systems based on hybrid PVT, PV or solar-thermal collectors for building applications. Renew. Energy 2019, 143, 637–647. [Google Scholar] [CrossRef]
  22. Calise, F.; d’Accadia, M.D.; Vanoli, L. Design and dynamic simulation of a novel solar trigeneration system based on hybrid photovoltaic/thermal collectors (PVT). Energy Convers. Manag. 2012, 60, 214–225. [Google Scholar] [CrossRef]
  23. Calise, F.; d’Accadia, M.D.; Piacentino, A. A novel solar trigeneration system integrating PVT (photovoltaic/thermal collectors) and SW (seawater) desalination: Dynamic simulation and economic assessment. Energy 2014, 67, 129–148. [Google Scholar] [CrossRef]
  24. Gao, D.; Gao, G.; Cao, J.; Zhong, S.; Ren, X.; Dabwan, Y.N.; Pei, G. Experimental and numerical analysis of an efficiently optimized evacuated flat plate solar collector under medium temperature. Appl. Energy 2020, 269, 115129. [Google Scholar] [CrossRef]
  25. Oyieke, A.Y.; Inambao, F.L. Performance Characterisation of a Hybrid Flat-Plate Vacuum Insulated Photovoltaic/Thermal Solar Power Module in Subtropical Climate. Int. J. Photoenergy 2016, 1, 6145127. [Google Scholar] [CrossRef]
  26. Banakar, A.; Motevali, A.; Emad, M.; Ghobadian, B. Co-generation of heat and power in a thermoelectric system equipped with Fresnel lens collectors using active and passive cooling techniques. Renew. Energy 2017, 112, 268–279. [Google Scholar] [CrossRef]
  27. Karimi, F.; Xu, H.; Wang, Z.; Chen, J.; Yang, M. Experimental study of a concentrated PV/T system using linear Fresnel lens. Energy 2017, 123, 402–412. [Google Scholar] [CrossRef]
  28. Hussain, M.I.; Kim, J.T. Energy and economic potential of a concentrated photovoltaic/thermal (CPV/T) system for buildings in South Korea. J. Asian Archit. Build. Eng. 2019, 18, 139–144. [Google Scholar] [CrossRef]
  29. Singhy, A.; Thakur, R.; Kumar, R. Experimental analysis for co-generation of heat and power with convex lens as SOE and linear Fresnel Lens as POE using active water stream. Renew. Energy 2021, 163, 740–754. [Google Scholar] [CrossRef]
  30. Nasri, H.; Sahlaoui, K.; Oueslati, H.; Taghouti, H.; Mami, A. Experimental Comparative Study between PV Solar Collector and Hybrid PV/T Air Collector. In Proceedings of the 2022 IEEE International Conference on Electrical Sciences and Technologies in Maghreb (CISTEM), Tunis, Tunisia, 26–28 October 2022. [Google Scholar]
  31. Nasri, H.; Riahi, J.; Vergura, S.; Taghouti, H. Experimental Validation of the Electrical Performance for PVT Air Collector. In Proceedings of the 2023 International Conference on Electrical, Computer and Energy Technologies (ICECET), Cape Town, South Africa, 16–17 November 2023. [Google Scholar]
  32. Acciani, G.; Chiarantoni, E.; Fornarelli, G.; Vergura, S. A Feature Extraction Unsupervised Neural Network for Environmental Data Set. Neural Netw. 2003, 16, 427–436. [Google Scholar] [CrossRef]
  33. Puliafito, V.; Vergura, S.; Carpentieri, M. Fourier, Wavelet and Hilbert-Huang Transforms for Studying Electrical Users in the Time and Frequency Domain. Energies 2017, 10, 188. [Google Scholar] [CrossRef]
  34. Zivieri, R.; Vergura, S.; Carpentieri, M. Analytical and numerical solution to the nonlinear cubic Duffing equation: An application to electrical signal analysis of distribution lines. Appl. Math. Model. 2016, 40, 9152–9164. [Google Scholar] [CrossRef]
  35. Rejeb, O.; Dhaou, H.; Jemni, A. A numerical investigation of a photovoltaic thermal (PV/T) collector. Renew. Energy 2015, 77, 43–50. [Google Scholar] [CrossRef]
  36. Sahlaoui, K.; Oueslati, H.; Belkhiria, F.; Gammoudi, H.; Mabrouk, S.B. Design and modeling for the performance enhancement of solar photovoltaic/thermal (PV/T) collectors. Int. J. Air-Cond. Refrig. 2020, 28, 2050015. [Google Scholar] [CrossRef]
  37. Slimani, M.E.A.; Amirat, M.; Kurucz, I.; Bahria, S.; Hamidat, A.; Chaouch, W.B. A detailed thermal-electrical model of three photovoltaic/thermal (PV/T) hybrid air collectors and photovoltaic (PV) module: Comparative study under Algiers climatic conditions. Energy Convers. Manag. 2017, 133, 458–476. [Google Scholar] [CrossRef]
  38. Rejeb, O.; Sardarabadi, M.; Ménézo, C.; Passandideh-Fard, M.; Dhaou, M.H.; Jemni, A. Numerical and model validation of uncovered nanofluid sheet and tube type photovoltaic thermal solar system. Energy Convers. Manag. 2016, 110, 367–377. [Google Scholar] [CrossRef]
  39. Touafek, K.; Haddadi, M.; Malek, A. Design and modeling of a photovoltaic thermal collector for domestic air heating and electricity production. Energy Build. 2013, 59, 21–28. [Google Scholar] [CrossRef]
  40. Kazemian, A.; Hosseinzadeh, M.; Sardarabadi, M.; Passandideh-Fard, M. Experimental study of using both ethylene glycol and phase change material as coolant in photovoltaic thermal systems (PVT) from energy, exergy and entropy generation viewpoints. Energy 2018, 162, 210–223. [Google Scholar] [CrossRef]
  41. He, W.; Zhang, Y.; Ji, J. Comparative experiment study on photovoltaic and thermal solar system under natural circulation of water. Appl. Therm. Eng 2011, 31, 3369–3376. [Google Scholar] [CrossRef]
  42. Attia, M.E.H.; Zayed, M.E.; Kabeel, A.E.; Khelifa, A.; Irshad, K.; Rehman, S. Numerical analysis and design of a novel solar photovoltaic thermal system using finned cooling channel structures embedded with air/TiO2–water nano bi-fluid. Sol. Energy 2024, 269, 112368. [Google Scholar] [CrossRef]
  43. Zayed, M.E.; Zhao, J.; Du, Y.; Kabeel, A.E.; Shalaby, S.M. Factors affecting the thermal performance of the flat plate solar collector using nanofluids: A review. Sol. Energy 2019, 182, 382–396. [Google Scholar] [CrossRef]
  44. Le Ba, T.; Várady, Z.I.; Lukács, I.E.; Molnár, J.; Balczár, I.A.; Wongwises, S.; Szilágyi, I.M. Experimental investigation of rheological properties and thermal conductivity of SiO2–P25 TiO2 hybrid nanofluids. J. Therm. Anal. Calorim. 2021, 146, 493–507. Available online: https://link.springer.com/article/10.1007/s10973-020-10022-4 (accessed on 27 June 2024). [CrossRef]
  45. Kumar, S.; Thakur, R.; Lee, D.; Kumar, R. Impact of liquid spectrum filter and solar tracker on the overall effectiveness of a photovoltaic thermal system: An experimental investigation. Renew. Energy 2024, 226, 120390. [Google Scholar] [CrossRef]
  46. Hussein, H.A.; Numan, A.H.; Abdulrahman, R.A. Improving the hybrid photovoltaic/thermal system performance using water-cooling technique and Zn-H2O nanofluid. Int. J. Photoenergy 2017, 1, 6919054. [Google Scholar] [CrossRef]
  47. Han, X.; Sun, Y.; Huang, J.; Zheng, J. Design and analysis of a CPV/T solar receiver with volumetric absorption combined spectral splitter. Int. J. Energy Res. 2020, 44, 4837–4850. [Google Scholar] [CrossRef]
  48. Lee, J.H.; Hwang, S.G.; Lee, G.H. Efficiency improvement of a photovoltaic thermal (PVT) system using nanofluids. Energies 2019, 12, 3063. [Google Scholar] [CrossRef]
  49. Essa, M.A.; Rashad, A.M.; Hatata, A.Y. A novel FFNN-AHO hybrid predictive model for enhancing the performance of jet-cooled PVT system. Indones. J. Electr. Eng. Comput. Sci. 2024, 34, 711–725. [Google Scholar] [CrossRef]
  50. Choi, H.; Choi, K. Parametric study of a novel air-based photovoltaic-thermal collector with a transverse triangular-shaped block. Renew. Energy 2022, 201, 96–110. [Google Scholar] [CrossRef]
  51. Song, Z.; Xue, Y.; Jia, B.; He, Y. Introduction of the rectangular hole plate in favor the performance of photovoltaic thermal solar air heaters with baffles. Appl. Therm. Eng. 2023, 220, 119774. [Google Scholar] [CrossRef]
  52. Chiang, W.; Permana, I.; Wang, F.; Chen, H.; Erdenebayar, M. Experimental investigation for an innovative hybrid photovoltaic/Thermal (PV/T) solar system. Energy Rep. 2022, 8, 910–918. [Google Scholar] [CrossRef]
  53. Kalateh, M.R.; Kianifar, A.; Sardarabadi, M. Energy, exergy, and entropy generation analyses of a water-based photovoltaic thermal system, equipped with clockwise counter-clockwise twisted tapes: An indoor experimental study. Appl. Therm. Eng. 2022, 215, 118906. [Google Scholar] [CrossRef]
  54. Hassan, A.; Abbas, S.; Yousuf, S.; Abbas, F.; Amin, N.M.; Ali, S.; Mastoi, M.S. An experimental and numerical study on the impact of various parameters in improving the heat transfer performance characteristics of a water based photovoltaic thermal system. Renew. Energy 2023, 202, 499–512. [Google Scholar] [CrossRef]
  55. Shen, C.; Zhang, Y.; Zhang, C.; Pu, J.; Wei, S.; Dong, Y. A numerical investigation on optimization of PV/T systems with the field synergy theory. Appl. Therm. Eng. 2021, 185, 116381. [Google Scholar] [CrossRef]
  56. Pang, W.; Zhang, Y.; Duck, B.C.; Yu, H.; Song, X.; Yan, H. Cross sectional geometries effect on the energy efficiency of a photovoltaic thermal module: Numerical simulation and experimental validation. Energy 2020, 209, 118439. [Google Scholar] [CrossRef]
  57. Lebbi, M.; Touafek, K.; Benchatti, A.; Boutina, L.; Khelifa, A.; Baissi, M.T.; Hassani, S. Energy performance improvement of a new hybrid PV/T Bi-fluid system using active cooling and self-cleaning: Experimental study. Appl. Therm. Eng. 2021, 182, 116033. [Google Scholar] [CrossRef]
  58. Bevilacqua, P.; Bruno, R.; Arcuri, N. Comparing the performances of different cooling strategies to increase photovoltaic electric performance in different meteorological conditions. Energy 2020, 195, 116950. [Google Scholar] [CrossRef]
  59. Elminshawy, N.A.; Mohamed, A.M.I.; Morad, K.; Elhenawy, Y.; Alrobaian, A.A. Performance of PV panel coupled with geothermal air cooling system subjected to hot climatic. Appl. Therm. Eng. 2019, 148, 1–9. [Google Scholar] [CrossRef]
  60. Gomaa, M.R.; Hammad, W.; Al-Dhaifallah, M.; Rezk, H. Performance enhancement of grid-tied PV system through proposed design cooling techniques: An experimental study and comparative analysis. Sol. Energy 2020, 211, 1110–1127. [Google Scholar] [CrossRef]
  61. An, W.; Wu, J.; Zhu, T.; Zhu, Q. Experimental investigation of a concentrating PV/T collector with Cu9S5 nanofluid spectral splitting filter. Appl. Energy 2016, 184, 197–206. [Google Scholar] [CrossRef]
  62. Han, X.; Tu, L.; Sun, Y. A spectrally splitting concentrating PV/T system using combined absorption optical filter and linear Fresnel reflector concentrator. Sol. Energy 2021, 223, 168–181. [Google Scholar] [CrossRef]
  63. Okonkwo, E.C.; Wole-Osho, I.; Almanassra, I.W.; Abdullatif, Y.M.; Al-Ansari, T. An updated review of nanofluids in various heat transfer devices. J. Therm. Anal. Calorim. 2021, 145, 2817–2872. Available online: https://link.springer.com/article/10.1007/s10973-020-09760-2 (accessed on 31 August 2024). [CrossRef]
Figure 1. Schematic of PVT collector system.
Computation 12 00188 g001
Figure 2. Schematic representation of thermal resistances in the hybrid PVT collector.
Computation 12 00188 g002
Figure 3. Flowchart of the calculation steps.
Computation 12 00188 g003
Figure 4. Time-domain temperature and solar irradiance.
Computation 12 00188 g004
Figure 5. Time dependence of the layer’s temperatures (glass, PV cells, Tedlar, and insulation) for three different cooling fluid types (air (a), water (b), and ethylene glycol (c)).
Computation 12 00188 g005
Figure 6. Time-series of the electrical (a) and thermal (b) efficiency for the used cooling fluids.
Computation 12 00188 g006
Figure 7. Time-series of the overall efficiency for the three employed cooling fluids.
Computation 12 00188 g007
Figure 8. Time-series of the electrical (a) and thermal (b) power for the used cooling fluids.
Computation 12 00188 g008
Figure 9. Variation of the electrical (a), thermal (b), and overall (c) efficiencies versus the time for three different cooling fluids.
Computation 12 00188 g009
Table 1. The technical specifications of the PV module under STC.
DimensionsParametersValues
Rated Power (W)Pmpp280
Open Circuit Voltage (V)Voc38.7
Short Circuit Current (A)Isc8.98
Max Power Current (A)Impp8.52
Max Power Voltage (V)Vmpp32.8
Length (cm)a165
Width (cm)b98
Thickness (cm)d3.5
Table 2. Specifications of pure fluids.
PropertyAir
[42]
Water [43]Ethylene Glycol [44]TiO2 [42]Water+TiO2
[This Work]
Air/Water+TiO2
[This Work]
Specific heat, (J/kg·K)1005418323476922437.51719.75
Thermal conductivity, (W/m·K)1.40.60.25811.706.153.775
Density, (kg·m−3)1.165998.2111342302614.11.307
Dynamic viscosity, (Pa·s)1.78 × 10−51.01 × 10−320.91.83 × 10−31.4 × 10−37.08 × 10−4
Table 3. The daily efficiencies (electrical, thermal, and overall) of the proposed cooling fluids (air, water, Ethylene Glycol, Water+TiO2, and Air/Water+TiO2).
Fluid CoolingDaily Electrical Efficiency (%)Daily Thermal Efficiency (%)Daily Overall Efficiency (%)References
Water14.8726.3641.23This paper
Ethylene Glycol14.7529.7544.50This paper
Air (20 fins)14.6033.5248.12This paper
Air
(Non-finned)
--9.23–10.84[42]
Air
(8 fins)
--13.38–14.05[42]
Water+TiO214.9025.5040.40This paper
Water+TiO2
(Non-finned)
--28.38–39.62[42]
TiO2+Water
(8 fins)
--30.27–42.26[42]
Air/Water+TiO2
(20 fins)
14.9342.0356.96This paper
Table 4. Comparison between the performance of PVT systems, based on recent studies.
Cooling TechniqueFluid TypeElectrical Efficiency (%)Thermal Efficiency (%)Overall Efficiency (%)References
Jet cooling in a compact moduleWater14.2354.4368.1[49]
Corrugated channelAir16.845-[50]
channels with bafflesAir13.652.8-[51]
Serpentine with absorber plateWater15.566.580[52]
Serpentine with absorber plateNanofluids18.87895[52]
Tubes with twisted tapesWater11.8872-[53]
Serpentine with absorber plateWater14.844.559[54]
Corrugated channelWater10.310.5-[55]
channelsWater16.939.865.9[56]
Upper and lower channelsWater with air13.25085[57]
Spray jetsWater15.5--[58]
SerpentineAir16--[59]
Open box with bafflesWater135361[60]
Solar tracker
Fresnel lens
Water14.546.653[27]
Spectral beam splitterFe3O412.548.160.61[26]
FL and convex lensWater+Ethylene Glycol14.639.153.7[29]
No solar tracker
concentrator
Zn-H2O6.560-[46]
FL and solar tracker: single axisCu9S512.619.434.2[61]
FL, solar tracker: NoPropylene Glycol6.0340.7446.77[62]
Reflector linear and flat mirrorCoSO49.140.7849.88[48]
No concentratorAl2O313.2048.8862.08[49]
Fin absorbersAir/Water+TiO213.8258.0371.85This paper
Disclaimer/Publisher’s Note: The statements, opinions and data contained in all publications are solely those of the individual author(s) and contributor(s) and not of MDPI and/or the editor(s). MDPI and/or the editor(s) disclaim responsibility for any injury to people or property resulting from any ideas, methods, instructions or products referred to in the content.