Abstract
We study the relationship between tweets referencing Acute Respiratory Infections (ARI) or COVID-19 symptoms and confirmed cases of these diseases. Additionally, we propose a computational methodology for selecting and applying Machine Learning (ML) algorithms to predict public health indicators using social media data. To achieve this, a novel pipeline was developed, integrating three distinct models to predict confirmed cases of ARI and COVID-19. The dataset contains tweets related to respiratory diseases, published between 2020 and 2022 in the state of San Luis Potosí, Mexico, obtained via the Twitter API (now X). The methodology is composed of three stages, and it involves tools such as Dataiku and Python with ML libraries. The first two stages focuses on identifying the best-performing predictive models, while the third stage includes Natural Language Processing (NLP) algorithms for tweet selection. One of our key findings is that tweets contributed to improved predictions of ARI confirmed cases but did not enhance COVID-19 time series predictions. The best-performing NLP approach is the combination of Word2Vec algorithm with the KMeans model for tweet selection. Furthermore, predictions for both time series improved by 3% in the second half of 2020 when tweets were included as a feature, where the best prediction algorithm is DeepAR.
1. Introduction
Information from social networks has become an important resource for assessing public health, offering a powerful tool for real-time disease monitoring and the prediction of communicable diseases [1]. The growing trend in the use of social networks to share personal situations from users’ daily lives generates large amounts of data that describe the behavior of the population, demographic data, geolocation data, images, text and interaction between users [2]. If it were possible to identify users’ posts prior to an official confirmation (dictated by a hospital or laboratory) of an Acute Respiratory Infection, the collective information of an area or region would help to identify a possible outbreak. Traditionally, disease monitoring relies on Indicator-Based Surveillance Systems, which collect and report information to government health agencies. However, these processes often involve slow data flow and adherence to protocols that delay the publication of critical information [3]. A second type of surveillance system, known as Event-Based Surveillance Systems, is gaining prominence with the availability of new information sources like social networks. The World Health Organization (WHO) defines these systems as the organized and rapid collection of information from sources such as social media, news outlets, and public health networks about events that may pose risks to public health [4]. An example of the importance of the use of these Event-Based Surveillance Systems occurred on 30 December 2019, the network-based tool ProMED (Programme for Monitoring Emerging Infectious Diseases) reported posts on the Chinese social network Weibo regarding pneumonia cases in Wuhan, prior to the recognition of the COVID-19 virus as a potential pandemic [5]. WeChat is another social network used in China to predict COVID-19 trends, through the “Pandemic Forecast and Warning WeChat Mini Program”, which enabled early warnings of new outbreaks across 31 provinces in China [2]. WeChat was also used to distribute surveys for gathering information on COVID-19-related symptoms and to generate epidemic time series based on the collected data [6].
Another concept that has gained attention in recent research is Digital Epidemiology, an emerging field that leverages big data—including social networks—and digital technologies to analyze disease-related patterns. Its primary goal is the early detection and monitoring of viral outbreaks. Fallatah and Adekola [7] suggest that integrating this approach into existing surveillance systems could enhance global health infrastructure and help save lives during viral epidemics.
Therefore, this research focuses on social media data; however, one of the significant challenges in utilizing data from these platforms is limited access. Charles et al. [8] carried out a literature review on the use of social network information in the context of public health monitoring, and the main social network was Twitter (now X) with 81% (from 33 studies reviewed). Gupta and Katarya [9] performed a similar review, observing that Twitter data was used in 64% of a total of 26 selected investigations. The reason for the frequent use of this social network to carry out research is precisely the availability and access to current and past publications. However, due to recent changes in its administration, the access policies for the publications of this social network have changed. On the other hand, use of data from social networks for surveillance presents some challenges. The main concern when working with such data to monitor public health is misinformation; Wang et al. [10] conclude that misinformation is more popular than accurate information, and misinformation frequently induces fear, anxiety, and mistrust in institutions. Therefore, the use of NLP to identify those publications related to the diseases that are of interest for monitoring is a quite complex task, which can be addressed with different procedures and algorithms. Giancotti et al. [11] highlight additional concerns when working with data from social networks, including the absence of an ethical framework, the lack of internationally recognized privacy protection policies, the risk of spreading conspiracy theories, and the potential for false-positive events due to geographic or cultural variations in language.
The processes for selecting which algorithms to work with can be complicated and confusing. So, we introduce a computational methodology for this task, which contains three phases. In each phase, tests and comparisons are carried out among models to facilitate their selection and development. We use ML platforms such as Dataiku and the programming language Python. The main objective of this research is to investigate the relationship between tweets and information reported by health authorities related to ARI and COVID-19. Thus, we compare different ML prediction models using confirmed cases of ARI and COVID-19 as a target; and as a feature, tweets related to possible cases of these diseases (independent variable).
For each phase of the proposed computational methodology, we follow a data science workflow [12], which contains a workflow consisting in three steps: data, analysis and communication, see Figure 1. The Data step involves data collection, cleaning, storage and sharing; Analysis step is composed by training and forecasting models; and the last step corresponds to the communication of the results, that is the ability to share knowledge with interested parties (visualization).
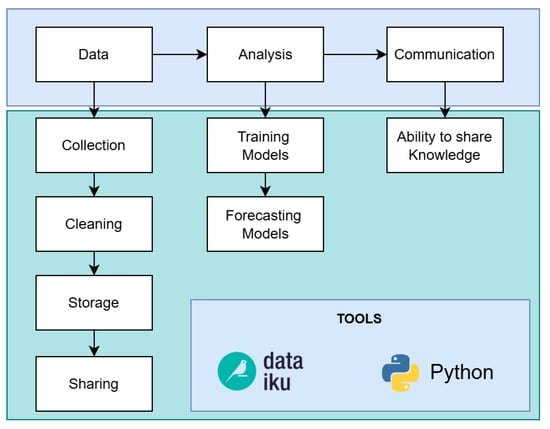
Figure 1.
Data science workflow. There are three main steps: Data, Analysis and Communication [12].
This paper is organized as follows. First, we start in Section 2 with the literature review with the related work to this research. Then, following the data science workflow: Section 3 presents the data, the first step; Section 4 as part of the analysis step the proposed computational methodology is described; Section 5 is the visualization of results, which corresponds to the communication step. At the end comes the conclusions and further research.
2. Related Work
The use of data from social networks to predict respiratory diseases is not a new research topic, and the complexity of the algorithms varies depending on their architecture and the degree of analysis of the tweets. Dai et al. [13] describes a classification of four types of analyses to identify the degree of assessment of the text obtained from social media posts and the complexity of the algorithms used: (1) Keywords-based Approaches, (2) Learning-based Approaches, (3) Lexicon-Based Approaches, and (4) Word Embedding Based Approach. The architecture of the algorithms used in this research includes elements of types (1), (2), and (4), and the reason for using different approaches was to compare the results obtained. Previous investigations have described the selection of tweets through Keywords-based Approach. For example, words like “sore throat”, “cough” and “fever” found in tweets, which are related to respiratory diseases have been used [14]. Subsequently, the quantity or frequency of tweets related to these words can be compared with national respiratory disease statistics. Talvis et al. [14] calculated the linear correlation coefficient between selected Tweets and Google Flu Trends Queries. Hirose and Wang [15] used multiple linear regression models to relate the dynamics of tweets with influenza keywords, and Influenza-Like Illness data [16]. One of the disadvantages of using keywords in the selection of tweets is that they may not be related to events associated directly with the person who is publishing a social media post; for example, if the selected tweets are those which contain the word “influenza”, in some cases these could be part of a public health campaign, and not related to people who have had or have a respiratory illness. So, one of the main challenges is the selection of social media posts. In this research, different methods were compared to identify an increase in the accuracy of the predictions depending on the filters used in the tweets and the algorithms used for this. The second type of algorithms described by Dai et al. [13], requires labeled data for training. Then, ML classifier is used to predict if a tweet is related or not to acute respiratory infections. Some of the most widely used ML techniques are Naïve Bayes, Random Forest, Decision Tree, k-Nearest Neighbors (KNN), XgBoost, Logistic Regression and Support Vector Machines (SVM). Similar works were found in the investigations of Zuccon et al. [17], Santos and Matos [18], and Prieto et al. [19], using different tools such as WEKA (https://ml.cms.waikato.ac.nz/weka/index.html) and scikit-learn toolkit (https://scikit-learn.org/) to compare different ML models, and the models with the highest classification accuracy were SVM and Naïve Bayes. Jiang et al. [20] analyzed help-seeking messages on the Chinese social network Weibo during different stages of the COVID-19 pandemic. They used Convolutional Neural Networks (CNN) and Recurrent Neural Networks (RNN) to approach the task as a binary topic classification problem.
Agrawal et al. [21] used different ML models to classify people’s feelings and analyze the direction of polarity in tweets, with support vector machine model being the one that obtained the highest performance; Ueda et al. [22] identified the changes in feelings before and after the declaration of a state of emergency in Japan due to the COVID-19 pandemic, relating tweets to different emotions such as anger, sadness, surprise, disgust, etc.; and Aldosery et al. [23] evaluated the reaction sentiment (positive, neutral and negative) towards the COVID-19 pandemic in the UK, with a sentiment analysis model that combines a recurrent neural network and an embedded topic model. Guo et al. [24] examined Twitter users’ beliefs about vaccination orders during the COVID-19 pandemic in the USA, with classification ML models; Kalanjati et al. [25] did similar research to classify sentiments and opinions regarding COVID-19 and the COVID-19 vaccination on Indonesian-language. Hamedani et al. [26] analyzed Reddit posts during the COVID-19 pandemic to identify major discussion topics using the Latent Dirichlet Allocation (LDA) algorithm. They then classified the sentiment of each topic using the Syuzhet package for the R programming language.
As mentioned above, labeled data presents one of the main challenges for training ML models; the manual classification of tweets is the most used mechanism in the reviewed investigations belonging to this type, to build the training dataset of the models, and this classification involves declaring which tweets are related to respiratory disease and which are not. In the dataset used by Kagashe et al. [27], if a tweet is related to influenza infection, it is classified as “relevant”, otherwise it is classified as “irrelevant”. Zuccon et al. [17] used a scale from 0 to 100 (0 being no flu, 100 being certain of a flu), in which the evaluators classified the tweets related to ILI. The mechanism used by Santos and Matos [18] to reduce the errors, consists in a classification with three evaluators, labeling according to the majority.
The unsupervised ML Algorithms in the fourth type (Word Embedding Based Approach) of Dai et al. [13] do not require labeled data, which makes human intervention in classification minimal. There are different processes to achieve this objective; one of them is the conversion of sentences (tweets) to numerical vectors; Word2Vec is one of the most used tools, and contains two types of algorithms: continuous bag-of-words and continuous skip-gram [28]. Other researchers use this algorithm to discover relationships between words through context [29,30]; the comparison can be made using measures such as the cosine similarity, and the results can be used for different purposes, such as finding a relationship between named entities in text corpora, or simply with keywords. In this study, we use the results of Word2Vec to train the Kmeans clustering model, with the aim of grouping tweets according to their context. Chen et al. [31] used the Kmeans model to identify the relationship of viral publications (Twitter and Weibo) and 77 features related to different topics (violence, international, vaccination, misinformation, etc.).
Didi et al. [32] integrate sequences of ML algorithms for different purposes; they used algorithms such as FastText and Glove for feature extraction, classification models such as SVM, XgBoost and LR; to later make predictions with Prophet, LSTM and SVR models. In the literature analyzed, we found some articles that used deep learning models, Long Short Term Memory (LSTM) [24,32,33] and Convolutional Neural Networks (CNN) [34]. In recent years, these algorithms have been developed and are more accurate than traditional ML models, e.g., Naive Bayes, Support Vector Machine, Random Forest, etc. Part of our approach is to study deep learning algorithms for prediction: (i) DeepAR is a forecasting method based on autoregressive recurrent neural networks, which learns a global model from historical data [35] and (ii) Transformer is an architecture based on an attention mechanism, embeddings and feed forward neural networks [36]. And in the same way, we integrate a prior analysis and selection of tweets using Word Embedding techniques, such as Word2Vec [13]. Other models that we use for classifying and grouping tweets are Bidirectional Encoder Representations from Transformers (BERT) [37] and Kmeans [38] respectively. Although these models have been used previously [31,39], the combination with deep learning prediction models in a pipeline is innovative in this research. Lande et al. [40] used BERT models in tweet classification that provided better results compared to LDA models. To et al. [41] used this same model to identify anti-vaccination tweets comparing with bidirectional long short-term memory networks with pre-trained GLoVe embeddings (Bi-LSTM) and more traditional ML models such as SMV; they obtained the best results with the BERT model. And Yang et al. [42] compared BERT model with SVM, classifying tweets to identify users who have self-reported chronic stress experiences, obtaining the best results with BERT. Chen et al. [43] utilized a Chinese pre-trained BERT model to extract 20 key topics from posts on the Chinese social network Weibo, analyzing public perception of active aging after the COVID-19 pandemic. They suggest that these topics can serve as a guideline for long-term government planning, helping integrate public concerns into policy development.
3. Data
Following the data science workflow in Figure 1, this section presents the data collection and data cleaning steps. For the data storage and data sharing steps, we use Comma Separated Files (CSV) among the different phases of the proposed computational methodology; introduced below.
3.1. Data Collection
Our first data source is Twitter (currently known as X). The advantage of Twitter over other social media platforms is the availability of the data; although these policies have recently changed due to the new company’s management. Many researchers have the same difficulty to obtain data from social networks, and find in Twitter the ideal information provider for their research [8]. Other data sources are reports published by the Mexican government (ARI and COVID-19 time series).
3.1.1. Twitter Data
The method used in this research to access tweets, was Twitter API and its Python library Tweepy. This library contains various methods, some examples: authentication, download data (tweets), manipulate data and modify downloaded information [44]. The programming language used was Python 3.10; with its library Tweepy used to configure the Twitter API and query parameters. The main function used was “search full archive”. This function searches for tweets in the entire Twitter base from 2006 to date. In addition, it works under Boolean searches, which delimit the searches. Boolean searches help specify selection criteria for downloading tweets; for example, if it is declared in the query that only tweets that contain the word “COVID-19” are downloaded, only these will be downloaded. We downloaded tweets that contain any of the following words: asthma, bronchitis, respiratory, cough, and flu (in Spanish correspond to ‘asma’, ‘bronquitis’, ‘respiratorias’ and ‘tos’ or ‘gripe’, respectively), as suggested by Gónzalez-Bandala et al. [45]. Additionally, we added the words ‘COVID-19’ and ‘COVID’; with the limitation of a maximum of 128 characters per query set by Twitter for our type of Twitter developer account. Additionally, two more filters were declared; the first one was only tweets in Spanish language, and the second, tweets generated in the state of San Luis Potosí, Mexico. The account given by Twitter for downloads has a level of “Elevated”. This level allows fifty queries per month, and five thousand downloaded tweets per month. These limits correspond to the use of the “Search Tweets: Full Archive” function, for historical queries in the entire Twitter database. The total number of tweets downloaded in a time period between January 2020 and December 2022, was 5759. It was done through requests for a maximum of 1000 tweets per query. Table 1 shows an example of downloaded tweets.

Table 1.
Example of the result of a query; three tweets, with tweet information, user, location (Loc), publication date and detected tags.
3.1.2. Government Data: ARI Data and COVID-19 Data
The General Directorate of Epidemiology is an organism that belongs to the Mexican Health Ministry (known as Secretaría de Salud). Its functions include monitoring epidemics within Mexican territory and publishing periodic epidemiological data. The information reported by this agency includes ARI [46] and COVID-19 cases [47]. The information is represented as time series. The time series downloaded correspond to a time period between 1 January 2020 and 31 December 2022. The year 2020 was chosen as the starting point due to the onset of the COVID-19 pandemic.
3.2. Data Cleaning
Data cleaning is a fundamental part of each phase of our computational methodology, since the data is collected in different formats. So, different procedures are necessary to standardize these formats. The following steps are needed for each data source. It should be noted that each phase contains its own data cleaning process; for example in the first phase all data cleaning was done in Dataiku, and the last phase was done completely in Python code.
- COVID-19 data.
- (a)
- Set the date format to the corresponding column.
- (b)
- Apply date filter according to period January 2020 and December 2023.
- (c)
- Extraction of date components: year and month.
- (d)
- Weekly sum of COVID-19 confirmed cases.
- ARI data.
- (a)
- Extraction of information from PDF files through the Python Tabula library. This script involves positioning functions on the PDF sheets to extract the corresponding tables. Additional cleaning is done by removing empty spaces, column renaming and construction of a Pandas dataframe for later export to CSV format.
- (b)
- Maintain rows exclusively from the state of San Luis Potosí.
- (c)
- Extraction of date components: year and month.
- (d)
- Set the date format to the corresponding column.
- (e)
- Union of the information of all the weeks in a single dataset.
- (f)
- Set the date filter according to period January 2020 and December 2023.
- Twitter data.
- (a)
- Set the date format to the corresponding column.
- (b)
- Removal of unknown characters (excluding letters and numbers). In this step, all emoticons, non-alphanumeric symbols, and pictorial characters are eliminated. Since the tweets downloaded from the API are exclusively in Spanish, the presence of characters from other languages is naturally avoided.
- (c)
- Elimination of line breaks and elimination of words made up of less than 2 letters and more than 21.
- (d)
- Normalization of words to lowercase.
4. Methods: Training and Forecasting Models (Analysis)
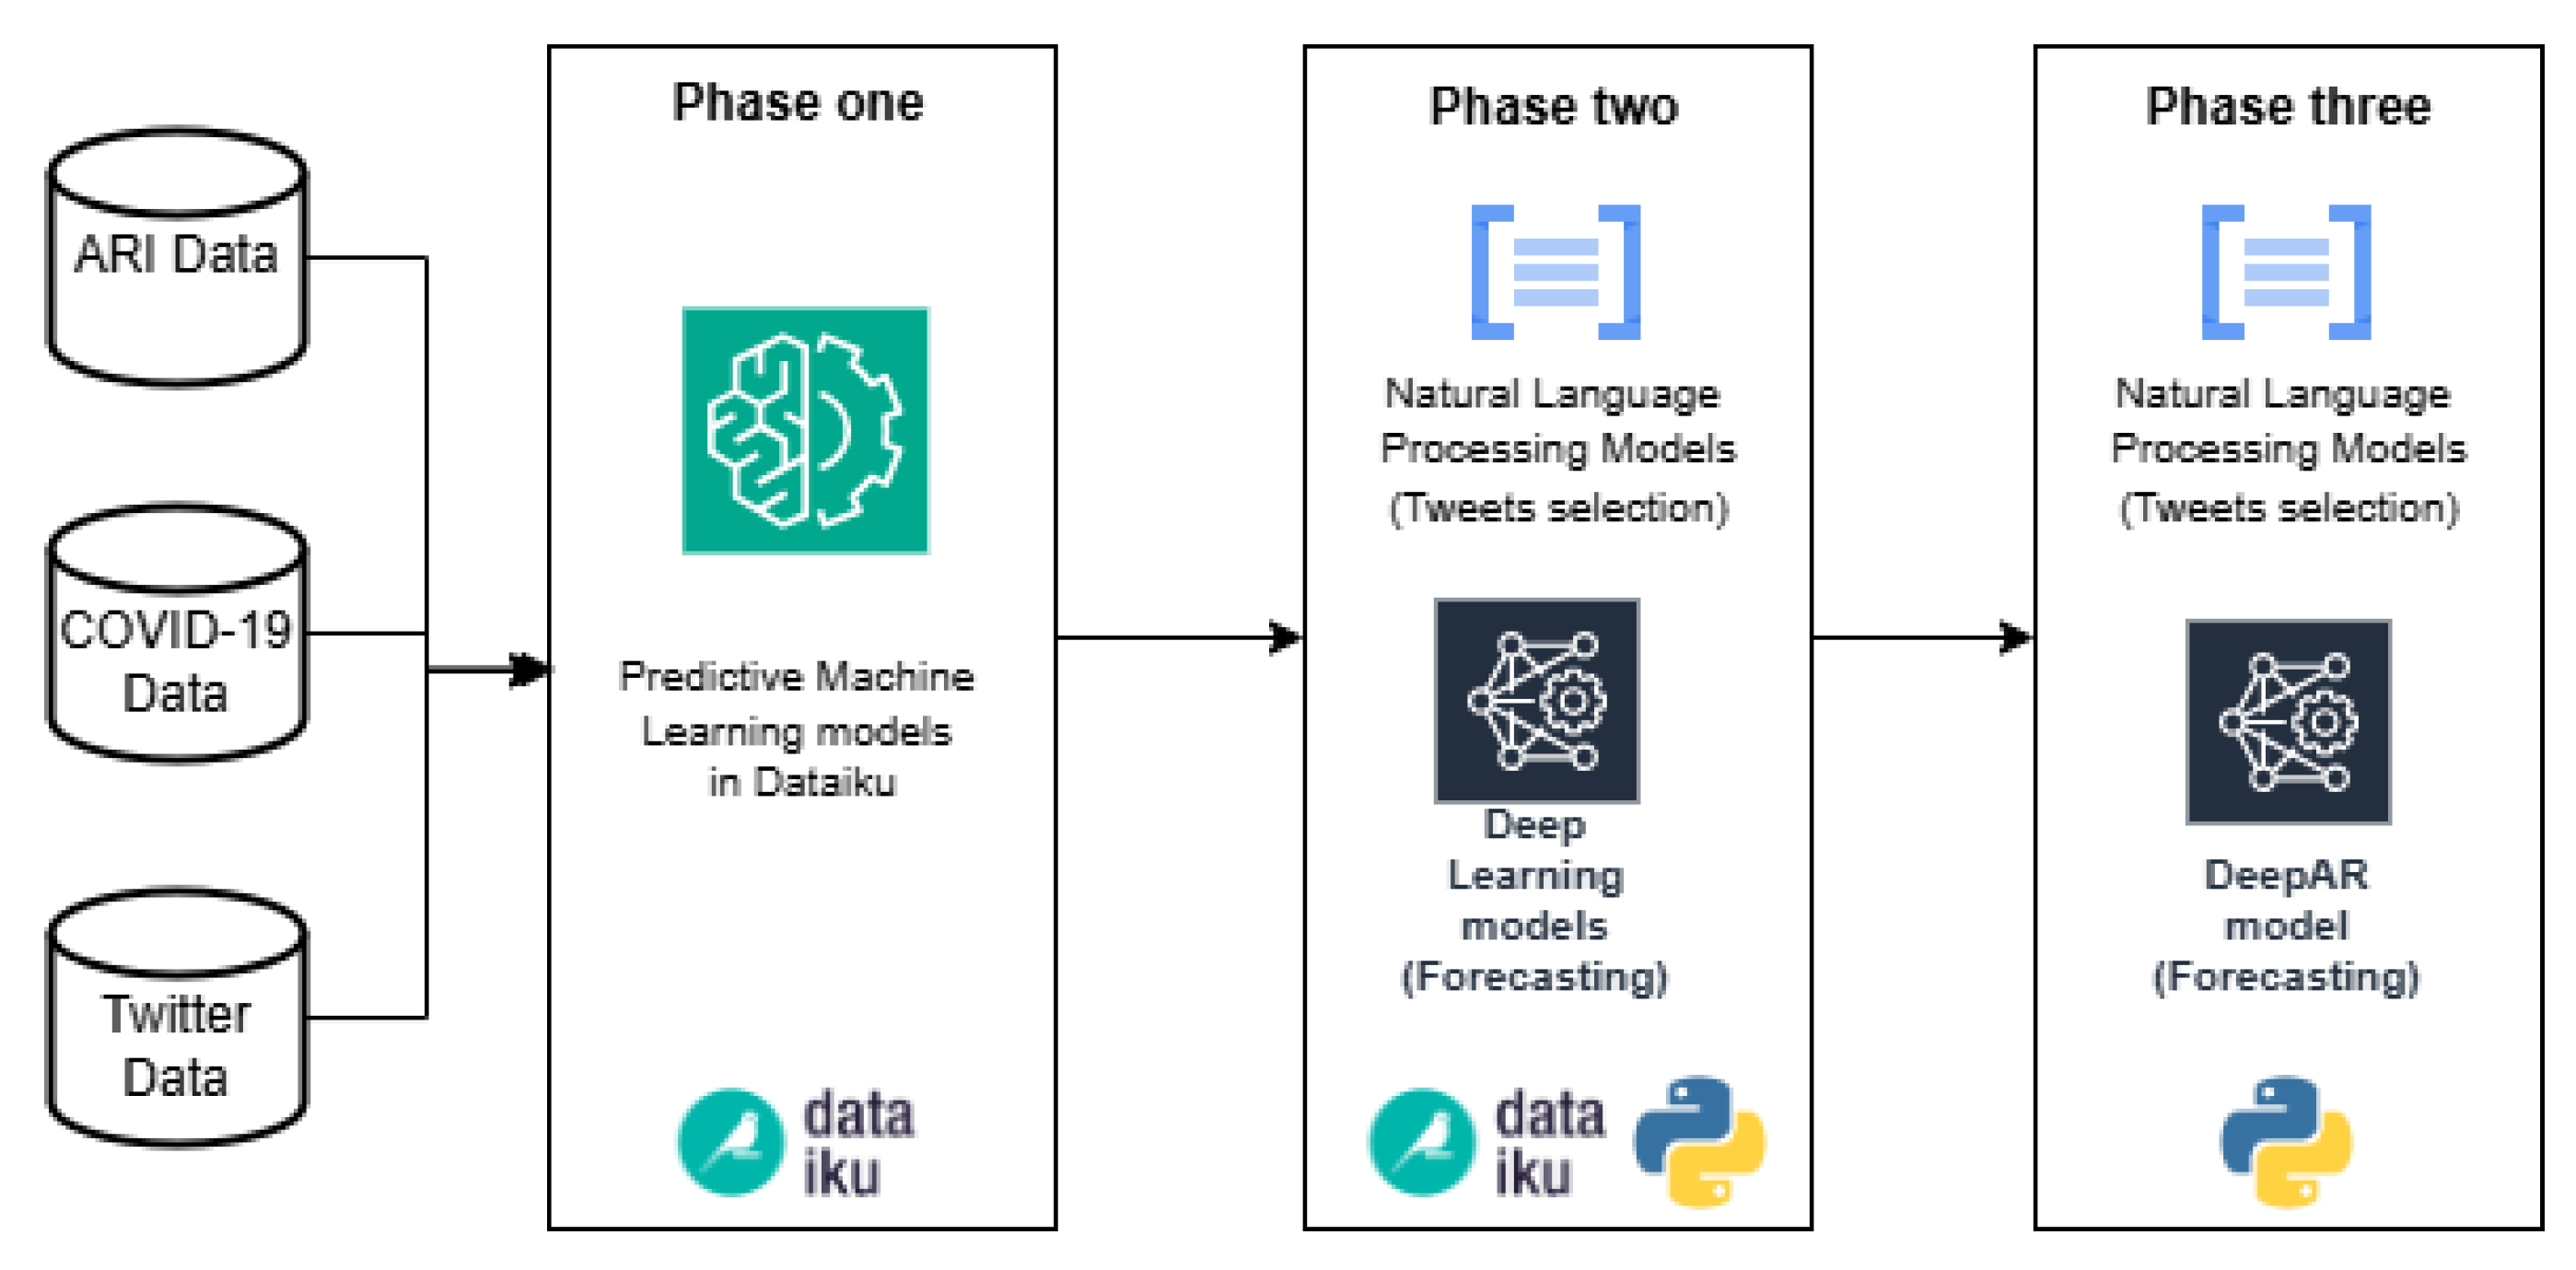
In Figure 2, we introduce the computational methodology that consists of three phases. The first phase mainly includes the use of Dataiku platform for data cleaning, transformation and modeling of ML algorithms. Dataiku is a data science and ML collaborative platform, and it was selected among others for its ability to implement ML algorithms quickly and easily. Also, it helps with the unification of data formats, and it has diverse functionalities for data transformation. Moreover, it contains a wide variety of ML algorithms available to implement in the pipelines. The role played by this phase is the rapid comparison between different ML prediction models using confirmed cases of ARI and COVID-19 as a target; and as a feature, tweets related to possible cases of these diseases (independent variable). In this phase, a simple data cleaning and transformation process is carried out in Dataiku, omitting the tweet classification and selection algorithms. In the second phase, the comparison of predictive models classified as Deep Learning is carried out, and the tweet selection stage is added with algorithms developed in the Python language. Most of this phase is developed in Dataiku, prioritizing agility and speed in testing, but Python code components are integrated into the pipeline to develop tasks that are not possible in Dataiku, such as the use of Word2Vec (word embedding technique); the combination of Python code and Dataiku functionalities is the fundamental part of this phase. The third phase was carried out completely in Python code using the ML algorithms with the best performance obtained in the previous stages. The main advantage of converting Dataiku pipelines to code is the use of recursion in the algorithms, allowing to carry out a large number of tests and verifications.
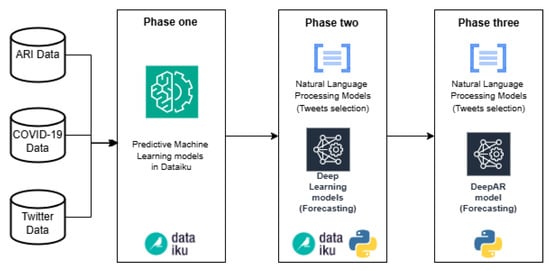
Figure 2.
Computational Methodology to simplify the process of selecting ML algorithms for forecasting.
4.1. Phase One
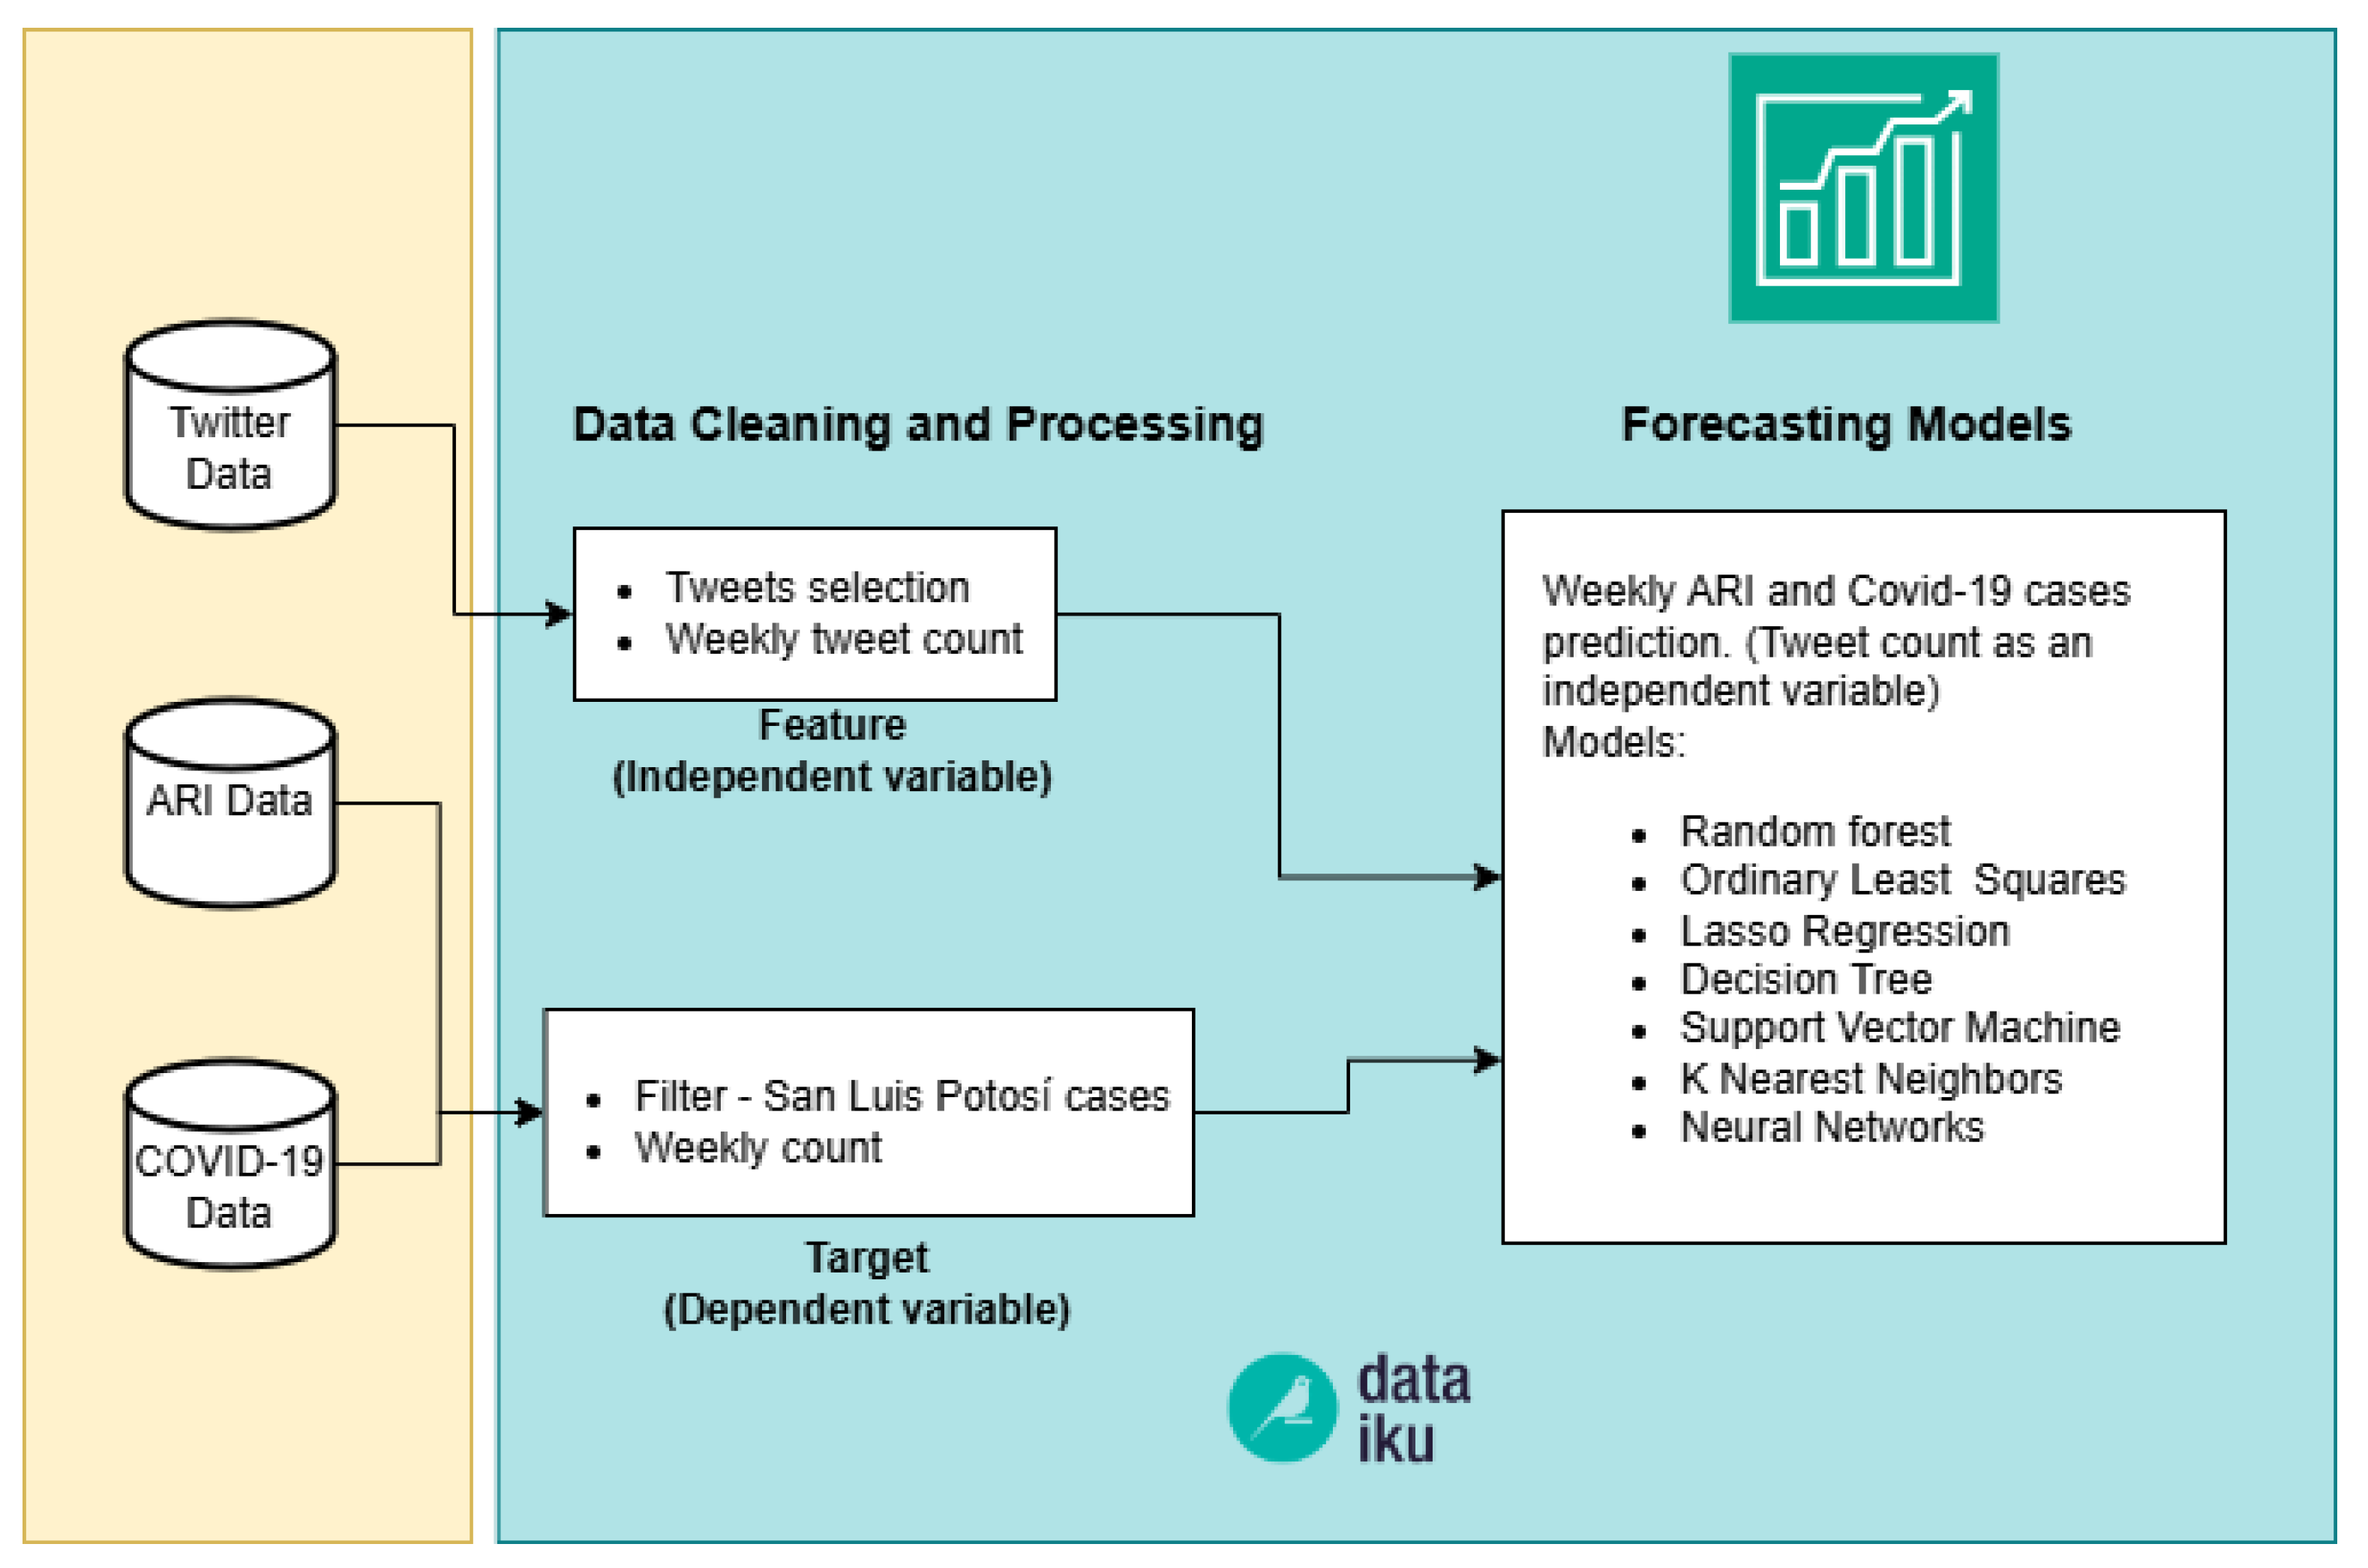
As mentioned above in “Twitter Data” section, see Section 3.1.1, the tweets downloaded from the API correspond to those filtered with keywords such as: asthma, bronchitis, respiratory, cough and COVID19; posted in the state of San Luis Potosí and restricted to the language Spanish. The objective of this phase was to identify the type of ML algorithms that we will use. We used prediction models with continuous variables, selecting the target (dependent) variable, the number of confirmed ARI and COVID-19 cases, and using the weekly count of selected tweets as a feature (independent variable). Seven different models were used to predict the variables COVID cases and ARI cases. The independent variable in both diseases was the count of tweets related to these diseases, see Figure 3. Data cleaning, data transformation, training and testing of the models were carried out on the Dataiku platform. One of the key advantages of this tool is its ability to test a wide range of algorithms and machine learning models simultaneously, allowing for quick comparison of results. The ML models evaluated in Dataiku were: Random forest, Ordinary Least Squares, Lasso Regression, Decision Trees, SVM, KNN and Artificial Neural Networks (hereafter referred as Feed Forward). In order to compare the models among them, we used Maximum Absolute Percent Error (MAPE) and Root Mean squared error (RMSE) metrics, see Equations (1) and (2), respectively.
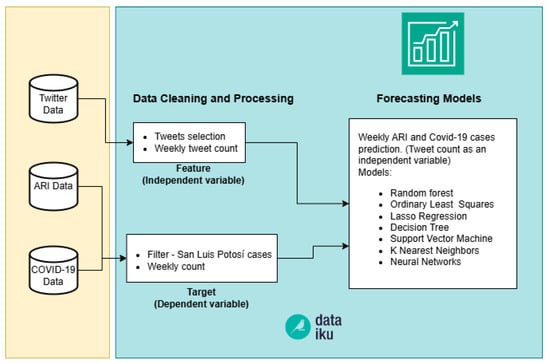
Figure 3.
Pipeline of Phase one.
4.2. Phase Two
The second phase of our computational methodology focuses on involving more complex algorithms and processes, which are not feasible to execute in Dataiku; such as processing word embeddings algorithms as Word2Vec. The primary focus in this phase remains on maintaining agility and speed in conducting the necessary tests.
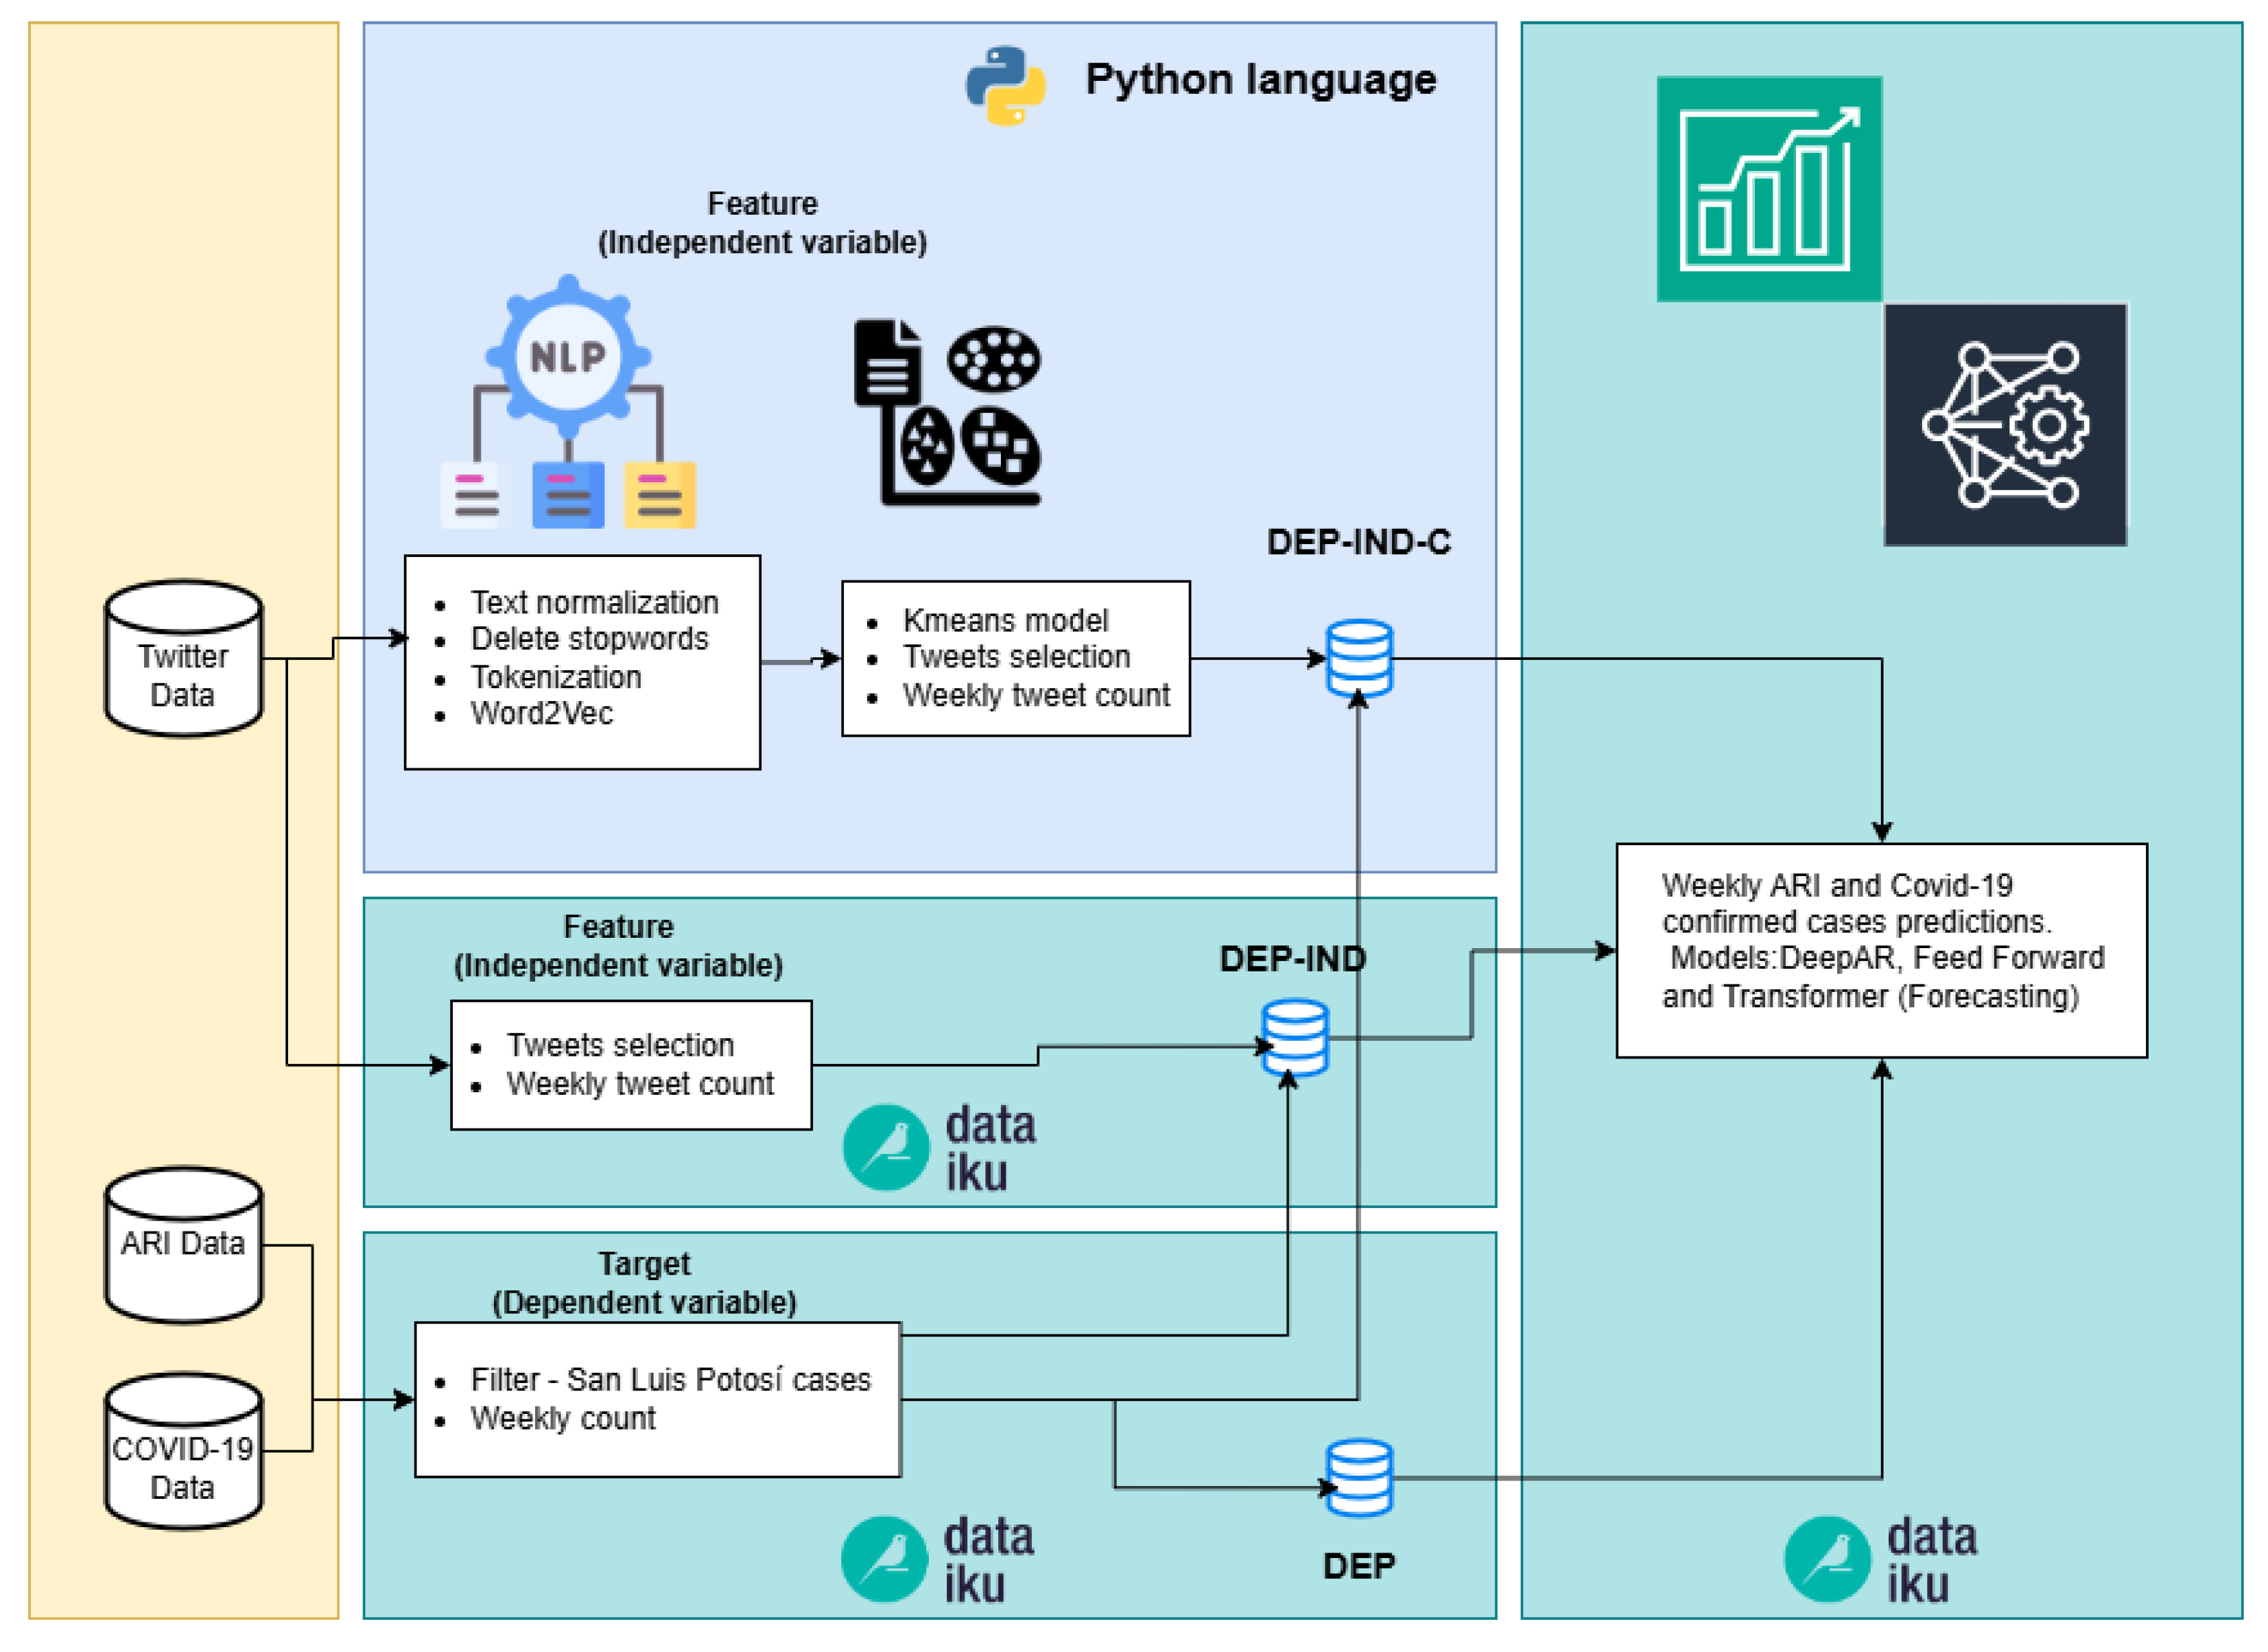
Three pipelines were built to generate three datasets used in the prediction models, see Figure 4.
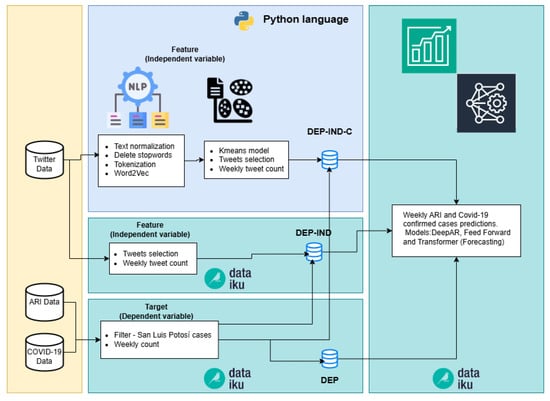
Figure 4.
Pipelines of Phase two (DEP-IND-C, DEP-IND and DEP).
- DEP-IND-C. In this pipeline NLP algorithms were added in Python code to remove tweets that are not related to either COVID-19 or ARI. The first part of this process consisted of the following three steps:
- (a)
- Elimination of stopwords. The NLTK library was used to identify stopwords in Spanish and eliminate them.
- (b)
- Tokenization and conversion to word vectors, with the Python Numpy library.
- (c)
- Conversion to numeric vectors through the Gensim library and the Word2Vec algorithm. Word2Vec consists of two learning models, Continuous Bag of Words (CBOW) and Skip-gram. When feeding ML algorithms with text data, they return numerical vectors [48]. Thus, each word in a tweet is represented as a 100-dimensional vector, and each tweet is represented by the average of the vectors corresponding to the words it contains.
In the second part of this pipeline we used the Kmeans algorithm to cluster the tweets. Dataiku provides various models for solving clustering problems, including KMeans, Gaussian Mixture, Mini-Batch KMeans, Agglomerative Clustering, Spectral Clustering, DBSCAN, Interactive Clustering, and Isolation Forest. KMeans was chosen for its simplicity, lower computational cost, and superior performance in the Silhouette metric. This process allows to separate the tweets related to either COVID-19 or ARI, because there are publications from institutions or individuals that are not related to respiratory infectious diseases. Some tweets were simply informative about the status of the pandemic or diseases. The Kmeans algorithms employs silhouette analysis, where the coefficient measures the similarity of a data point within its cluster (cohesion) compared to other clusters (separation). This parameter goes from −1 to 1, if it approaches to 1 it indicates how tightly packed all the points in a cluster are with respect to their centroid.
- 2.
- DEP-IND. This pipeline used the tweet dataset without any filtering process, except those carried out when downloading through Twitter API; a simple cleanup is performed and a weekly tweet count, see Section 3.2.
- 3.
- DEP. This pipeline was created to verify the “tweets” feature contribution (independent variable of the other two pipelines); only historical weekly count of confirmed COVID-19 cases and ARI are used for prediction.
The last step of each one of the three pipelines was the use of ML models for time series prediction. Dataiku provides both statistical models (Trivial Identity, Seasonal Naive, AutoARIMA, Seasonal Trend, and Non-Parametric Time Series) and deep learning models (Feed Forward, DeepAR, and Transformer) for time series forecasting. Statistical models were excluded due to their lower accuracy compared to deep learning models. Deep Learning models (DeepAR [35], Feed Forward [49] and Transformer [36]) were used to predict the target variable (COVID-19 or ARI); it is important to note that these models were not found in previous research related to Twitter. For the prediction models, Dataiku tool was used to train and test these models. To compare the different prediction models, MAPE metric was used, see Equation (1) below. The time series used correspond to a period between January 2020 and December 2022.
4.3. Phase Three
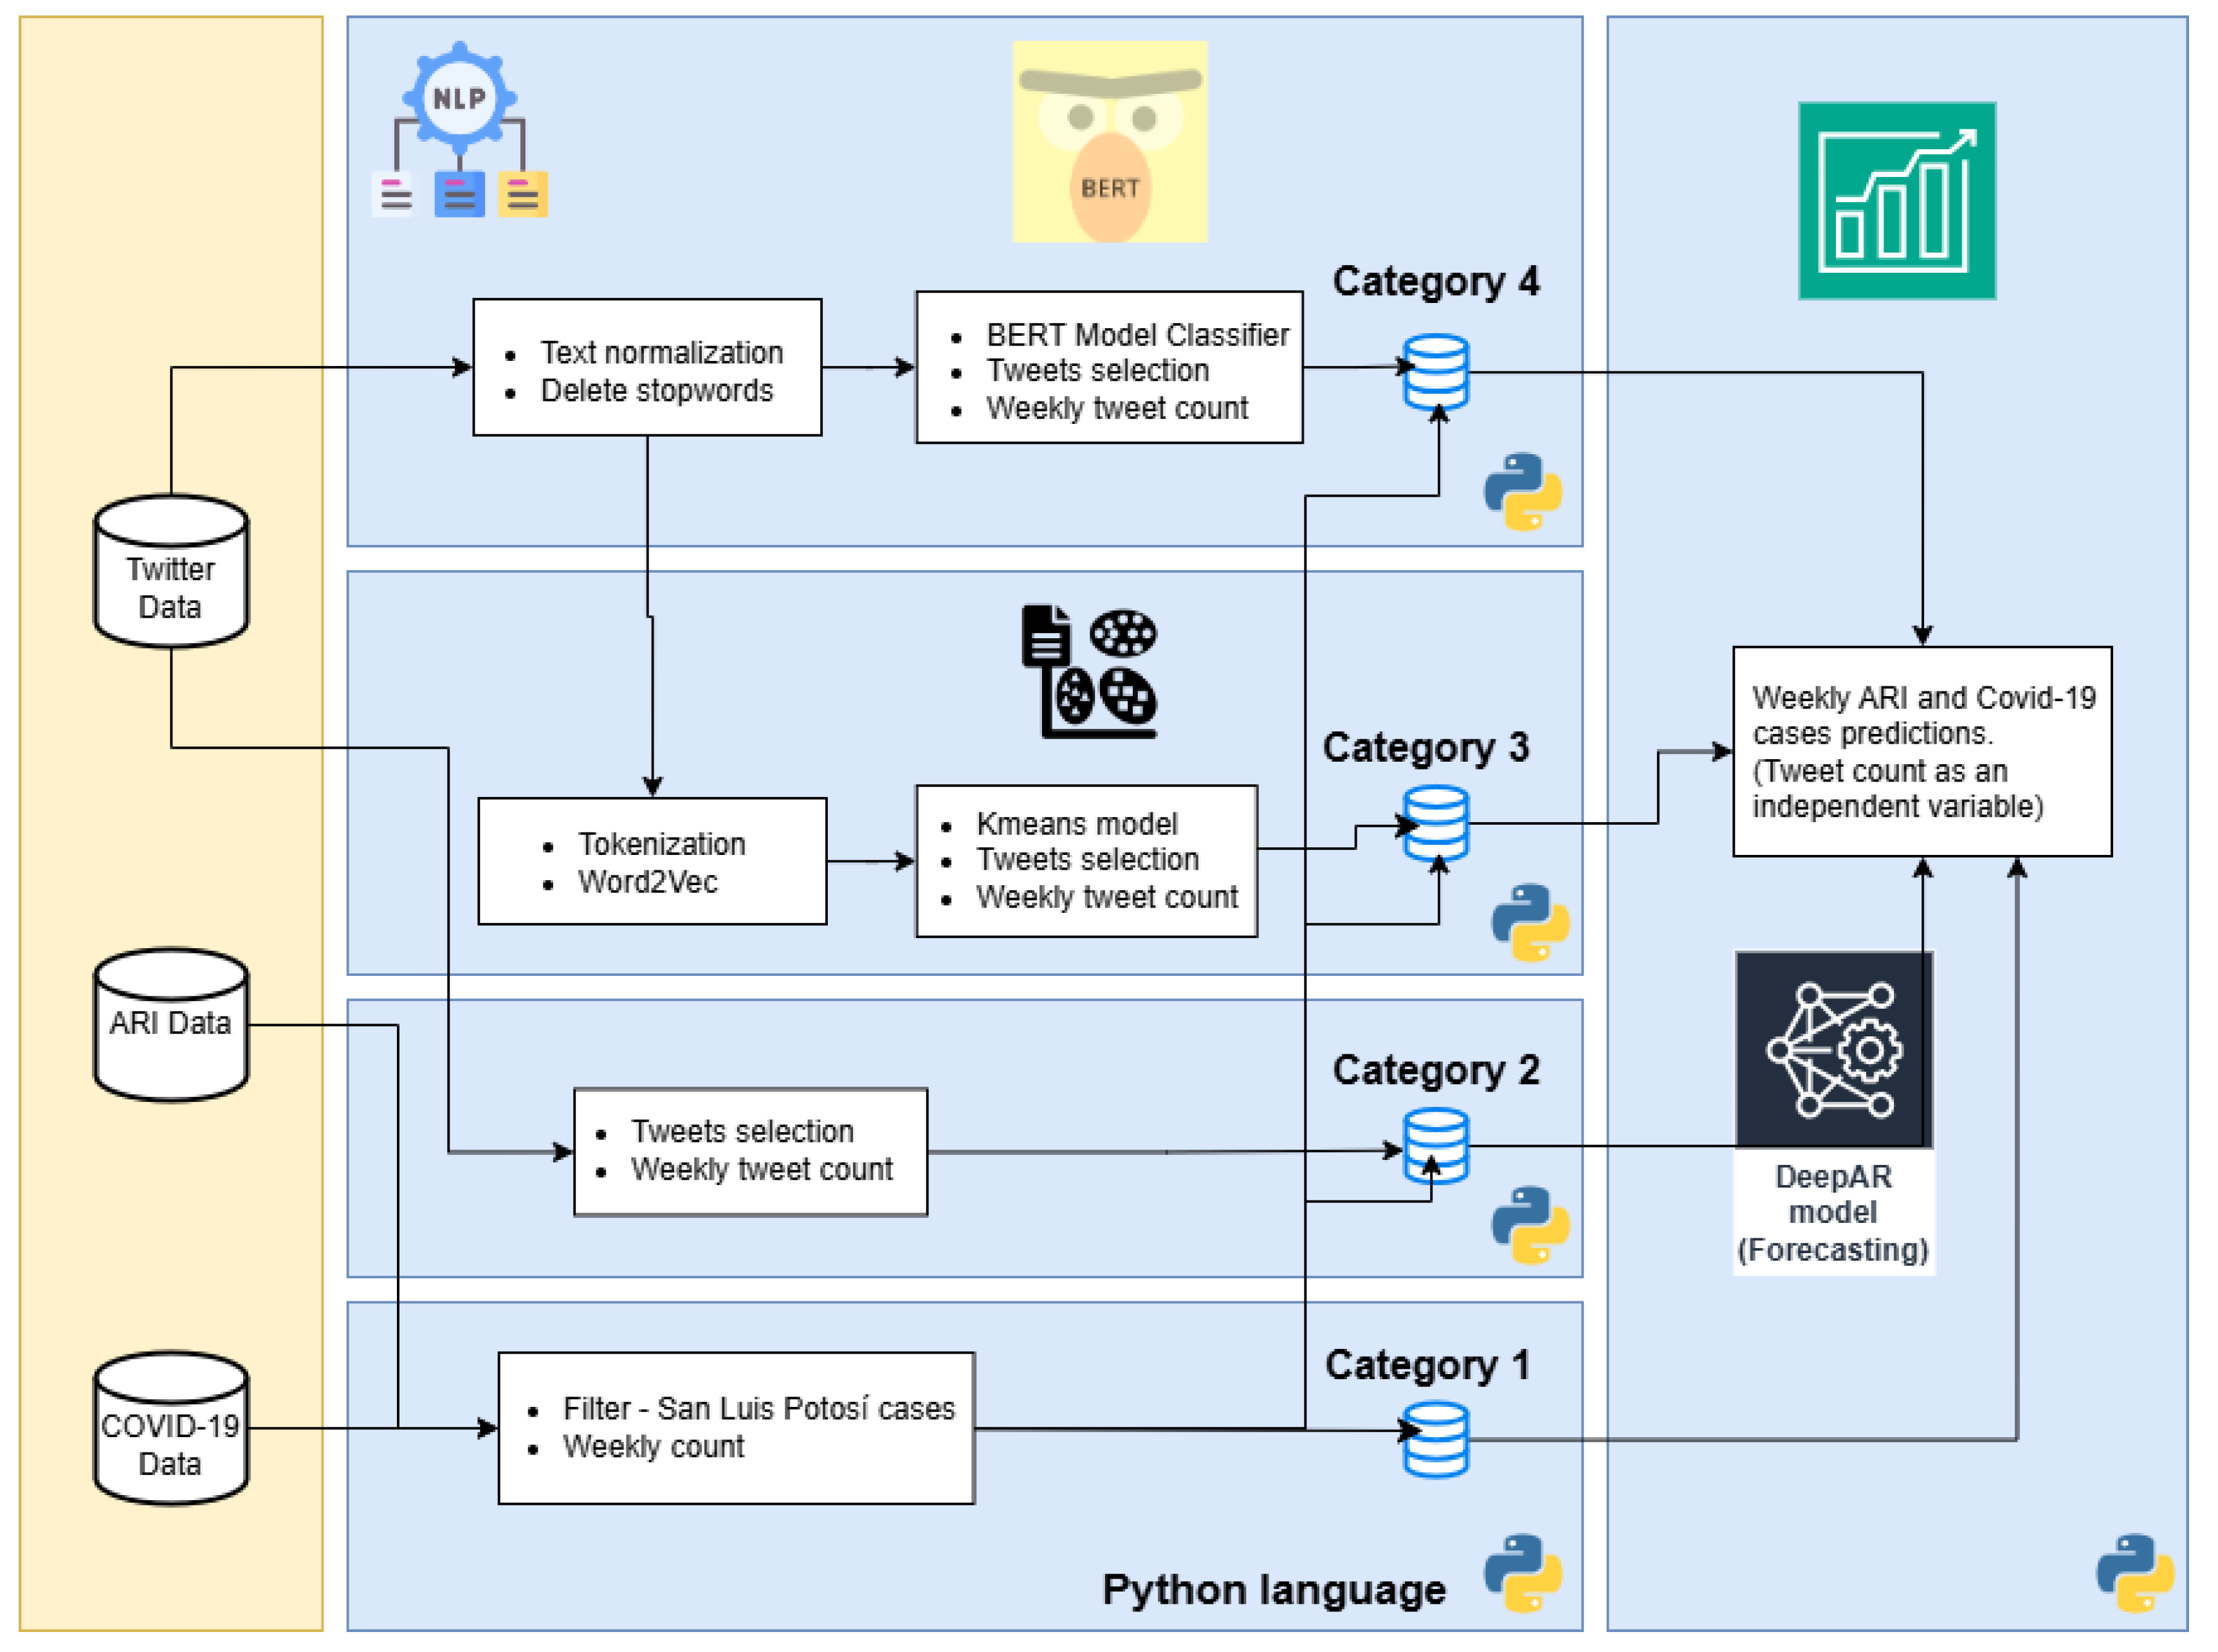
This third phase of the computational methodology is developed in Python language. The main objective of this stage is to improve and adjust the processes in the pipelines that are not possible to integrate in Dataiku. In this phase, four pipelines were developed named Category 1 to 4, and each one corresponds to a unique combination of procedures to generate four datasets. These datasets are used by the prediction models, see Figure 5.
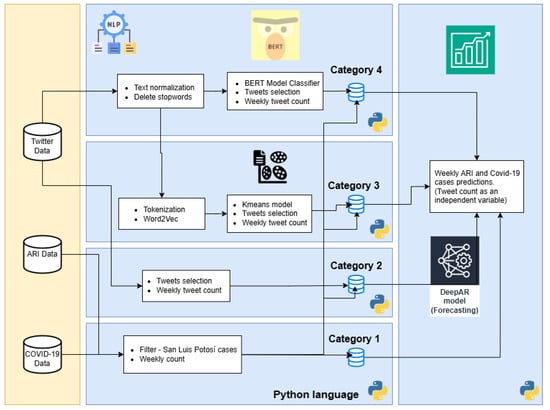
Figure 5.
Pipelines of Phase three (Categories: 1, 2, 3 and 4).
- Category 1. This pipeline develops the cleaning and processing of the target (in prediction) variable historical weekly count of confirmed COVID-19 and ARI cases. It is similar to the DEP pipeline from Phase two, but transformed into Python code. The predictions about the output of this pipeline are the basis for comparing the performance of other pipelines with the tweet count as a feature.
- Category 2. This pipeline used the tweet dataset without any filtering process, except those carried out when downloading through Twitter API; a simple cleanup is performed (similar to DEP-IND pipeline in Phase two) and a weekly tweet count.
- Category 3. This pipeline is the same one used in DEP-IND-C in the previous phase.
- Category 4. This pipeline used a tweet classifier through BERT algorithm [37]; labeling tweets related to users who are related to COVID-19 or ARI. The advantage of BERT over other word embedding methods like Word2Vec is its ability to generate vector representations for words based on the context of the entire sentencee [41]. The BERT version used is “bert-base-multilingual-cased”, since this can be used for the Spanish language. For example, other researchers used IndoBERT model for Indonesian language Kalanjati et al. [25]. Moreover, elimination of stopwords and tokenization were part of the cleaning process of this pipeline.
The final step of each pipeline involved training and testing the DeepAR model, a forecasting method based on autoregressive recurrent neural networks. This model is based on LSTM, which handle sequential data efficiently [35]. It was implemented using the Python GluonTS library [50] to forecast ARI and COVID-19 time series.
5. Results
This section presents the results from the proposed computational methodology, see Figure 2. First, we describe the performance metrics employed. Then, we present the results from each phase within the computational methodology.
5.1. Performance Metrics
To compare the results from the different three phases, and the forecast models used in them, two metrics were used: (i) the Maximum absolute percent error (MAPE), Equation (1), that indicates what is the maximum percent difference between the predicted and observed values; and (ii) Root mean squared error (RMSE), Equation (2), that measures the average differences between the predicted and observed values. As these indicators approach zero, the prediction values agree with the observed values [33].
5.2. Phase One
The results of phase two correspond to the prediction of 20% of the registered weeks (COVID-19 ans ARI cases), so the split is 80% training and 20% testing. The results are found in the Table 2. On average, ARI cases predictions are more accurate than those made for COVID-19. The models with lowest errors were Support Vector Machines, Neural Networks and Ordinary Least Squares; however, the margins of error were still high, see Table 2, which is why a second phase of testing was carried out in Dataiku with models more suitable for time series. In this type of prediction models, the value of the prediction depends completely on the value of the independent variables, in this case, tweets. Time series models allow integrating the history of the dependent variable itself to make the prediction; which contributes to greater accuracy in the results.
Table 2.
Results from Phase one, models performance (MAPE and RMSE).
5.3. Phase Two
For this phase the results are detailed for: (1) tweet selection and (2) time series forecasting.
5.3.1. Tweet Selection
In this phase, the process of selecting tweets according to their content was added. Besides the filters used in the Twitter API, we include Word2Vec, a Word Embeddings algorithm, to convert the word vectors to numerical vectors. Subsequently, a clustering model is applied to group and classify similar tweets. The KMeans model was used to cluster the tweets, with different tests varying k, between 3 and 7. Table 3 shows the tests performed and their respective silhouette metric.
Table 3.
Results from KMeans algorithm for different number of clusters k, the values correspond to the silhouette metric (the higher, the better).
While the silhouette metric is an important parameter, it is not the only factor to consider. Ensuring a good distribution of data across different clusters is essential, as a high silhouette value can still occur if all the data is concentrated in a single cluster. For this reason, the Kmeans k = 4 algorithm was chosen instead of k = 3.
The reason for including a clustering algorithm in the tweet selection process is to identify similar tweets that are not of interest to us. Since it is an unsupervised algorithm, manual review is avoided and only the clusters that need to be selected are identified.
We identified two clusters (Cluster 1, and Cluster Outliers) that contain tweets that do not correspond to publications by individuals, they could be government institutions, tweets not related to COVID-19 or ARI cases, or tweets that are not understandable. These two clusters were removed from the dataset used for the prediction. After this process, the number of selected tweets was reduced to 5317. Examples of these unselected clusters are shown below.
- Cluster 1, examples:
- (a)
- “status covid19 at san luis potosi. record infections, deaths. deaths: 143, infections, last [estatus covid19 san luis potosí. récord contagios fallecimientos. defunciones 143 contagios úl]”.
- (b)
- “status covid19 at san luis potosi sum up 2068 infections and 228 deaths. [estatus covid19 san luis potosí suman 2068 contagios 128 decesos.]”.
- (c)
- “status covid19 at san luis potosi 168 new infections deaths in last hours [estatus covid19 san luis potosi 168 nuevos contagios muertes últimas horas]”.
- Cluster Outliers, examples:
- (a)
- “@drmanuelortho @bulletgabo @salazartrejo @dimensionamural @rouge7475 @jhonlinx @random3e @lalizlizliz…”.
- (b)
- “@aaptmx inscripciones abiertas”.
- (c)
- “@luisoncastaneda @gervivamexico @eddcampe @lopezobrador @claudiashein @mebrard aclaren medicinas”.
5.3.2. Time Series Forecasting
Table 4 and Table 5 contain a summary of the results, where Table 4 has the results from ARI data and Table 5 contains results from COVID-19. Both tables contain six columns of results on the average MAPE metric, because the experiment for each predicting model was performed fifteen times. The “DEP” column corresponds to the results of the pipeline with only the dependent variable, the “DEP-IND” column corresponds to the pipeline with the dependent variable and the feature weekly tweets count; and finally the “VAR” or “VAR-C” column corresponds to the difference between “DEP” and “DEP-IND” (or “DEP-C” and “DEP-IND-C”); a positive result indicates that adding the independent variable improved the outcome, while a negative result suggests that the independent variable actually worsened the prediction results. In the results for the COVID-19 cases time series, the tweets feature shows little to no positive impact on the forecast in nearly all instances, “VAR” is close to zero. On the other hand, for the ARI cases time series, the DeepAR prediction model obtained an improvement of 18.56% due to the tweets feature in “DEP-IND” pipeline, and 16.74% in “DEP-IND-C” pipeline.
Table 4.
ARI Forecasting results.
Table 5.
COVID-19 Forecasting results.
5.4. Phase Three
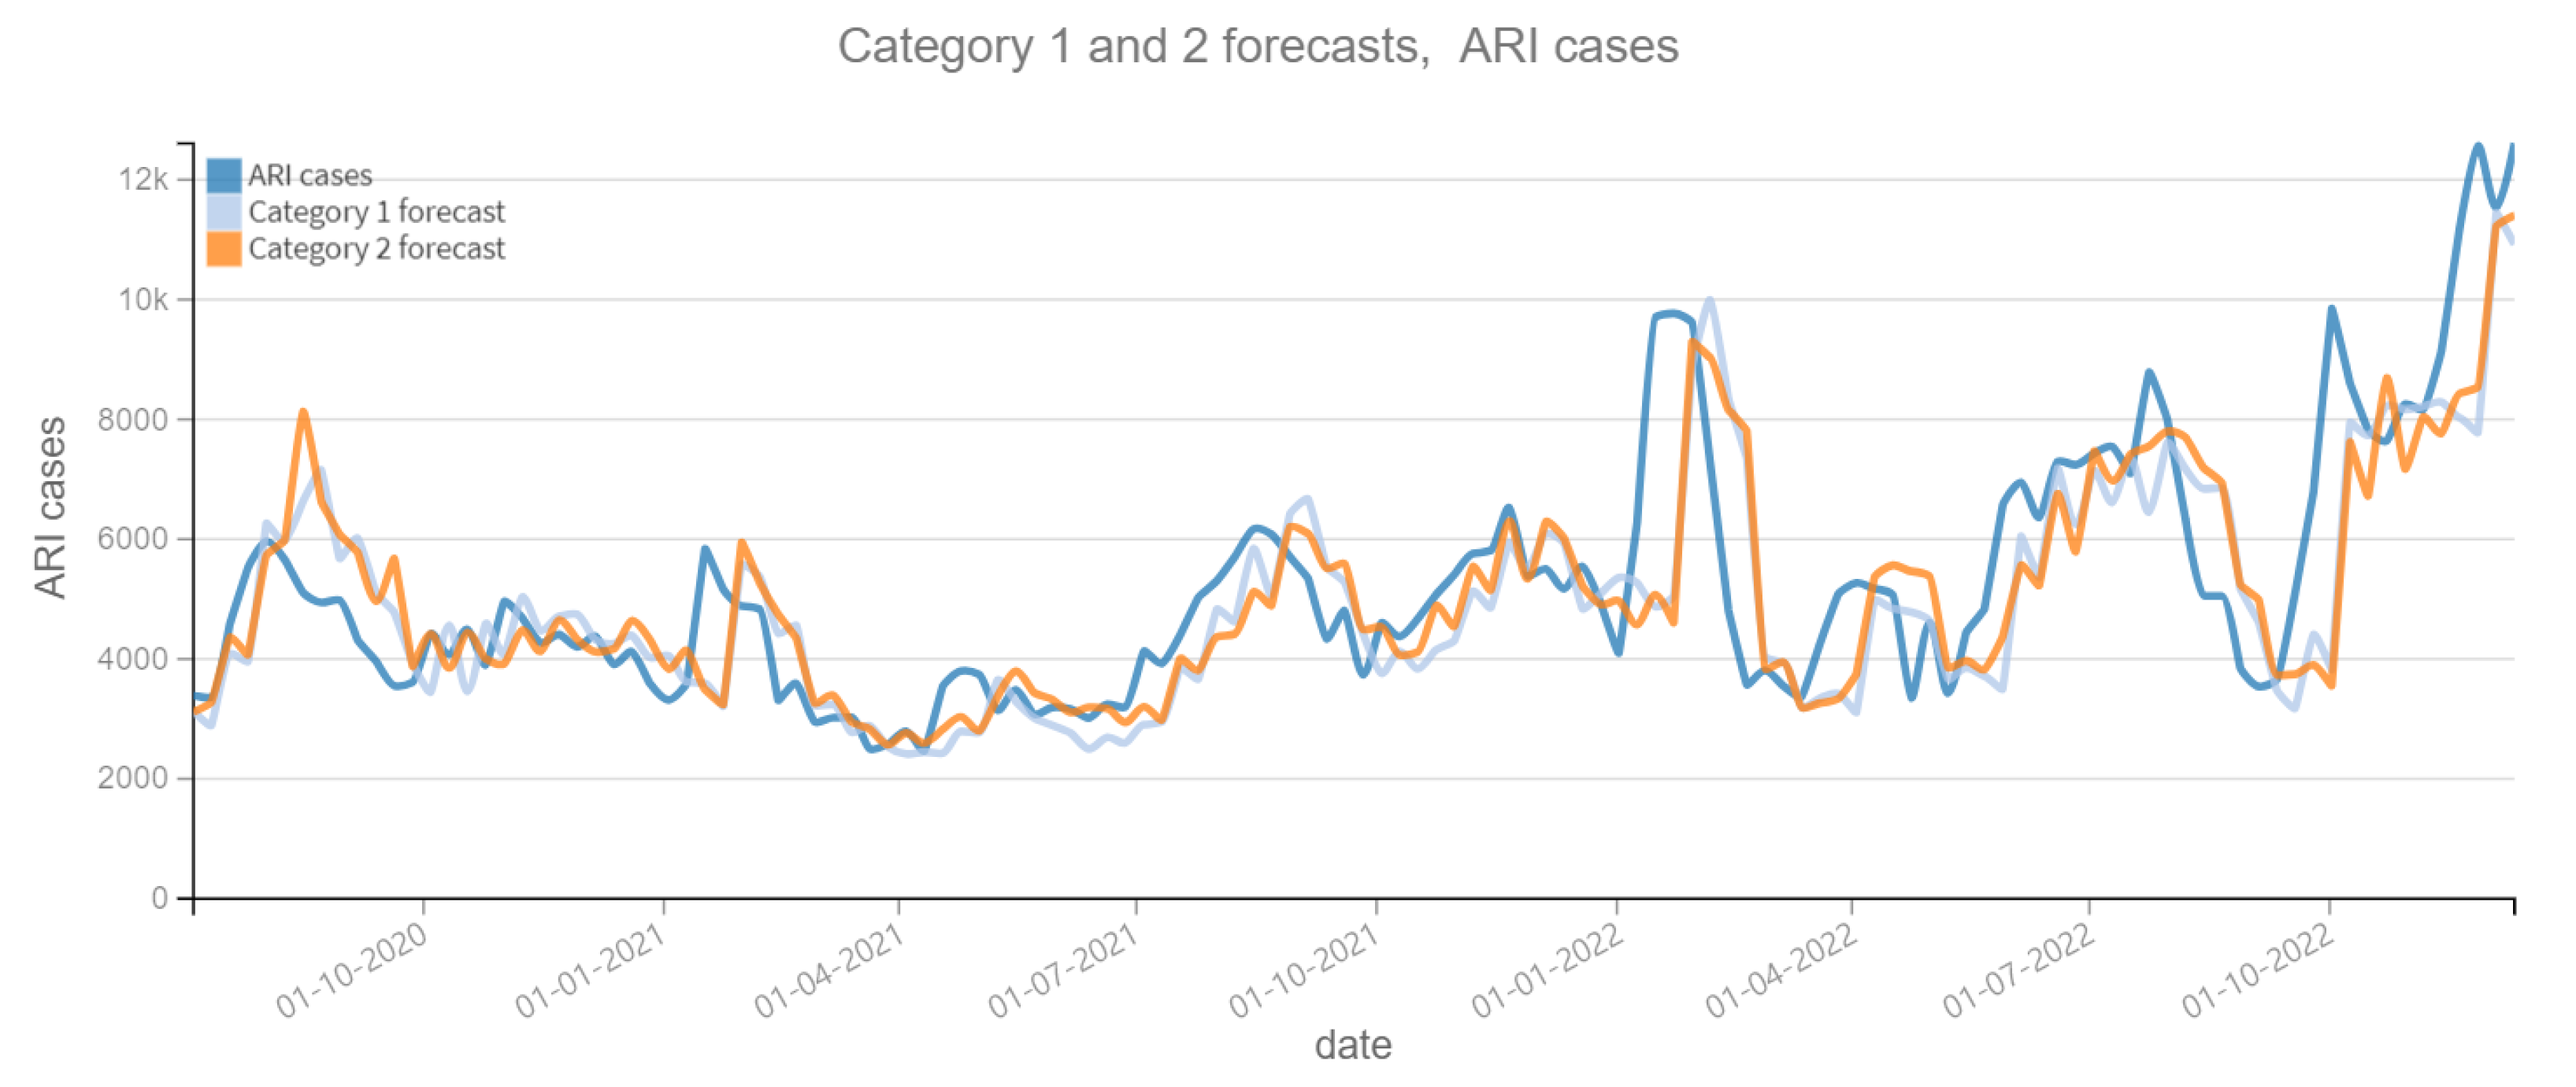
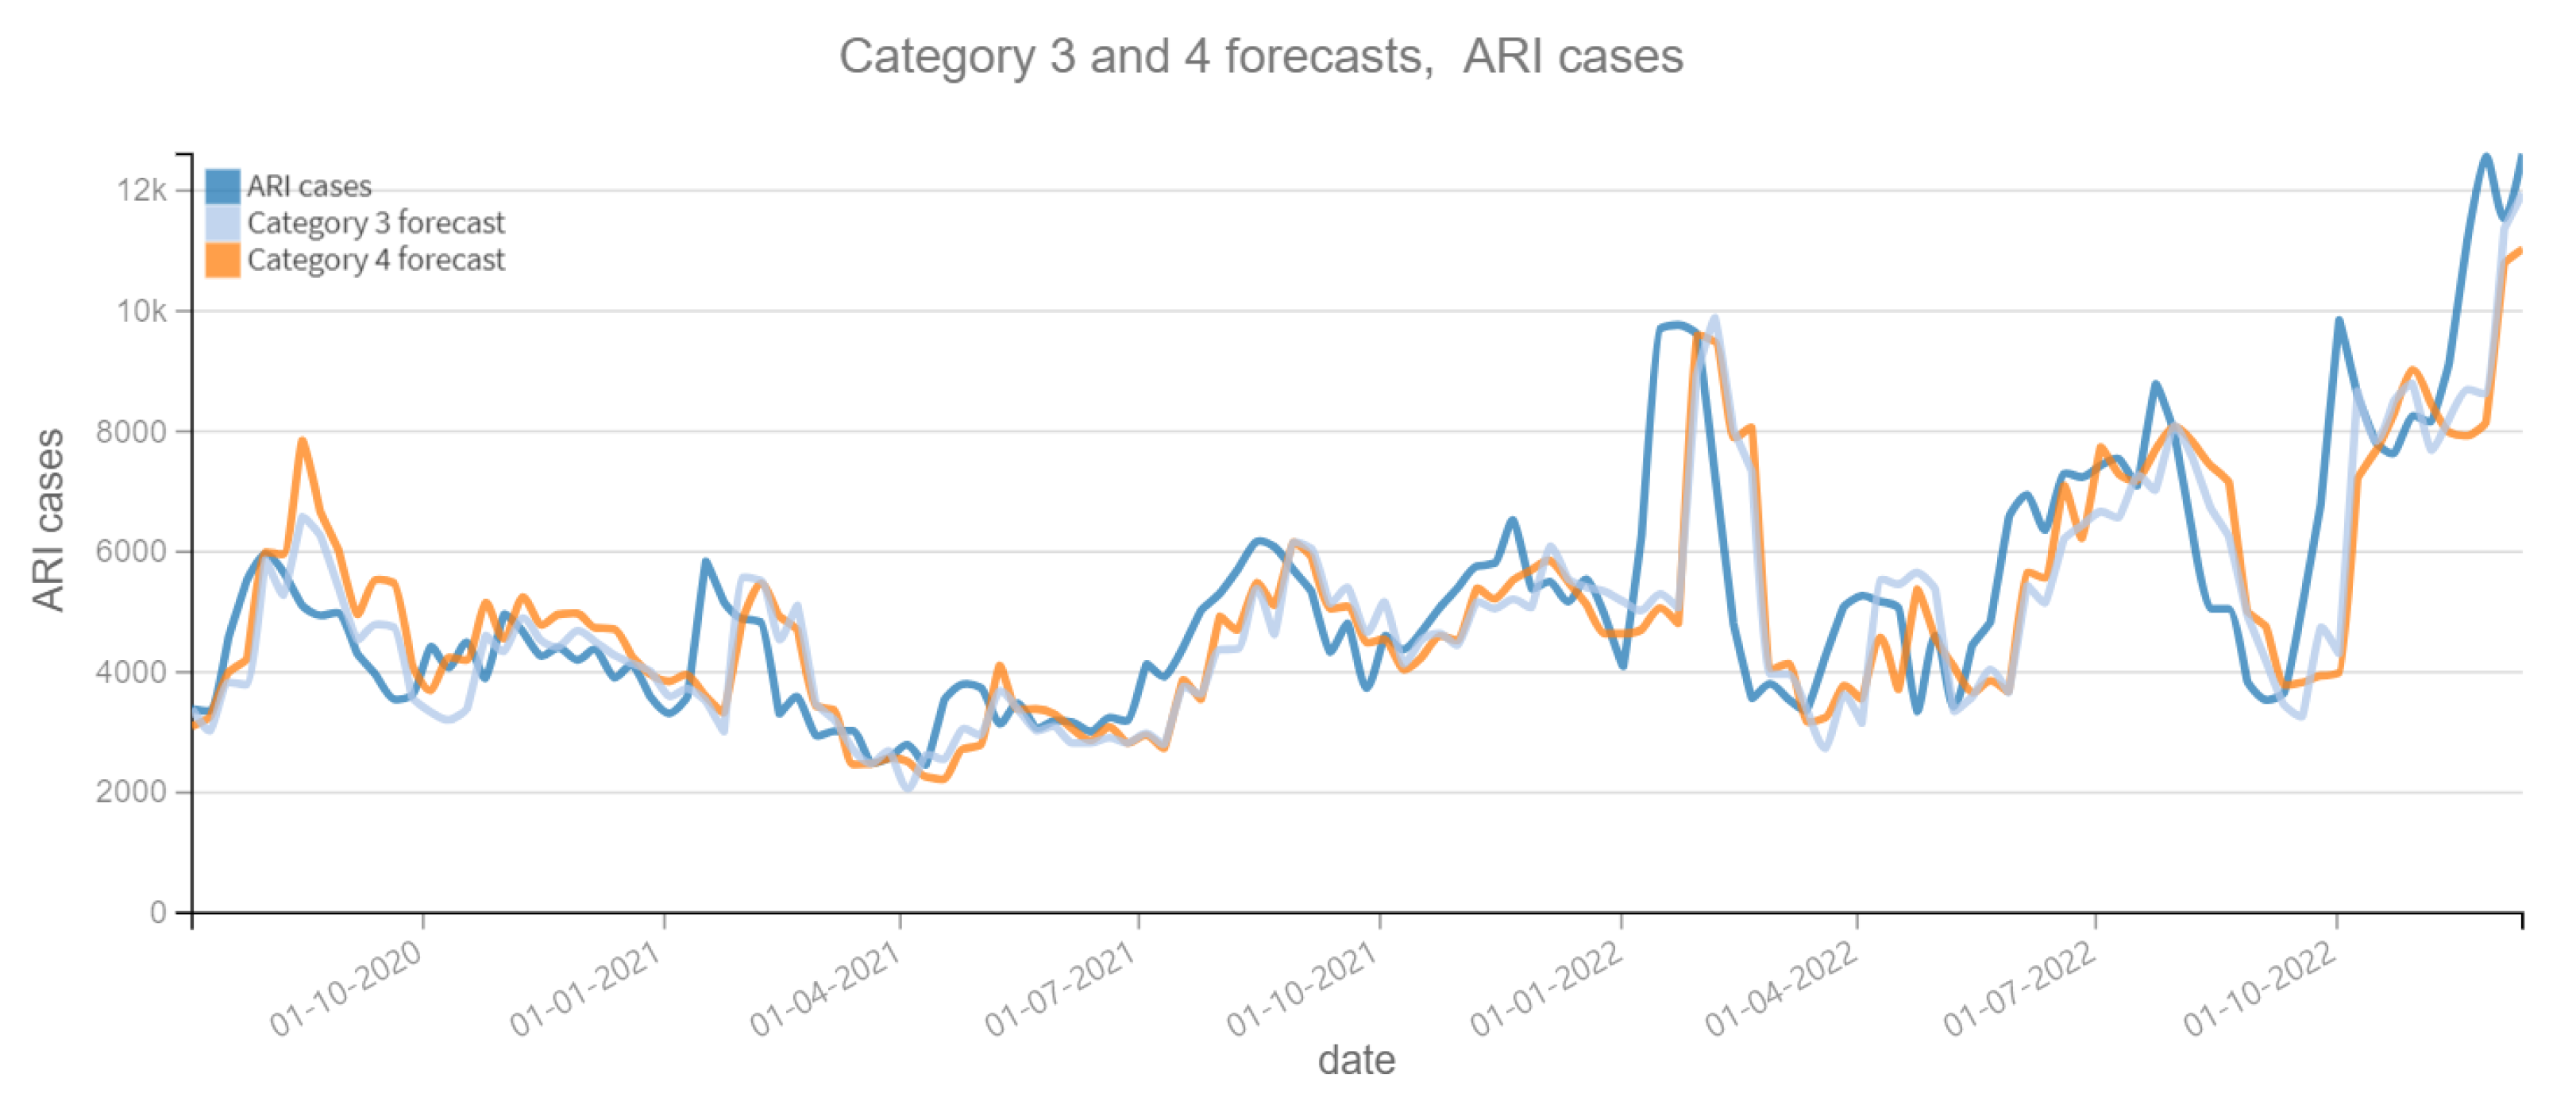
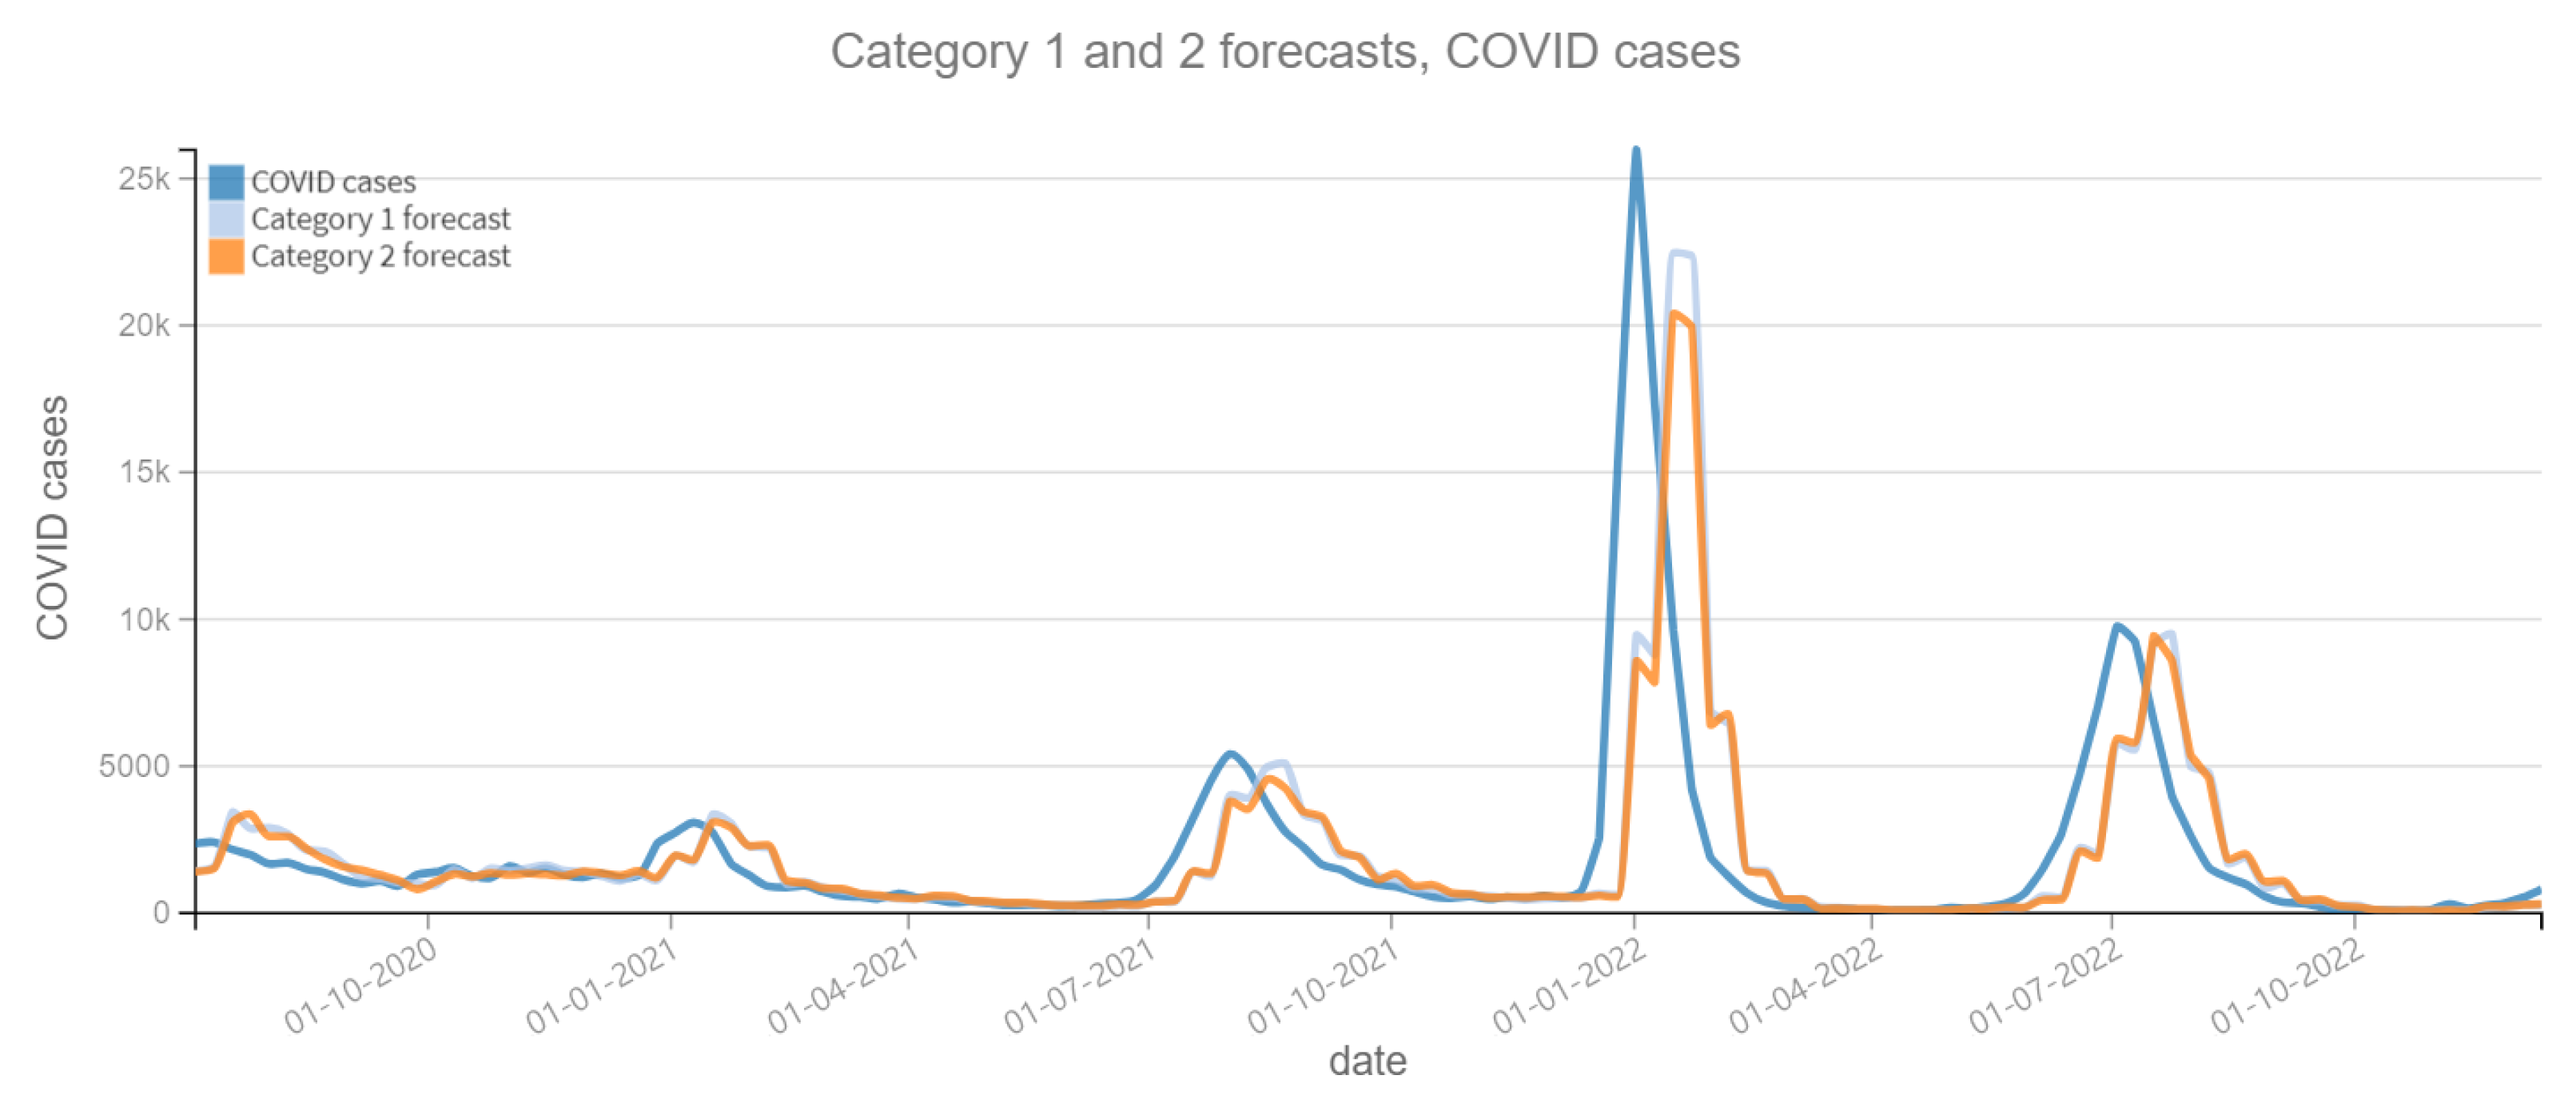
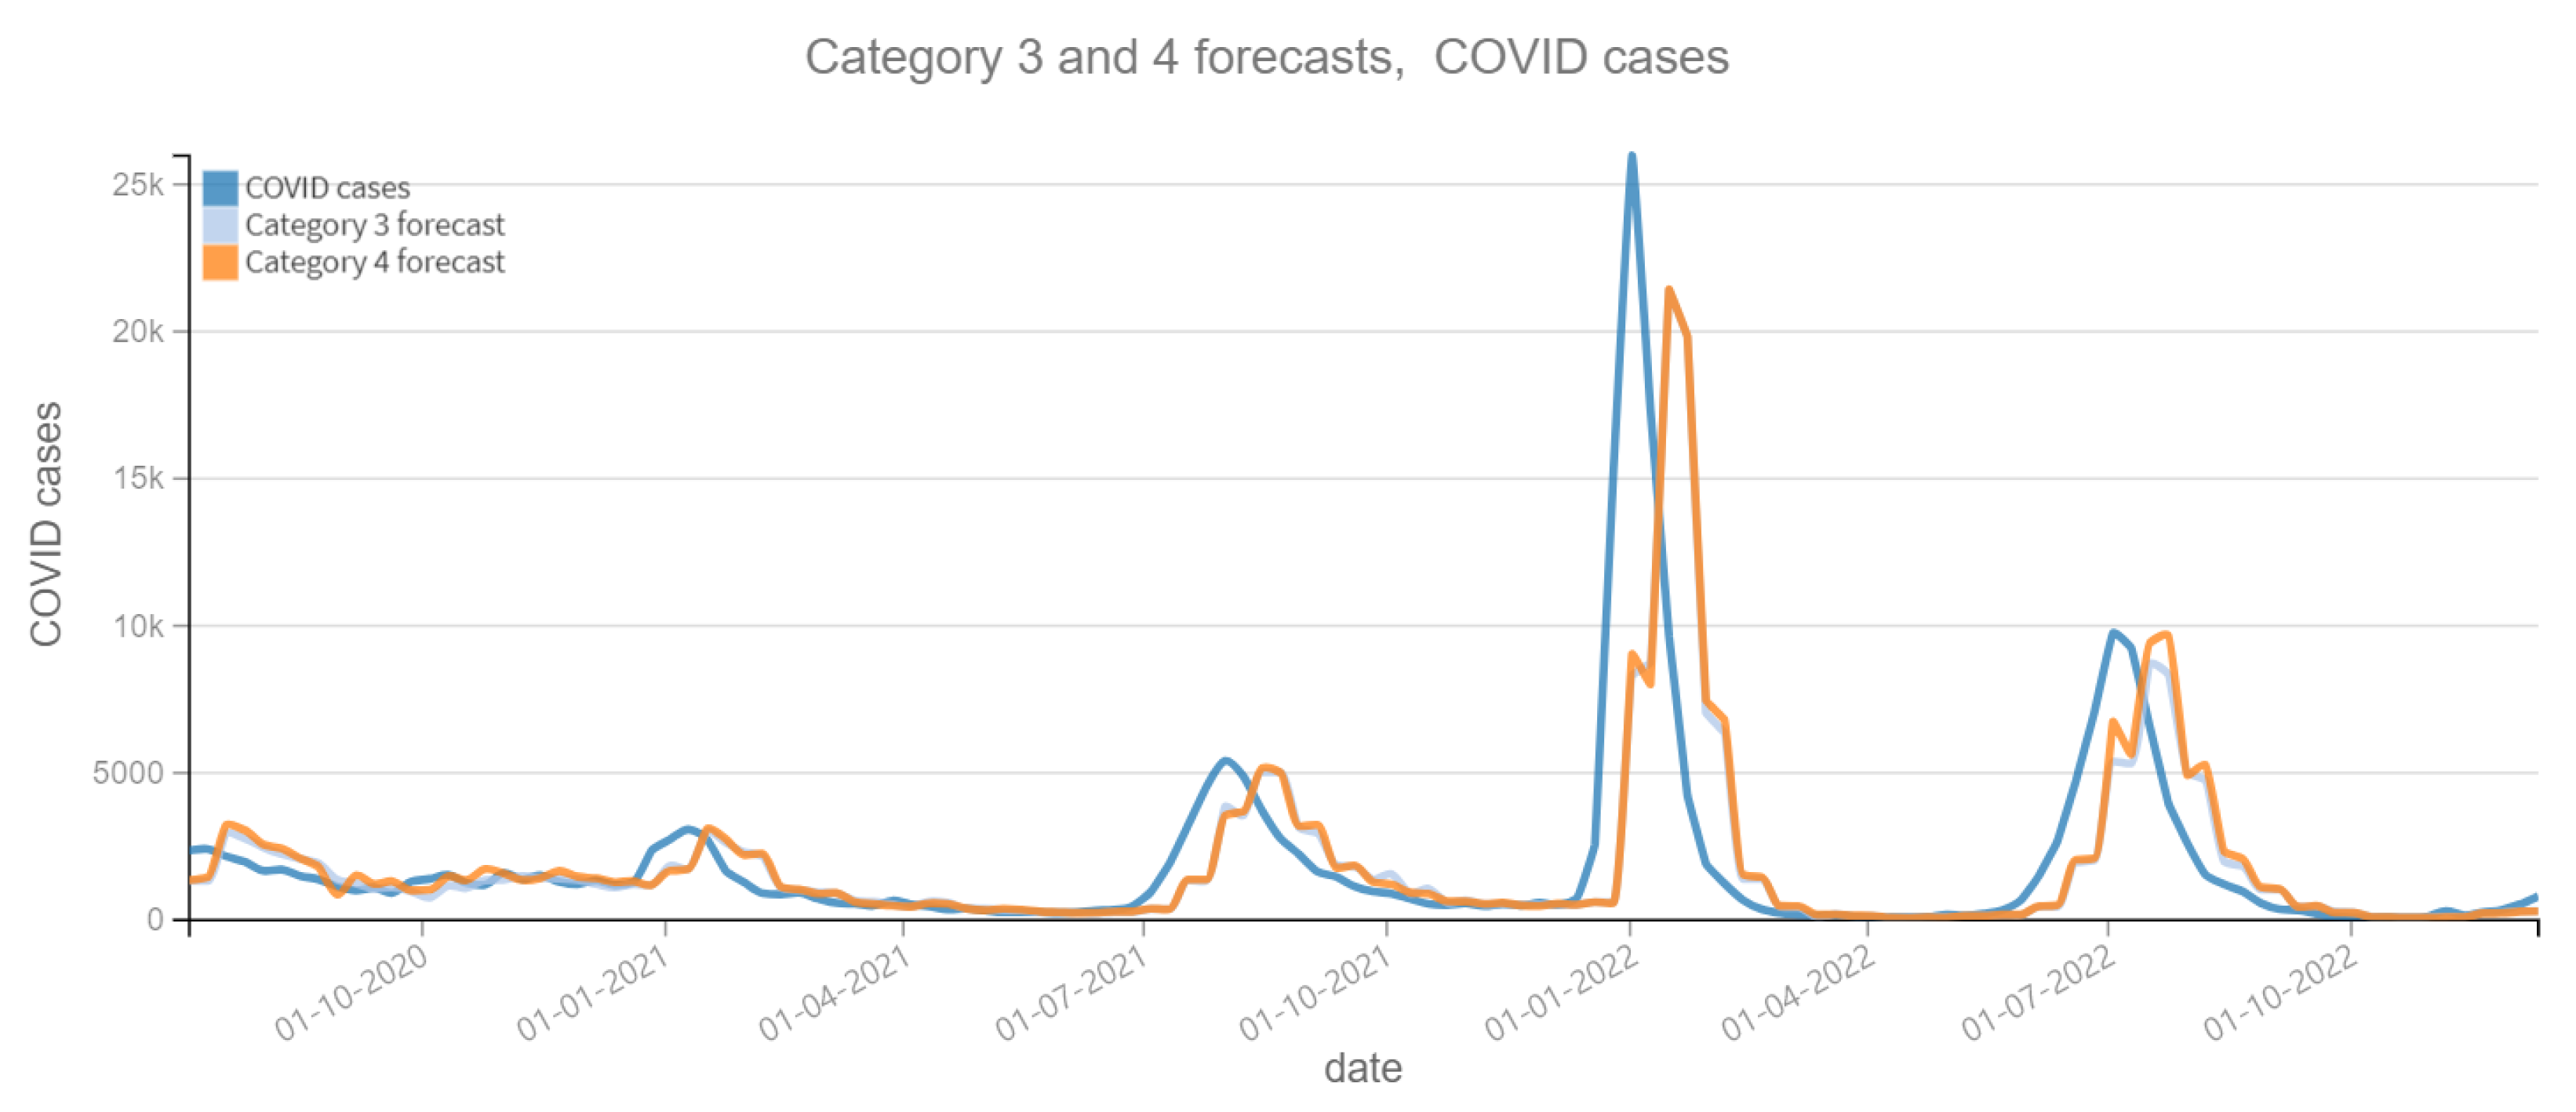
The results of the four categories into which this phase is divided are described below. Figure 6 and Figure 7 depict the predictions for the four categories with respect to confirmed ARI cases. Figure 8 and Figure 9 depict the confirmed cases of COVID-19. Category 1 refers to forecasts made using the historical data of the dependent variable (COVID-19 cases or ARI). On the other categories, the tweet count is added to the prediction calculations; varying the tweet filtering procedure depending on the category. Therefore, the independent variable “tweets” is expected to improve the prediction, otherwise it is not necessary. Figure 6, Figure 7, Figure 8 and Figure 9 reveal a slight lag in the predictions, which is typical of time series prediction models. This occurs because the model learns the representative patterns of the time series and replicates them in its predictions, and occasionally with some delay.
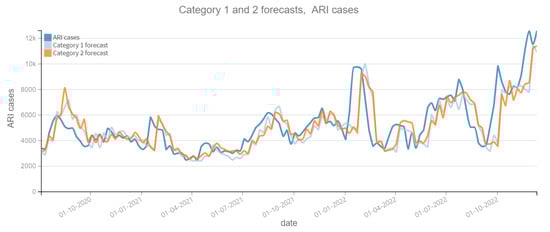
Figure 6.
Positive ARI cases per week vs Forecast, Category 1 and 2 (2020–2022). Category 1: target variable without features. Category 2: target and tweets feature without filter.
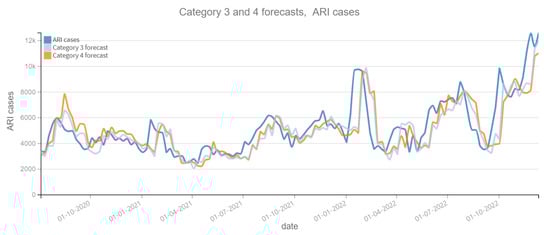
Figure 7.
Positive ARI cases per week vs Forecast, Category 3 and 4 (2020–2022). Category 3: target and tweets feature with Kmeans filter. Category 4: target and tweets feature with BERT filter.
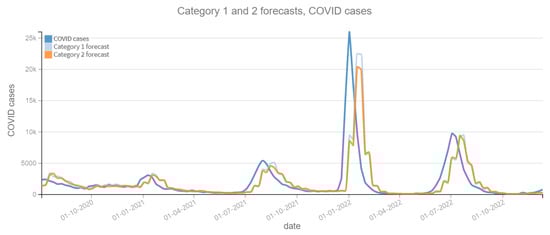
Figure 8.
Positive COVID cases per week vs Forecast, Category 1 and 2 (2020–2022). Category 1: target variable without features. Category 2: target and tweets feature without filter.
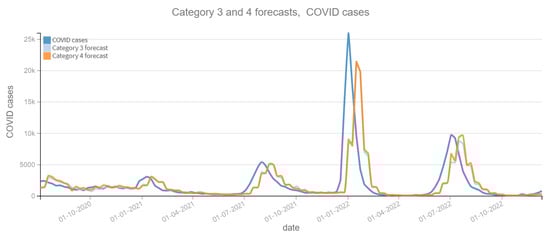
Figure 9.
Positive COVID cases per week vs Forecast, Category 3 and 4 (2020–2022). Category 3: target and tweets feature with Kmeans filter. Category 4: target and tweets feature with BERT filter.
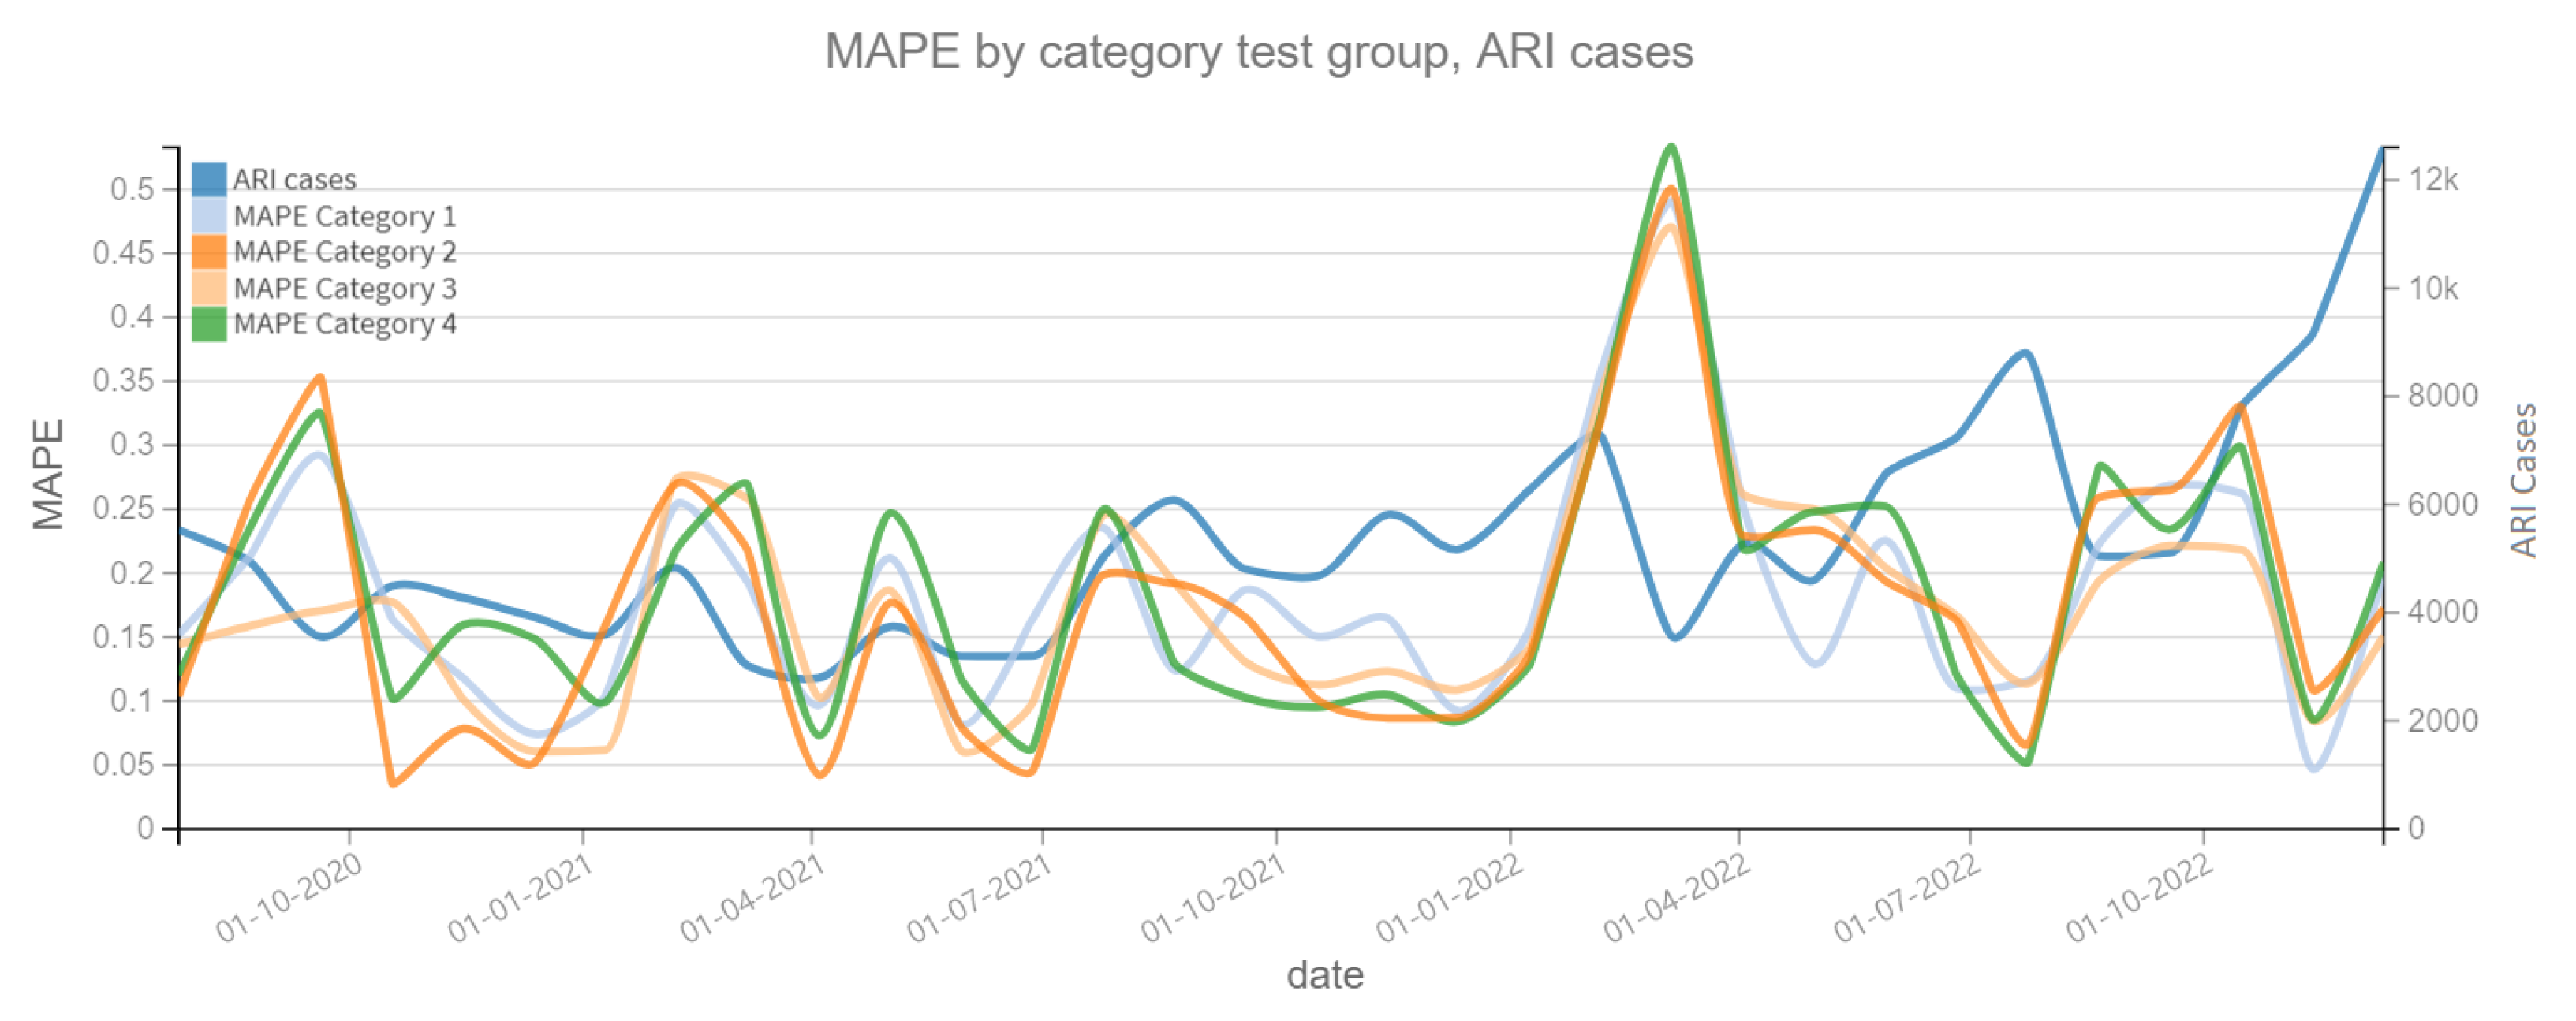
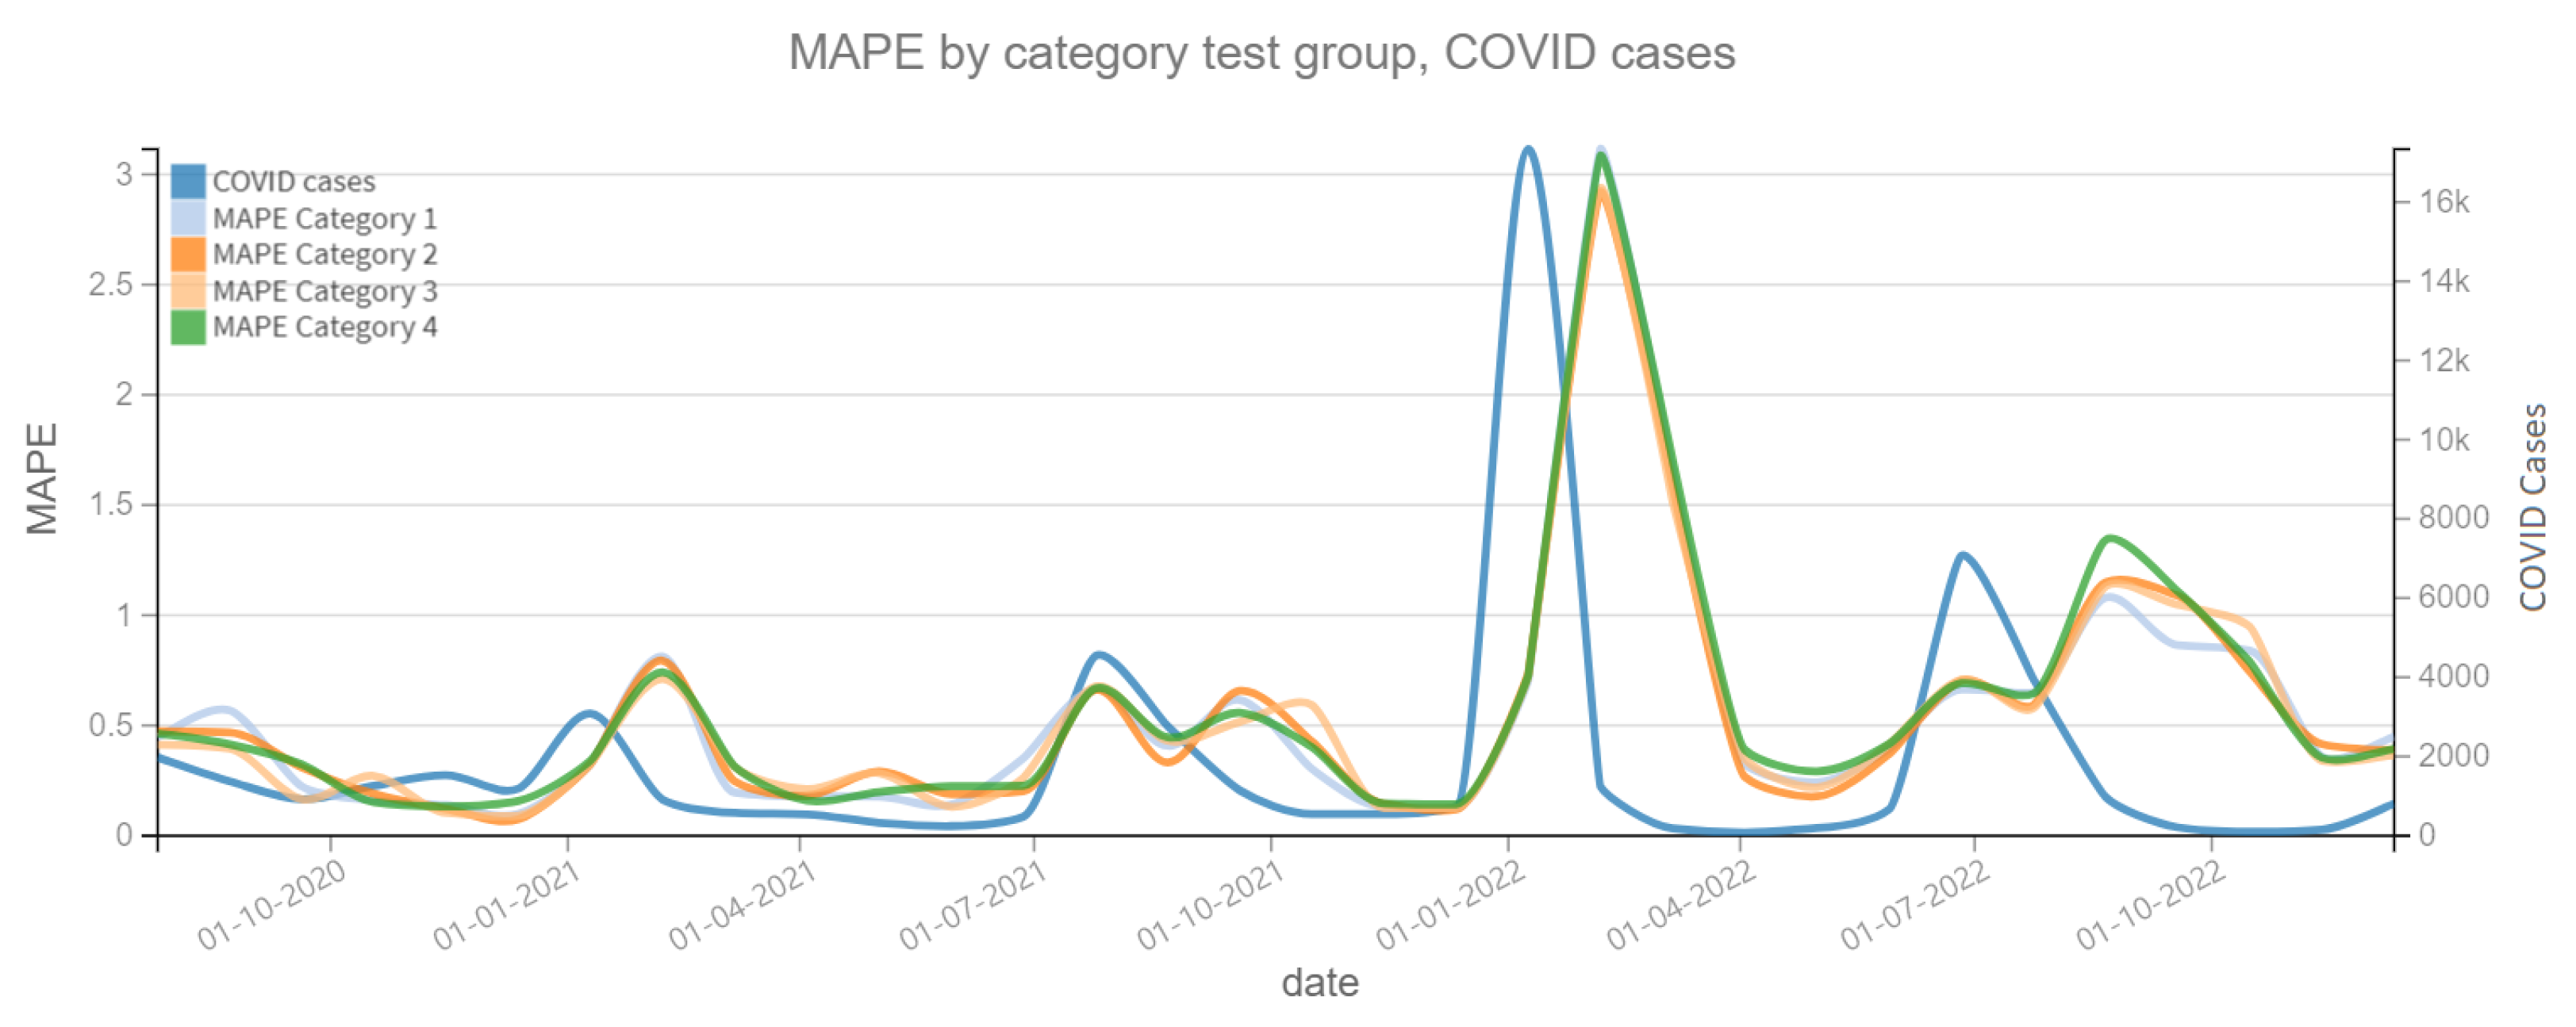
Figure 10 shows the MAPE on the prediction of the dependent variable confirmed cases of ARI, where a change is observed in the patterns of each model category. For example, for the period close to 1 January 2021 it is observed that the Category 2 model clearly improves the prediction by having a lower MAPE. In both plots, the dependent variable (confirmed cases of ARI and COVID-19) is also shown to assess whether there is a correlation between the slope changes of the dependent variable and the MAPE prediction error. On the other hand, Figure 11 shows the MAPE metric for test periods of 4 weeks. In the forecast of the variable confirmed COVID-19 cases, it can be noted that the four categories of models have the same behavior in this metric, which implies that the variable Independent “tweets” does not contribute enough to improve the model.

Figure 10.
MAPE results, ARI cases (2020–2022). Category 1. Target variable without features. Category 2. Target and tweets feature without filter. Category 3. Target and tweets feature with Kmeans filter. Category 4. Target and tweets feature with BERT filter.
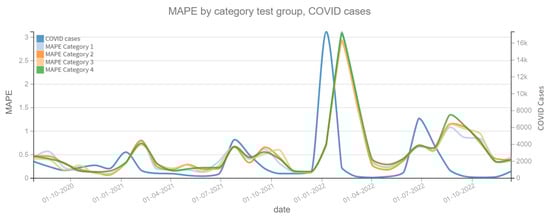
Figure 11.
MAPE results, COVID cases (2020–2022). Category 1. Target variable without features. Category 2. Target and tweets feature without filter. Category 3. Target and tweets feature with Kmeans filter. Category 4. Target and tweets feature with BERT filter.
Table 6 contains the MAPE and RMSE values, over the entire prediction period (28 June 2020 to 25 December 2022). For the dependent variable ARI confirmed cases, the Category 3 shows the best performance, with the lowest MAPE (0.1746) and RMSE (1346.50). And for the variable COVID-19 confirmed cases, the best performance corresponds to the Category 2, with the lowest MAPE (0.5419) and RMSE (3048.52). It can be noted that the variation of the MAPE and RMSE between the different models is not substantial in the dependent variable COVID-19 confirmed cases, while for the variable ARI confirmed cases it is only ±1%. This can be interpreted that there is a little contribution of the “tweets” variable to improve the prediction of the dependent variables.
Table 6.
MAPE and RMSE of each forecast category.
Table 7 shows the difference between the MAPE of the Category 1 model predictions (dependent variable only) and the other categories. The objective is to observe the contribution of the “tweets” variable to the accuracy of the predictions. If the result is positive, it means that the model with the “tweets” variable has a lower MAPE and therefore the prediction is more accurate. Otherwise, the “tweets” variable worsens the prediction. In 2020, the Category 3 model has the better performance of 0.0333 for the prediction of the ARI variable and 0.0325 for the COVID-19 variable, as a percentage it means approximately 3% improvement over the Category 1 model. For subsequent years it is not observed a significant improvement, so it can be concluded that in the first year of the pandemic, reading the tweets did represent an aid in the prediction. Something that did not happen in the following years.
Table 7.
MAPE difference between Category 1 and Categories 2, 3, 4.
Comparing Figure 7 and Figure 8, we can see that the scale in the number of cases is different for ARI and COVID-19. Therefore, the datasets were normalized and the experiments repeated to see the effect in the data scale. We use StandardScaler method of the Python Scikit-learn library (https://scikit-learn.org/), which removes the mean and then scales to unit variance. The results are in Table 8, and they must be compared with Table 6. For all tests there is no improvement except in Category 2 (COVID-19), which is not representative, only 0.0069 of difference in MAPE.
Table 8.
MAPE and RMSE of each forecast category, standardized features.
6. Conclusions
We introduce a computational methodology to predict acute respiratory infections with social media (Twitter) and ML algorithms, which is composed of three phases. The different phases allow us to compare various ML models applied to the processing of tweets and their subsequent use as a predictors in respiratory diseases. Although the main idea was to establish the bases of tweet analysis to extend it to other scenarios and applications, the results obtained help us understand the possible difficulties and limitations of using tweets as a predictive variable. The results of the first phase showed us that the use of the tweet count as an independent variable in the prediction of respiratory diseases (COVID-19 and ARI) alone is not enough. The best result is a MAPE error of 0.475 with Support Vector Machines on ARI cases. On the other hand, prediction models (time series) that involve the history of the dependent variable obtain better results, which corresponds to Phase two and Phase three. In Phase two, we found the following: (a) COVID-19, in two of three models the independent variable does not improve the model, it even worsens it. (b) The only algorithm that shows an improvement is Feed Forward, see Table 5. (c) The contribution of the tweet count as an independent variable is clearly better in the predictions for the ARI time series, compared to COVID-19. (d) In ARI time series predictions, the DeepAR algorithm is by far the best of the three models. (e) The process of clustering and filtering the tweets does not represent any prediction improvement in this phase.
The Phase three focus on the analysis of the DeepAR model with different preprocessing approaches for Twitter data: Categories 2 to 4, see Figure 5. We found that for three years of analysis, the “tweets” variable is only representative in the predictions of confirmed ARI cases. So, the model that obtained the best result is with the pipeline “Category 3” (Word Embedding and Kmeans procedure), which is related to ARI cases prediction, see Table 6 and Table 7. “Category 3” helps to highlight that NLP and the selection of tweets represents an improvement in the prediction results, although it only had an improvement of 1.01% compared to the prediction without the use of the tweets variable. In the second half of 2020, the inclusion of the tweets variable improved prediction accuracy by approximately 3% for both ARI and COVID-19 confirmed cases. This suggests that information shared in tweets was representative at the onset of the pandemic but became less relevant over time.
Given the nature of the datasets, we cannot compare this research directly with other papers. Because, other researches use data of different regions, dates and diseases. Nevertheless, several contributions arise. The broad study on Twitter Data, ARI Data and COVID-19 Data, allow us to identify the best preprocessing techniques for Twitter Data, and the best ML predictive model, DeepAR. Twitter Data presents challenges due to the need for text mining, making this research valuable for others working in similar areas.
Moreover, the proposed computational methodology can be used for other data sources to identify the best ML predictive models along with Twitter data to predict time series. It can be applied to other fields, such as finance, energy, and others that utilize time series data.
6.1. Limitations
There are several limitations when using social network data in research. The primary challenge we faced was restricted access to tweets, as the Twitter API account used had a download limit of 5000 tweets per month. Additionally, the downloaded tweets may not fully represent the analyzed population (San Luis Potosí, Mexico) in terms of both geographic distribution and demographic diversity.
The API query used to download tweets included seven keywords related to ARI and COVID-19. However, this presents a limitation in capturing relevant tweets, as there may be other terms or regional idioms used to refer to these diseases. Additionally, the vocabulary used by social media users to describe the same illness may change over time.
Tweet collection was restricted to Spanish-language posts, and specific libraries for text cleaning and processing were configured accordingly. The analysis of tweets in other languages is beyond the scope of this research, although it is feasible to adjust the parameters to support additional languages.
In this study, NLP techniques were incorporated alongside BERT (for classification) and K-means (for clustering) to identify tweets from individuals who have experienced or are experiencing respiratory diseases (ARI or COVID-19). However, some False Positives may still be present among the selected tweets. To improve accuracy in filtering out False Positives, a more in-depth analysis of tweet context using specialized NLP techniques is needed.
The selection of machine learning models in Phase 1 and 2 was limited to those available in Dataiku. While this platform offers a wide range of clustering and time series forecasting models, the inability to conduct comparative tests with models outside its framework remains a limitation.
Another constraint is the potential loss of contextual information in tweets due to the removal of emoticons, non-alphanumeric symbols, and pictorial characters, as these elements may carry additional or essential meaning for accurate tweet classification.
6.2. Future Research
The Twitter Data corresponds only to the state of San Luis Potosí, México, so a more extensive analysis including different cities in Mexico and other countries would provide a more accurate conclusions about the usefulness of tweets as a variable to predict respiratory diseases. Also, longer time series than 2020–2022 could yield different results than the recent outbreak.
Analyzing tweets in other languages presents an opportunity for deeper comparative studies across different regions or within multilingual areas. A key challenge for multilingual support is the availability of text processing libraries, such as NLTK, for the target language.
Additionally, the vocabulary used to describe diseases is extensive and constantly evolving. A valuable research avenue involves analyzing word usage, expression patterns, and regional idioms. However, conducting such an analysis would require access to a larger volume of tweets.
On the other hand, those interested in conducting research with Twitter data (now X) should consider the new limitations on data downloading, due to the new policies implemented in the new company. So, other sources of social media data must be explored, since social media data improves the prediction. Additionally, classifying tweets is a difficult task, since it involves advanced NLP techniques. Algorithms such as Word Embeddings and BERT classification models require large datasets to perform well, so it is still a research area finding algorithms for small datasets.
Finally, we only focused on mining text in tweets, but today they are frequently accompanied by images and emoticons. So, a joint analysis of these different forms of communication (text and images) is an opportunity to improve the interpretation of tweets, and to be able to classify them better accuracy.
Author Contributions
Conceptualization, J.C.C.-T. and D.E.N.; methodology, J.M.R.-V.; software, J.M.R.-V.; validation, J.C.C.-T. and D.E.N.; formal analysis, J.M.R.-V.; investigation, J.M.R.-V.; data curation, J.M.R.-V.; writing—original draft preparation, J.M.R.-V., J.C.C.-T. and D.E.N.; visualization, J.M.R.-V.; supervision, J.C.C.-T. and D.E.N. All authors have read and agreed to the published version of the manuscript.
Funding
This research received no external funding.
Institutional Review Board Statement
Not applicable.
Informed Consent Statement
Not applicable.
Data Availability Statement
The dataset used in this research are publicly available by the original authors. Twitter Data can be obtained from the Twitter API and its Python library Tweepy [44]. ARI Data and COVID-19 Data is available through the General Directorate of Epidemiology which belongs to the Mexican Health Ministry (known as Secretaría de Salud). The information reported by this agency includes ARI [46] and COVID-19 cases [47]. Preprocessed data is also available upon request.
Acknowledgments
J.M.R.-V. would like to thank his research committee for the feedback during this research.
Conflicts of Interest
The authors declare no conflicts of interest.
Abbreviations
The following abbreviations are used in this manuscript:
| ARI | Acute Respiratory Infections |
| API | Application Programming Interface |
| COVID-19 | Coronavirus Disease, formally known as SARS-CoV-2 |
| SARS-CoV-2 | Severe Acute Respiratory Syndrome Coronavirus 2 |
| ML | Machine Learning |
| NLP | Natural Language 9 Processing |
| KNN | k-Nearest Neighbors |
| SVM | Support Vector Machines |
| DeepAR | Deep Autoregressive Recurrent networks |
| LSTM | Long Short Term Memory |
| CNN | Convolutional Neural Networks |
| Word2Vec | Word to Vector technique |
| BERT | Bidirectional Encoder Representations from Transformers |
| MAPE | Maximum Absolute Percent Error |
| RMSE | Root Mean Squared Error |
| DEP | DEPendent variable, a dataset in Phase two. |
| DEP-IND | DEPendent and INDependet variables, a dataset in Phase two. |
| DEP-IND-C | DEPendent and INDependet variables with Clustering, a dataset in Phase two. |
| VAR | VARiable difference between DEP and DEP-IND |
| VAR-C | VARiable difference between DEP and DEP-IND-C |
References
- Pilipiec, P.; Samsten, I.; Bóta, A. Surveillance of communicable diseases using social media: A systematic review. PLoS ONE 2023, 18, e0282101. [Google Scholar] [CrossRef] [PubMed]
- Nunes, M.; Thommes, E.; Fröhlich, H.; Flahault, A.; Arino, J.; Baguelin, M.; Biggerstaff, M.; Bizel-Bizellot, G.; Borchering, R.; Cacciapaglia, G.; et al. Redefining pandemic preparedness: Multidisciplinary insights from the CERP modelling workshop in infectious diseases, workshop report. Infect. Dis. Model. 2024, 9, 501–518. [Google Scholar] [CrossRef] [PubMed]
- Velasco, E.; Agheneza, T.; Denecke, K.; Kirchner, G.; Eckmanns, T. Social media and internet-based data in global systems for public health surveillance: A systematic review. Milbank Q. 2014, 92, 7–33. [Google Scholar] [CrossRef] [PubMed]
- World Health Organization, Regional Office for the Western Pacific. A Guide to Establishing Event-Based Surveillance; WHO Regional Office for the Western Pacific: Geneva, Switzerland, 2008; 21p. [Google Scholar]
- McKee, M.; Rosenbacke, R.; Stuckler, D. The power of artificial intelligence for managing pandemics: A primer for public health professionals. Int. J. Health Plan. Manag. 2024, 40, 257–270. [Google Scholar] [CrossRef]
- Liang, J.; Liu, R.; He, W.; Zeng, Z.; Wang, Y.; Wang, B.; Liang, L.; Zhang, T.; Chen, C.L.P.; Chang, C.; et al. Infection rates of 70 after release of COVID-19 restrictions in macao, china. J. Infect. 2023, 86, 402–404. [Google Scholar] [CrossRef]
- Fallatah, D.; Adekola, H. Digital Epidemiology: Harnessing Big Data For Early Detection And Monitoring Of Viral Outbreaks. Infect. Prev. Pract. 2024, 6, 100382. [Google Scholar] [CrossRef]
- Charles, L.; Reynolds, T.; Cameron, M.; Conway, M.; Lau, E.; Olsen, J.; Pavlin, J.; Shigematsu, M.; Streichert, L.; Suda, K.; et al. Using Social Media for Actionable Disease Surveillance and Outbreak Management: A Systematic Literature Review. PLoS ONE 2015, 10, e0139701. [Google Scholar] [CrossRef]
- Gupta, A.; Katarya, R. Social Media based Surveillance Systems for Healthcare using Machine Learning: A Systematic Review. J. Biomed. Inform. 2020, 108, 103500. [Google Scholar] [CrossRef]
- Wang, Y.; McKee, M.; Torbica, A.; Stuckler, D. Systematic Literature Review on the Spread of Health-related Misinformation on Social Media. Soc. Sci. Med. 2019, 240, 112552. [Google Scholar] [CrossRef]
- Giancotti, M.; Lopreite, M.; Mauro, M.; Puliga, M. Innovating health prevention models in detecting infectious disease outbreaks through social media data: An umbrella review of the evidence. Front. Public Health 2024, 12, 1435724. [Google Scholar] [CrossRef]
- George, D.; Taylor, W.; Shaman, J.; Rivers, C.; Paul, B.; O’Toole, T.; Johansson, M.; Hirschman, L.; Biggerstaff, M.; Asher, J.; et al. Technology to advance infectious disease forecasting for outbreak management. Nat. Commun. 2019, 10, 3932. [Google Scholar] [CrossRef] [PubMed]
- Dai, X.; Bikdash, M.; Meyer, B. From social media to public health surveillance: Word embedding based clustering method for twitter classification. In Proceedings of the SoutheastCon 2017, Concord, NC, USA, 30 March–2 April 2017; pp. 1–7. [Google Scholar] [CrossRef]
- Talvis, K.; Chorianopoulos, K.; Kermanidis, K. Real-time monitoring of flu epidemics through linguistic and statistical analysis of Twitter. In Proceedings of the 9th International Workshop on Semantic and Social Media Adaptation and Personalization, SMAP 2014, Corfu, Greece, 6–7 November 2014; pp. 83–87. [Google Scholar] [CrossRef]
- Hirose, H.; Wang, L. Prediction of infectious disease spread using Twitter: A case of influenza. In Proceedings of the 2012 Fifth International Symposium on Parallel Architectures, Algorithms and Programming, Taipei, Taiwan, 17–20 December 2012; pp. 100–105. [Google Scholar] [CrossRef]
- Nagar, R.; Yuan, Q.; Freifeld, C.; Santillana, M.; Nojima, A.; Chunara, R.; Brownstein, J. A Case Study of the New York City 2012-2013 Influenza Season With Daily Geocoded Twitter Data From Temporal and Spatiotemporal Perspectives. J. Med. Internet Res. 2014, 16, e236. [Google Scholar] [CrossRef] [PubMed]
- Zuccon, G.; Khanna, S.; Nguyen, A.; Boyle, J.; Hamlet, M.; Cameron, M. Automatic detection of tweets reporting cases of influenza like illnesses in Australia. Health Inf. Sci. Syst. 2015, 3, S4. [Google Scholar] [CrossRef] [PubMed]
- Santos, J.C.; Matos, S. Analysing Twitter and web queries for flu trend prediction. Theor. Biol. Med Model. 2014, 11, S6. [Google Scholar] [CrossRef]
- Prieto, V.; Matos, S.; Alvarez, M.; Cacheda, F.; Oliveira, J. Twitter: A Good Place to Detect Health Conditions. PLoS ONE 2014, 9, e86191. [Google Scholar] [CrossRef]
- Jiang, J.; Yao, C.; Song, X. A multidimensional comparative study of help-seeking messages on Weibo under different stages of COVID-19 pandemic in China. Front. Public Health 2024, 12, 1320146. [Google Scholar] [CrossRef]
- Agrawal, S.; Jain, S.; Sharma, S.; Khatri, A. COVID-19 Public Opinion: A Twitter Healthcare Data Processing Using Machine Learning Methodologies. Int. J. Environ. Res. Public Health 2022, 20, 432. [Google Scholar] [CrossRef]
- Ueda, R.; Han, F.; Zhang, H.; Aoki, T.; Ogasawara, K. Correction: Verification in the Early Stages of the COVID-19 Pandemic: Sentiment Analysis of Japanese Twitter Users. JMIR Infodemiol. 2024, 4, e57880. [Google Scholar] [CrossRef]
- Aldosery, A.; Carruthers, R.; Kay, K.; Cave, C.; Reynolds, P.; Kostkova, P. Enhancing public health response: A framework for topics and sentiment analysis of COVID-19 in the UK using Twitter and the embedded topic model. Front. Public Health 2024, 12, 1105383. [Google Scholar] [CrossRef]
- Guo, Y.; Zhu, J.; Huang, Y.; He, L.; He, C.; Li, C.; Zheng, K. Public Opinions toward COVID-19 Vaccine Mandates: A Machine Learning-based Analysis of U.S. Tweets. AMIA Annu. Symp. Proc. 2023, 2022, 502–511. [Google Scholar]
- Kalanjati, V.; Hasanatuludhhiyah, N.; d’Arqom, A.; Habri Arsyi, D.; Marchianti, A.; Muhammad, A.; Purwitasari, D. Sentiment analysis of Indonesian tweets on COVID-19 and COVID-19 vaccinations. F1000Research 2023, 12, 1007. [Google Scholar] [CrossRef] [PubMed]
- Hamedani, M.F.; Esmaeili, M.; Sun, Y.; Sheybani, E.; Javidi, G. Paving the way for COVID survivors’ psychosocial rehabilitation: Mining topics, sentiments, and their trajectories over time from Reddit. Health Inform. J. 2024, 30, 1–18. [Google Scholar] [CrossRef] [PubMed]
- Kagashe, I.; Yan, Z.; Suheryani, I. Enhancing Seasonal Influenza Surveillance: Topic Analysis of Widely Used Medicinal Drugs Using Twitter Data. J. Med. Internet Res. 2017, 19, e315. [Google Scholar] [CrossRef] [PubMed]
- Mikolov, T.; Chen, K.; Corrado, G.; Dean, J. Efficient Estimation of Word Representations in Vector Space. Proc. Workshop ICLR 2013, 2013, 1–12. [Google Scholar]
- Kuang, S.; Davison, B. Learning Word Embeddings with Chi-Square Weights for Healthcare Tweet Classification. Appl. Sci. 2017, 7, 846. [Google Scholar] [CrossRef]
- Batbaatar, E.; Ryu, K. Ontology-Based Healthcare Named Entity Recognition from Twitter Messages Using a Recurrent Neural Network Approach. Int. J. Environ. Res. Public Health 2019, 16, 3628. [Google Scholar] [CrossRef]
- Chen, C.; Zhou, L.; Song, Y.; Xu, Q.; Wang, P.; Wang, K.; Ge, Y.; Janies, D. Comparison of Viral COVID-19 Sina Weibo and Twitter Contents: A Novel Feature Extraction and Analytical Workflow. J. Med Internet Res. 2021, 23, e24889. [Google Scholar] [CrossRef]
- Didi, Y.; Walha, A.; Ben Halima, M.; Wali, A. COVID-19 Outbreak Forecasting Based on Vaccine Rates and Tweets Classification. Comput. Intell. Neurosci. 2022, 2022, 4535541. [Google Scholar] [CrossRef]
- Volkova, S.; Ayton, E.; Porterfield, K.; Corley, C. Forecasting influenza-like illness dynamics for military populations using neural networks and social media. PLoS ONE 2017, 12, e0188941. [Google Scholar] [CrossRef]
- Molaei, S.; Khansari, M.; Veisi, H.; Salehi, M. Predicting the spread of influenza epidemics by analyzing twitter messages. Health Technol. 2019, 9, 517–532. [Google Scholar] [CrossRef]
- Salinas, D.; Flunkert, V.; Gasthaus, J.; Januschowski, T. DeepAR: Probabilistic forecasting with autoregressive recurrent networks. Int. J. Forecast. 2020, 36, 1181–1191. [Google Scholar] [CrossRef]
- Vaswani, A.; Shazeer, N.; Parmar, N.; Uszkoreit, J.; Jones, L.; Gomez, A.N.; Kaiser, L.; Polosukhin, I. Attention is all you need. Adv. Neural Inf. Process. Syst. 2017, 30, 1–11. [Google Scholar]
- Devlin, J.; Chang, M.W.; Lee, K.; Toutanova, K. Bert: Pre-training of deep bidirectional transformers for language understanding. In Proceedings of the naacL-HLT, Minneapolis, MN, USA, 2–7 June 2019; Volume 1, p. 2. [Google Scholar]
- Mitchell, T.M. Machine Learning; McGraw Hill: New York, NY, USA, 1997. [Google Scholar]
- Gencoglu, O. Large-Scale, Language-Agnostic Discourse Classification of Tweets During COVID-19. Mach. Learn. Knowl. Extr. 2020, 2, 603–616. [Google Scholar] [CrossRef]
- Lande, J.; Pillay, A.; Chandra, R. Deep learning for COVID-19 topic modelling via Twitter: Alpha, Delta and Omicron. PLoS ONE 2023, 18, e0288681. [Google Scholar] [CrossRef] [PubMed]
- To, Q.; To, K.; Huynh, V.A.; Nguyen, N.; Ngo, D.; Alley, S.; Tran, A.; Tran, A.; Thi Thanh Pham, N.; Bui, T.; et al. Applying Machine Learning to Identify Anti-Vaccination Tweets during the COVID-19 Pandemic. Int. J. Environ. Res. Public Health 2021, 18, 4069. [Google Scholar] [CrossRef]
- Yang, Y.C.; Xie, A.; Kim, S.; Hair, J.; Al-Garadi, M.; Sarker, A. Automatic Detection of Twitter Users Who Express Chronic Stress Experiences via Supervised Machine Learning and Natural Language Processing. CIN Comput. Inform. Nurs. 2022, 41, 717–724. [Google Scholar] [CrossRef]
- Chen, P.; Jin, Y.; Ma, X.; Lin, Y. Public perception on active aging after COVID-19: An unsupervised machine learning analysis of 44,343 posts. Front. Public Health 2024, 12, 1329704. [Google Scholar] [CrossRef]
- Tweepy Documentation. 2024. Available online: https://www.tweepy.org/ (accessed on 17 December 2024).
- Gónzalez-Bandala, D.A.; Cuevas-Tello, J.C.; Noyola, D.E.; Comas-García, A.; García-Sepúlveda, C.A. Computational Forecasting Methodology for Acute Respiratory Infectious Disease Dynamics. Int. J. Environ. Res. Public Health 2020, 17, 4540. [Google Scholar] [CrossRef]
- Secretaría de Salud del Gobierno de México. Boletín Epidemiológico. Sistema Nacional de Vigilancia Epidemiológica. Sistema Único de Información. 2024. Available online: https://www.gob.mx/salud/acciones-y-programas/direccion-general-de-epidemiologia-boletin-epidemiologico (accessed on 17 December 2024).
- Secretaría de Salud del Gobierno de México. Datos Abiertos Dirección General de Epidemiología. 2024. Available online: https://www.gob.mx/salud/documentos/datos-abiertos-152127 (accessed on 17 December 2024).
- Ma, L.; Zhang, Y. Using Word2Vec to process big text data. In Proceedings of the 2015 IEEE International Conference on Big Data (Big Data), Santa Clara, CA, USA, 29 October–1 November 2015; pp. 2895–2897. [Google Scholar] [CrossRef]
- Rumelhart, D.E.; Hinton, G.E.; Williams, R.J. Learning representations by back-propagating errors. Nature 1986, 323, 533–536. [Google Scholar] [CrossRef]
- Alexandrov, A.; Benidis, K.; Bohlke-Schneider, M.; Flunkert, V.; Gasthaus, J.; Januschowski, T.; Maddix, D.C.; Rangapuram, S.; Salinas, D.; Schulz, J.; et al. GluonTS: Probabilistic and Neural Time Series Modeling in Python. J. Mach. Learn. Res. 2020, 21, 1–6. [Google Scholar]

Disclaimer/Publisher’s Note: The statements, opinions and data contained in all publications are solely those of the individual author(s) and contributor(s) and not of MDPI and/or the editor(s). MDPI and/or the editor(s) disclaim responsibility for any injury to people or property resulting from any ideas, methods, instructions or products referred to in the content. |
© 2025 by the authors. Licensee MDPI, Basel, Switzerland. This article is an open access article distributed under the terms and conditions of the Creative Commons Attribution (CC BY) license (https://creativecommons.org/licenses/by/4.0/).