Abstract
Eye illness detection is important, yet it can be difficult and error-prone. In order to effectively and promptly diagnose eye problems, doctors must use cutting-edge technologies. The goal of this research paper is to develop a sophisticated model that will help physicians detect different eye conditions early on. These conditions include age-related macular degeneration (AMD), diabetic retinopathy, cataracts, myopia, and glaucoma. Common eye conditions include cataracts, which cloud the lens and cause blurred vision, and glaucoma, which can cause vision loss due to damage to the optic nerve. The two conditions that could cause blindness if treatment is not received are age-related macular degeneration (AMD) and diabetic retinopathy, a side effect of diabetes that destroys the blood vessels in the retina. Problems include myopic macular degeneration, glaucoma, and retinal detachment—severe types of nearsightedness that are typically defined as having a refractive error of –5 diopters or higher—are also more likely to occur in people with high myopia. We intend to apply a user-friendly approach that will allow for faster and more efficient examinations. Our research attempts to streamline the eye examination procedure, making it simpler and more accessible than traditional hospital approaches. Our goal is to use deep learning and machine learning to develop an extremely accurate model that can assess medical images, such as eye retinal scans. This was accomplished by using a huge dataset to train the machine learning and deep learning model, as well as sophisticated image processing techniques to assist the algorithm in identifying patterns of various eye illnesses. Following training, we discovered that the CNN, VggNet, MobileNet, and hybrid Deep Learning models outperformed the SVM and Random Forest machine learning models in terms of accuracy, achieving above 98%. Therefore, our model could assist physicians in enhancing patient outcomes, raising survival rates, and creating more effective treatment plans for patients with these illnesses.
1. Introduction
As a critical sense organ, sight enables people to experience the world. Because it allows us to perceive and comprehend color, navigate our environment, and process visual information, it is vital to our daily lives. It should be mentioned that a number of illnesses can impact the eye as a whole or certain regions, leading to issues with vision and possible complications.
The most frequent potentially blinding condition that eye surgeons deal with is called a cataract, which is an opacity of the lens that clouds the lens and produces blurred vision. The word “cataract” is only used when the opaque lens fibers start to obstruct vision []. Glaucoma is a group of eye disorders; their shared characteristic is progressive optic nerve degeneration, which includes gradual excavation of the optic disc, thinning of the retinal nerve fiber layer, and loss of retinal ganglion cells. Glaucoma can result in vision loss because of the damage of the optic nerve [].
Age-related macular degeneration (AMD) and diabetic retinopathy, a consequence of diabetes that damages the blood vessels in the retina, are the two diseases that might result in blindness if treatment is not received. Age-related macular degeneration (AMD) [,] is a complex condition influenced by hereditary variations and environmental factors. It is the most common cause of severe sight loss in Americans over 50. AMD causes hard drusen, a nonexudative stage, and soft drusen, widespread RPE dysfunction, and geographic atrophy, making the eye more susceptible. Diabetes significantly impacts various body organs, including the eyes, with diabetic retinopathy (DR) being the most common manifestation. One of the most common causes of blindness in diabetics is diabetic retinopathy []. DR primarily affects the retina, which absorbs light and transmits information to the brain. High blood glucose levels can damage retinal blood vessels [], leading to fluid leakage and potentially causing blindness or irreversible blindness []. DR is a significant and dangerous illness due to its significant ramifications.
Uncorrected myopia is the primary cause of distance vision impairment worldwide, and it is a prevalent cause of vision loss []. High myopia is defined as myopia that advances to the point where a person requires –5 dioptres (D) or more of spherical correction. Myopia is defined as the spherical equivalent of –0.50 diopter (D) or less. High myopia also increases the risk of problems such myopic macular degeneration, glaucoma, and retinal detachment, which are severe forms of nearsightedness that are usually characterized as having a refractive error of –5 diopters or more. Visual impairment from this illness can be severe. The significance of regular eye checkups is shown by these different eye conditions. Leading a healthy lifestyle and controlling other medical disorders like diabetes and hypertension are also essential for maintaining excellent eye health and protecting vision.
Effective treatment of eye diseases depends on early detection because symptoms may appear later. The progressive nature of eye illnesses emphasizes how crucial prompt diagnosis and treatment are to preventing irreversible vision loss. Retinal image grading by hand takes a lot of effort and is error-prone. Hospital eye exams usually involve a complex procedure that combines a number of diagnostic instruments with the knowledge of medical specialists to precisely identify and diagnose eye disorders. These diagnostic instruments are frequently pricey, however. A digital image of the back of the eye, including the retina, is captured using a retinal camera. It is costly and necessitates a skilled physician to conduct the examination, which is used to record eye conditions. Numerous conventional methods, including fluorescein angiography, dilated fundus examinations, tonometry, slit lamp examinations, and visual acuity testing, have long been used in hospitals.
Recent developments in artificial intelligence (AI)-based computer-aided diagnostics (CAD) have created automated techniques for recognizing and categorizing eye disorders from fundus photos [,,,]. It takes a lot of effort and complexity to generalize both the feature extraction and selection process. Deep learning, or DL, is an effective technique for automatically identifying features in photos. DL models has demonstrated remarkable precision in classifying medical photos [,]. New research looks into a number of machine learning and deep learning methods that have become effective tools for analyzing medical images, particularly retinal scans, and forecasting eye conditions in order to provide prompt and accurate diagnosis. These methods include Explainable Deep Learning, Generative Adversarial Networks (GANs), Recurrent Neural Networks (RNNs), Convolutional Neural Networks (CNNs), Attention Mechanisms, and Transfer Learning. Healthcare providers can more efficiently identify and treat eye conditions thanks to these methods’ ability to process vast volumes of data fast and precisely.
This research paper supports a game-changing approach that uses cutting-edge algorithms and deep learning techniques to evaluate retinal pictures with previously-unheard-of accuracy. Convolutional neural networks (CNNs), which include advanced architectures like MobileNetV1 and VGGNet, are one of these methods. These algorithms may be trained to recognize fine details and complex patterns in retinal pictures. These models learn to differentiate between various eye disorders and recognize markers of ocular health by analyzing datasets that include a range of ocular pathologies and healthy retinas. As a result, this technological development gives medical professionals better diagnostic tools, enabling more precise evaluations and well-informed treatment choices for their patients. With the help of our model, which can categorize conditions like glaucoma and cataracts, this approach is especially useful for medical professionals who are not actively involved in treating eye diseases to identify early indicators of eye problems.
Despite the fact that most studies employ the CNN deep learning model, we will use a variety of models in our investigation, including CNN, VGGNet, MobileNet, and RNN. Although the majority of the research only use one dataset, we will use six sets. Our study will examine multiple eye diseases, such as cataracts, myopia, glaucoma, diabetic retinopathy, and age-related macular degeneration (AMD), whereas most studies only examine one.
This study’s objective is to create a model that uses retinal eye images to identify the presence of eye diseases. To find patterns and anomalies that might point to eye conditions, the model will employ image processing and feature extraction techniques. A variety of tagged retinal eye images will be used to train them. To achieve high accuracy and dependability, the model will be tuned to reduce false positives and false negatives. The quality of the dataset will be improved by the application of data collection, preprocessing, and augmentation techniques. The following image processing techniques will be applied: segmentation, normalization, and augmentation. The model will then be trained using the dataset, and its performance will be enhanced through the use of optimization techniques. This technology seeks to improve patient outcomes and survival rates by helping medical professionals detect, diagnose, and treat eye problems more quickly, enabling professionals in this area to assess patients’ eyes right away in order to stop the problem from getting worse. By identifying these illnesses early, people can take preventative measures.
This paper is organized as follows. The related work is discussed in Section 2. Section 3 explains the details of the suggested research methodology and experimental setup, including the datasets used, the techniques employed for data preparation and preprocessing, and finally the model development. Section 4 reports the outcomes of the experiments and evaluations. The paper is concluded in Section 5.
2. Related Work
Predicting eye diseases through the use of artificial intelligence to automate diagnostic procedures has been the subject of extensive research. Research in the reviewed literature either relied on deep learning models to predict eye diseases or compared DL learning models with ML models, with some utilizing hybrid models.
- Deep Learning Models:Certain studies only use deep learning models for eye illness prediction [,,,,,]. According to Jung et al. [], age-related macular degeneration (AMD) can lead to blindness if left untreated. Anti-vascular endothelial growth factor injections are often necessary for patients with neovascular AMD (nAMD). The treat-and-extend approach may increase the risk of overtreatment, but it is effective in minimizing visual loss caused by recurrence. A study using 1076 spectral domain optical coherence tomography (OCT) pictures from 269 patients with nAMD found that a DenseNet201-based model could predict nAMD recurrence with an accuracy of 53.0%. After examining all images after the first, second, and third injections, the accuracy increased to 60.2%. The model performed better than skilled ophthalmologists with an average accuracy of 52.17% using a single preinjection image and 53.3% after analyzing four images before and after three loading injections. The study primarily focused on neovascular age-related macular eye conditions, but we aim to expand our scope and enhance accuracy rate.The study by Weni et al. [] achieved a 95% accuracy rate using an epoch value of 50, effectively classifying photos into the designated class. The average accuracy of ten photos was 88%. This aligns with our deep learning concepts and strategies, as it predicts one eye condition. Traditional feature-representation-based algorithms for cataract diagnosis rely on eye specialist classification, increasing the risk of incorrect detection or misclassification. However, image categorization can be automated using a convolutional neural network (CNN) for pattern identification. The study aimed to increase the accuracy of cataract recognition and reduce data loss by adjusting the number of epochs. The results showed that the number of epochs used significantly impacts CNN data loss and accuracy, with the model’s accuracy increasing with the epoch values used. Our study utilizes deep learning concepts and methods, focusing on multiple eye disorders, resulting in higher accuracy compared to this study on single eye disorders with lower accuracy.Pathological myopia (PM) is a major cause of visual impairment worldwide, linked to retinal degeneration. Early and precise diagnosis is crucial for effective treatment. Computer-aided diagnostic techniques can increase screening effectiveness and affordability. The study by Devda et al. [] uses 400 image samples from the International Symposium on Biomedical Imaging (ISBI) to categorize PM and non-PM images, to detect, locate, and segment optical disc, fovea, and lesions like atrophy and detachment. The authors utilized Convolutional Neural Networks (CNNs) for image classification and the U-net model for image segmentation, achieving competitive results. They primarily focused on detecting pathological myopia (PM), but a more expansive approach is aimed at identifying multiple eye diseases. The study used one dataset, but we use multiple.Junayed et al. [] have developed a new method for detecting cataracts using artificial intelligence, known as CataractNet. This technique uses a neural network to identify cataracts with 99.13% accuracy using eye pictures. Unlike previous algorithms, CataractNet uses a small amount of data to train, making it faster and more effective. The new technique has the potential to improve doctors’ detection and treatment of cataracts. Our research aims to identify multiple eye illnesses, rather than just cataracts, and will use six datasets.Pathologic myopia, a condition that can lead to blindness and visual issues, is often difficult to diagnose due to its lack of a common definition and the knowledge required to analyze 3D images. Park et al. [] developed an algorithm to automatically diagnose this condition using 3D pictures. They used 367 patients who underwent scans at two hospitals to create a deep learning model using four pretrained networks. The model was found to be most accurate with a 95% success rate. Grad-CAM was used to visualize the model’s elements.Acar et al. [] introduce an automated cataract disease diagnostic system using color fundus pictures and deep learning models. The system detects anomalies in retinal structures early, surpassing modern and conventional categorization techniques with a diagnostic rate of 97.94%. This tool is crucial for early cataract identification and treatment, as computer-aided diagnostic systems are increasingly used in ophthalmology due to the prevalence of vision impairments like cataracts.
- Deep Learning VS. Machine Learning Models:Certain researchers frequently contrast deep learning models with machine learning models for prediction accuracy [,,,]. Abbas [] introduces Glaucoma-Deep, a new method that uses multilayer processing and an unsupervised convolutional neural network to extract characteristics from raw pixel intensities. The system uses an annotated training dataset to determine the best discriminative deep features, and a SoftMax linear classifier to distinguish glaucoma and nonglaucoma retinal fundus images. The system’s performance was tested using 1200 retinal pictures from both public and private datasets. The average performance was 84.50% SE, 98.01% SP, 99% ACC, and 84% PRC, making it a promising tool for glaucoma eye disease identification in large-scale settings. The research focuses on detecting glaucoma in the eye, a disease we are investigating. However, we aim to predict multiple eye diseases using multiple datasets, a step we plan to take in our comprehensive research.Retinopathy, a condition affecting blood vessels in the eye, can cause bleeding, fluid leakage, and vision impairment. It can cause red spots, altered color perception, impaired vision, and eye pain. Thomas et al. [] approach using Convolutional Neural Networks (CNN) has been developed to automatically screen for diabetic retinopathy. The model uses photographs of eyes with and without retinopathy, with fully connected layers identifying the dataset and pooling layers reducing coherence. The feature loss factor increases label value and kernel-based matching finds patterns.Diabetes can cause diabetic retinopathy, which can cause intermittent vision issues or blindness. This disorder is more common in individuals with diabetes due to inadequate blood sugar control. Early detection is crucial to prevent irreversible blindness. Mushtaq et al. [] developed a deep learning technique called the densely connected convolutional network DenseNet-169 to detect diabetic retinopathy. This method accurately determines the stages of the disease, from no retinopathy to severe and proliferative retinopathy. The datasets used in this method include Diabetic Retinopathy Detection 2015 and Aptos 2019 Blindness Detection from Kaggle. The approach has a 90% accuracy rate and a 78% accuracy rate in a regression model.
- Hybrid Models:Some studies use hybrid or ensemble models to predict eye diseases [,,,]. Grassmann et al. [] create an automated computer-based method for classifying age-related macular degeneration (AMD) using color fundus images. The algorithm uses a large dataset of 120,656 photos from the Age-Related Eye Disease Study (AREDS) and 5555 photos from the Kooperative Gesundheitsforschung in der Region Augsburg (KORA) study. The goal is to provide a quick and accurate AMD classification technique, reducing the need for manual fundus image inspection.Diabetes retinopathy (DR) is a common side effect of long-term diabetes, causing eye damage and potentially permanent blindness. Early detection is crucial for successful treatment, but manual retinal image grading is time-consuming and error-prone. The study by Mohanty et al. [] presents two deep learning (DL) architectures for DR detection and classification: the DenseNet 121 network and a hybrid network combining VGG16 and XGBoost Classifier. The DenseNet 121 model achieved an accuracy of 97.30%, while the hybrid network achieved 79.50%. Comparing the DenseNet 121 network with other approaches, the DenseNet 121 model demonstrated higher performance. The study concludes that DL architectures can be used to identify and categorize DR early on, with the DenseNet 121 model showing exceptional performance.E-DenseNet is a hybrid model that the researches in [] suggested be used for DR early diagnosis. This model was created in response to research issues about the use of a CNN for DR detection from retinal pictures. Traditional CNNs might not be able to reliably differentiate between several lesion types with unique characteristics. In order to create a bespoke hybrid architecture, the Eyenet and DenseNet models were stacked on top of one other to create the E-DenseNet model. They find that the model’s ability to identify and categorize various DR grades a quadratic kappa score of 0.883, dice similarity coefficient of 92.45%, sensitivity of 96%, specificity of 69%, and average accuracy of 91.2%, the E-DenseNet model demonstrated remarkable performance.An ensemble learning-based method for cataract diagnosis and grading was presented by Yang et al. []. Two learning models were created for each group after three independent feature sets were retrieved. Two foundation learning models—the Support Vector Machine and the Back Propagation Neural Network—are constructed for every feature collection. In order to merge the several base learning models for the final fundus picture classification, the ensemble techniques of majority voting and stacking are then examined. When it comes to the proper classification rates for cataract detection and grading tasks, the ensemble classifier performs best at 93.2% and 84.5%, respectively.
Table 1 shows a comparison between this research study and the relevant literature. Although the CNN model is used in most studies, we will use multiple models in our study, such as CNN, VGGNet, MobileNet, and RNN. In order to analyze medical images, especially retinal scans, and anticipate different eye illnesses, deep learning techniques have become extremely effective. Bali and Mansotra [] analysis of Deep Learning Techniques for Prediction of Eye Diseases demonstrates how promising deep learning is for developing the area of eye disease prediction and for potentially improving patient outcomes. Furthermore, deep learning models were the most frequently utilized and reliable in predicting eye diseases from retinal pictures among the examined literature in this study. As a result, we employ DL models (VGGNet, MobileNet, and Hybrid (CNN) and (RNN)) in our analysis and compare them to standard ML models (SVM and Random Forest), which were also used in the reviewed literature. Although most studies only look at one eye illness as shown by Table 1, ours will look at several, including cataracts, myopia, glaucoma, diabetic retinopathy, and age-related macular degeneration (AMD). We will employ six sets of data, although most of the studies use just one dataset.

Table 1.
A comparison between this research study and the relevant literature.
3. Research Methodology
3.1. Dataset
The disorders of the eyes Of the approximately six retinal image datasets available on Kaggle, one comes from the figshare source. The chosen datasets were publically accessible and utilized in related research [,,]. These datasets are compiled from a number of publically accessible sources: IDRiD, HRF, SMDG-19, aria, RFiMD, ORID19, and 1kim It should be mentioned that research that concentrated on eye diseases applied its models to a limited number of diseases, whereas our goal is to develop a model that can predict four different diseases and expand the classification of the severity and types of some diseases. This is why we chose multiple datasets, as each dataset has a limited number of samples. To get more precise and superior results, we so gathered many datasets. Specialized eye and retinal imaging equipment is used to capture every image.
Ocular Disease Intelligent Recognition (ODIR) []: This dataset includes 5000 patient records, comprising age, color fundus images of the left and right eyes, and doctor diagnostic keywords, are arranged in an ophthalmic database. This dataset’s objective is to present a “real-life” collection of patient data that Shanggong Medical Technology Co., Ltd. collected from a number of hospitals and healthcare facilities in China. These organizations capture fundus shots using a range of cameras available on the market, including as Canon, Zeiss, and Kowa, which provide images with varying resolutions. Annotations were labeled by trained human readers under quality control management: pathological myopia (M), hypertension (H), diabetes (D), glaucoma (G), cataract (C), age-related macular degeneration (A), normal (N), and other diseases/abnormalities (O).
Dataset []: This dataset contains approximately 1000 retinal images per class, including those for normal, diabetic retinopathy, cataracts, and glaucoma, which are included in the dataset. These photos come from a variety of sources, including as HRF, ocular recognition, and IDRiD.
The Retina Dataset []: This dataset is divided into four classes—300 photos are categorized as normal retina, 100 images are labeled as retina disease, 100 images are labeled as cataract, and 100 images are labeled as glaucoma.
ARMD Curated Dataset []: This dataset consists of 511 fundus photos that show indications of age-related macular degeneration (ARMD). It only includes one class for age-related macular diseases. It was assembled from four publicly available datasets: the “Ocular Disease Intelligent Recognition” Dataset, the “Retinal Fundus Multi Disease Image Dataset (RFMiD)”, the “Automated Retinal Image Analysis (ARIA) Dataset”, and the “1000 Fundus Images with 39 Categories” on Kaggle. This dataset’s 300 by 300 pixel photos have all been hand-picked to ensure superior quality and consistency.
The Glaucoma SMDG-19 dataset []: This dataset is a compilation of 19 publicly available datasets that have been standardized. The train, validation, and test sets of fundus images for glaucoma detection are included in the PyTorch (https://pytorch.org/) format glaucoma dataset. Additionally, it comprises two primary classes: Glaucoma Present (designated by 1) and Glaucoma Not Present (designated by 0). There are twelve thousand photos in all.
HPMI Dataset []: This dataset has several ocular tests (such as axial length and visual acuity) confirming that the 4011 fundus photos in this dataset have the necessary comments for HM and PM (high and pathological myopia, respectively). This is the biggest fundus image dataset for HM and PM classification that we are aware of.
The data collection we will be using is the result of the combination of the previously described datasets. The dataset includes retinal scans of the eyes, which are used to diagnose eye disorders. The distribution of the eye illness category among the eye retina images in the used dataset is shown in Figure 1, which is the result of integrating many datasets.
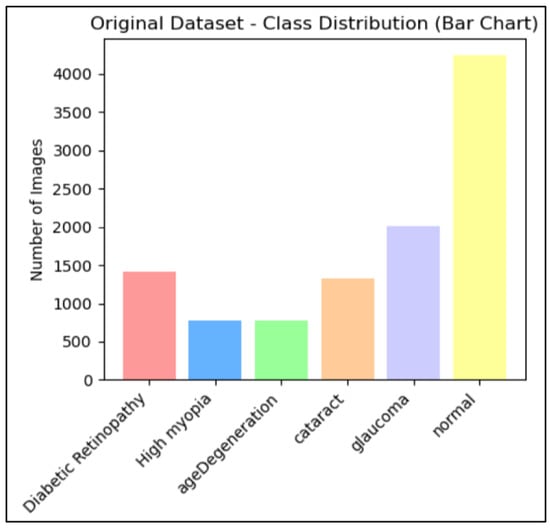
Figure 1.
Number of eye retina images for each category of eye disease.
3.2. Data Preparation and Preprocessing
The used data collection incorporates multiple sources from multiple datasets. Moreover, there are often several issues with real-world datasets that need to be resolved before building a model. This proactive strategy is essential to maximize efficiency, guarantee precision, and reduce possible mistakes. The following is a list of all the data preprocessing techniques we used to address and resolve the issues in our dataset across all disease classes.
- Resizing the images: Because our collection combines several sources from several datasets, image sizes vary greatly. The datasets display a range of sizes; the common range is between 512 × 500 pixels, and most often 255 × 255 pixels. Further data analysis is difficult because varied sizes require different processing methods. Resizing can be used to get around this problem, standardizing the image’s dimensions and guaranteeing consistent processing. The image resizing step ensured consistent analysis by cropping images to their region of interest, reducing noise and enhancing image quality and accuracy. The consistency and accuracy of analysis can be significantly enhanced by resizing images with varying sizes [,]. It involves adjusting dimensions to a uniform size for better comparison and analysis. To improve accuracy, eye retina images were eliminated to remove background information and focus on key characteristics. Resizing is often required for image processing tasks like deep learning model training.The code uses the os.walk() function to recursively iterate over files in the original_dataset_dir, including its subfolders. It constructs input and output image paths for each file, creates the output directory if not present, resolves absolute paths using os.path.abspath(), and calls the resize_image() function to resize and save the image to the corresponding location in the resized_dataset_dir.
- Data augmentation: It is important to note that the dataset we are using seems to exhibit class imbalance, which indicates that some classes have a disproportionately low number of occurrences. In order to solve this problem, we will employ an oversampling strategy that seeks to raise the frequency of the underrepresented classes, guaranteeing that our model has enough data on every class. The graph below, Figure 1, shows that there are significantly varying numbers of photos in each group.Research on eye diseases often involves unbalanced datasets, which can be addressed through methods like oversampling and data augmentation. These strategies aim to ensure fair representation of different classes in the dataset, improving analysis efficacy and reducing biases. However, class imbalance in collected datasets due to different sources can be addressed using augmentation techniques. These techniques can address limited samples in minority groups without additional data collection. In eye retinal image datasets, significant imbalance between classes is a common challenge in deep learning tasks. Data augmentation techniques, such as adjusting color brightness and contrast, can be used to address this issue. By counting the number of images in each subclass and applying random enhancements, multiple augmented versions of each image are generated, thereby balancing the dataset and mitigating class imbalance,Augmentation is the technique of altering an image so that, although the computer will recognize that it is a new image, people will still be able to recognize that it is the same image. Because the augmentation model receives extra data that can be helpful in creating models that can generalize more effectively, it can improve the accuracy of the trained ML and DL models []. Figure 2 visualize the Eye Retina dataset before and after data augmentation.
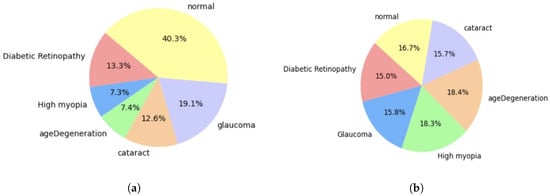 Figure 2. Eye Retina dataset before and after data augmentation. (a) Class distribution of original dataset. (b) Class distribution of processed dataset.
 - Data Normalization and Rescaling: Pixel values typically fall between 0 and 255 when working with image data. However, in deep learning models, large integer inputs may impede the learning process. Normalizing the pixel values is advised to reduce this. Normalization is a technique that scales an image’s pixel values to a predetermined range, typically between 0 and 1 or −1 and 1, to ensure uniformity in pixel values []. This helps in efficient processing and learning of data by machine learning models. Normalization is crucial for maintaining consistency among photos, as image data often have different intensity ranges. It also enhances model performance by affecting the input scale, allowing for improved results and faster convergence []. Additionally, normalization reduces bias by preventing wider pixel intensity ranges from controlling the learning process. In this study, all pixel values are scaled to a range between 0 and 1 during the normalization process. This can be performed by dividing each pixel value by 255, which is the maximum pixel value in the range. For efficient training, this procedure makes that the input data are within a tolerable range.The code uses the PIL library for image manipulation and the sklearn.preprocessing. MinMaxScaler class for scaling. The code iterates through the dataset, importing each image and converting it into a numpy array. For single-pixel images, pixel values are set to [0, 0, 0] to avoid division by zero. For nonsingle-pixel images, they are normalized by dividing them by 255.0 to scale them between 0 (very dark) and 1 (brightness). The normalized pixel values are then scaled using MinMaxScaler to fit within the range [0, 1]. Figure 3 visualize the Eye Retina dataset before and after data normalization and rescaling.
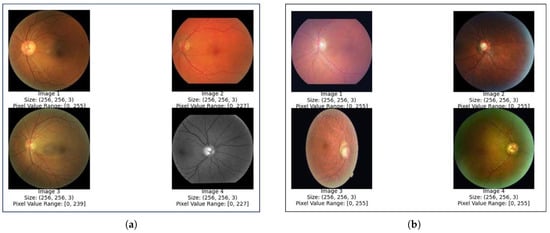 Figure 3. Eye Retina images before and after normalization and rescaling (a) Eye retina images before normalization and rescaling. (b) Eye retina images after normalization and rescaling.
 - Greyscale conversion:Grayscale is a widely used technique in image processing, particularly for ocular retina images due to the retina’s structure and properties. The retina, composed of photoreceptors sensitive to light colors, converts full-color images into shades of gray to focus on overall intensity variations, allowing for easier extraction of relevant information. Color-to-grayscale conversion is the process of converting color images into their grayscale counterparts []. In the world of image processing, grayscale conversion is a commonly used technique for data augmentation. During this process, color information is removed, leaving only the intensity data. Because grayscale photos are simpler than color images, processing them is easier. Additionally, they produce less noise, which is useful for tasks that require processing images of eye conditions where precision and clarity are essential. The primary reason grayscale representations are frequently utilized for descriptor extraction rather than directly working on color photos is that grayscale makes the process simpler and requires less computing power and to decrease the classification errors in image classification problem. In fact, color may not be very helpful in many applications, and with added extraneous information, more training data might be needed to get effective results [].An analysis of the used datasets of images of various eye diseases revealed that many of them were colored. Because of the previously mentioned advantages of employing grayscale and since we believed that these colorful photos might not significantly advance our overall analytical objectives and might even create errors, we decided to convert them to grayscale. To convert an image to grayscale, use the cv2.cvtColor() function, which requires the image and the color space conversion code. In this case, the cv2.COLOR_RGB2GRAY code is used to convert the RGB image to grayscale.
- Image Segmentation: Image vessel segmentation is crucial in ocular retina analysis for detecting and diagnosing retinal diseases. It provides valuable information about the vascular system, potentially indicating multiple retinal pathologies. Our code employs techniques like grayscale, filtering, and threshold for vessel segmentation. Figure 4 illustrates the different steps of image vessel segmentation.
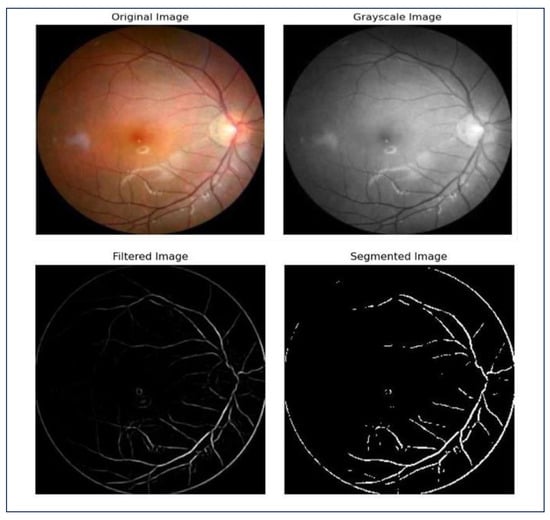 Figure 4. Steps of image segmentation.
3.3. Model Development
The deep learning process for identifying and categorizing eye disease involves uploading and preprocessing eye images, dividing the data into test and training sets, normalizing the data to ensure values fall within a specific range, and then performing feature extraction. This algorithm identifies important characteristics in the images that differentiate a diseased eye from a healthy one, enhancing the model’s performance.
3.3.1. Deep Learning Models
- VGGNet:The VGGNet model is a simple convolutional neural network (CNN) that uses 3× 3 × 3 convolutional filters for improved feature extraction. VGG16 is the preferred model in this paper compared to VGG19; the choice of model depends on the number of layers. The model used VGG16, a pretrained network, to extract features from images, producing a 1D vector an output of size (1, 7, 7, 512) with 14.7 million parameters. The features are flattened into a 1D vector, then reduced to six classes using two dense layers. Batch normalization and dropout layers improve training and prevent overfitting. Out of 27.7 million parameters, 20 million can be updated during training, while the rest are frozen from VGG16. This setup combines pretrained features with custom classification layers.The model’s initial parameters, including architecture (VGG16), epoch number, batch size, and input picture size, are conventional for image classification applications. However, the dataset and issue may require adjustments. The 32-batch size balances training stability and computing efficiency. The model is initially configured for 10 epochs, but can be adjusted based on performance. CNN architectures like VGG16 use 224 × 224 input images to maintain visual information while keeping computational demands reasonable. The training dataset is used to train the model, and its performance is tracked using validation data. Callbacks are used to maximize learning and improve convergence during the training process, which lasts for up to ten epochs.An overview of the model training and validation steps:
- 1.
- Dataset loading and preprocessing: Using folder names as a guide, image paths are linked with labels after the dataset has been loaded from the designated location. Images are adjusted to a range of [0, 1] and scaled to 224 × 224 pixels. To ensure class balance, the data are divided into training (70%), validation (20%), and testing (10%) sets using stratified sampling.
- 2.
- VGG-16 Model Definition: The top layers of the VGG16 model, which was pretrained on ImageNet, are eliminated and used as a feature extractor. Flattening, dense layers (512 and 256 units), batch normalization, dropout, and a final dense layer with softmax activation for multi-class classification are additional custom layers that are introduced. With the exception of the final four, the majority of VGG16 layers are frozen to allow for fine-tuning.
- 3.
- Model Compilation: With a starting learning rate of 0.001, the Adam optimizer is used to assemble the model. Accuracy serves as the performance parameter, and the loss function is sparse categorical cross-entropy, which is appropriate for multi-class classification.
- 4.
- Establish Callbacks: EarlyStopping restores the optimal weights by stopping training after five epochs if the validation loss does not improve. If validation loss is constant for three epochs, LROnPlateau cuts the learning rate in half. These callbacks guard against overfitting and guarantee effective training.
- 5.
- Model Training: The training dataset is used to train the model, and its performance is tracked using validation data. Callbacks are used to maximize learning and improve convergence during the training process, which lasts for up to ten epochs.
- MobileNet: MobileNetV1 is a versatile image classification model designed for embedded devices with limited resources, offering a balance between performance and efficiency, allowing for fine-tuning to accommodate various datasets with minimal computing cost. The MobileNet is a lightweight, pretrained CNN used for feature extraction in eye disease classification tasks. It uses depthwise separable convolutions to reduce computational complexity while maintaining high accuracy. Additional layers like Global Average Pooling, dense layers, batch normalization, and dropout enhance generalization and prevent overfitting. Transfer learning from ImageNet pretraining enables faster convergence and better performance on limited data. The model is trained on the training dataset for up to 20 epochs, with validation data used to monitor performance. The batch size is 32, and the model is optimized for generalization through techniques like dropout, batch normalization, and fine-tuning the MobileNet layers.An overview of the model training and validation steps:
- 1.
- Preprocessing and Dataset Loading: The dataset is loaded from a designated directory, and picture paths are labeled according to the folder names. In order to comply with MobileNet’s required input size of 224 × 224 pixels, images are downsized. For better model performance, the pixel values are adjusted to fall between [0, 1]. To ensure class balance, the dataset is divided into three sections using stratified sampling: 70% of the data are used for training, 20% for validation, and 10% for testing.
- 2.
- Definition of the MobileNet Model: The foundational model for feature extraction is the MobileNet architecture, which has already been trained on ImageNet. To modify MobileNet for the particular purpose of retinal image classification, its top layers are eliminated. The MobileNet base is topped with custom layers. Spatial dimensions are decreased by the use of global average pooling. ReLU activation and 512 units make up a dense layer that can learn complex representations. To improve stability and avoid overfitting, batch normalization and dropout are used. To further hone the characteristics, add another dense layer with 256 units. The last dense layer generates class probabilities for multi-class classification using a SoftMax activation. The final few layers of MobileNet are adjusted to fit the particular dataset, while the majority of the layers are frozen to preserve the previously learned characteristics.
- 3.
- Model Compilation: The Adam optimizer, whose adaptive learning rate makes it popular for training deep learning models, is used to compile the model. The starting learning rate is 0.001. Since the task entails multi-class classification and accuracy is monitored as the performance parameter, the sparse categorical cross-entropy loss function is employed.
- 4.
- Create Callbacks: Two crucial callbacks are utilized to guarantee effective training and prevent overfitting—EarlyStopping restores the optimal model weights by stopping training after five epochs if the validation loss does not improve; if the validation loss is constant for three epochs, ReduceLROnPlateau lowers the learning rate by a factor of 0.5. During training, these callbacks aid in accelerating the model’s convergence and avoiding overfitting.
- 5.
- Model Training: Up to 20 epochs are spent training the model on the training dataset. Following each training period, the model’s performance is tracked using the validation data. If required, the callbacks are utilized to modify the learning rate and end training early. A batch size of 32 is used for training, and methods including dropout, batch normalization, and fine-tuning the MobileNet layers are used to optimize the model for generalization.
- Hybrid (CNN) and (RNN) model: The Hybrid CNN-RNN model is a combination of Convolutional Neural Networks (CNNs) and Recurrent Neural Networks (RNNs) to extract spatial features from images. CNNs are adept at extracting edges, textures, and patterns, while RNNs process sequential or temporal information, capturing relationships in the extracted features. This synergy is beneficial in applications where spatial and contextual data interplay is critical, like medical images. The architecture combines convolutional layers for spatial feature extraction and RNN layers for modeling sequential dependencies in the extracted features. CNN layers capture patterns like edges and textures, while RNN layers interpret contextual relationships, enhancing classification accuracy. Fully connected dense layers refine these features, with dropout added to prevent overfitting. This architecture improves feature representation and generalization, making it highly effective for complex datasets. The model is trained for 30 epochs using the training generator, with validation data evaluated after each epoch to monitor performance and adjust weights for improved accuracy.An overview of the model training and validation steps:
- 1.
- Dataset loading and preprocessing: ImageDataGenerator is used to rescale images to [0, 1]. A test generator manages assessment images without shuffling, whereas training and validation generators divide data (70% of the data are used for training, 20% for validation, and 10% for testing.).
- 2.
- Hybrid Model Definition: A CNN-RNN model is constructed using convolutional layers for classification, reshaped outputs fed into RNN layers for sequence processing, and convolutional layers for the extraction of spatial features. Sparse categorical cross-entropy loss is used to assemble the model.
- 3.
- Model Training: Using the training generator, the model is trained for 30 epochs. Validation data are assessed at the end of each epoch to track performance and modify weights for increased accuracy.
3.3.2. Machine Learning Models
- Random Forest: Random forest is a machine learning technique used for classifying eye diseases based on retinal images. It uses HOG feature extraction to convert images into numerical representations, which are then reduced in dimensionality using Principal Component Analysis (PCA). The model predicts eye disease categories based on these features, with a training period of 50 dimensionality reduction, 50 trees, and a max depth of 10 for each tree.An overview of the model training and validation steps:
- 1.
- Constant Definition: Constants define the RF’s parameters. The image size (IMG_SIZE) is pixels, the number of tree n_estimators is 50, the maximum depth of each tree max_depth is 10, and the PCA components (N_COMPONENTS_PCA) are 50.
- 2.
- Splitting and Loading Data: load_and_split_data loads labels and images from the dataset, each of which is associated with a disease class that is kept in a different directory. Using train_test_split from sklearn.model_selection, it divides the data into 70% training, 20% validation, and 10% test sets, making sure that stratified splits preserve the class distribution in each subset. Class labels, such as disease names, are mapped to numerical indices for the classifier using the label_to_index function.
- 3.
- HOG-Based Feature Extraction: Each image is read by the extract_features function, which then resizes it to a standard size (IMG_SIZE) and turns it into grayscale. The Histogram of Oriented Gradients (HOG) features, which capture the image’s structure and shape, are then extracted using the hog function from skimage.feature. To fine-tune the feature extraction process, HOG parameters such as orientations, pixels per cell, and cells per block are selected.
- 4.
- Data Loading and Feature Extraction: The load_and_split_data function is used to load and split data. The extract_features function is used to extract HOG features for the training, validation, and test sets; the results are stored in train_features, val_features, and test_features.
- 5.
- PCA-Based Dimensionality Reduction: By reducing the dimensionality of the feature vectors, Principal Component Analysis (PCA) enhances computational efficiency and may improve classification accuracy. The PCA transformation for the training data is calculated using fit_transform, and the validation and test data are subjected to the same transformation using transform.
- 6.
- Testing, Validation, and Training RF model: the number of tree n_estimators is 50 and the given maximum depth of each tree parameter max_depth is 10; these are used to generate an RF classifier. The PCA-reduced features (train_features_pca) and the associated training labels are used to train the classifier. Predictions are made using the trained RF model on the validation set (val_features_pca), and accuracy_score is used to determine the accuracy. To evaluate the model’s capacity for generalization, accuracy is calculated using the test dataset (test_features_pca).
- Support Vector Machine (SVM): Support Vector Machines (SVMs) are supervised learning models used for classification, maximizing the margin between data classes and selecting the best hyperplane to divide them. They use kernels like RBF or polynomial for nonlinearity and are suitable for high-dimensional data and image classification. SVMs use the HOG (Histogram of Oriented Gradients) characteristics to determine the best hyperplane for eye disease classification, with a linear kernel assuming a straight line in the feature space.An overview of the model training and validation steps: 1. Definition of Constants: Constants specify the parameters for the SVM regularization parameter (C_SVM) 1.0, the kind of SVM kernel (KERNEL_SVM) linear, the PCA components (N_COMPONENTS_PCA) 50, and the image size (IMG_SIZE) pixels. The path to the directory containing your processed photos is stored in DATA_DIR.These steps are similar to those used in the random forest model: 2. Data splitting and loading; 3. HOG-Based Feature Extraction; 4. Data loading and feature extraction; and 5. PCA-Based Dimensionality Reduction.6. Testing, Validation, and Training SVM model: The linear kernel KERNEL_SVM and the given regularization parameter C_SVM are used to generate an SVM classifier (SVC). The PCA-reduced features (train_features_pca) and the associated training labels are used to train the classifier. Predictions are made using the trained SVM model on the validation set (val_features_pca), and accuracy_score is used to determine the accuracy. To evaluate the model’s capacity for generalization, accuracy is calculated using the test dataset (test_features_pca).
4. Results and Discussion
The study evaluated the performance of our models using a test dataset, analyzing key metrics like confusion matrices and classification reports. Cross-validation [] and unseen test data were also used to assess their generalization capabilities. Classification reports were generated for the test data and compared with cross-validation results. This comprehensive evaluation provided insights into the strengths and limitations of each model, identifying areas for improvement.
A comparison of the classification reports for machine learning and deep learning models in terms of classfiction’s precision, recall, and F1-scores is shown in Table 2, Table 3 and Table 4.
Table 2.
A comparison of deep learning and machine learning models’ classification precision.
Table 3.
A comparison of deep learning and machine learning models’ classification recall.
Table 4.
A comparison of the deep learning and machine learning models’ F1-scores for classification.
Table 2, Table 3 and Table 4 present the results of comparing the classification reports for machine learning and deep learning models in terms of the classification’s precision, recall, and F1-scores. The results show that the SVM model performs best on the categories of glaucoma and diabetic retinopathy eye diseases, with F1-scores of 0.97 and 0.92, respectively, indicating high precision and recall in identifying these conditions. With an F1-score of 0.61, the model performs poorly on normal cases, indicating that healthy cases are often misclassified as diseases. The results show that the model is quite good at differentiating between most of the eye disease classes, while there is need for improvement in identifying normal cases. Similar to the SVM model, the classification performance of the random forest model shows that the two best-performing categories are diabetic retinopathy and glaucoma, with F1-scores of 0.90 and 0.93, respectively, showing good recall and precision in detecting these conditions. With an F1-score of just 0.62 for normal cases, the model performs poorly, suggesting that healthy cases are frequently mistakenly labeled as illnesses. Nevertheless, the classification performance for the VGG16 model demonstrates that it performs exceptionally well in every class, earning almost flawless ratings. It consistently and accurately detects both normal cases and true positives for illnesses. The VGG16 model performs the worst in classifying the normal cases in terms of precision and F1-score, much as the SVM and random forest models. The “normal” class performs the worst, with a precision of 0.91 and an F1-score of 0.93.
The MobileNetV1 model’s classification performance demonstrates remarkable precision and recall (1.00) for diseases including diabetic retinopathy, glaucoma, and high myopia, minimizing false positives and precisely detecting real positives. The classification measures of precision, recall, and F1-measure have a weighted average of 99%. However, diabetic retinopathy and glaucoma are perfectly classified by the hybrid CNN + RNN model, with F1-scores of 1.00. Additionally, it performed well on high myopia, with an F1-score of 0.98, recall of 0.98, and precision of 0.99. However, it has trouble with cataracts and age-related macular degeneration, which cause its F1-scores to be lower, at 0.81 and 0.83, respectively. With the lowest performance (F1-score of 0.73), the normal class shows that many healthy cases are misclassified as diseases.
To summarize the comparison of the classification precision of machine learning and deep learning models in predicting eye diseases, as shown in Table 2, deep learning models consistently achieve near-perfect scores for diseases like diabetic retinopathy, glaucoma, and high myopia. MobileNetV1 and VGG16 achieve the highest weighted average accuracy (0.99), followed by VGG16 (0.98). When it comes to conditions like high myopia, glaucoma, and diabetic retinopathy, deep learning models often obtain assessments that are almost excellent. SVM and Random Forest have lower accuracy, particularly in the “normal” category, SVM and Random Forest show lesser precision (0.57 and 0.58, respectively). With a weighted average accuracy of 0.89, the hybrid model is not more effective than deep learning models. In conclusion, the hybrid model does not significantly improve the performance of the deep learning models MobileNetV1 and VGG16 for predicting eye diseases.
The summarized findings of a comparison of the recall of various models for identifying various eye illnesses are shown in Table 3. In terms of eye illness classification, the main conclusions are that deep learning models (MobileNetV1 and VGG16) had the highest recall values, with MobileNetV1 having the highest weighted average recall (0.99). In four illness categories—diabetic retinopathy, glaucoma, high myopia, and age degeneration—it performs flawlessly (1.00), and VGG16 likewise receives a perfect score of 1.00 for both conditions. SVM and Random Forest, two traditional machine learning models, perform worse, especially when it comes to identifying age degeneration and normal situations. The hybrid model does not significantly outperform deep learning models, with a weighted average recall of 0.89. MobileNetV1 demonstrates the best overall recall, suggesting it is the most effective model for minimizing false negatives in eye disease classification.
According to the results presented in Table 4, which compares the F1-score of several models in the classification of eye illnesses, MobileNetV1 performs best overall with a weighted average F1-score of 0.99, followed by VGG16 (0.97). Across all illness categories, deep learning models (VGG16 and MobileNetV1) have consistently demonstrated superior performance to traditional models (SVM and Random Forest). Perfect scores (1.00) for glaucoma and diabetic retinopathy are obtained by VGG16 and MobileNetV1, demonstrating exceptional precision–recall balance for these conditions. SVM and Random Forest have far lower F1-scores and have trouble identifying age degeneration and normal instances. The hybrid model’s weighted average F1-score of 0.89 indicates that it is not superior to deep learning models. In every category, MobileNetV1 continuously produces excellent F1-scores, making it the best model for striking a balance between recall and precision.
The learning curve and ROC curves for machine learning and deep learning models are shown in Figure 5. According to the Area Under the Curve (AUC) values of SVM (Figure 5a), the model which classifies glaucoma has the highest AUC (1.00), while normal has the lowest (0.84), suggesting high performance.
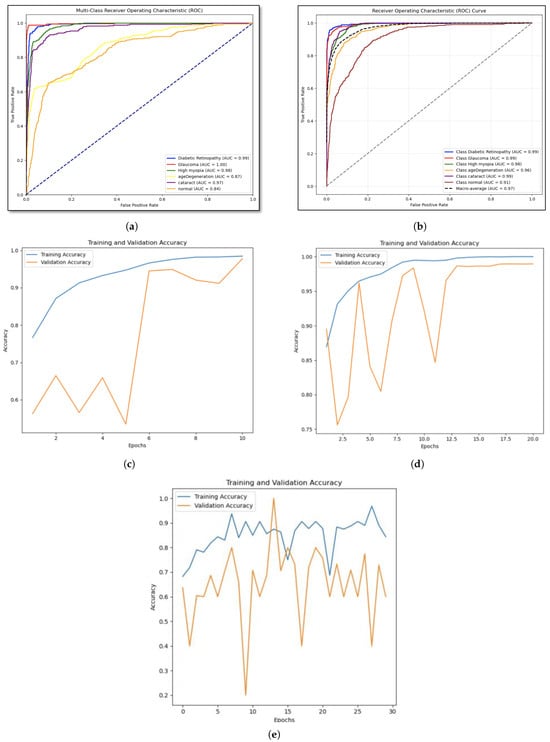
Figure 5.
ROC curves and learning curve for machine learning models and deep learning models (a) Support Vector Machine. (b) Random Forest. (c) VGG16. (d) MobileNetV1. (e) Hybrid model: CNN + RNN.
Random forest model’s performance is assessed using ROC curves by (Figure 5b), and we find that the model with all classes has high AUC values, indicating remarkable prediction accuracy. The macro-average AUC score illustrates the model’s overall efficacy in class distinguishing. This approach illustrates how the model might assist in the identification of certain eye conditions. The test accuracy of 81.86% and validation accuracy of 80.93% are marginally higher for the RF model. This proves that the Random Forest model performs consistently when applied to unknown data. Moreover, The VGG-16 model’s learning curve (Figure 5c) shows that the training accuracy is steadily increasing and is getting close to 100%, indicating that the model is successfully picking up the patterns present in the training dataset. Although validation accuracy fluctuates at first, near the end of the training process, it stabilizes and approaches training accuracy. This finding implies that the model has a high degree of generalization power across unknown data. Nonetheless, according to the MobileNetV1 model’s learning curve (Figure 5d), the validation accuracy plateaus and eventually approaches the training accuracy after a few epochs, indicating that the model performs well when applied to new data.
The results of the models’ accuracy evaluation are displayed in Table 5. The SVM model achieved 81% accuracy on the test dataset, showing balanced precision, recall, and F1-scores across all eye illnesses categories. However, it struggles to differentiate between closely similar diseases. The results suggest that feature engineering or hyperparameter adjustment could improve SVM’s performance for specific classification issues.
Table 5.
Accuracy of machine learning and deep learning models.
The Random Forest model achieved an accuracy of 81.86% on the test dataset, excelling in distinguishing between glaucoma and diabetic retinopathy. However, minor discrepancies in normal class prediction were noted, suggesting the need for a deeper tree or a more evenly distributed feature set. Despite these, the model is a strong contender for diagnostic applications due to its interpretability and resilience.
The VGG16 model demonstrated remarkable performance with an overall accuracy of 97% on the test dataset, demonstrating high precision, recall, and F1-scores in all six categories of eye diseases, particularly in diabetic retinopathy, glaucoma, and high myopia. Despite slightly lower recall rates for normal and cataract classes, the model demonstrated high generalization and stability. Validation accuracy reached 97%, and training accuracy grew steadily. Minor overfitting was resolved by implementing EarlyStopping and lowering the learning rate.
The MobileNetV1 model showed impressive performance with 98% accuracy on the test dataset, with all six eye diseases having high precision, recall, and F1-scores. The cataract and normal classes performed marginally worse in recall. Validation loss stabilized after initial fluctuations, and training and validation accuracy increased consistently to 99% by the end epochs. Dropout regularization, fine-tuning, and transfer learning were used to reduce overfitting and increase model resilience.
The Hybrid CNN+RNN model achieved an 89% accuracy in a test dataset with 25,356 samples. It achieved perfect or almost perfect precision, recall, and F1-scores for diabetic retinopathy, glaucoma, and high myopia. However, age-related degeneration, cataracts, and the normal class presented challenges, with the normal class producing the lowest metrics. The model’s precision, recall, and F1-score macro and weighted averages indicate room for improvement in specific categories. While the hybrid strategy, which uses CNN for feature extraction and RNN for sequence processing, has shown promise, further research or investigation into different architectures may be necessary to reduce class imbalances and improve performance in underperforming categories.
In this study, we used the Adam optimizer, or “Adaptive Moment Estimation”, to improve the accuracy of neural network models (MobileNetV1 and VGG16). This iterative optimization technique minimizes loss function during training and testing phases. According to the study by [], optimizers like Adam optimizer increased accuracy during the training, testing, and validation stages. They reported that Adam optimizer had accuracy values of 99.07%. However, we use a different strategy in the hybrid model, which combines recurrent neural networks (RNNs) and convolutional neural networks (CNNs). RNNs process sequential or temporal information, while CNNs extract features. The primary strategy for high accuracy in the hybrid model is feature extraction and relationship-building, which improves classification accuracy. The study does not use the Adam optimizer in the hybrid model, as it may increase model accuracy. However, the study aims to assess the accuracy of the hybrid model without an optimizer.
As a result, the MobileNetV1 model showed remarkable efficacy, achieving an overall accuracy of 98% on the test dataset. It consistently provided high scores in key performance metrics, including precision, recall, and F1 scores, across most disease categories. The model achieved perfect precision and recall scores (1.00) for four critical conditions: diabetic retinopathy, glaucoma, high myopia, and age-related macular degeneration. However, slight deviations were observed for cataract and normal categories. Cataract cases had a high recall score of 1.00, but the precision exhibited minor fluctuations due to occasional misclassification of images as normal. Moreover, Flask, a framework that ideally adapts the model for operating on mobile devices, made it easy to integrate the MobileNetV1 model into our diagnostic application. We verified through extensive user testing that the model maintained its remarkable accuracy in real-time situations, processing images on contemporary smartphones in an astoundingly short average time of only 150 milliseconds. Particularly in home e-based diagnostic applications where prompt findings are essential, this quick processing speed is essential for guaranteeing a flawless user experience.
MobileNetV1 performed admirably; however, it had certain issues, especially in edge instances where misclassifications were observed: overlapping features make it difficult to differentiate between images with moderate cataracts and normal ones, which may result in inaccurate diagnoses, and sensitivity to low-resolution or highly noisy images, which marginally reduced the model’s accuracy for the normal class. These drawbacks highlight regions that could use improvement, indicating chances for more fine-tuning or the use of sophisticated preprocessing methods like picture augmentation and noise reduction to support the model’s overall accuracy and dependability.
The findings of our study are compared to earlier research in the area of imaging-based eye disease prediction in Table 1. Our obtained result shows competitive performance and unique contributions that set it apart from previous studies. With a 98% accuracy rate, our work not only outperforms or matches the best models found in other studies, but it also presents a scalable diagnostic system that can handle a variety of illnesses. This development makes our research a more viable and efficient way to predict eye conditions.
5. Conclusions
Both vision and general quality of life are greatly impacted by eye illnesses. Effective therapy and the prevention of vision loss depend on an early and precise diagnosis. The goal of this research is to predict and categorize six common eye disorders using deep learning and machine learning techniques. Common eye conditions include cataracts, which cloud the lens and cause blurred vision, and glaucoma, which can cause vision loss due to damage to the optic nerve. The two conditions that could cause blindness if treatment is not received are age-related macular degeneration (AMD) and diabetic retinopathy, a side effect of diabetes that destroys the blood vessels in the retina. Problems include myopic macular degeneration, glaucoma, and retinal detachment—severe types of nearsightedness that are typically defined as having a refractive error of −6.00 diopters or higher—are also more likely to occur in people with high myopia. The objective is to create a reliable model that can analyze medical images, including fundus and optical coherence tomography (OCT) images, in order to determine the type and presence of eye illnesses. In order to detect and classify eye problems with the maximum possible accuracy, this study investigates a variety of machine and deep learning algorithms. We hope to improve early diagnosis and management of eye illnesses by utilizing these cutting-edge approaches, which will ultimately improve patient outcomes and preserve vision.
This study concluded by assessing how well machine learning and deep learning algorithms predict and categorize eye conditions. We looked at the performance of a number of models, including a hybrid model, Random Forest, VGG16, MobileNetV1, Support Vector Machines (SVMs), and others. With an astounding 98% accuracy, MobileNetV1 outperformed VGG16, which came in second with 97% accuracy, according to our data. The Hybrid Model likewise did quite well, achieving an accuracy of 89%, compared to 81.86% and 81.07% for Random Forest and SVM, respectively. These results indicate how well MobileNetV1 performs in diagnosing eye conditions and demonstrate its potential for precise and effective classification. In addition to advancing the use of cutting-edge machine learning and deep learning methods in the medical field, this research offers a useful tool for the early diagnosis and treatment of eye conditions, which will ultimately improve patient outcomes and care.
Funding
This research received no external funding.
Data Availability Statement
The data presented in this study are available in Kaggle and Figshare at [,,,,,].
Acknowledgments
The author would like to thank Taif Harith, Shumukh Algarni, Sara Maashi, Shaden Shubaili, and Shahad Alhazmi who are students at the College of Computer Science and Engineering, University of Jeddah, for supporting this study by developing the machine learning prototype.
Conflicts of Interest
The author declares no conflicts of interest.
References
- Galloway, N.R.; Amoaku, W.M.K.; Galloway, P.H.; Browning, A.C.; Galloway, N. Common Eye Diseases and Their Management; Springer: London, UK, 1999. [Google Scholar]
- Schuster, A.K.; Erb, C.; Hoffmann, E.M.; Dietlein, T.; Pfeiffer, N. The diagnosis and treatment of glaucoma. Dtsch. Ärzteblatt Int. 2020, 117, 225. [Google Scholar] [CrossRef] [PubMed]
- de Jong, E.K.; Geerlings, M.J.; den Hollander, A.I. Age-related macular degeneration. In Genetics and Genomics of Eye Disease; Elsevier Academic Press: Cambridge, MA, USA, 2020; pp. 155–180. [Google Scholar]
- Bressler, N.M.; Bressler, S.B.; Fine, S.L. Age-related macular degeneration. Surv. Ophthalmol. 1988, 32, 375–413. [Google Scholar] [CrossRef]
- Wang, W.; Lo, A.C. Diabetic retinopathy: Pathophysiology and treatments. Int. J. Mol. Sci. 2018, 19, 1816. [Google Scholar] [CrossRef] [PubMed]
- Sallam, A. Diabetic retinopathy update. Egypt. Retin. J. 2014, 2, 1–2. [Google Scholar] [CrossRef]
- Abramoff, M.D.; Fort, P.E.; Han, I.C.; Jayasundera, K.T.; Sohn, E.H.; Gardner, T.W. Approach for a clinically useful comprehensive classification of vascular and neural aspects of diabetic retinal disease. Investig. Ophthalmol. Vis. Sci. 2018, 59, 519–527. [Google Scholar] [CrossRef]
- Holden, B.A.; Fricke, T.R.; Wilson, D.A.; Jong, M.; Naidoo, K.S.; Sankaridurg, P.; Wong, T.Y.; Naduvilath, T.J.; Resnikoff, S. Global prevalence of myopia and high myopia and temporal trends from 2000 through 2050. Ophthalmology 2016, 123, 1036–1042. [Google Scholar] [CrossRef] [PubMed]
- Shaban, M.; Mahmoud, A.H.; Shalaby, A.; Ghazal, M.; Sandhu, H.; El-Baz, A. Low-complexity computer-aided diagnosis for diabetic retinopathy. Diabetes Retin. 2020, 2, 133–149. [Google Scholar]
- Devda, J.; Eswari, R. Pathological myopia image analysis using deep learning. Procedia Comput. Sci. 2019, 165, 239–244. [Google Scholar] [CrossRef]
- Junayed, M.S.; Islam, M.B.; Sadeghzadeh, A.; Rahman, S. CataractNet: An automated cataract detection system using deep learning for fundus images. IEEE Access 2021, 9, 128799–128808. [Google Scholar] [CrossRef]
- Bilal, A.; Zhu, L.; Deng, A.; Lu, H.; Wu, N. AI-based automatic detection and classification of diabetic retinopathy using U-Net and deep learning. Symmetry 2022, 14, 1427. [Google Scholar] [CrossRef]
- Rawat, W.; Wang, Z. Deep convolutional neural networks for image classification: A comprehensive review. Neural Comput. 2017, 29, 2352–2449. [Google Scholar] [PubMed]
- Bali, A.; Mansotra, V. Analysis of deep learning techniques for prediction of eye diseases: A systematic review. Arch. Comput. Methods Eng. 2024, 31, 487–520. [Google Scholar] [CrossRef]
- Jung, J.; Han, J.; Han, J.M.; Ko, J.; Yoon, J.; Hwang, J.S.; Park, J.I.; Hwang, G.; Jung, J.H.; Hwang, D.D.J. Prediction of neovascular age-related macular degeneration recurrence using optical coherence tomography images with a deep neural network. Sci. Rep. 2024, 14, 5854. [Google Scholar] [CrossRef]
- Weni, I.; Utomo, P.E.P.; Hutabarat, B.F.; Alfalah, M. Detection of cataract based on image features using convolutional neural networks. Indones. J. Comput. Cybern. Syst. 2021, 15, 75–86. [Google Scholar] [CrossRef]
- Park, S.J.; Ko, T.; Park, C.K.; Kim, Y.C.; Choi, I.Y. Deep learning model based on 3D optical coherence tomography images for the automated detection of pathologic myopia. Diagnostics 2022, 12, 742. [Google Scholar] [CrossRef]
- Acar, E.; Türk, Ö.; Ertugrul, Ö.F.; Aldemir, E. Employing deep learning architectures for image-based automatic cataract diagnosis. Turk. J. Electr. Eng. Comput. Sci. 2021, 29, 2649–2662. [Google Scholar]
- Abbas, Q. Glaucoma-deep: Detection of glaucoma eye disease on retinal fundus images using deep learning. Int. J. Adv. Comput. Sci. Appl. 2017, 8, 41–45. [Google Scholar] [CrossRef]
- Thomas, G.A.S.; Robinson, Y.H.; Julie, E.G.; Shanmuganathan, V.; Rho, S.; Nam, Y. Intelligent prediction approach for diabetic retinopathy using deep learning based convolutional neural networks algorithm by means of retina photographs. Comput. Mater. Contin. 2021, 66, 1613–1629. [Google Scholar]
- Malik, S.; Kanwal, N.; Asghar, M.N.; Sadiq, M.A.A.; Karamat, I.; Fleury, M. Data driven approach for eye disease classification with machine learning. Appl. Sci. 2019, 9, 2789. [Google Scholar] [CrossRef]
- Mushtaq, G.; Siddiqui, F. Detection of diabetic retinopathy using deep learning methodology. In Proceedings of the IOP Conference Series: Materials Science and Engineering, Tamil Nadu, India, 4–5 December 2020; IOP Publishing: London, UK, 2021; Volume 1070, p. 012049. [Google Scholar]
- Grassmann, F.; Mengelkamp, J.; Brandl, C.; Harsch, S.; Zimmermann, M.E.; Linkohr, B.; Peters, A.; Heid, I.M.; Palm, C.; Weber, B.H. A deep learning algorithm for prediction of age-related eye disease study severity scale for age-related macular degeneration from color fundus photography. Ophthalmology 2018, 125, 1410–1420. [Google Scholar] [CrossRef]
- Mohanty, C.; Mahapatra, S.; Acharya, B.; Kokkoras, F.; Gerogiannis, V.C.; Karamitsos, I.; Kanavos, A. Using deep learning architectures for detection and classification of diabetic retinopathy. Sensors 2023, 23, 5726. [Google Scholar] [CrossRef] [PubMed]
- AbdelMaksoud, E.; Barakat, S.; Elmogy, M. A computer-aided diagnosis system for detecting various diabetic retinopathy grades based on a hybrid deep learning technique. Med. Biol. Eng. Comput. 2022, 60, 2015–2038. [Google Scholar] [PubMed]
- Yang, J.J.; Li, J.; Shen, R.; Zeng, Y.; He, J.; Bi, J.; Li, Y.; Zhang, Q.; Peng, L.; Wang, Q. Exploiting ensemble learning for automatic cataract detection and grading. Comput. Methods Programs Biomed. 2016, 124, 45–57. [Google Scholar]
- Shanggong Medical Technology Co., Ltd. Ocular Disease Recognition. 2020. Available online: https://www.kaggle.com/datasets/andrewmvd/ocular-disease-recognition-odir5k (accessed on 1 September 2024).
- Kaggle. Eye_Diseases_Classification. 2021. Available online: https://www.kaggle.com/datasets/gunavenkatdoddi/eye-diseases-classification (accessed on 1 September 2024).
- Kaggle. Cataract Dataset. 2020. Available online: https://www.kaggle.com/datasets/jr2ngb/cataractdataset (accessed on 1 September 2024).
- Kaggle. ARMD Curated Dataset. 2023. Available online: https://www.kaggle.com/datasets/rakhshandamujib/armd-curated-dataset-2023 (accessed on 1 September 2024).
- Kiefer, R. SMDG, A Standardized Fundus Glaucoma Dataset. 2023. Available online: https://www.kaggle.com/datasets/deathtrooper/multichannel-glaucoma-benchmark-dataset (accessed on 1 September 2024).
- Huang, S.; Li, Z.; Lin, B.; Zhang, S.; Yi, Q.; Wang, L. HPMI: A Retinal Fundus Image Dataset for Identification of High and Pathological Myopia Based on Deep Learning. 2023. Available online: https://figshare.com/articles/dataset/HPMI_A_retinal_fundus_image_dataset_for_identification_of_high_and_pathological_myopia_based_on_deep_learning/24800232/1?file=43624803 (accessed on 1 September 2024).
- Saponara, S.; Elhanashi, A. Impact of image resizing on deep learning detectors for training time and model performance. In Proceedings of the International Conference on Applications in Electronics Pervading Industry, Environment and Society, Online, 9 April 2022; Springer: Cham, Switzerland, 2022; pp. 10–17. [Google Scholar]
- Rukundo, O. Effects of image size on deep learning. Electronics 2023, 12, 985. [Google Scholar] [CrossRef]
- Tran, K.; Bøtker, J.P.; Aframian, A.; Memarzadeh, K. Artificial intelligence for medical imaging. In Artificial Intelligence in Healthcare; Elsevier Academic Press: Cambridge, MA, USA, 2020; pp. 143–162. [Google Scholar]
- Grundland, M.; Dodgson, N.A. Decolorize: Fast, contrast enhancing, color to grayscale conversion. Pattern Recognit. 2007, 40, 2891–2896. [Google Scholar] [CrossRef]
- Kanan, C.; Cottrell, G.W. Color-to-grayscale: Does the method matter in image recognition? PLoS ONE 2012, 7, e29740. [Google Scholar] [CrossRef]
- Stone, M. Cross-validatory choice and assessment of statistical predictions. J. R. Stat. Soc. Ser. B (Methodol.) 1974, 36, 111–133. [Google Scholar]
- Hassan, E.; Shams, M.Y.; Hikal, N.A.; Elmougy, S. The effect of choosing optimizer algorithms to improve computer vision tasks: A comparative study. Multimed. Tools Appl. 2023, 82, 16591–16633. [Google Scholar]
Disclaimer/Publisher’s Note: The statements, opinions and data contained in all publications are solely those of the individual author(s) and contributor(s) and not of MDPI and/or the editor(s). MDPI and/or the editor(s) disclaim responsibility for any injury to people or property resulting from any ideas, methods, instructions or products referred to in the content. |
© 2025 by the author. Licensee MDPI, Basel, Switzerland. This article is an open access article distributed under the terms and conditions of the Creative Commons Attribution (CC BY) license (https://creativecommons.org/licenses/by/4.0/).