Article

Effective Thermal Conductivity of MOF-5 Powder under a Hydrogen Atmosphere

1
MOE Key Laboratory of Thermo-Fluid Science and Engineering, School of Energy and Power Engineering, Xi’an Jiaotong University, Xi’an 710049, China
2
School of Science, Xi’an Jiaotong University, Xi’an 710049, China
*
Author to whom correspondence should be addressed.
Computation 2015, 3(4), 558-573; https://doi.org/10.3390/computation3040558
Submission received: 8 September 2015 / Revised: 22 October 2015 / Accepted: 3 November 2015 / Published: 6 November 2015
(This article belongs to the Special Issue Advances in Modeling Flow and Transport in Porous Media)

Abstract

:
Effective thermal conductivity is an important thermophysical property in the design of metal-organic framework-5 (MOF-5)-based hydrogen storage tanks. A modified thermal conductivity model is built by coupling a theoretical model with the grand canonical Monte Carlo simulation (GCMC) to predict the effect of the H2 adsorption process on the effective thermal conductivity of a MOF-5 powder bed at pressures ranging from 0.01 MPa to 50 MPa and temperatures ranging from 273.15 K to 368.15 K. Results show that the mean pore diameter of the MOF-5 crystal decreases with an increase in pressure and increases with an increase in temperature. The thermal conductivity of the adsorbed H2 increases with an increased amount of H2 adsorption. The effective thermal conductivity of the MOF-5 crystal is significantly enhanced by the H2 adsorption at high pressure and low temperature. The effective thermal conductivity of the MOF-5 powder bed increases with an increase in pressure and remains nearly unchanged with an increase in temperature. The thermal conductivity of the MOF-5 powder bed increases linearly with the decreased porosity and increased thermal conductivity of the skeleton of the MOF-5 crystal. The variation in the effective thermal conductivities of the MOF-5 crystals and bed mainly results from the thermal conductivities of the gaseous and adsorption phases.

1. Introduction

As a type of clean energy, hydrogen is expected to be used in hydrogen vehicles, but hydrogen-based energy cycles require hydrogen storage as the key technology. A promising hydrogen storage material is the metal-organic framework-5 (MOF-5) which features high surface area and permanent porosity; specifically, this material can absorb up to 7.1 wt% hydrogen at 77 K and 40 bar [1]. MOF-5 is composed of 1,4-benzenedicarboxylate organic linkers and Zn4O tetrahedral clusters treated as secondary building units [2]. However, the process of H2 adsorption is an exothermic reaction, with the heat of H2 adsorption ranging from 2 kJ/mol to 5 kJ/mol [3], and the amount of H2 adsorption decreases rapidly with an increase in temperature. Heat release should be timely to avoid heat accumulation. Effective thermal conductivity is an important criterion to judge how fast the heat of adsorption is dissipated and to determine how to maintain a low temperature in a fuel storage tank during hydrogenation.
The effective thermal conductivity of MOFs has attracted the attention of many researchers. Huang et al. [4,5] studied the thermal conductivity of a MOF-5 crystal and found it to be 0.32 W/m K at a temperature of 300 K in a vacuum; they also found a very weak relation between the thermal conductivity of the MOF-5 crystal and temperature, particularly when the temperature is above 100 K. In fact, MOF-5 powders in a tank are very loose and consist of small crystallites. The effective thermal conductivity of MOF-5 powders is less than the single-crystal value because of their large pore sizes and high free volumes. Purewal et al. [6,7] adopted two representative ways to increase the effective thermal conductivity of MOF-5 powders in a storage tank. The first method is powder densification, which can yield a 350% increase in volumetric H2 density compared with powders with a density of 0.5 g/cm3. However, mechanical compaction causes the pores of MOF-5 crystals to collapse easily and thus results in the low porosity of these crystals because of the small surface area of the compression process [8]. These phenomena, which depend on compression by storage pressure under high pressure, can be avoided by directly placing MOF-5 powders as adsorbents in fuel storage tanks. The second method is synthesizing MOF-5 with natural graphite (ENG). MOF-5 with ENG can improve the effective thermal conductivity of MOF-5 powders. However, this method slightly degrades the H2 adsorption capacity. MOF-5 powders directly placed as adsorbents in fuel storage tanks can generally avoid these issues. Nevertheless, the varying effective thermal conductivities of the MOF-5 powder bed and crystals should be comprehensively investigated.
Effective thermal conductivity is related to adsorbate uptake, temperature, and pressure [9]. The amount of adsorption can be predicted with the grand canonical Monte Carlo (GCMC) simulation, which only requires macroscopic variables, such as temperature and pressure. Walton et al. [10] used GCMC simulation to simulate CO2 adsorption in MOF-5 and reported that a step phenomenon occurs during the adsorption process. Zhang et al. [11] simulated H2 adsorption in MOF-5 at 77 K at different pressures (0–1.0 bar) and obtained results that fit well with the experimental data; they then performed computer tomography on the MOF-5 at a molecular level. Yang et al. [12] combined GCMC simulation and density functional theory in their study of hydrogen adsorption in MOF-505; they found that metal oxygen clusters are preferential adsorption sites for hydrogen.
The aforementioned studies mainly focus on improving the effective thermal conductivity of MOF-5 powders, measuring the thermal conductivity of MOF-5 crystals at different temperatures, and simulating the adsorption properties of MOF-5. In the process, these studies neglect the varying effective thermal conductivities of the MOF-5 powder bed and crystals during H2 adsorption. Moreover, no model has been designed to predict the effective thermal conductivity of the H2 adsorption bed. In the present work, a thermal conductivity model coupled with GCMC simulation is employed to predict the effective thermal conductivities of the MOF-5 crystals and powder bed at different pressures and temperatures under the H2 atmosphere. The key factors of thermal conductivity and different gases are also studied.

2. Theoretical Modeling

2.1. Effective Thermal Conductivity

Figure 1. Structure of MOF-5 crystal and varying porosity at different pressures. (a) Structure of MOF-5 and its topology (ZnO4 tetrahedral: blue polyhedra; benzene dicarboxylate linkers: O, red and C, black; pore: yellow sphere); (b) Varying bed porosity at different pressures.
Computation 03 00558 g001
The MOF-5 powder bed is composed of many cubic crystallites and a gaseous phase, as shown in Figure 1a. The porosity of the MOF-5 powder bed will decrease with an increase in pressure, as shown in Figure 1b. In this work, the following assumptions are made: the pore in the crystal does not experience the collapse phenomenon at the study pressure range (0.01–50 MPa), and the relation between density and pressure is linear [7]. This relationship is expressed as
ρ = 0.13 + 0.006 P
ε = 1 0.13 + 0.006 P 0.605
Where ρ is the density of the adsorption bed, P is the pressure in the adsorption bed, and ε is the porosity among the particles. Although MOF-5 features a regular crystal structure, many MOF-5 crystals are randomly distributed in the adsorption bed. Thus, the effective medium theory model is adopted [13].
( 1 ε ) λ s e f f λ e f f λ s e f f + 2 λ e f f + ε λ g λ e f f λ g + 2 λ e f f = 0
Which can be solved as
λ e f f = λ s e f f 2 λ g 4 + 3 ε λ g 4 3 ε λ s e f f 4 + ( 9 ε 2 λ 2 g 18 ε 2 λ g λ s e f f + 9 ε 2 λ 2 s e f f 6 ε λ 2 g + 18 ε λ g λ s e f f 12 ε λ 2 s e f f + λ 2 g + 4 λ g λ s e f f + 4 λ 2 s e f f ) 1 2 4
Where λ e f f is the effective thermal conductivity of the adsorption bed, λ g is the thermal conductivity of the gaseous phase, and λ s e f f is the effective thermal conductivity of the MOF-5 crystal. The MOF-5 crystal comprises the skeleton of the MOF-5 and gaseous phase, and the MOF-5 crystal features a pore diameter of 1.12 nm [2]. A model of the effective thermal conductivities of MOF-5 crystals is used in [14] but without consideration of radiation.
λ e f f = λ s + λ g = λ g 0 1 + 2 β K n + λ M O F 5 ( 1 φ ) 3 μ
Where λ s is the thermal conductivity of solid MOF-5, λ g is the gaseous thermal conductivity, and λ g 0 is the gaseous thermal conductivity at 0.1 MPa and 298.15 K; then λ M O F 5 is the thermal conductivity of the MOF-5 skeleton, φ is the porosity of Cu-BTC crystal [6], μ is the tortuosity factor, β is the correction coefficient, and K n is the Knudsen number. When the effect of adsorption is considered, the model can be corrected similarly to the model for water adsorption in zeolite [15]. This condition can be explained as follows. First, the condition of gas adsorption in MOF-5 is similar to that of water adsorption in a zeolite, with both conditions being physical adsorption. Second, the state of adsorption is assumed to be the boiling point in both the zeolite and the MOF-5. The effective thermal conductivity of a MOF-5 crystal is expressed as
λ s e f f = λ g 0 1 + 2 β K n + λ M O F 5 ( 1 φ ) 3 μ + λ L N ( 1 φ ) ρ s k M O F 5 ρ 3 μ
Where λ L is the thermal conductivity of the adsorbed gas, which is assumed to be equal to the thermal condition at the boiling point at 0.1 MPa [16], and N is the amount of adsorption, which can be obtained from the results of the GCMC simulation. The GCMC calculation is performed in a static state, in which the adsorption heat is assumed to be completely released. Hence, we do not consider the chemical potential caused by changes in vibrational entropy, as mentioned in [11,12]. Then β is defined as
β = 2 k ( 2 γ ) / [ γ ( k + 1 ) ]
Where k is the ratio of the heat capacities of the gases and γ is the effectiveness of energy transfer between the gas molecule and the MOF-5 skeleton, respectively. Then K n is defined as
K n = Λ / d
Where d is the mean pore diameter of the adsorbed MOF-5 structure, which can be obtained as follows [16]:
d = d e [ 1 N ρ s k M O F 5 ( 1 φ ) ρ L φ 3 ]
Where ρ L is the density of the adsorbed phase, which is assumed to be equal to the density at the boiling point at 0.1 MPa; ρ s k M O F 5 is the density of the MOF-5 skeleton; d e is the mean pore diameter of the MOF-5 structure as expressed in zeolite [15]; and Λ is the mean free path of the molecule, which is defined as
Λ = Λ 0 p 0 p T T 0
Where p 0 and T 0 refer to 0.1 MPa and 298.15 K, respectively; Λ 0 is the mean free path of gas under this reference condition. The final effective thermal conductivity of the MOF-5 crystal is expressed as
λ s e f f = λ g 0 1 + 4 k ( 2 r ) Λ 0 p 0 T / [ r ( k + 1 ) p T 0 d e [ 1 N ρ s k M O F 5 ( 1 φ ) ρ L φ 3 ] ] + λ M O F 5 ( 1 φ ) 3 μ + λ L N ( 1 φ ) ρ s k M O F 5 ρ 3 μ
The values of the main parameters are shown in Table 1.
Table 1. Constant parameters (the missed parameters of density and thermal conductivity in the reference are from REFPROP 4.0).
ParameterValueUnitReference
ρ N 2 808.60kg∙m−3[16]
ρ H 2 71.26kg∙m−3-
ρ C O 2 1227.78kg∙m−3[16]
ρ s k M O F 5 2030kg∙m−3[6]
λ L N 2 0.14429W∙m−1∙k−1-
λ L H 2 0.10329W∙m−1∙k−1-
λ L C O 2 0.21815W∙m−1∙k−1-
λ g 0 H 2 0.18488W∙m−1∙k−1-
λ g 0 N 2 0.025835W∙m−1∙k−1-
λ g 0 C O 2 0.01642W∙m−1∙k−1[17]
Λ w v 0 H 2 1.278 × 10⁻⁷m[18]
Λ w v 0 N 2 6.28 × 10⁻⁸m-
Λ w v 0 C O 2 6.29 × 10⁻⁸m-
φ 0.702-[6]
γ N 2 1.92--
γ H 2 1.95--
γ C O 2 1.95--
μ 1.57--
k N 2 1.4--
k H 2 1.4--
k C O 2 1.35--
λ M O F 5 0.75W∙m−1∙k−1-
d e 1.12 × 10⁻⁹m[2]

2.2. GCMC Models

2.2.1. Simulation Model

Figure 2. Computed physical model.
Computation 03 00558 g002
The amount of adsorption is numerically simulated using the GCMC method with constant chemical potential ( μ ), simulation box volume ( V ), and temperature ( T ). The temperature and pressure are treated as input parameters. Figure 2 shows the simulation box that includes eight unit cells. The size of the simulation box is 5.1788 nm × 5.1788 nm × 5.1788 nm. The MOF-5 adsorbent, which is treated as a rigid structure with atoms fixed at their crystallographic positions, is located inside the simulation box with a periodic boundary condition. The adsorbate H2 is treated as a rigid single molecule. The MOF-5 and H2 structures are built and optimized in the Materials studio packages [19] to satisfy the real material properties. The potential energy ( U i j ) between atoms in the configurations is considered to calculate the interactions between two H2 molecules or between the MOF-5 framework and the H2 molecule; i and j represent the interacting MOF-5 atoms or H2 molecules. When i represents H2 atoms, j can represent MOF-5 or H2 atoms. The values of the Lennard–Jones (LJ) potential parameters of MOF-5 are adopted from the all-atom optimized potentials for liquid simulations (OPLS-AA) force field [20] and from the work of Yang et al. [21]. The detailed values are shown in Figure 3 and Table 2. The detailed potential parameters of H2 are shown in Table 3. The potential parameters of N2 and CO2 are also shown in Table 3.
U i j has two contributions: the LJ potential U L J ) and the electrostatic potential ( U E q ), which refers to the coulomb potential. Potential energy U i j is calculated using Equation (8).
U i j = U L J + U E q = 4 ε i j [ ( σ i j r i j ) 12 ( σ i j r i j ) 6 ] + q i q j 4 π ε 0 r i j
Where r i j is the distance between atoms i and j; ε i j and σ i j are the LJ depth and diameter, respectively; q i and q j are the partial charges of the interacting atoms; and ε 0 is the dielectric constant (8.85 × 10⁻¹² F/m). Electrostatic interaction is conducted using the Ewald summation technique. The cutoff radius is set to 1.3 nm for the LJ interactions. All the LJ cross-interaction parameters are determined using the Lorentz–Berthelot mixing rules.
Figure 3. Model clusters for different atoms.
Computation 03 00558 g003
Table 2. New LJ parameters for MOF-5 atoms.
Atom Type σ ( Α ) ε k B ( K ) q ( e )
Hydrogen/NitrogenCarbon Dioxide
C13.75 a52.84 a52.84 a0.667 b
C23.55 a35.23 a28.18 b0.072 b
C33.55 a35.23 a28.18 b−0.132 b
O12.96 a73.98 b63.41 b−1.846 b
O22.96 a73.98 b63.41 b−0.724 b
H2.42 a15.10 a15.10 a0.140 b
Zn2.46 c62.40 c62.40 c1.501 b
a Adopted from the OPLS-AA force field of Jorgensen et al. [20]; b Adopted from Yang et al. [21]; c Adopted from the all-atom universal force field (UFF) force field (missing in the OPLS-AA force field) [22].
Table 3. LJ parameters and partial atomic charges for N2, H2, and CO2 atoms.
SpeciesAtom σ ( Α ) ε k B ( K ) q ( e ) Ref.
N2N2.59836.7 [23]
H2H3.73148 [24,25]
CO2C2.8027.00.70[26]
O3.0579.0−0.35

2.2.2. Simulation Method

The GCMC method started with an initial configuration. The initial configuration is the state at which the size of the simulation box and the initial number of adsorbates are known and determined. The number of adsorbates and potential energy in the initial configuration (m) are N m and U m , respectively. The initial configuration is further updated with simultaneous procedures of random move, insertion, and deletion for the adsorbate molecule selected at the same probability of one of three. The detailed solution process can be found in [27]. The move, insertion, and deletion steps are repeated for 1 × 10⁷ steps until the chemical potentials in the adsorbed and bulk phases are identical. Another 1 × 10⁷ steps similar to the previous process are used to obtain the converged number of adsorbates and potential energy by means of averaging. After all the iterations converge, the final number of adsorbate molecules ( N a m ), adsorbate-adsorbate potential energy ( U f f ), and adsorbate-adsorbent potential energy ( U f s ) are obtained.
The adsorbate molecule only refers to the number of adsorption molecules in the simulation box. This number should be converted to the excess adsorption amount ( N ), which can be compared with the experimental data based on [28].
N = 1000 ( N a m M a N a ρ g V f r e e N A ) / ( M s M a )
Where M s , M a , V f r e e , N a , and N A are the substance amounts of a single crystal cell (6159), relative molecular masses of adsorbates (2 for H2, 14 for N2, and 44 for CO2), free volume of the single crystal cell (1.37 × 10⁻²⁶ m3), number of structure cells (eight), and Avogadro’s constant (6.022 × 10²³), respectively; ρ g is the gaseous density.

3. Results and Discussions

3.1. Model Validation

Figure 4a shows the simulated adsorption isotherm of the H2 adsorption in MOF-5 at 298 K compared with the experimental data [29]. The simulated adsorption isotherm fits well with the experimental data at different pressures, with the standard deviation being less than 6.57%. The GCMC model in the present work is precise enough to let us learn further the H2 adsorption behavior of MOF-5.
Figure 4b shows the simulated effective thermal conductivity of the MOF-5 powder under the N2 atmosphere compared with the experimental data by Purewal et al. [6]. The calculated theoretical porosity of the adsorption bed is 0.43. However, the mechanical compaction leads the pores in the crystals to collapse slightly, which in turn leads to the decreased porosity of the MOF-5 crystal; hence, the porosity in the powder bed is in fact higher than the theoretical calculation [6]. When the porosity is set to 0.63, the standard deviation is only 8.4%. The model in this work can be further used to study H2 adsorption beds to a certain extent.
Figure 4. Comparison of simulated results and experimental data. (a) Comparison of simulated and experimental adsorption isotherm of H2 in MOF-5 at 298 K; (b) Comparison of simulated and experimental thermal conductivity at different temperatures.
Computation 03 00558 g004

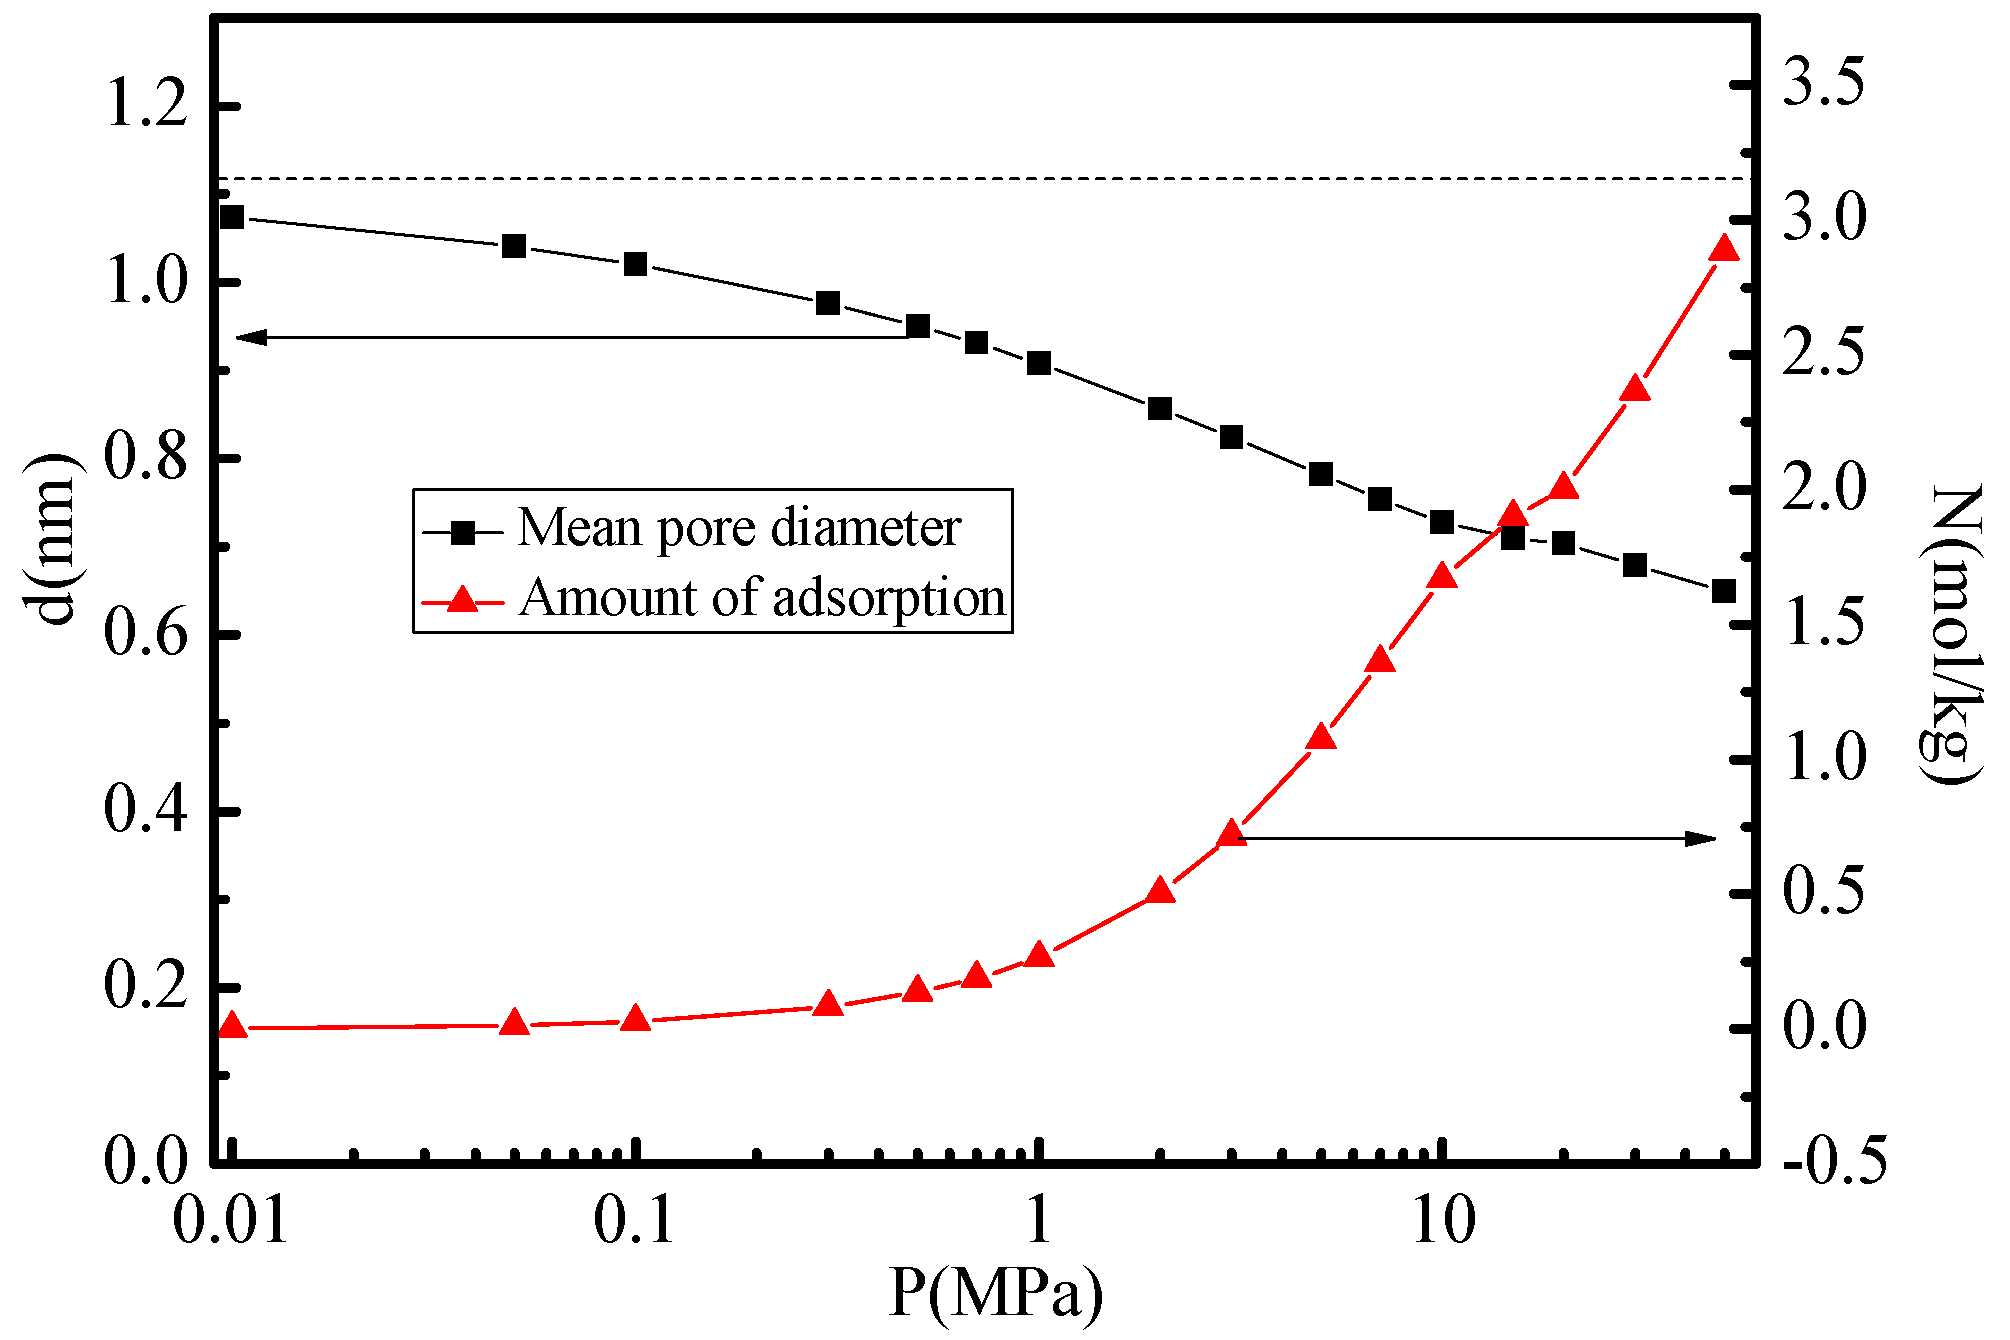
3.2. Effect of Amount of Adsorption on Pore Width

Figure 5 shows the mean pore diameter and the amount of adsorption in the MOF-5 crystal against hydrogen pressures ranging from 0.01 MPa to 50 MPa at 298.15 K. The plots indicate that the mean pore diameter is dependent on the hydrogen pressure. With an increase in pressure, the amount of H2 adsorption increases and occupies the free volume. As a result, the mean pore diameter of the adsorbed MOF-5 crystal decreases. Figure 6 shows the varying mean pore diameter and the amount of adsorption in the MOF-5 crystal at temperatures ranging from 273.15 K to 368.15 K at 10 MPa. With an increase in temperature, the mean pore diameter increases, and the amount of adsorption decreases linearly. Accordingly, the mean pore diameter increases linearly.
Figure 5. Varying mean pore diameter and amount of H2 adsorption at different pressures and 298.15 K.
Computation 03 00558 g005
Figure 6. Varying mean pore diameter and amount of H2 adsorption at different temperatures and 10 MPa.
Computation 03 00558 g006

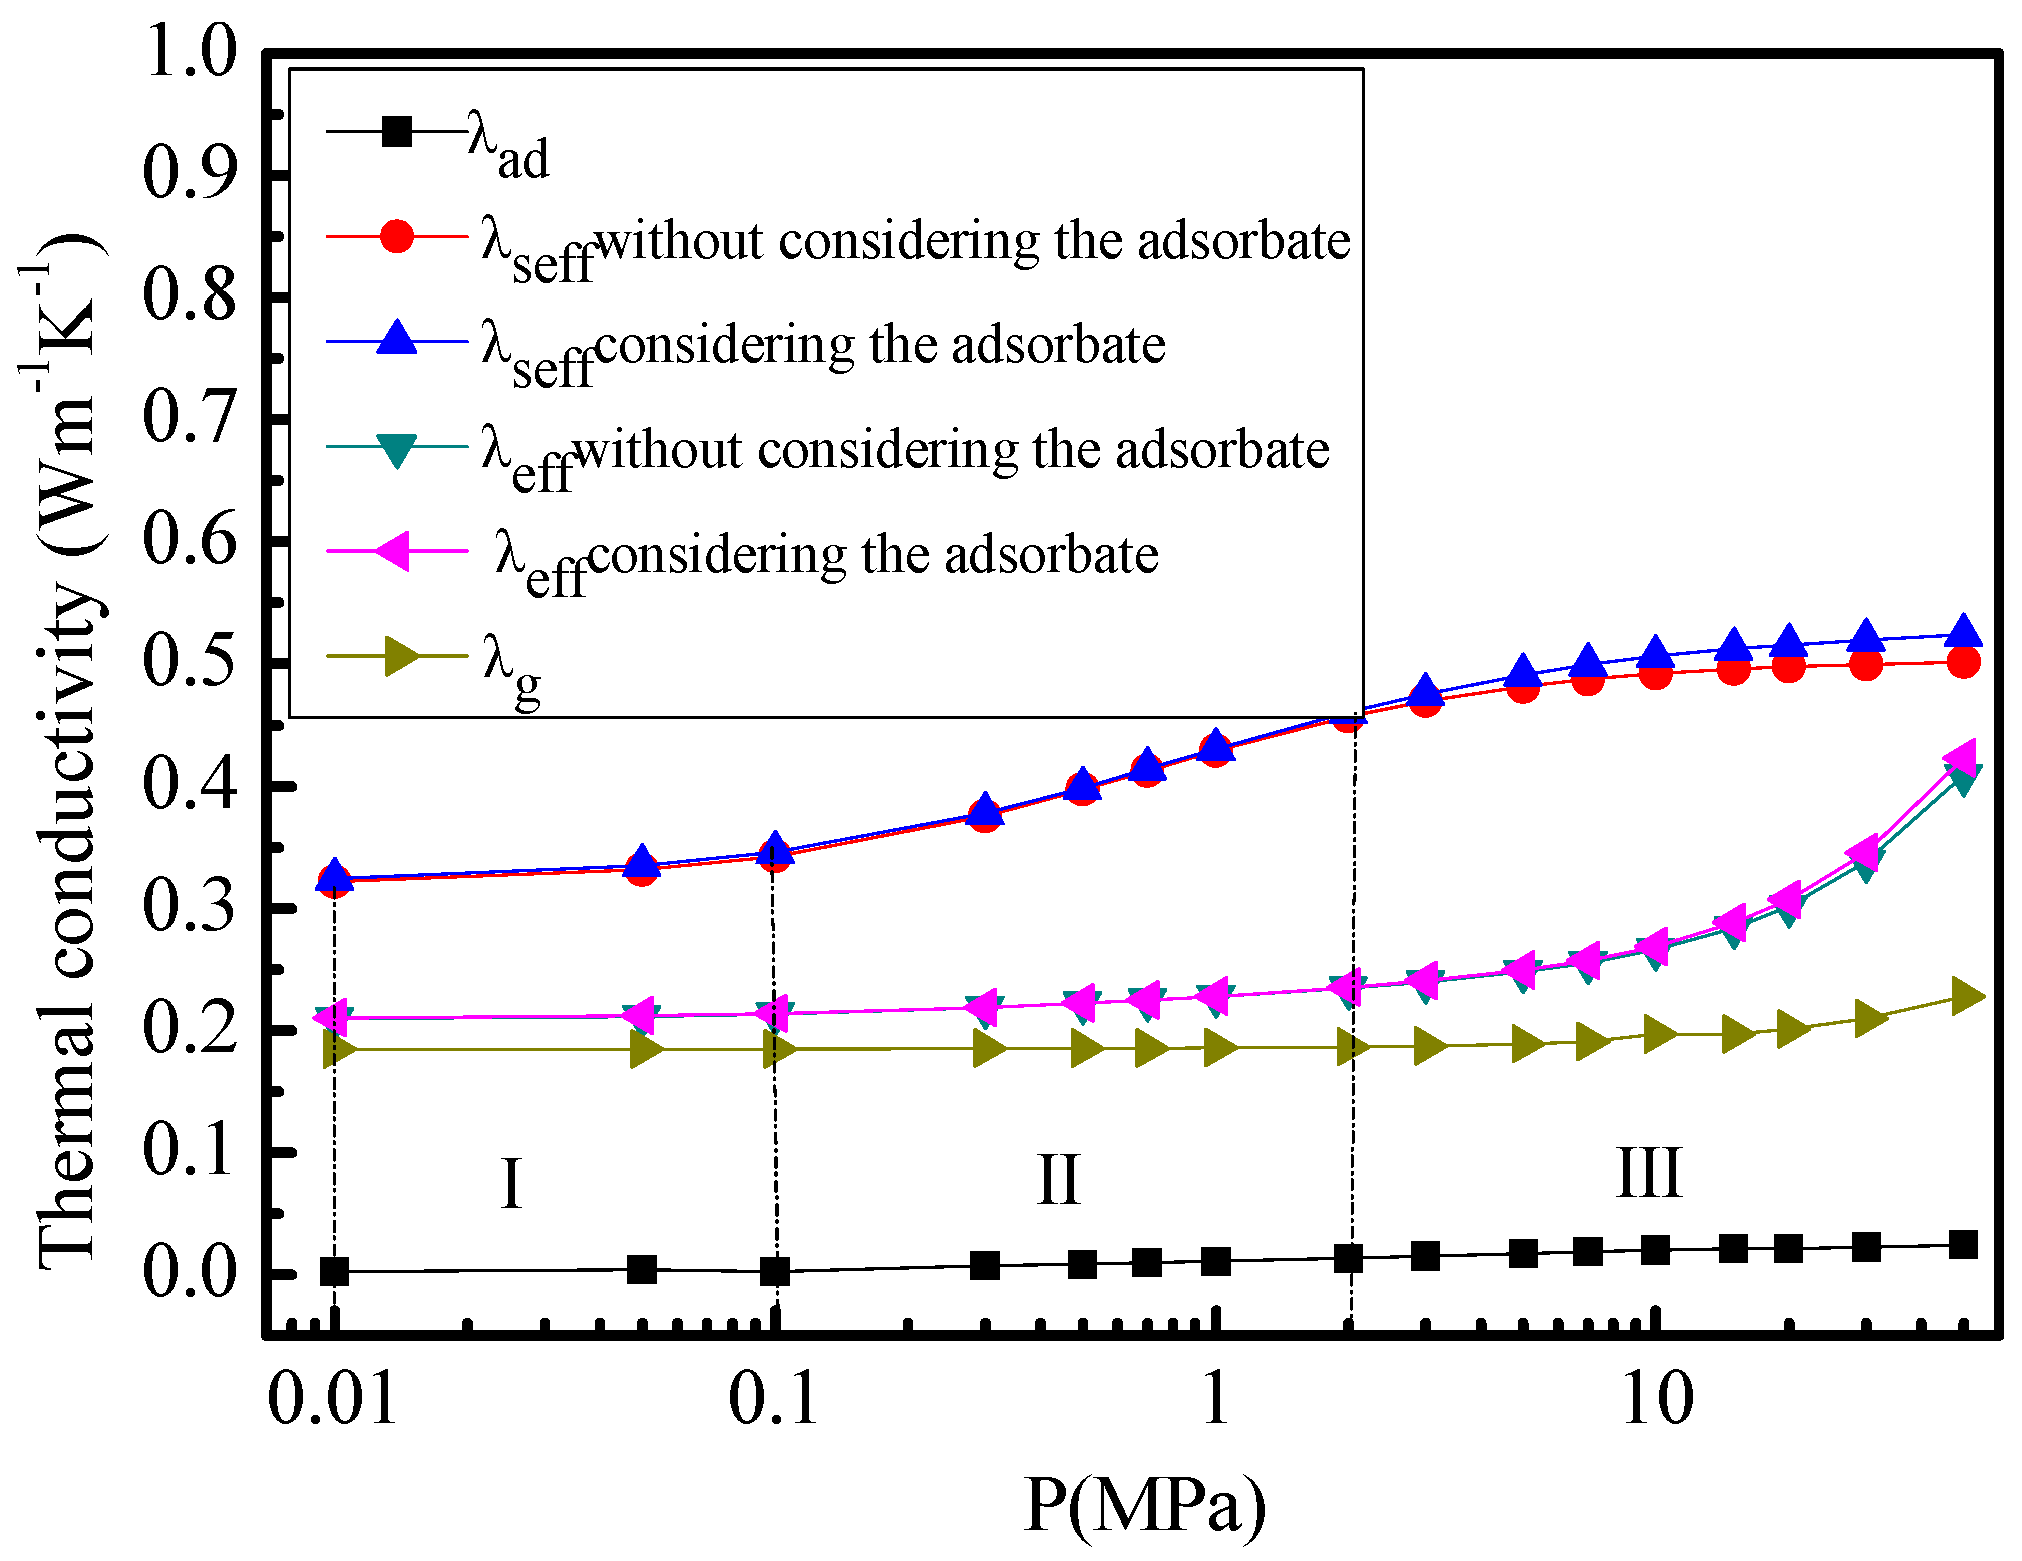
3.3. Effect of Pressure

Figure 7 shows the effective thermal conductivities of the adsorbed MOF-5 crystals and bed at different pressures (0.01–50 MPa) and 298.15 K. The effective thermal conductivity of the MOF-5 crystals at the H2 atmosphere increases in an “S” shape, as confirmed by the experimental data on zeolite K under the H2 atmosphere [9]. The effective thermal conductivity of the MOF-5 crystals with consideration of the adsorbed phase is slightly higher than that without such consideration. The difference is evident with an increase in pressure because of the thermal conductivity of the adsorbed phase. Given that the thermal conductivity of the adsorbed phase increases, the amount of H2 adsorption increases with an increase in pressure. The change in the effective thermal conductivity is determined by the adsorbed and gaseous phases in the MOF-5 crystal. At region I (0.01–0.1 MPa), the amount of H2 adsorption is significantly small enough that the thermal conductivity of the adsorbed phase can be ignored. The varying effective thermal conductivity of the MOF-5 crystal mainly results from the gaseous phase because the mean free path of the molecule decreases with an increase in pressure. At region II (0.1–2 MPa), the change is mainly determined by the adsorbed and gaseous phases. The amount of adsorption increases rapidly at this region; hence, the thermal conductivity of the adsorbed phase increases obviously. The mean free path of the molecule and the mean pore diameter of the crystal all decrease with an increase in pressure. This condition results in a competition in the thermal conductivity of the gaseous phase. The effect of the varying mean free path of the molecule performs an important function in the gaseous phase compared with the effect involving the consideration and non-consideration of adsorption. The increased thermal conductivity of the adsorbed phase is similar to the decreased thermal conductivity induced by the mean pore diameter of the crystal in the gaseous phase because the effective thermal conductivity of the MOF-5 crystal is similar regardless of the consideration of adsorption. At region III (2–50 MPa), the variation is mainly due to the adsorbed phase. The mean free path of the molecule and the mean pore diameter of the crystal all decrease with an increase in pressure. However, the Knudsen number remains constant, which in turn leads the thermal conductivity of the gaseous phase to be constant. Therefore, the variation of the effective thermal conductivity of the MOF-5 crystal mainly results from the thermal conductivity of the adsorbed phase. This phenomenon is the main reason for the effective thermal conductivity of the MOF-5 crystal being higher in the condition that considers adsorption than in the condition that does not consider adsorption. The pressure ranges above indicate that the variation in the effective thermal conductivity of the MOF-5 crystal is due to the Knudsen number, as explained by Shim et al. [6], and to the amount of H2 adsorption.
Figure 7. Varying thermal conductivity at different pressures and 298.15 K.
Computation 03 00558 g007
The effective thermal conductivity of the MOF-5 powder bed initially remains constant (pressure ranging from 0.01 MPa to 2 MPa) and then increases rapidly at a high pressure range (2–50 MPa). The gaseous thermal conductivity between the crystals is kept constant with an increase in pressure. The effective thermal conductivity of the MOF-5 powder bed with consideration of the adsorbed phase is higher than that without consideration of the adsorbed phase at a high pressure range of 2–50 MPa (Figure 7). The reasons are as follows. The porosity in the powder tank is high at low pressures (regions I and II). The gaseous thermal conductivity performs an important function. With an increase in pressure, the MOF-5 powder is compressed rapidly such that the porosity among the particles becomes low at region III. The thermal conductivity of the crystal gradually performs a lead function in the ratio of the increased effective thermal conductivity of the MOF-5 bed. The variation in the effective thermal conductivity results from the variation of the crystal and the porosity of the powder in the MOF-5 bed.

3.4. Effect of Temperature

Figure 8 shows the effective thermal conductivity of the adsorbed MOF-5 crystal and bed at different temperatures (273.15–368.15 K) and at 10 MPa. The effective thermal conductivity of the MOF-5 crystal with consideration of the adsorbed phase is slightly higher than that without such consideration because the adsorbed phase has thermal conductivity and the adsorbed H2 molecule can reduce the mean pore diameter of the crystal. This phenomenon contributes to the change in the thermal conductivity of the gaseous phase in the MOF-5 crystal. The difference between the two models is relatively small with an increase in temperature because the amount of H2 adsorption decreases with an increase in temperature. The reasons are as follows. For the MOF-5 crystal without consideration of the adsorbed phase, the thermal conductivity of the gas phase decreases with an increase in temperature because the Knudsen number increases with an increase in temperature. For the MOF-5 crystal with consideration of the adsorbed phase, the decrease in effective thermal conductivity is faster than that without consideration of the adsorbed phase because the thermal conductivity of the adsorbed phase decreases. However, the mean pore diameter increases with an increase in temperature, and this condition helps improve the thermal conductivity of the gaseous phase. The adsorbed phase plays only a small role in the overall effective thermal conductivity of the MOF-5 crystal.
Figure 8. Varying thermal conductivity at different temperatures and 10 MPa.
Computation 03 00558 g008
The effective thermal conductivity of the MOF-5 bed with consideration of the adsorbed phase is similar to that without consideration of the adsorbed phase, as shown in Figure 8. The reasons are as follows. The porosity of the MOF-5 adsorption bed at this condition is 0.686, which indicates that the gaseous phase in the powder bed has a dominant function in the conductivity of the MOF-5. The effective thermal conductivity of the MOF-5 bed increases with an increase in temperature because the gaseous thermal conductivity among the crystals increases with an increase in temperature.

3.5. Effect of Main Parameter on Effective Thermal Conductivity

Figure 9. Varying porosity and thermal conductivity at different slopes.
Computation 03 00558 g009
Figure 9 shows the varying effective thermal conductivity of the MOF-5 bed and porosities at different slopes of functions between density and a pressure range (0–0.009) at 298.15 K and 10 MPa. The increase in the speed of compression apparently enhances the effective thermal conductivity of the MOF-5 bed by decreasing the amount of interstitial voids between the crystals in the bed. Figure 10 shows the effect of the varying thermal conductivity of the MOF-5 skeleton on the thermal conductivities of the crystal and bed. The effective thermal conductivities of the MOF-5 crystals and adsorption bed increase with an increase in the thermal conductivity of the MOF-5 skeleton. Notably, this relationship is linear, which means that the thermal conductivity of the MOF-5 skeleton does not influence the rules at different pressures and temperatures.
Figure 10. Varying porosity and thermal conductivity at different solid thermal conductivity values.
Computation 03 00558 g010
Figure 11. Amount of adsorption and thermal conductivity at 1.0 MPa and 298.15 K. (a) Amount of adsorption and thermal conductivity at 1.0 MPa and 298.15 K; (b) Effective thermal conductivity at 1.0 MPa and 298.15 K.
Computation 03 00558 g011
Figure 11a,b show the amount of adsorption and the effective thermal conductivity of the MOF-5 crystal and adsorption bed under the CO2, N2, and H2 atmosphere at 1.0 MPa and 298.15 K. Given that the amount of CO2 adsorption is the largest, the thermal conductivity of the CO2 adsorbate is also the largest, as shown in Figure 11a. The thermal conductivity of the CO2 adsorbed phase is higher than that of the gaseous phase in the MOF-5 crystal. This result indicates that the amount of adsorption contributes to the effective thermal conductivity of the MOF-5 crystal. Figure 11b shows the effective thermal conductivities of the MOF-5 crystal and adsorption bed at the CO2, N2, and H2 atmosphere. The thermal conductivities of the MOF-5 crystal and bed at the H2 atmosphere are higher than those at the CO2 and N2 atmosphere. The difference results from the thermal conductivity of the gaseous and adsorption phases.

4. Conclusions

A modified thermal conductivity model is built by coupling a theoretical model with the GCMC simulation to predict the effect of the H2 adsorption process on the effective thermal conductivity of a MOF-5 powder bed at pressures ranging from 0.01 MPa to 50 MPa and temperatures ranging from 273.15 K to 368.15 K. The results show that the mean pore diameter of the MOF-5 powder crystal decreases with an increase in pressure and increases with an increase in temperature as the H2 adsorption occurs. The effective thermal conductivity of the MOF-5 powder bed increases with an increase in pressure. The main reasons are as follows. The porosity of the adsorption bed decreases with an increase in pressure because the MOF-5 powder compacts and the thermal conductivity of the adsorbed phase increases with an increased amount of H2 adsorption. With an increase in temperature, the effective thermal conductivity of the MOF-5 powder bed remains nearly unchanged because of the high porosity. The thermal conductivity of the MOF-5 powder bed increases linearly with a decrease in porosity and an increase in the thermal conductivity of the skeleton of the MOF-5 crystals. The main variation in the effective thermal conductivities of the crystal and bed results from the thermal conductivities of the gaseous and adsorption phases.

Acknowledgments

This work was financially sponsored by the National Natural Science Foundation of China (No. 51322604, 51176149), the National Key Projects of Fundamental R/D of China (973 Project: 2011CB610306), the Fundamental Research Funds for the Central Universities (No. xjj2012102), and the Open Funding Project of the National Key Laboratory of Human Factors Engineering (Grant No. HF2013-K-05).

Author Contributions

Hui Wang did the simulation; Wen Zhang analyzed the data; Zhiguo Qu discussed the results of simulation; Hui Wang, Zhiguo Qu, Wen Zhang wrote the paper; Wenquan Tao revised the manuscript.

Conflicts of Interest

The authors declare no conflict of interest.

References

  1. Kaye, S.S.; Dailly, A.; Yaghi, O.M.; Long, J.R. Impact of preparation and handling on the hydrogen storage properties of Zn4O(1,4-benzenedicarboxylate)3 (MOF-5). J. Am. Chem. Soc. 2007, 129, 14176–14177. [Google Scholar] [CrossRef] [PubMed]
  2. Li, H.; Eddaoudi, M.; O’Keeffe, M.; Yaghi, O.M. Design and synthesis of an exceptionally stable and highly porous metal-organic framework. Nature 1999, 402, 276–279. [Google Scholar]
  3. Schmit, B.; Mu¨ller, U.; Trukhan, N.; Schubert, M.; Fe’rey, G.; Hirscher, M. Heat of adsorption for hydrogen in microporous high-surface-area materials. ChemPhysChem 2008, 9, 2181–2184. [Google Scholar] [CrossRef] [PubMed]
  4. Huang, B.L.; McGaughey, A.J.H.; Kaviany, M. Thermal conductivity of metal-organic framework (MOF-5): Part I. molecular dynamics simulations. Int. J. Heat Mass Transf. 2007, 50, 393–404. [Google Scholar] [CrossRef]
  5. Huang, B.L.; Ni, Z.; Millward, A.; McGaughey, A.J.H.; Kaviany, M.; Yaghi, O.M. Thermal conductivity of a metal-organic framework (MOF-5): Part II measurement. Int. J. Heat Mass Transf. 2007, 50, 405–411. [Google Scholar] [CrossRef]
  6. Purewal, J.J.; Liu, D.; Yang, J.; Sudik, A.; Siegel, D.J.; Maurer, S.; Mu¨ler, U. Increased volumetric hydrogen uptake of MOF-5 by powder densification. Int. J. Hydrog. Energy 2012, 37, 2723–2727. [Google Scholar] [CrossRef]
  7. Liu, D.; Purewal, J.J.; Yang, J.; Sudik, A.; Maurer, S.; Mueller, U.; Ni, J.; Siegel, D.J. MOF-5 composites exhibiting improved thermal conductivity. Int. J. Hydrog. Energy 2012, 37, 6109–6117. [Google Scholar] [CrossRef]
  8. Hu, Y.H.; Zhang, L. Amorphization of metal-organic framework MOF-5 at unusually low applied pressure. Phys. Rev. B 2010, 81, 174103. [Google Scholar] [CrossRef]
  9. Griesinger, A.; Spindler, K.; Hahne, E. Measurements and theoretical modeling of the effective thermal conductivity of zeolites. Int. J. Heat Mass Transf. 1999, 42, 4363–4374. [Google Scholar] [CrossRef]
  10. Walton, K.S.; Millward, A.R.; Dubbeldam, D.; Frost, H.; Low, J.J.; Yaghi, O.M.; Snurr, R.Q. Understanding inflections and steps in carbon dioxide adsorption isotherms in metal-organic frameworks. J. Am. Chem. Soc. 2008, 130, 406–407. [Google Scholar] [CrossRef] [PubMed]
  11. Zhang, L.; Wang, Q.; Liu, Y.C. Design for hydrogen storage materials via observation of adsorption sites by computer tomography. J. Phys. Chem. B 2007, 111, 4291–4295. [Google Scholar] [CrossRef] [PubMed]
  12. Yang, Q.Y.; Zhong, C.L. Understanding hydrogen adsorption in metal-organic framework with open metal sites: A computational study. J. Phys. Chem. B 2006, 110, 655–658. [Google Scholar] [CrossRef] [PubMed]
  13. Wang, J.F.; Carson, J.K.; North, M.F.; Cleland, D.J. A new approach to modeling the effective thermal conductivity of heterogeneous materials. Int. J. Heat Mass Transf. 2006, 49, 3075–3083. [Google Scholar] [CrossRef]
  14. Lu, X.; Caps, R.; Fricke, J.; Alviso, C.T.; Pekala, R.W. Correlation between structure and thermal-conductivity of organic aerogels. J. Non-Cryst. Solid 1995, 188, 226–234. [Google Scholar] [CrossRef]
  15. Dawoud, B.; Sohel, M.I.; Freni, A.; Vasta, S.; Restuccia, G. On the effective thermal conductivity of wetted zeolite under the working conditions of an adsorption chiller. Appl. Therm. Eng. 2011, 31, 2241–2246. [Google Scholar] [CrossRef]
  16. Dreisbach, F.; Staudt, R.; Keller, J.U. High pressure adsorption data of methane, nitrogen, carbon dioxide and their binary and ternary mixtures on active carbon. Adsorption 1999, 5, 215–227. [Google Scholar] [CrossRef]
  17. Yang, S.M.; Tao, W.Q. Heat Transfer, 3rd ed.; Higher Education Press: Beijing, China, 2006. [Google Scholar]
  18. Zhao, X.B.; Rodil, S.V.; Fletcher, A.J.; Thomas, K.M. Kinetic isotope effect for H2 and D2 quantum molecular sieving in adsorption/desorption on porous carbon materials. J. Phys. Chem. B 2006, 110, 9947–9955. [Google Scholar] [CrossRef] [PubMed]
  19. Materials Studio v 6.0; Accerys Software Inc: San Diego, CA, USA, 2010.
  20. Jorgensen, W.L.; Maxwell, D.S.; Tirado-Rives, J. Development and testing of the OPLS all-atom force field on conformational energetics and properties of organic liquids. J. Am. Chem. Soc. 1996, 118, 11225–11236. [Google Scholar] [CrossRef]
  21. Yang, Q.Y.; Zhong, C.L. Molecular simulation of carbon dioxide/methane/hydrogen mixture adsorption in metal-organic frameworks. J. Phys. Chem. B 2006, 110, 17776–17783. [Google Scholar] [CrossRef] [PubMed]
  22. Martin, M.G.; Siepmann, J.I. Transferable potentials for phase equilibria. 1. united-atom description of n-alkanes. J. Phys. Chem. B 1998, 102, 2569–2577. [Google Scholar] [CrossRef]
  23. Liu, Y.; Liu, H.L.; Hu, Y.; Jiang, J.W. Density functional theory for adsorption of gas mixtures in metal-organic frameworks. J. Phys. Chem. B 2010, 114, 2820–2827. [Google Scholar] [CrossRef] [PubMed]
  24. Greathouse, J.A.; Kinnibrugh, T.L.; Allendorf, M.D. Adsorption and separation of noble gases by IRMOF-1: Grand canonical Monte Carlo simulations. Ind. Eng. Chem. Res. 2009, 48, 3425–3431. [Google Scholar] [CrossRef]
  25. Skoulidas, A.I.; Sholl, D.S. Self-diffusion and transport diffusion of light gases in metal-organic framework materials assessed using molecular dynamics simulations. J. Phys. Chem. B 2005, 109, 15760–15768. [Google Scholar] [CrossRef] [PubMed]
  26. Potoff, J.J.; Siepmann, J.I. Vapor-liquid equilibria of mixtures containing alkanes, carbon dioxide and nitrogen. AICHE J. 2001, 47, 1676–1682. [Google Scholar] [CrossRef]
  27. Frenkel, D.; Smit, B. Understanding Molecular Simulation From Algorithms To Applications; Academic press: New York, NY, USA, 2002. [Google Scholar]
  28. Kowalczyk, P.; Tanaka, H.; Kaneko, K.; Terzyk, A.P.; Do, D.D. Grand canonical Monte Carlo simulation study of methane adsorption at an open graphite surface and in slit like carbon pores at 273 K. Langmuir 2005, 21, 5639–5646. [Google Scholar] [CrossRef] [PubMed]
  29. Panella, B.; Hirscher, M.; Putter, H.; Muller, U. Hydrogen adsorption in metal-organic frameworks: Cu-MOFs and Zn-MOFs compared. Adv. Funct. Mater. 2006, 16, 520–524. [Google Scholar] [CrossRef]

