Article

A Novel Method for Notable Reducing Phase Transition Temperature of VO2 Films for Smart Energy Efficient Windows

Shenzhen Key Laboratory of Advanced Thin Films and Applications, College of Physics and Optoelectronic Engineering, Shenzhen University, Shenzhen 518060, China
*
Author to whom correspondence should be addressed.
Nanomaterials 2020, 10(1), 58; https://doi.org/10.3390/nano10010058
Submission received: 6 December 2019 / Revised: 19 December 2019 / Accepted: 20 December 2019 / Published: 25 December 2019

Abstract

:
Although Vanadium dioxide (VO2) has a potential application value for smart energy efficient windows because of its unique phase transition characteristic, there are still many obstacles that need to be overcome. One challenge is to reduce its high transition temperature (ζc = 68 °C) to near room temperature without causing its phase transition performance degradation. In this paper, a novel method was employed that covered a 3 nm ultra-thin heavy Cr-doped VO2 layer on the pure VO2 films. Compared with the as-grown pure VO2, obviously, phase transition temperature decreasing from 59.5 °C to 48.0 °C was observed. Different from previous doping techniques, almost no phase transition performance weakening occurred. Based on the microstructure and electrical parameters measurement results, the mechanism of ζc reducing was discussed. The upper ultra-thin heavy Cr-doped layer may act as the induced role of phase transition. With temperature increasing, carrier concentration increased from the upper heavy Cr-doped layer to the bottom pure VO2 layer by diffusion, and induced the carrier concentration reach to phase transition critical value from top to bottom gradually. The present method is not only a simpler technique, but also avoids expensive alloy targets.

1. Introduction

Vanadium dioxide (VO2) is one of the most interesting smart materials for its reversible metal-insulator transition (MIT) near room temperature (ζc = 68 °C) [1], in which optical, electrical, and other physical properties (transmittance, reflectance, emittance, refractive index, electrical resistivity etc.) [2,3] will be sharp changed by external stimuli (applied field or voltage [4], incident light [5], temperature variation [6], mechanical stress [7], pressure [8], etc.) in the transition process. These unique properties make VO2 a suitable candidate for various technological potential applications in many fields, such as tunable filters [9], switching devices [10], memory materials [11], laser protection [12], ultrafast sensors [13], and Mott transistors [14]. Great attention has been attracted recently for the material both in scientific and technological applications.
In the last years, an increasing number of researches have been published and discussed VO2-based applications. Among all the VO2 application researches, the most attractive one is the smart energy efficient window application. Due to it exhibiting a reversible transformation from an infrared (IR)-transparent at low temperature semiconductor phase to an IR-reflective at high temperature metallic phase, meanwhile maintaining visible transmittance, VO2 is the most promising material for smart energy efficient windows [15]. Although lots of works have been done over the past years, still many obstacles should be overcome for VO2-based smart window real applications. One challenge is to reduce the transition temperature ζc of VO2 from 68 °C to around room temperature [16]. Previous reports showed that the ζc of VO2 could be reduced by a range of technologies, such as elemental doping [17], introducing stress [18] and defects [19], and chemical stoichiometry adjustment [20]. Doping is considered to the most effective strategy to reduce the ζc of VO2, especially for high-valence ions doping (such as Nb5+, Mo6+, W6+, Tb3+, etc.) [21,22,23,24]. Chae et al. [25] reported that the doped VO2 with W and Ti using the sol-gel method led to a change of transition temperature and reduces the properties of MIT. M. Panagopoulou et al. [26] found that Mg doping could reduce the transition temperature of VO2, and the 6 °C/at % Mg-doped VO2 thin film on ZnO substrate presented the lower ζc around 35 °C, but the energy modulation had sharply decreased. Jin et al. [27] reported that doping W into VO2 by using high-energy ion implantation appeared to have a much higher ζc reduction efficiency compared with other methods. Carlos Batista et al. [28] reported that the ζc would decrease 8 °C/at % by Nb doping. Most of previous works’ results exhibited that the phase transition performance as well as solar energy modulation capability of VO2 films weakened after doping, though the sharp decreasing of ζc was obtained.
In this work, pure VO2 films were prepared by reactive pulsed magnetron sputtering, and a 3 nm ultra-thin heavy Cr-doped VO2 layer was employed to cover on the prepared pure VO2 film surface. By annealing in high vacuum environment at a temperature of 250 °C, notable phase transition temperature ζc reduction of VO2 films was observed, while phase transition performance of the samples has hardly weakened. The present method is not only a simpler technique, but also avoidsexpensive alloy targets.

2. Experimental Details

VO2 thin films were prepared on K9 glass substrates at 440 °C by reactive pulsed direct current magnetron sputtering in vacuum chamber with turbo molecular bump system. High purity (99.99%) vanadium was used as target with diameter of 100 mm. First, the vacuum chamber was evacuated to a base pressure of 1.0 × 10⁻³ Pa before deposition. Then Ar (99.99%) and O2 (99.99%) gases were led into chamber with flow rate of 40 sccm and 1.5 sccm acted as working gas and reactive gas, respectively. Before films’ deposition, 10 minutes pre-sputtering was performed in Ar atmosphere to remove surface contaminant and oxide layer on the target in order to maintain deposition process stability and obtain high purity VO2 films. A pulsed direct current supply (Advanced Energy Industries) was used for films magnetron sputtering deposition. The 50 nm thick VO2 thin films were prepared under working pressure of 0.6 Pa. A 3 nm ultra-thin heavy Cr-doped VO2 layer was deposited on the top of pure VO2 films by direct current reactive co-sputtering method at room temperature with power of 10 W, and films’ thickness was controlled by deposition time. Subsequently, the samples were annealed in high vacuum atmosphere (4.0 × 10⁻⁴ Pa) at 250 °C for 30 min. The schematic of thin films’ preparation process is shown in Figure 1, and the samples are labeled as A, B, and C, respectively.
The transmittance thermal-hysteresis curves at λ = 1550 nm of the prepared samples were measured with a thin film phase transition measurement system (PERFECT PTM-1700, Perfect Opto-electronics Technology, Shenzhen, China), and the temperature ranged from room temperature to 90 °C. Microstructure of the films was identified by X-ray diffraction (XRD) in θ–2θ coupled scanning mode (Ultima IV, Rigaku, Tokyo, Japan) with Cu Κα radiation, which the wavelength is 0.15406 nm. The diffraction angle ranged from 10° to 80° with step by 0.02°. The vibrational modes in VO2 films were examined by using Raman Microscopy (inVia, Renishaw, Gloucestershire, England) with a 532 nm wavelength laser as excitation source, and the laser power was kept as low as 2 mW in order to minimize additional heating effects, and the wave number range varied from 100 to 800 cm−1. The transmittance of the thin films at room temperature and 80 °C were obtained using a spectrophotometer (UV-3600 PLUS, SHIMADZU, Shimadzu, Japan) in the range of 300–2500 nm. The samples surface morphologies were determined by field emission scanning electron microscopy (SEM). The temperature-dependent sheet-resistance variation of films was characterized using a four-point probe system, and the thin film temperature was ramped up from room temperature to 90 °C at a step of 1 °C in measurement process. The carrier concentration of the samples was measured by using the Hall Effect Measurement System (Bio Rad, HL5500 PC, Nanometrics, Milpitas, California, USA), and the entire sample was heated from 35 °C to 80 °C.

3. Result and Discussion

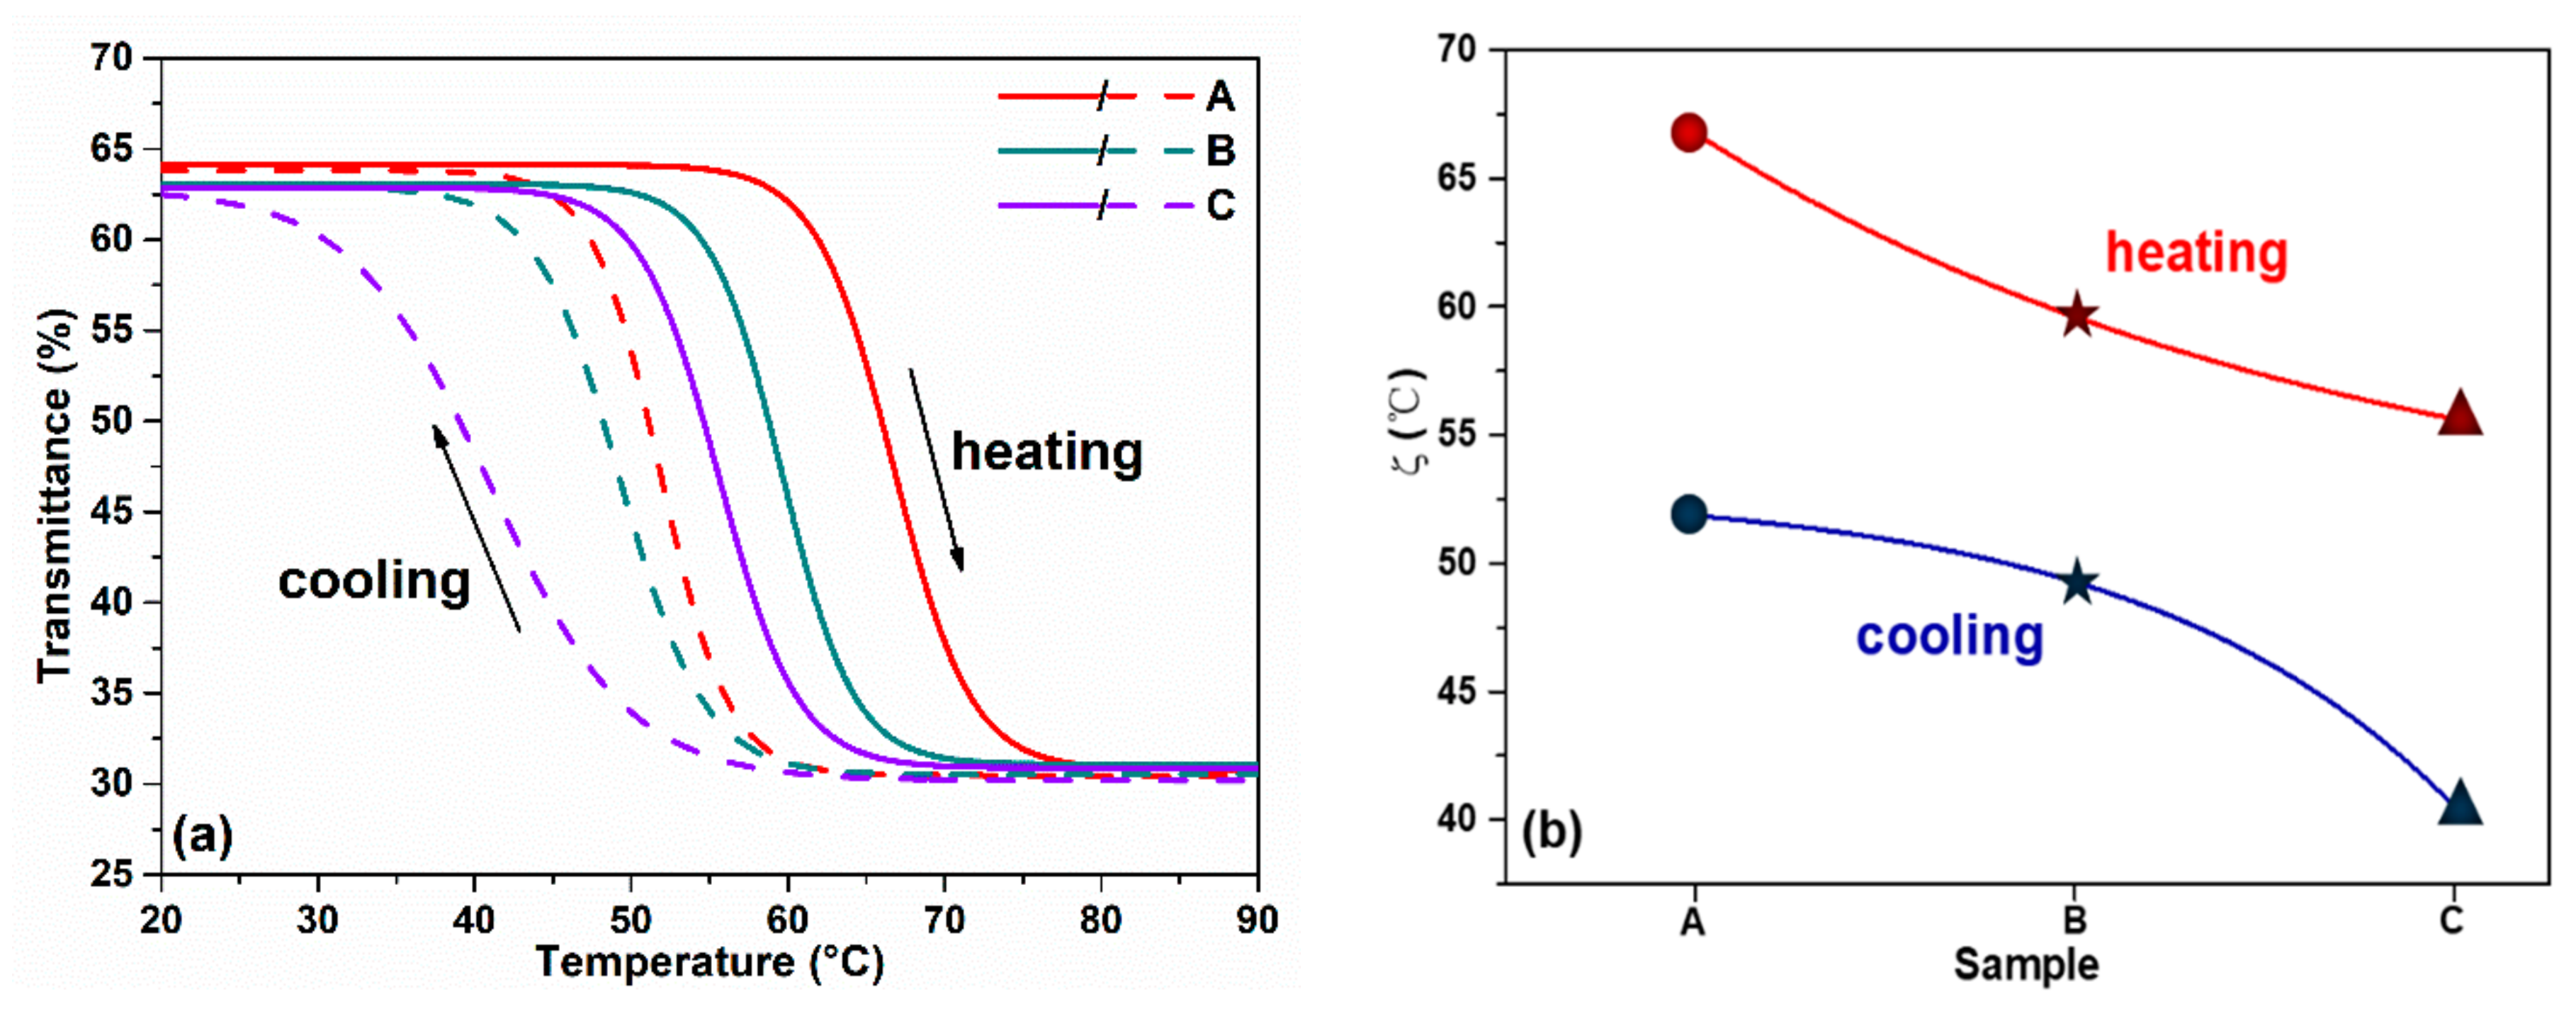
The thermochromism characteristics of VO2 films were investigated by measuring their temperature dependence of IR transmittance at λ = 1550 nm. The transmittance-temperature dependence curves in the heating and cooling processes are shown in Figure 2a, and the transition temperature in the heating process ζch and cooling process ζcl are shown in Figure 2b. The thermal hysteresis loop curves clearly exhibit that all samples have high phase transition performance. The transmittance at λ = 1550 nm changed from 65% in low temperature semiconductor state to 30% in high temperature metallic state. For sample A of the as-grown pure VO2, the heating and cooling phase transition temperatures are ζch = 67 °C and ζcl = 52 °C, respectively. The average phase transition temperature ζc = (ζch + ζcl)/2 of sample A is 59.5 °C. When the sample surface was covered with an ultra-thin heavy Cr-doped layer, notable reducing of phase transition temperature was found, either unannealed or annealed. For the unannealed sample B, the ζc decreasing may be related to the interface stresses between the two layers. While for sample C, phase transition temperature further decreased from 54.5 °C to 48.0 °C after annealing. Figure 2a also shows that the phase transition amplitude almost keeps constant among the different samples.
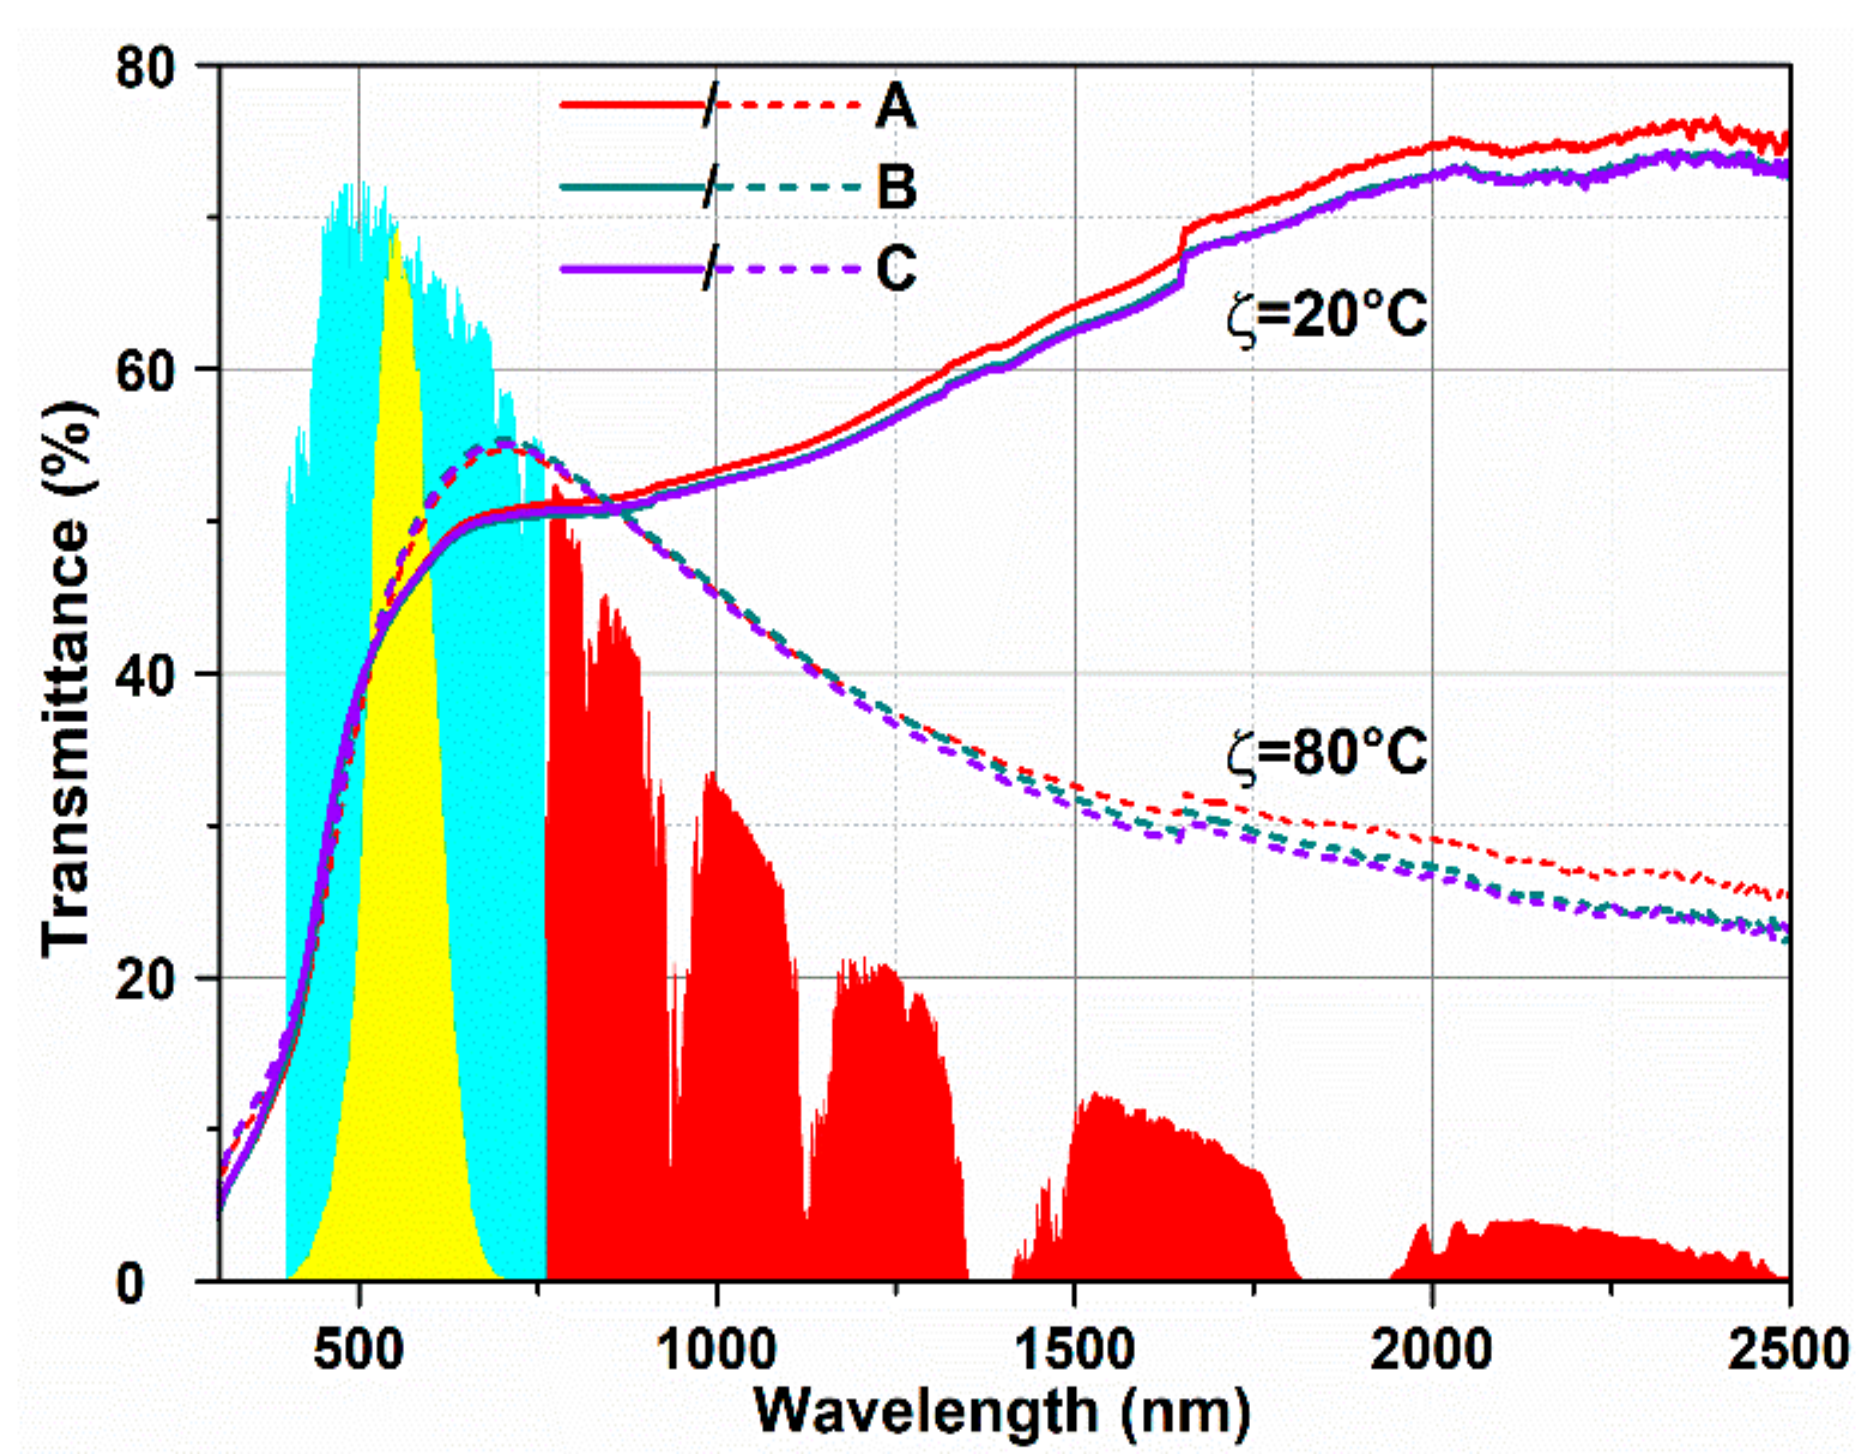
Figure 3 shows the transmittance spectra ranged from near ultraviolet to near-infrared region of the samples at ambient temperature and 80 °C, respectively. All the films show transmittance changes in the IR region after MIT. We also noticed that the transmittance spectra of the three samples are almost overlapped. Only a weak change of transmittance spectra was observed after being covered ultra-thin heavy Cr-doped layer. Combining the results of the above transmittance thermal hysteresis loop, we can conclude that the overlayer has not induced weakening of the phase transition performance. Based on the transmittance spectra, solar energy modulation ability of the samples was calculated according to the formula below [29]:
T i = ϕ i λ T λ d λ ϕ i λ d λ
  Δ T IR , sol   =   T IR , sol 20   ° C T IR , sol 80   ° C .
where T(λ) is the transmittance at wavelength λ, i denotes lum or sol, ϕsol(λ) is the solar irradiance spectrum at air mass 1.5, which likes the angle of incidence of sunlight is 37°, and ϕlum(λ) is the standard luminous efficiency function for the photopic vision of human eyes (380–780 nm). Tsol is effective utilization of solar energy in thin films, and ΔTIR,sol is the solar energy modulation of VO2 films in IR region, the region of 760–2500 nm is always chosen for calculation. According to the above formulas, the three samples have almost the same solar energy modulation capability of ΔTIR,sol = 12%, which meets the requirement of the smart windows application.
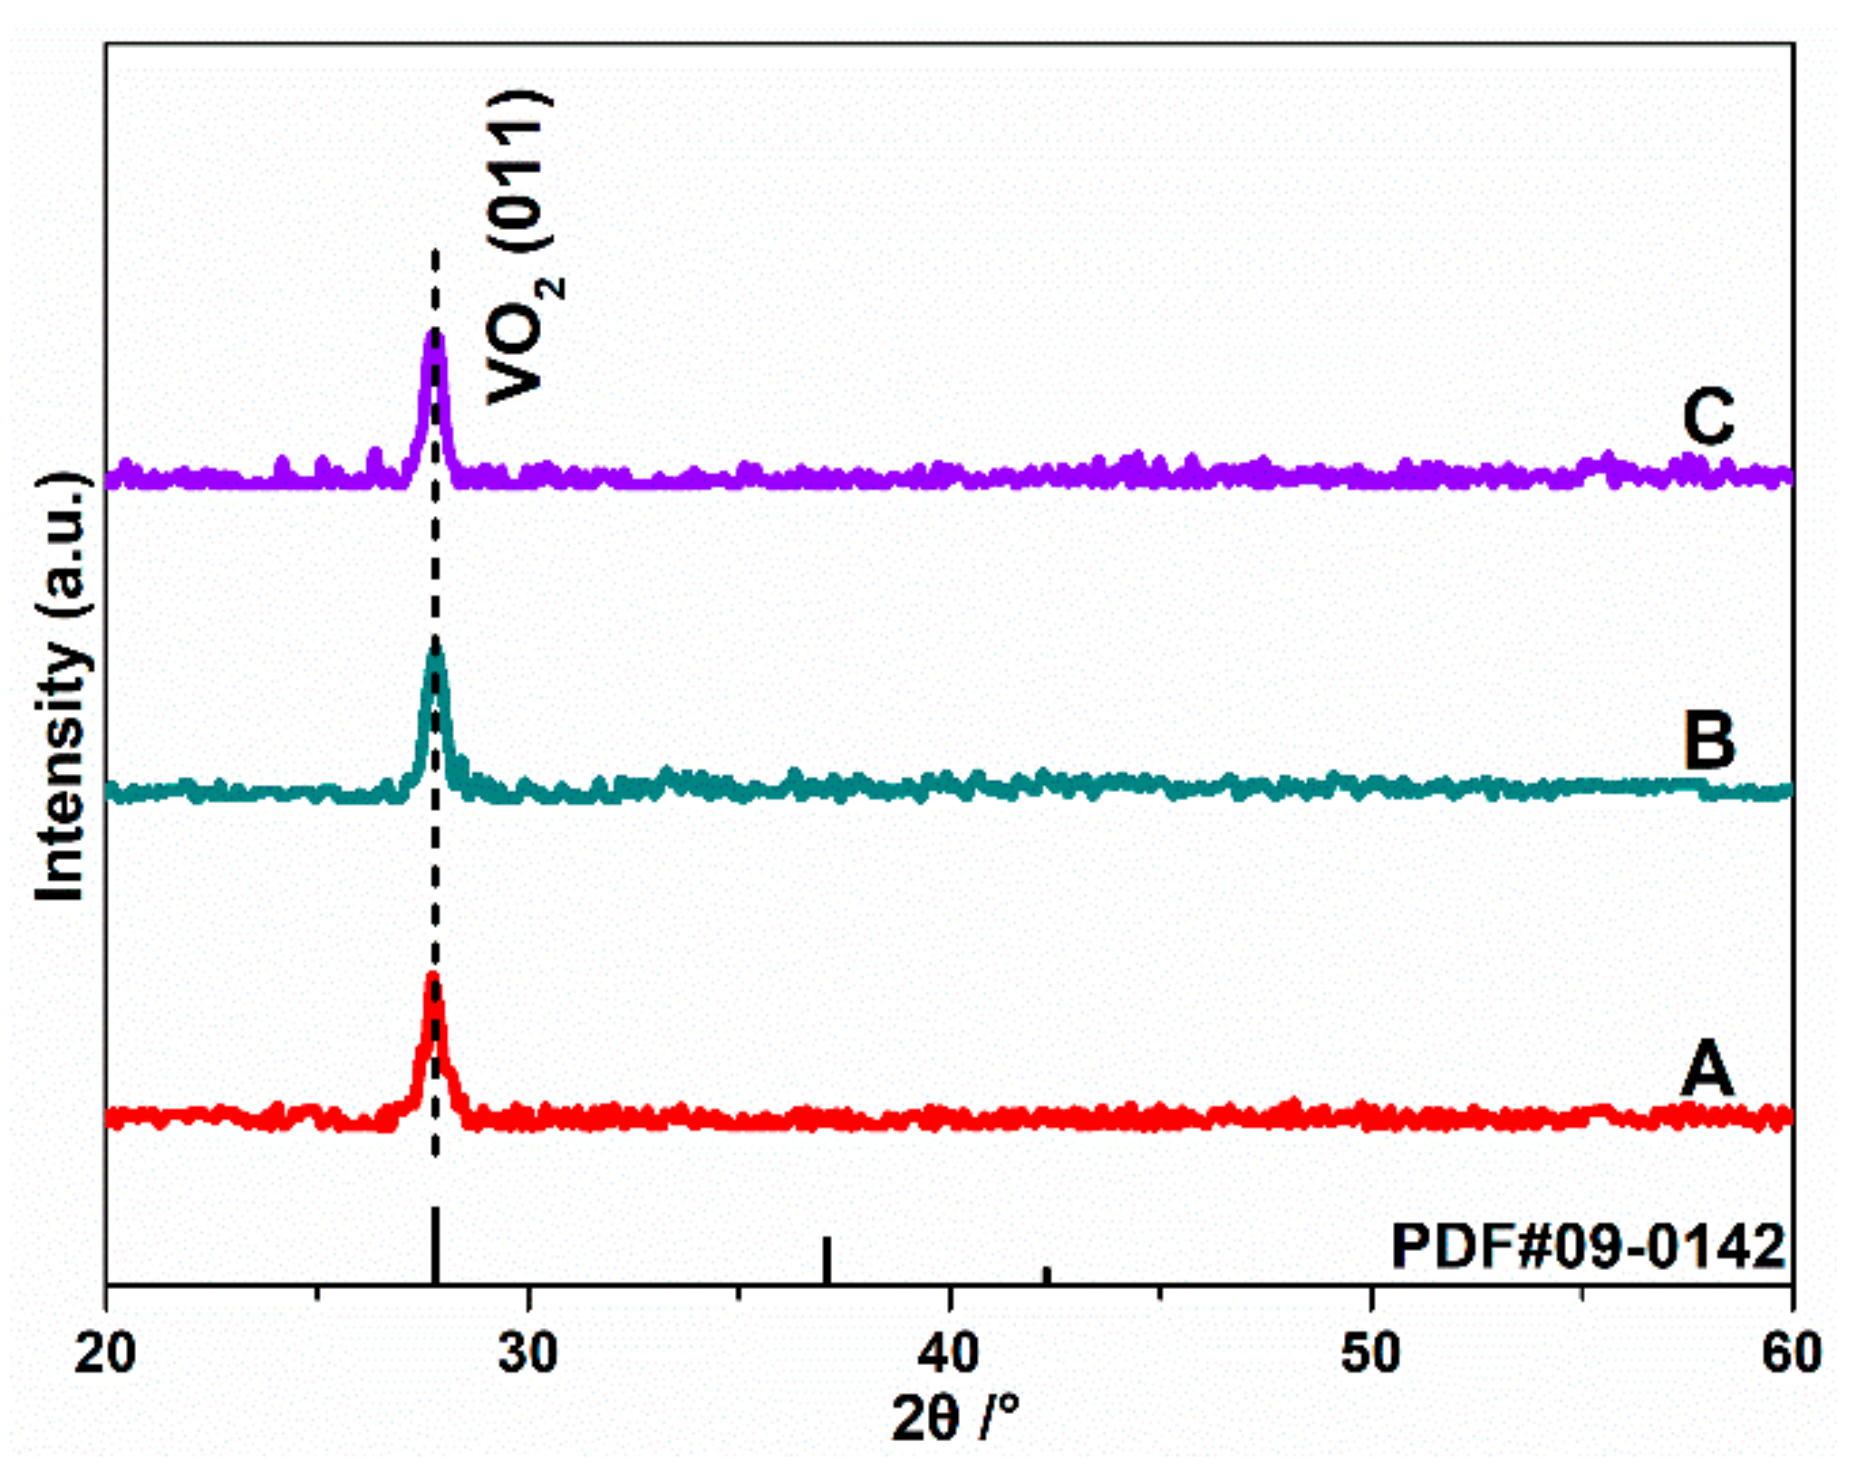
Figure 4 shows the XRD spectra of the three different samples prepared with different procedures. The standard pattern of monoclinic (M) VO2 (PDF#09-0142) is also present together for reference. In the XRD patterns, the peaks located at about 2θ = 27.76° are corresponding to the characteristic pattern of VO2, which shows the structure of monoclinic type with a (011) preferred orientation. The characteristic peaks of chromium oxides are not observed in sample B and C, indicating that chromium oxides in covered layer is too thin to detect, or Cr atoms entered the crystal lattice of VO2 rather than a separate phase. We notice that the (011) diffraction peak position of 27.76° in our study lower than 27.86° of VO2 powder from standard powder diffraction file (PDF) card, the residual stress may play the key role to the diffraction peak blue shifting.
Raman spectra of the VO2 films at room temperature is shown in Figure 5. The spectra reveal that all samples have the same characteristic peaks, which appear at 193 cm−1, 224 cm−1, 308 cm−1, 390 cm−1, 498 cm−1, and 614 cm−1, identified to the VO2 monoclinic phase [30]. No characteristic peaks of chromium oxides or other vanadium oxides appear, indicating that the main ingredient of films is VO2, which can explain the temperature-transmittance hysteresis loop. The monoclinic phase is thus characterized by 18 Raman active modes with 9Ag and 9Bg modes [31]. Among 193 cm−1, 224 cm−1, 308 cm−1, 498 cm−1, and 614 cm−1 confirm the Ag symmetry mode, another 390 cm−1 corresponds to the Bg phonon mode [32]. This result is consistent with previous reports. The peaks at 193 cm−1, 224 cm−1 are assigned to V-V vibration modes, whereas those in the high frequency of 308 cm−1, 498 cm−1, and 614 cm−1 are assigned to V-O vibration modes [33].
Figure 6 shows the surface morphologies of the VO2 film samples. All samples exhibit high crystallinity, continuous and dense structure, which are consistent with XRD results. For as-grown pure VO2 sample A, some nanorods discontinuous distributed on the surface. While for the sample C, which covered with an ultra-thin heavy Cr-doped layer and 30 min vacuum atmosphere annealing, these nanorods almost disappeared. Due to the nanorods still could be seen on the surface of unannealed sample B, it is reasonable to deduce that the nanorods as well as ultra-thin covered layer has been completely integrated into the film matrix in sample C.
Temperature dependence of the electrical resistivity R curves of VO2 films in heating process are shown in Figure 7. Abruptly change of resistance from low temperature to high temperature has been seen like IR-transmittance-temperature curve. We also noticed that the sheet resistance decreased in room temperature state after covered with heavy Cr-doped layer either unannealed or annealed.
The temperature dependence of electrical resistivity of VO2 thin films in the semiconducting state can be expressed as [34]:
R = R 0 exp E c E f k ζ
where Ec is the energy of the edge of the conduction band, Ef is the Fermi level, k is the Boltzmann constant, and R0 is the resistance at ζ→∞.
Temperature coefficient of resistance (TCR) defined as the slope of the natural logarithm of electrical resistivity R in semiconducting state with temperature [35]:
T C R = 1 R d R d ζ
Combining Equations (3) and (4) yields [36]
Δ E = k ζ 2 × T C R
This relation links the activation energy ΔE = EcEf to TCR [37]. The activation energy in semiconductor state and conductivity at room temperature in our work are calculated (see Table 1). In ambient temperature, the carrier concentration of the three samples are 3.0163 × 1017 cm−3, −6.8935 × 1017 cm−3, and −1.9045 × 1018 cm−3, respectively. It is clear that the VO2 samples with heavy Cr-doped ultra-thin layer have higher conductivity and carrier concentration compared with the as-grown sample A. Due to the low conductivity in pure VO2 bottom layer, it reveals that higher concentration carriers may only locate within the upper layer locally.
The transition temperature can be affected by lattice strain [38], crystal size [39], ions doping [40], etc. From XRD spectra and SEM images, it can be seen that the diffraction peak position and grain size are basically unchanged in this work. So the phase transition temperature variation attributed to lattice strain and grain size is negligible in our research. It is reported that the phase transition behavior of the VO2 thin films also could be influenced by carrier concentration. C. W. Zou [41] reported that the MIT could be controlled by modifying carrier density. For the Mott phase transition, the critical electron density nc can be expressed as below equation:
n c = m * e 2 4 2 ε 3
where ε is the dielectric constant (∼100 for VO2), ħ is the Planck constant, and m and e are the effective mass and charge of an electron, respectively [42] For MIT in VO2, nc ≈ 3 × 1018 cm−3 [43]. For sample B and C with low activation energy, the samples’ surface is heavy Cr-doped layer and has high carrier concentration. It is easier to generate more carriers to reach the phase transition critical value of nc and first induce local phase transition. MIT process will lead to carrier concentration increasing further. The carriers will diffuse from upper layer to bottom according to Fick’s first law:
J = D d n d x
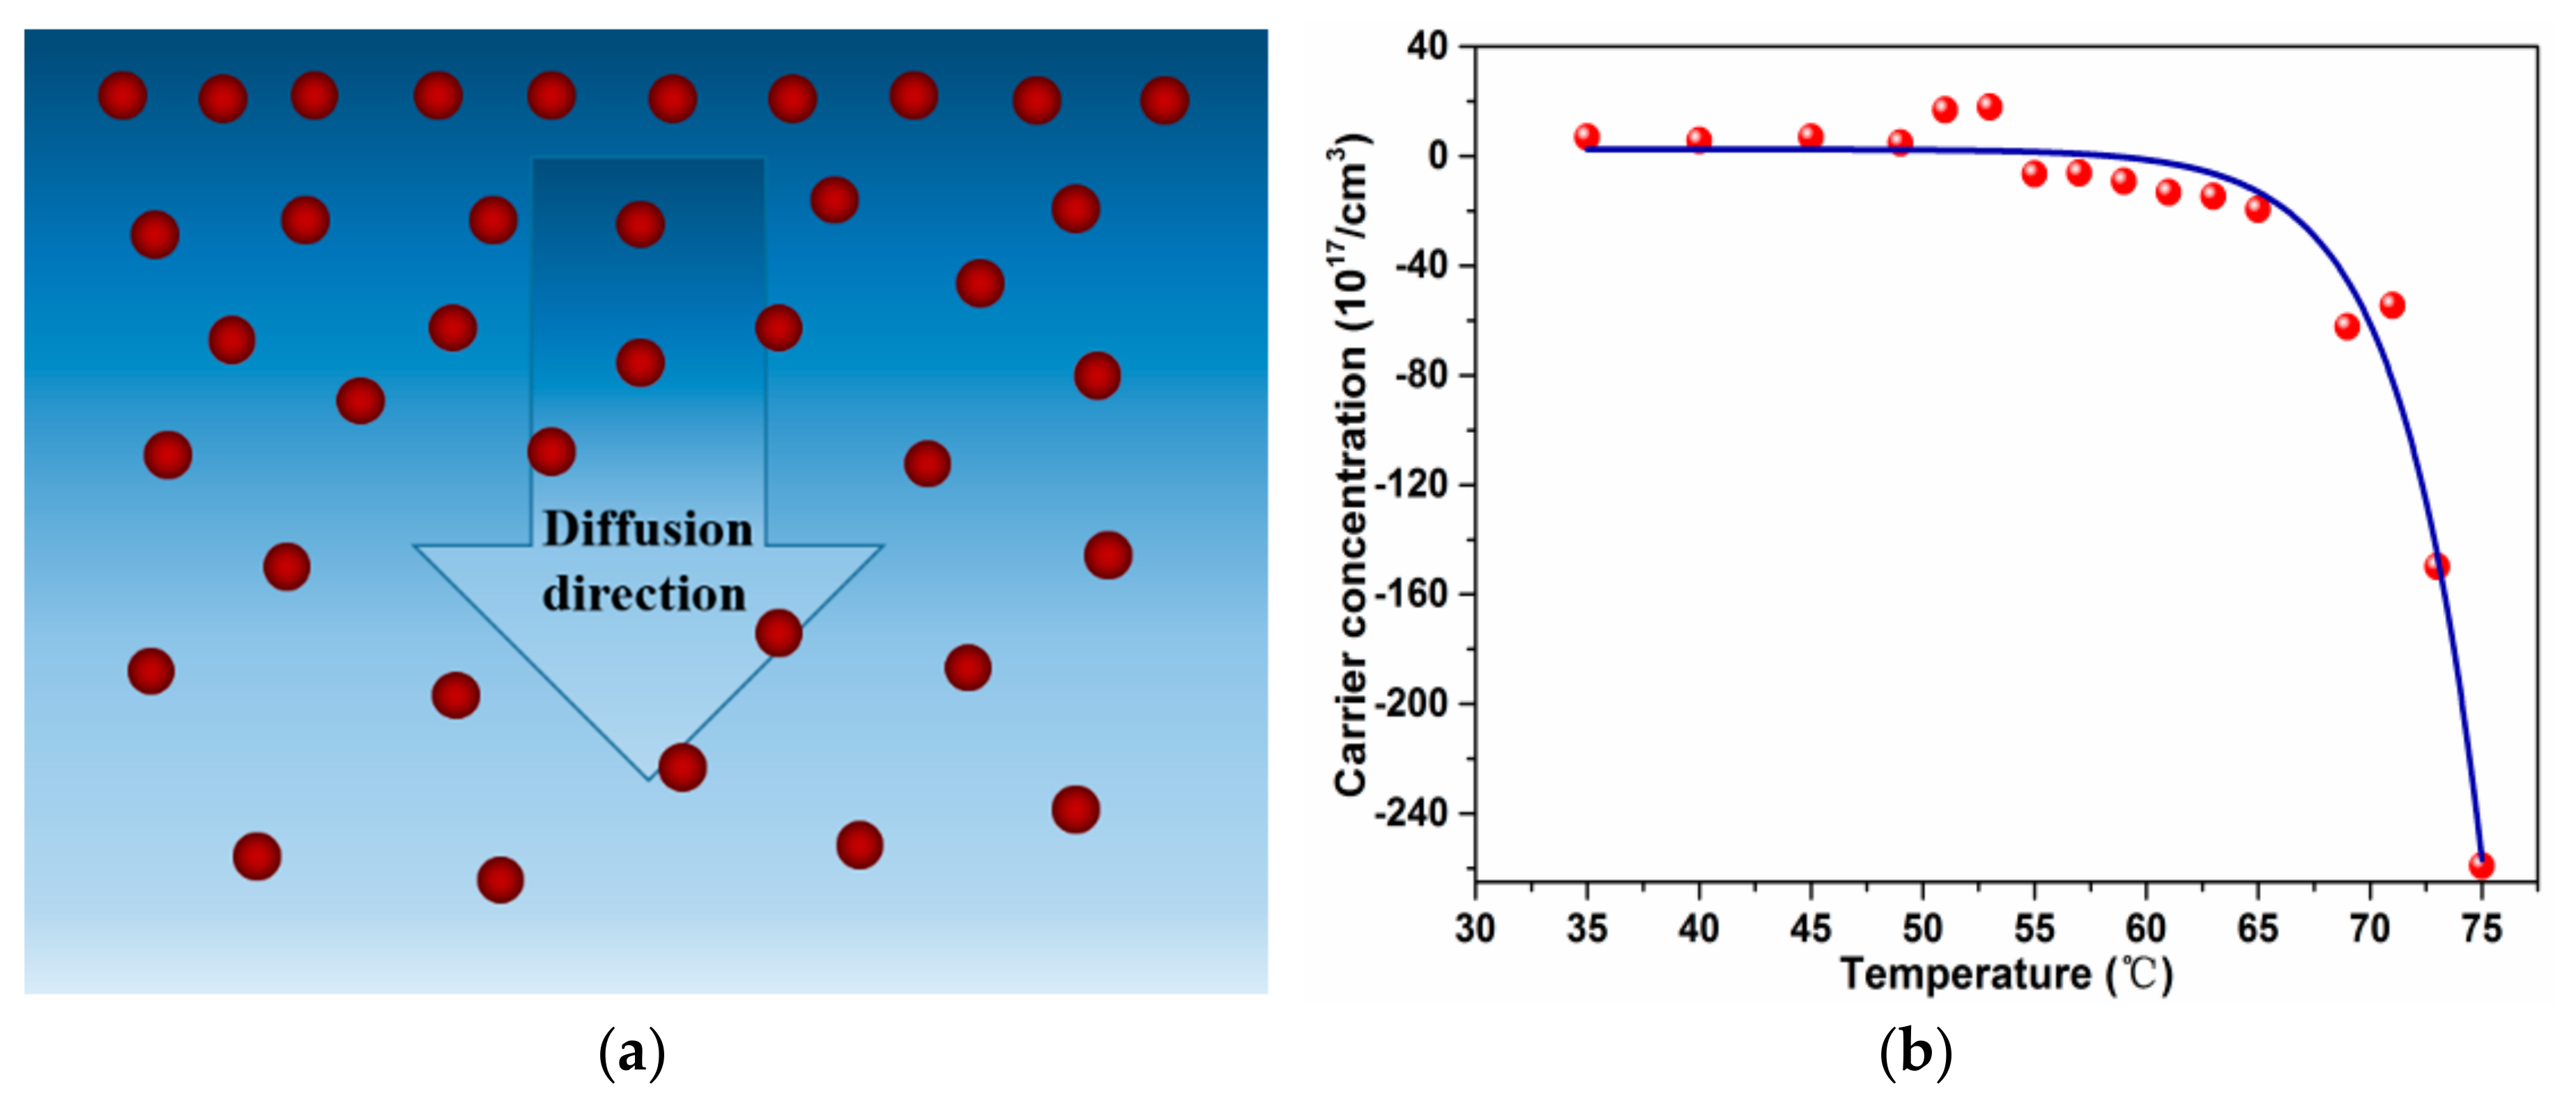
where D is carrier diffusion coefficient, J is diffusion flux, and dn/dx is the carrier concentration gradient [44]. With temperature increasing, the diffusion coefficient D and carrier concentration gradient dn/dx in the vertical direction of the film surface increased too. It will lead to higher carrier diffusion flux and phase transition occurring from upper layer to bottom layer gradually. It is reasonable to deduce that the upper heavy Cr-doped ultra-thin VO2 film play the role of phase transition induction layer initially, which could reduce the phase transition temperature ζc due to the carrier injection (Figure 8a).
Figure 8b shows the temperature-dependent carrier concentration of pure VO2 thin films. In the low-temperature insulating monoclinic state, the free-carriers type is holes. With temperature increasing, carriers gradually changed to electrons, and a sharp increasing of electrons concentration was observed when temperature increase to ~70 °C, and the film turns into the metal rutile state.

4. Conclusions

In summary, VO2 films were prepared by reactive pulsed magnetron sputtering, and a 3 nm ultra-thin heavy Cr-doped VO2 layer prepared by reactive co-sputtering was employed to cover the pure VO2 film. Then the covered samples were annealed in vacuum atmosphere. By characterizing the phase transition performances, microstructures, and electrical properties of the samples, phase transition temperature sharp decreasing of the covered ultra-thin heavy Cr-doped layer films was observed, and annealing could strengthen this effect. No obvious change of the microstructure and phase transition performance has been found before and after covering an ultra-thin layer on the pure VO2 film. The three samples have almost the same solar energy modulation capability of ΔTIR,sol = 12%. It is reasonable to deduce that the upper ultra-thin high Cr-doped layer, which has high carrier concentration, may act as induced-layer to generate more carriers to reach the threshold nc and induced phase transition. This process will occur from upper layer to bottom layer gradually until phase transition occurs throughout the VO2 film by carrier diffusion with temperature increasing. This is a simple method to reduce ζc and keep phase transition phase performance.

Author Contributions

Conceptualization, H.G. and D.Z.; methodology, H.G., Y.Y., Q.H., J.Q.; investigation, D.Z., Y.L., A.Z., P.F.; writing-original draft preparation, H.G., D.Z.; funding acquisition, D.Z. All authors have read and agreed to the published version of the manuscript.

Funding

This research received no external funding.

Acknowledgments

This research was supported by Science & Technology Project of Shenzhen (JCYJ20180305124038881).

Conflicts of Interest

The authors declare no conflict of interest.

References

  1. Case, F.C. Modifications in the phase Transition Properties of Predeposited VO2 Films. J. Vac. Sci. Technol. A Vac. Surf. Film. 1984, 2, 1509–1512. [Google Scholar] [CrossRef]
  2. Boriskov, P.P.; Velichko, A.A.; Pergament, A.L.; Stefanovich, G.B.; Stefanovich, D.G. The Effect of Electric Field on Metal-Insulator Phase Transition in Vanadium Dioxide. Tech. Phys. Lett. 2002, 28, 406–408. [Google Scholar] [CrossRef]
  3. Zhao, Y.; Hwan Lee, J.; Zhu, Y.; Nazari, M.; Chen, C.; Wang, H.; Bernussi, A.; Holtz, M.; Fan, Z. Structural, Electrical, and Terahertz Transmission Properties of VO2 Thin Films Grown on c-, r-, and m-Plane Sapphire Substrates. J. Appl. Phys. 2012, 111, 053533. [Google Scholar] [CrossRef]
  4. Hao, R.; Li, Y.; Liu, F.; Sun, Y.; Tang, J.; Chen, P.; Jiang, W.; Wu, Z.; Xu, T.; Fang, B. Electric Field Induced Metal–Insulator Transition in VO2 Thin Film Based on FTO/VO2/FTO Structure. Infrared Phys. Technol. 2016, 75, 82–86. [Google Scholar] [CrossRef]
  5. Chen, S.; Ma, H.; Yi, X.; Xiong, T.; Wang, H.; Ke, C. Smart VO2 Thin Film for Protection of Sensitive Infrared Detectors from Strong Laser Radiation. Sens. Actuators A Phys. 2004, 115, 28–31. [Google Scholar] [CrossRef]
  6. Belyaev, M.A.; Putrolaynen, V.V.; Velichko, A.A.; Stefanovich, G.B.; Pergament, A.L. Field-Effect Modulation of Resistance in VO2 Thin Film at Lower Temperature. Jpn. J. Appl. Phys. 2014, 53, 111102. [Google Scholar] [CrossRef]
  7. Tselev, A.; Lavrik, N.V.; Kolmakov, A.; Kalinin, S.V. Scanning Near-Field Microwave Microscopy of VO2 and Chemical Vapor Deposition Graphene. Adv. Funct. Mater. 2013, 23, 2635–2645. [Google Scholar] [CrossRef]
  8. Arcangeletti, E.; Baldassarre, L.; Di Castro, D.; Lupi, S.; Malavasi, L.; Marini, C.; Perucchi, A.; Postorino, P. Evidence of a Pressure-Induced Metallization Process in Monoclinic VO2. Phys. Rev. Lett. 2007, 98, 196406. [Google Scholar] [CrossRef] [Green Version]
  9. Li, W.; Chang, S.; Wang, X.; Lin, L.; Bai, J. A Thermally Tunable Terahertz Bandpass Filter with Insulator-Metal Phase Transition of VO2 Thin Film. Optoelectron. Lett. 2014, 10, 180–183. [Google Scholar] [CrossRef]
  10. Ha, S.D.; Zhou, Y.; Fisher, C.J.; Ramanathan, S.; Treadway, J.P. Electrical Switching Dynamics and Broadband Microwave Characteristics of VO2 Radio Frequency Devices. J. Appl. Phys. 2013, 113, 184501. [Google Scholar] [CrossRef] [Green Version]
  11. Radu, I.P.; Martens, K.; Mertens, S.; Adelmann, C.; Shi, X.; Tielens, H.; Schaekers, M.; Pourtois, G.; Van Elshocht, S.; De Gendt, S.; et al. (Invited) Vanadium Oxide as a Memory Material. ECS Trans. 2011, 35, 233–243. [Google Scholar]
  12. Huang, Z.; Chen, S.; Lv, C.; Huang, Y.; Lai, J. Infrared Characteristics of VO2 Thin Films for Smart Window and Laser Protection Applications. Appl. Phys. Lett. 2012, 101, 191905. [Google Scholar] [CrossRef]
  13. Liao, F.; Zhu, Z.; Yan, Z.; Yao, G.; Huang, Z.; Gao, M.; Pan, T.; Zhang, Y.; Li, Q.; Feng, X.; et al. Ultrafast Response Flexible Breath Sensor Based on Vanadium Dioxide. J. Breath Res. 2017, 11, 036002. [Google Scholar] [CrossRef] [PubMed]
  14. Belyaev, M.A.; Velichko, A.A.; Boriskov, P.P.; Kuldin, N.A.; Putrolaynen, V.V.; Stefanovitch, G.B. The Field Effect and Mott Transistor Based on Vanadium Dioxide. J. Sel. Top. Nano Electron. Comput. 2014, 1, 26–30. [Google Scholar] [CrossRef] [Green Version]
  15. Xiao, L.; Ma, H.; Liu, J.; Zhao, W.; Jia, Y.; Zhao, Q.; Liu, K.; Wu, Y.; Wei, Y.; Fan, S.; et al. Fast Adaptive Thermal Camouflage Based on Flexible VO2/Graphene/CNT Thin Films. Nano Lett. 2015, 15, 8365–8370. [Google Scholar] [CrossRef]
  16. Li, S.-Y.; Niklasson, G.A.; Granqvist, C.G. Thermochromic Fenestration with VO2-Based Materials: Three Challenges and How They can be Met. Thin Solid Film. 2012, 520, 3823–3828. [Google Scholar] [CrossRef]
  17. Li, S.; Li, Y.; Jiang, M.; Ji, S.; Luo, H.; Gao, Y.; Jin, P. Preparation and Characterization of Self-Supporting Thermochromic Films Composed of VO2(M)@SiO2 Nanofibers. ACS Appl. Mater. Interfaces 2013, 5, 6453–6457. [Google Scholar] [CrossRef]
  18. Yuan, N.; Li, J.; Li, G.; Chen, X. The Large Modification of Phase Transition Characteristics of VO2 Films on SiO2/Si Substrates. Thin Solid Film. 2006, 515, 1275–1279. [Google Scholar] [CrossRef]
  19. Chen, C.; Zhao, Y.; Pan, X.; Kuryatkov, V.; Bernussi, A.; Holtz, M.; Fan, Z. Influence of Defects on Structural and Electrical Properties of VO2 Thin Films. J. Appl. Phys. 2011, 110, 023707. [Google Scholar] [CrossRef]
  20. Appavoo, K.; Lei, D.Y.; Sonnefraud, Y.; Wang, B.; Pantelides, S.T.; Maier, S.A.; Haglund, R.F. Role of Defects in the Phase Transition of VO2 Nanoparticles Probed by Plasmon Resonance Spectroscopy. Nano Lett. 2012, 12, 780–786. [Google Scholar] [CrossRef]
  21. Piccirillo, C.; Binions, R.; Parkin, I.P. Nb-Doped VO2 Thin Films Prepared by Aerosol-Assisted Chemical Vapour Deposition. Eur. J. Inorg. Chem. 2007, 2007, 4050–4055. [Google Scholar] [CrossRef]
  22. Khan, G.R.; Asokan, K.; Ahmad, B. Room Temperature Tunability of Mo-doped VO2 Nanofilms across Semiconductor to Metal Phase Transition. Thin Solid Film. 2017, 625, 155–162. [Google Scholar] [CrossRef]
  23. Piccirillo, C.; Binions, R.; Parkin, I.P. Synthesis and Characterisation of W-doped VO2 by Aerosol Assisted Chemical Vapour Deposition. Thin Solid Film. 2008, 516, 1992–1997. [Google Scholar] [CrossRef]
  24. Wang, N.; Duchamp, M.; Dunin-Borkowski, R.E.; Liu, S.; Zeng, X.; Cao, X.; Long, Y. Terbium-Doped VO2 Thin Films: Reduced Phase Transition Temperature and Largely Enhanced Luminous Transmittance. Langmuir 2016, 32, 759–764. [Google Scholar] [CrossRef]
  25. Chae, B.G.; Kim, H.T.; Yun, S.J. Characteristics of W- and Ti-Doped VO2 hin Films Prepared by Sol-Gel Method. Electrochem. Solid State Lett. 2008, 11, D53. [Google Scholar] [CrossRef]
  26. Panagopoulou, M.; Gagaoudakis, E.; Boukos, N.; Aperathitis, E.; Kiriakidis, G.; Tsoukalas, D.; Raptis, Y.S. Thermochromic Performance of Mg-doped VO2 Thin Films on Functional Substrates for Glazing Applications. Sol. Energy Mater. Sol. Cells 2016, 157, 1004–1010. [Google Scholar] [CrossRef]
  27. Jin, P.; Tazawa, M.; Yoshimura, K.; Igarashi, K.; Tanemura, S.; Macák, K.; Helmersson, U. Epitaxial Growth of W-Doped VO2/V2O3 Multilayer on α-Al2O3(110) by Reactive Magnetron Sputtering. Thin Solid Film. 2000, 375, 128–131. [Google Scholar] [CrossRef]
  28. Batista, C.; Ribeiro, R.M.; Teixeira, V. Synthesis and Characterization of VO2-Based Thermochromic Thin Films for Energy-Efficient Windows. Nanoscale Res. Lett. 2011, 6, 301. [Google Scholar] [CrossRef] [Green Version]
  29. Balin, I.; Wang, S.; Wang, P.; Long, Y.; Abdulhalim, I. Enhanced Transition-Temperature Reduction in a Half-Sphere Au/VO2 Core-Shell Structure: Local Plasmonics Versus Induced Stress and Percolation Effects. Phys. Rev. Appl. 2019, 11, 034064. [Google Scholar] [CrossRef]
  30. Schilbe, P. Raman Scattering in VO2. Phys. B Condens. Matter 2002, 316–317, 600–602. [Google Scholar] [CrossRef]
  31. Pan, M.; Liu, J.; Zhong, H.; Wang, S.; Li, Z.; Chen, X.; Lu, W. Raman Study of the Phase Transition in VO2 Thin Films. J. Cryst. Growth 2004, 268, 178–183. [Google Scholar] [CrossRef]
  32. Zhang, C.; Yang, Q.; Koughia, C.; Ye, F.; Sanayei, M.; Wen, S.-J.; Kasap, S. Characterization of Vanadium Oxide Thin Films with Different Stoichiometry Using Raman Spectroscopy. Thin Solid Film. 2016, 620, 64–69. [Google Scholar] [CrossRef]
  33. Shibuya, K.; Tsutsumi, J.; Hasegawa, T.; Sawa, A. Fabrication and Raman Scattering Study of Epitaxial VO2 Films on MgF2 (001) Substrates. Appl. Phys. Lett. 2013, 103, 021604. [Google Scholar] [CrossRef]
  34. Wang, Y.; Zhang, Z.; Zhu, Y.; Li, Z.; Vajtai, R.; Ci, L.; Ajayan, P.M. Nanostructured VO2 Photocatalysts for Hydrogen Production. ACS Nano 2008, 2, 1492–1496. [Google Scholar] [CrossRef]
  35. Pan, M.; Zhong, H.; Wang, S.; Liu, J.; Li, Z.; Chen, X.; Lu, W. Properties of VO2 Thin Film Prepared with Precursor VO2. J. Cryst. Growth 2004, 265, 121–126. [Google Scholar] [CrossRef]
  36. Liu, H.; Wan, D.; Ishaq, A.; Chen, L.; Guo, B.; Shi, S.; Luo, H.; Gao, Y. Sputtering Deposition of Sandwich-Structured V2O5/Metal(V, W)/V2O5 Multilayers for the Preparation of High-Performance Thermally Sensitive VO2 Thin Films with Selectivity of VO2(B) and VO2(M) Polymorph. ACS Appl. Mater. Interfaces 2016, 8, 7884–7890. [Google Scholar] [CrossRef]
  37. Mai, L.Q.; Hu, B.; Hu, T.; Chen, W.; Gu, E.D. Electrical Property of Mo-Doped VO2 Nanowire Array Film by Melting−Quenching Sol−Gel Method. J. Phys. Chem. B 2006, 110, 19083–19086. [Google Scholar] [CrossRef]
  38. Lee, D.; Lee, J.; Song, K.; Xue, F.; Choi, S.-Y.; Ma, Y.; Podkaminer, J.; Liu, D.; Liu, S.-C.; Chung, B.; et al. Sharpened VO2 Phase Transition via Controlled Release of Epitaxial Strain. Nano Lett. 2017, 17, 5614–5619. [Google Scholar] [CrossRef]
  39. Dai, L.; Cao, C.; Gao, Y.; Luo, H. Synthesis and Phase Transition Behavior of Undoped VO2 with a Strong Nano-Size Effect. Sol. Energy Mater. Sol. Cells 2011, 95, 712–715. [Google Scholar] [CrossRef]
  40. Ji, H.; Wei, J.; Natelson, D. Modulation of the Electrical Properties of VO2 Nanobeams Using an Ionic Liquid as a Gating Medium. Nano Lett. 2012, 12, 2988–2992. [Google Scholar] [CrossRef]
  41. Chen, F.H.; Fan, L.L.; Chen, S.; Liao, G.M.; Chen, Y.L.; Wu, P.; Song, L.; Zou, C.W.; Wu, Z.Y. Control of the Metal–Insulator Transition in VO2 Epitaxial Film by Modifying Carrier Density. ACS Appl. Mater. Interfaces 2015, 7, 6875–6881. [Google Scholar] [CrossRef] [PubMed]
  42. Stefanovich, G.; Pergament, A.; Stefanovich, D. Electrical Switching and Mott Transition in VO2. J. Phys. Condens. Matter 2000, 12, 8837–8845. [Google Scholar] [CrossRef]
  43. Pergament, A. Metal–Insulator Transition: The Mott Criterion and Coherence Length. J. Phys. Condens. Matter 2003, 15, 3217–3223. [Google Scholar] [CrossRef]
  44. Kasırga, T.S.; Coy, J.M.; Park, J.H.; Cobden, D.H. Visualization of One-Dimensional Diffusion and Spontaneous Segregation of Hydrogen in Single Crystals of VO2. Nanotechnology 2016, 27, 345708. [Google Scholar] [CrossRef] [PubMed] [Green Version]
Figure 1. Schematic of the films structure, (A) is the pure VO2 thin film, (B) is the unannealed Cr-doped VO2 thin film, (C) is the Cr-doped VO2 thin films annealing at 250 °C.
Nanomaterials 10 00058 g001
Figure 2. (a) Transmittance thermal hysteresis loop of all samples at λ = 1550 nm, (b) the ζch and ζcl of all samples.
Nanomaterials 10 00058 g002
Figure 3. Optical transmittance spectra (300–2500 nm) at room temperature and 80 °C of the samples. The colored areas indicate the normalized values of spectral irradiance corresponding to the visible (blue) and near infrared radiation (red) ranges of solar spectra, and the yellow area indicates the values of eye sensitivity function.
Nanomaterials 10 00058 g003
Figure 4. XRD patterns of all samples. (A) is the pure VO2 thin film, (B) is the unannealed Cr-doped VO2 thin film, (C) is the Cr-doped VO2 thin films annealing at 250 °C.
Nanomaterials 10 00058 g004
Figure 5. Raman spectra of all samples. (A) is the pure VO2 thin film, (B) is the unannealed Cr-doped VO2 thin film, (C) is the Cr-doped VO2 thin films annealing at 250 °C.
Nanomaterials 10 00058 g005
Figure 6. SEM images of as-grown pure VO2 and an ultra-thin Cr-doped VO2 layer. (A) is the pure VO2 thin film, (B) is the unannealed Cr-doped VO2 thin film, (C) is the Cr-doped VO2 thin films annealing at 250 °C.
Nanomaterials 10 00058 g006
Figure 7. The lnR–1/ζ curve of all samples; the activation energy in the semiconductor phase is determined by linearly fitting the curve in low temperature state. (A) is the pure VO2 thin film, (B) is the unannealed Cr-doped VO2 thin film, (C) is the Cr-doped VO2 thin films annealing at 250 °C.
Nanomaterials 10 00058 g007
Figure 8. (a) Schematic of carrier distribution and diffusion in the cross-section of VO2 thin films. (b) Temperature-dependent carrier concentration of pure VO2 thin films.
Nanomaterials 10 00058 g008
Table 1. Activation energy in semiconductor state and conductivity at room temperature of all samples.
SampleABC
activation energy ΔE (eV)0.330.270.23
conductivity σ (S/m2)12.9524.1086.70
carrier concentration n (cm−3)3.0163 × 10¹⁷−6.8935 × 10¹⁷−1.9045 × 10¹⁸