Article

Hydrothermal SiO2 Nanopowders: Obtaining Them and Their Characteristics

1
Research Geotechnological Center, Far Eastern Branch of Russian Academy of Sciences, 30, Severo-Vostochny Highway, 683002 Petropavlovsk-Kamchatsky, Russia
2
School of Engineering, Far Eastern Federal University, 8, Sukhanova Str., 690950 Vladivostok, Russia
*
Author to whom correspondence should be addressed.
Nanomaterials 2020, 10(4), 624; https://doi.org/10.3390/nano10040624
Submission received: 21 February 2020 / Revised: 20 March 2020 / Accepted: 25 March 2020 / Published: 27 March 2020
(This article belongs to the Special Issue Sol-Gel Synthesis of Nanomaterials)

Abstract

:
The technological mode of obtaining amorphous SiO2 nanopowders based on hydrothermal solutions is proposed in this study. Polycondensation of orthosilicic acid as well as ultrafiltration membrane separation, and cryochemical vacuum sublimation were used. The characteristics of nanopowders were determined by tunneling electron microscopy, low-temperature nitrogen adsorption, X-ray diffraction, and small-angle X-ray scattering. The scheme allows to adjust density, particle diameters of nanopowders, specific surface area, as well as diameters, area and volume of the pore. Thus, the structure of nanopowders is regulated—the volume fraction of the packing of spherical particles in aggregates and agglomerates, the size of agglomerates, and the number of particles in agglomerates. The pour densities of the nanopowders depend on the SiO2 content in sols, which were 0.02 to 0.3 g/cm3. Nanoparticles specific surface area was brought to 500 m2/g by low temperature polycondensation. Nanoparticle aggregates specific pore volume (0.2–0.3 g/cm3) weakly depend on powders density. The volume fraction of the packing of SiO2 nanoparticles in aggregates was 0.6–0.7. Solid samples of compacted nanopowders had a compressive strength of up to 337 MPa. Possible applications of hydrothermal SiO2 nanopowders are considered.

1. Introduction

To date, a wide range of methods for producing various types of powders of amorphous dioxide silicon are known. At the same time, the need for SiO2 nanopowders—particles which have a high specific surface area up to 1000 m2/g and significant chemical activity—is increasing. Cheap sources of such materials and low-cost technologies for their production are needed.
Traditional applications of SiO2 nanopowders are known for the production of ceramics, glass, catalyst supports, sorbents, rubber fillers, polymeric materials, paper, abrasive materials, and medical preparations [1]. In the large-scale production of pyrogenic SiO2 nanopowders, the flame hydrolysis of SiCl4 in an atmosphere (H2-O2) is used [1]. The flame temperature, flow rate and volumetric proportions of SiCl4, H2, O2 gases, control the size and specific surface area of the nanoparticles. Another major production is the production of silica fume by condensation of gases in ferroalloy furnaces (condensed silica fume).
Another group of methods is based on the preparation of SiO2 particles from the liquid phase using a sol-gel transition. This group includes the preparation of SiO2 silicogels using a sol-gel transition followed by subcritical or supercritical gel drying [2,3]. In this case, the hydrolysis and polycondensation of molecules and the preparation of sols of colloidal particles of SiO2 are used at the first stage of the process. The precursors of SiO2 sols are metal alkoxides and chlorides, tetraethoxysilane and alkali metal silicates (Na, K, Li). At the gel stage, acid treatment with formamide is used to control the porous structure [4,5], and one of the most important parameters is the pH of the medium. The sol-gel method has produced a large number of mesoporous materials with a wide range of applications [6,7,8,9,10,11,12,13,14,15,16,17,18,19].
To obtain mesoporous materials, different variants of the Stober synthesis are used with the use of template additives of surfactants, water-soluble polymers, and previously obtained dense particles of sols [20]. Various forms of surfactant micellar solutions are used to synthesize mesoporous SiO2 particles [21,22,23,24,25,26,27,28]. SiO2 mesospheres are also synthesized with preliminary coagulation of the sol with electrolytes and subsequent polymer addition to separate the aggregates and prevent them from sticking together during drying [29]. There are methods for the synthesis of mixed oxides, hollow spheres, and objects of the core—mesoporous shell type [30,31]. SiO2 is one of the most common components for producing nanopowders, optical elements, medical preparations, thin films, fibers, nanotubes, nanowires, additives to hard films to increase tensile strength, hardness of hybrid coatings, and porous composite ceramics, SiO2-MexOynanocomposites [32,33,34,35,36,37,38,39,40,41,42,43,44,45]. The possibility of obtaining colloidal SiO2 based on cheap waste of glass powder was shown in [46]. The production of SiO2 powders from rice husk has been developed as well [47].
Hydrothermal solutions are a new raw material source for the production of SiO2 nanopowders. For its development, it is necessary to develop a technology for producing SiO2 nanopowders taking into account the parameters of the hydrothermal medium: temperature, pH, mineralization, ionic strength, polycondensation kinetics of orthosilicic acid, sizes and concentration of SiO2 particles, and stability of SiO2 nanoparticles in an aqueous medium.
The objectives of this article were:
- Create a technological route for the production of SiO2 nanopowders based on a hydrothermal solution with specific surface area up to 500 m2/g using the methods of ultrafiltration membrane separation and cryochemical vacuum sublimation.
- Create regulation parameters of the structure of the nanopowders: the diameters of SiO2 nanoparticles, specific surface area of nanopowders, diameters and specific pore volume, pour density, volume fraction of spherical particles in aggregates and agglomerates, sizes of agglomerates and number of particles in agglomerates.
- Assessment of possible applications of the obtained nanopowders.

2. Materials and Methods

2.1. Methods for Producing Nanopowders

Silica is formed in a hydrothermal solution from molecules of orthosilicic acid (OSA), which comes from the chemical interaction of water of a hydrothermal solution with aluminosilicate minerals of rocks (orthoclase, microcline K(AlSi3O8), albite Na(AlSi3O8), anorthite Ca(Al2Si2O8, etc.) in the bowels of hydrothermal deposits at high pressures (10–25 MPa and above) and temperatures (250–300 °C and above). As the solution rises to the surface through the productive wells of geothermal power plants (GeoPP), temperature and pressure decrease, and the solution becomes supersaturated with respect to the solubility of Ce amorphous silica. In the solution, polycondensation and nucleation of OSA molecules occur, leading to the formation of spherical silica nanoparticles with a diameter of 5 to 100 nm. In addition to silica, other components are in solution, the concentrations of which are given in Table 1. Silica is in solution in two states: solid (SiO2 particles) and dissolved (OSA molecules).
At the first stage of the process, OSA polycondensation and the growth of SiO2 nanoparticles were carried out at a certain temperature and pH of the hydrothermal solution. The final particle sizes of silica depend primarily on the temperature and pH at which the polycondensation of OSA molecules takes place. An increase in the polycondensation temperature and a decrease in pH slow down the reaction and increase the final particle size.
At the polycondensation stage, the temperature ranged from 20 to 90 °C (by preliminary cooling in heat exchangers), pH = 8.0–9.3. The range of silica concentrations in the initial solution is Ct = 400–800 mg/kg (t indicates the total silica content equal to the sum of the concentrations of the colloidal phase and dissolved Cs). The nucleation rate of silicic acid in an aqueous solution (nucl/(kg ∙ s)) is described by Equation (1) [48,49,50]:
I N = Q L P × Z × R M D × A c r × N A × M S i 1 × e Δ F c r / k B × T ,
where QLP = 3.34 × 1025 kg−1—the Lohse-Pound factor; kB—the Boltzmann constant; MSi—the molar mass of SiO2; NA—the Avogadro number; T—the absolute temperature, K; Acr = 4⋅π × Rc2—critical nucleus surface area, m2; ΔFcr = σs × Acr/3 = (16 × π/3) × σsw3(MSI/ρ × NA × kB×T × lnSm)2—change in free energy associated with the formation of a nucleus of critical radius Rc; ρ—density of amorphous silica, kg/m3; σsw—surface tension at the silica-water interface, J/m2; Z—Zeldovich factor.
Z = 2 Δ F c r / n c r 2 2 × π × k B × T ,
where ncr = (4 × π/3) × (ρ × NA/MSi) × Rc3—number of SiO2 molecules in the nucleus of critical size; Rc = 2 × σsw × MSi/(ρ × NA × kB × T × lnSm)—critical radius; Z = (2/3) × (3/(4π × ρ × ncr2))1/3 × (σsw/kB × T)0.5; RMD—the rate of molecular deposition of silicic acid (gcm2min−1), which determines the particle growth rate:
RMD = F(pH, pHnom) × kOH(T) × ff(Sa) × (1 − SN−1),
where kOH(T), F(pH, pHnom), ff(Sa)—auxiliary functions depending on temperature, pH, ionic strength Is and supersaturation Sm.
The characteristic polycondensation time—the temperature at which the supersaturation value decreased e = 2.71 times from the initial one—was at 20 °C and pH = 8.5, τp = 118.8 min, and at 50 °C, τp = 240.0 min.
With a decrease in the polycondensation temperature and an increase in the initial supersaturation Sm, the nucleation IN rate increased and, accordingly, the final average diameter dm of SiO2 nanoparticles decreased, and the polycondensation of OSA passed faster. At pH = 8.0–9.3 and temperatures of 65–90 °C, the dm values were 59–90 nm, at 40–65 °C, dm = 40–60 nm, and at 20–40 °C, dm = 5–40 nm.
After completion of the polycondensation of OSA and the growth of SiO2 nanoparticles, concentrated aqueous sols were obtained by three-stage ultrafiltration membrane concentration. At the first stage, the SiO2 content in the sol was increased from 0.05 to 0.3–0.4 wt.%, at the second stage it increased up to 10 wt.%, on the third it increased up to 20% to 40 wt.%. The capillary type ultrafiltration membrane cartridge had an internal capillary diameter of 0.8 mm, a filter surface area of 55 m2, a minimum mass weight cut off parameter MWCO = 10–100 kD, a pressure drop across the membrane layer of 0.025–0.4 MPa, and permeability membranes (0.025–0.8) m3/m2·h·MPa. The final SiO2 content in sols was brought to 100.0–600.0 g/dm3 = 10–40 wt.%, salinity TDS = 800–2000 mg/dm3, specific conductivity 0.8–1.56 mS/cm, and dynamic viscosity 1–120 MPa·s (20 °C). The choice of pore sizes of polymer ultrafiltration membranes (MWCO = 10–100 kD) can provide high selectivity for SiO2 nanoparticles and low selectivity for ions of dissolved salts. Therefore, the parameter ms = [SiO2]/TDS continuously increases with increasing SiO2 content (up to 300 and higher), the inverse parameter (1/ms) decreases to 0.003 and lower, and there was no accumulation of ions in the concentrate. As a result, the value of the zeta potential of the surface of nanoparticles in concentrated sols fell in the range from −56 to −25 mV, which ensured the stability of particles to aggregation due to electrostatic repulsion without forced incorporation of stabilizers with SiO2 content up to 62.5 wt.%. Figure 1 shows the results of dynamic light scattering determination of the diameter distribution of particle volume for a sol sample with a content of SiO2 = 178 g/dm3, pH = 9.0, the average diameter of SiO2 particles in volume dm = 8.5 nm. The average value of the zeta potential of the particle surface found by the method electrophoretic light scattering was ξm = −42.0 mV (Zetasizer, Malvern, UK).
SiO2 nanopowders were obtained using cryochemical vacuum sublimation of sols. Cryochemical technology includes a sequence of main stages:
(1) Dispersion of the sol and cryocrystallization of droplets of a dispersed medium;
(2) sublimation of the solvent from the cryogranulate obtained in the previous step;
(3) desublimation of the solvent.
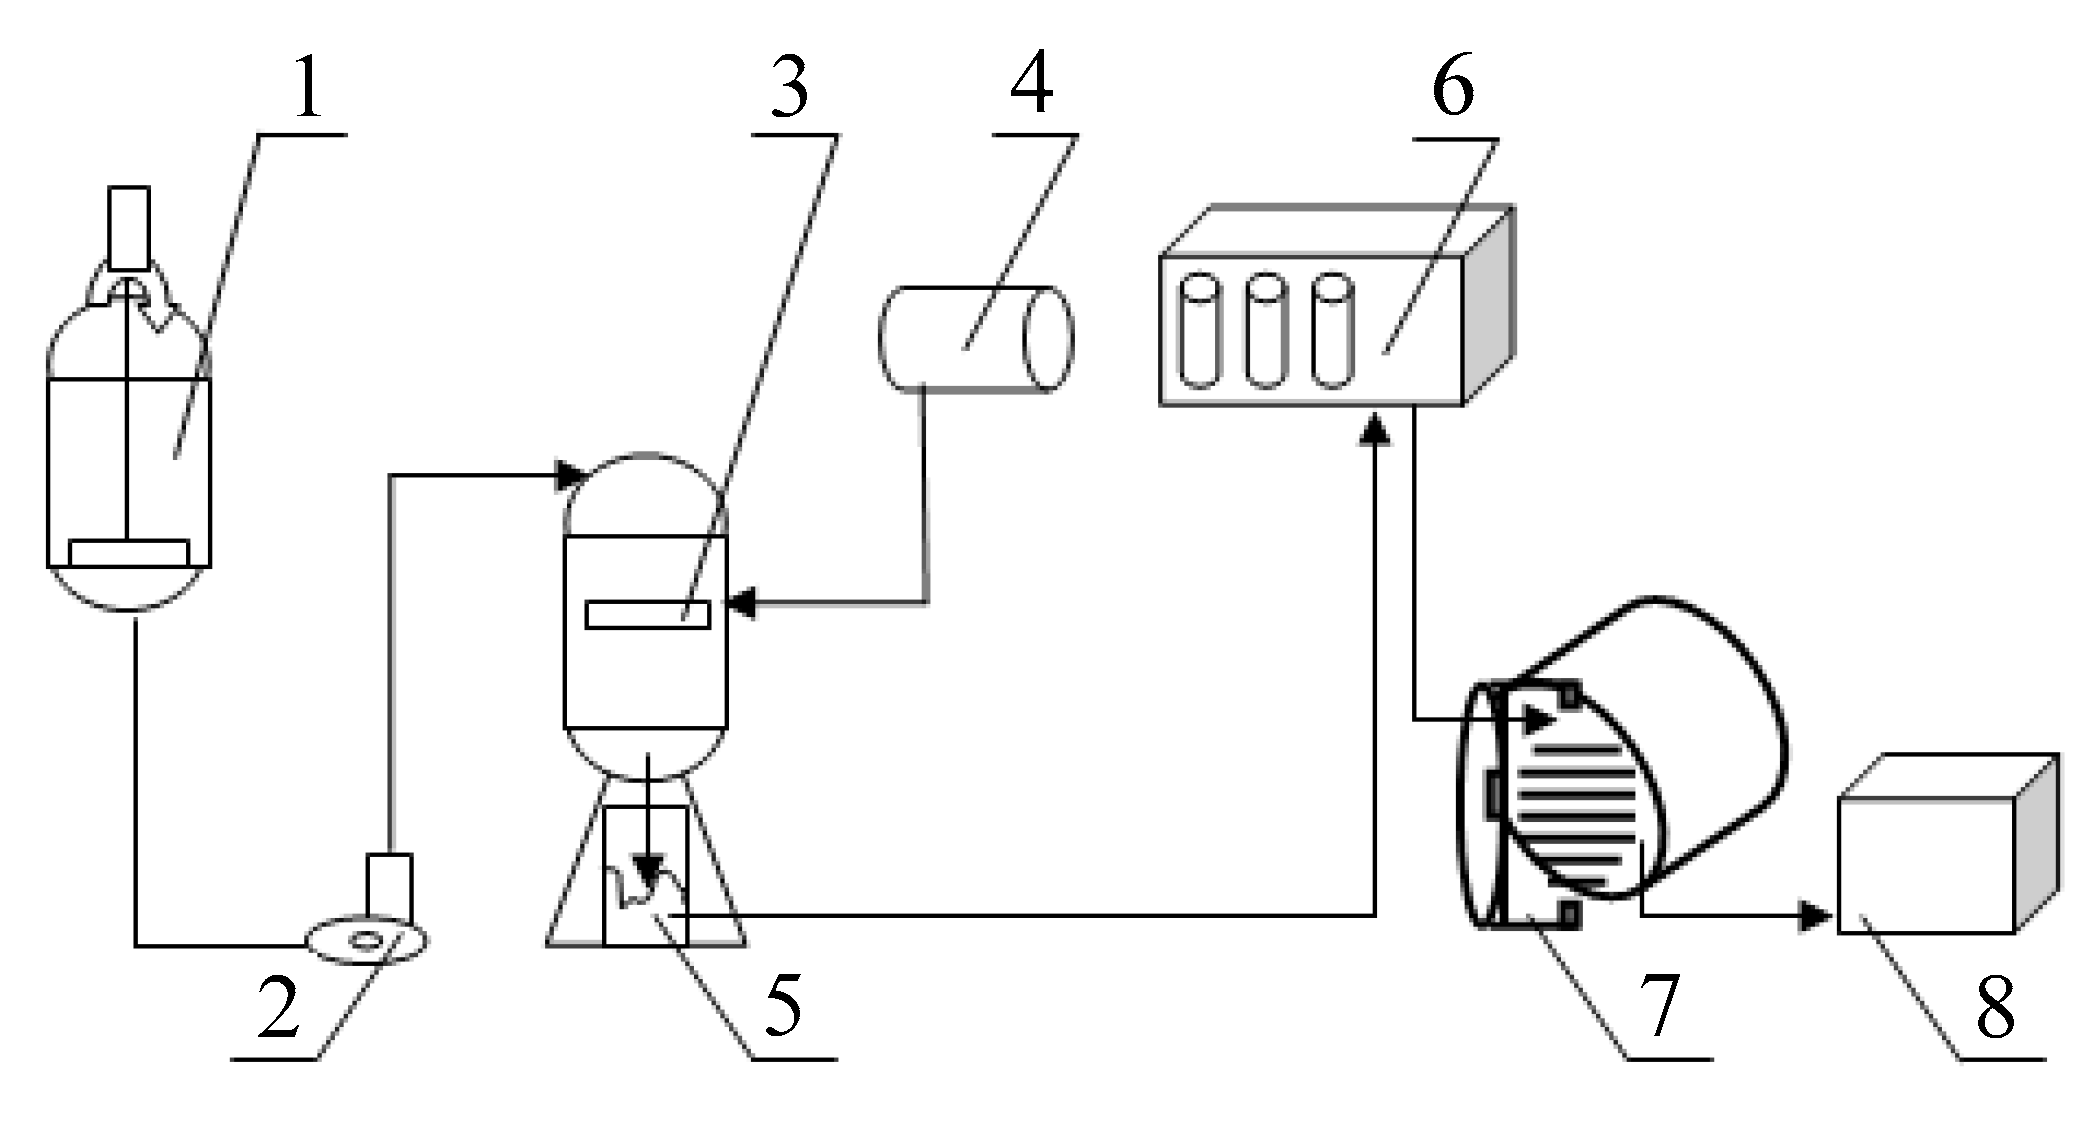
The cryochemical setup is shown in Figure 2 and Figure 3.
Before sublimation in a vacuum chamber, silica sols were dispersed using a nozzle, the droplets were solidified in liquid nitrogen at a temperature of 77 K, and cryogranules were obtained. After dispersion, the droplet size was 20 to 100 μm, the corresponding average droplet cooling rate was about 125 K/s, and the crystallization rate was 0.26 mm/s. The small size of the sol droplets and the high heat transfer surface made it possible to achieve rapid hardening of the droplets and the absence of particle adhesion. The particle sizes in the powders did not exceed the particle sizes in the sols. Vacuum sublimation took place at pressures from 0.02 to 0.05 mm Hg without fragments of droplet moisture and particles sticking together (Figure 4). To accelerate sublimation, heating was used. The temperature range of the heating surfaces in different parts of the vacuum chamber as it was heated during sublimation ranged from −80 to +25 °C (Figure 5). Productivity of the unit with a power consumption from 3 to 5 kW is 0.15–0.20 L/h. The residual water content in nanopowders was adjusted to 0.2 wt.%

2.2. Research Methods

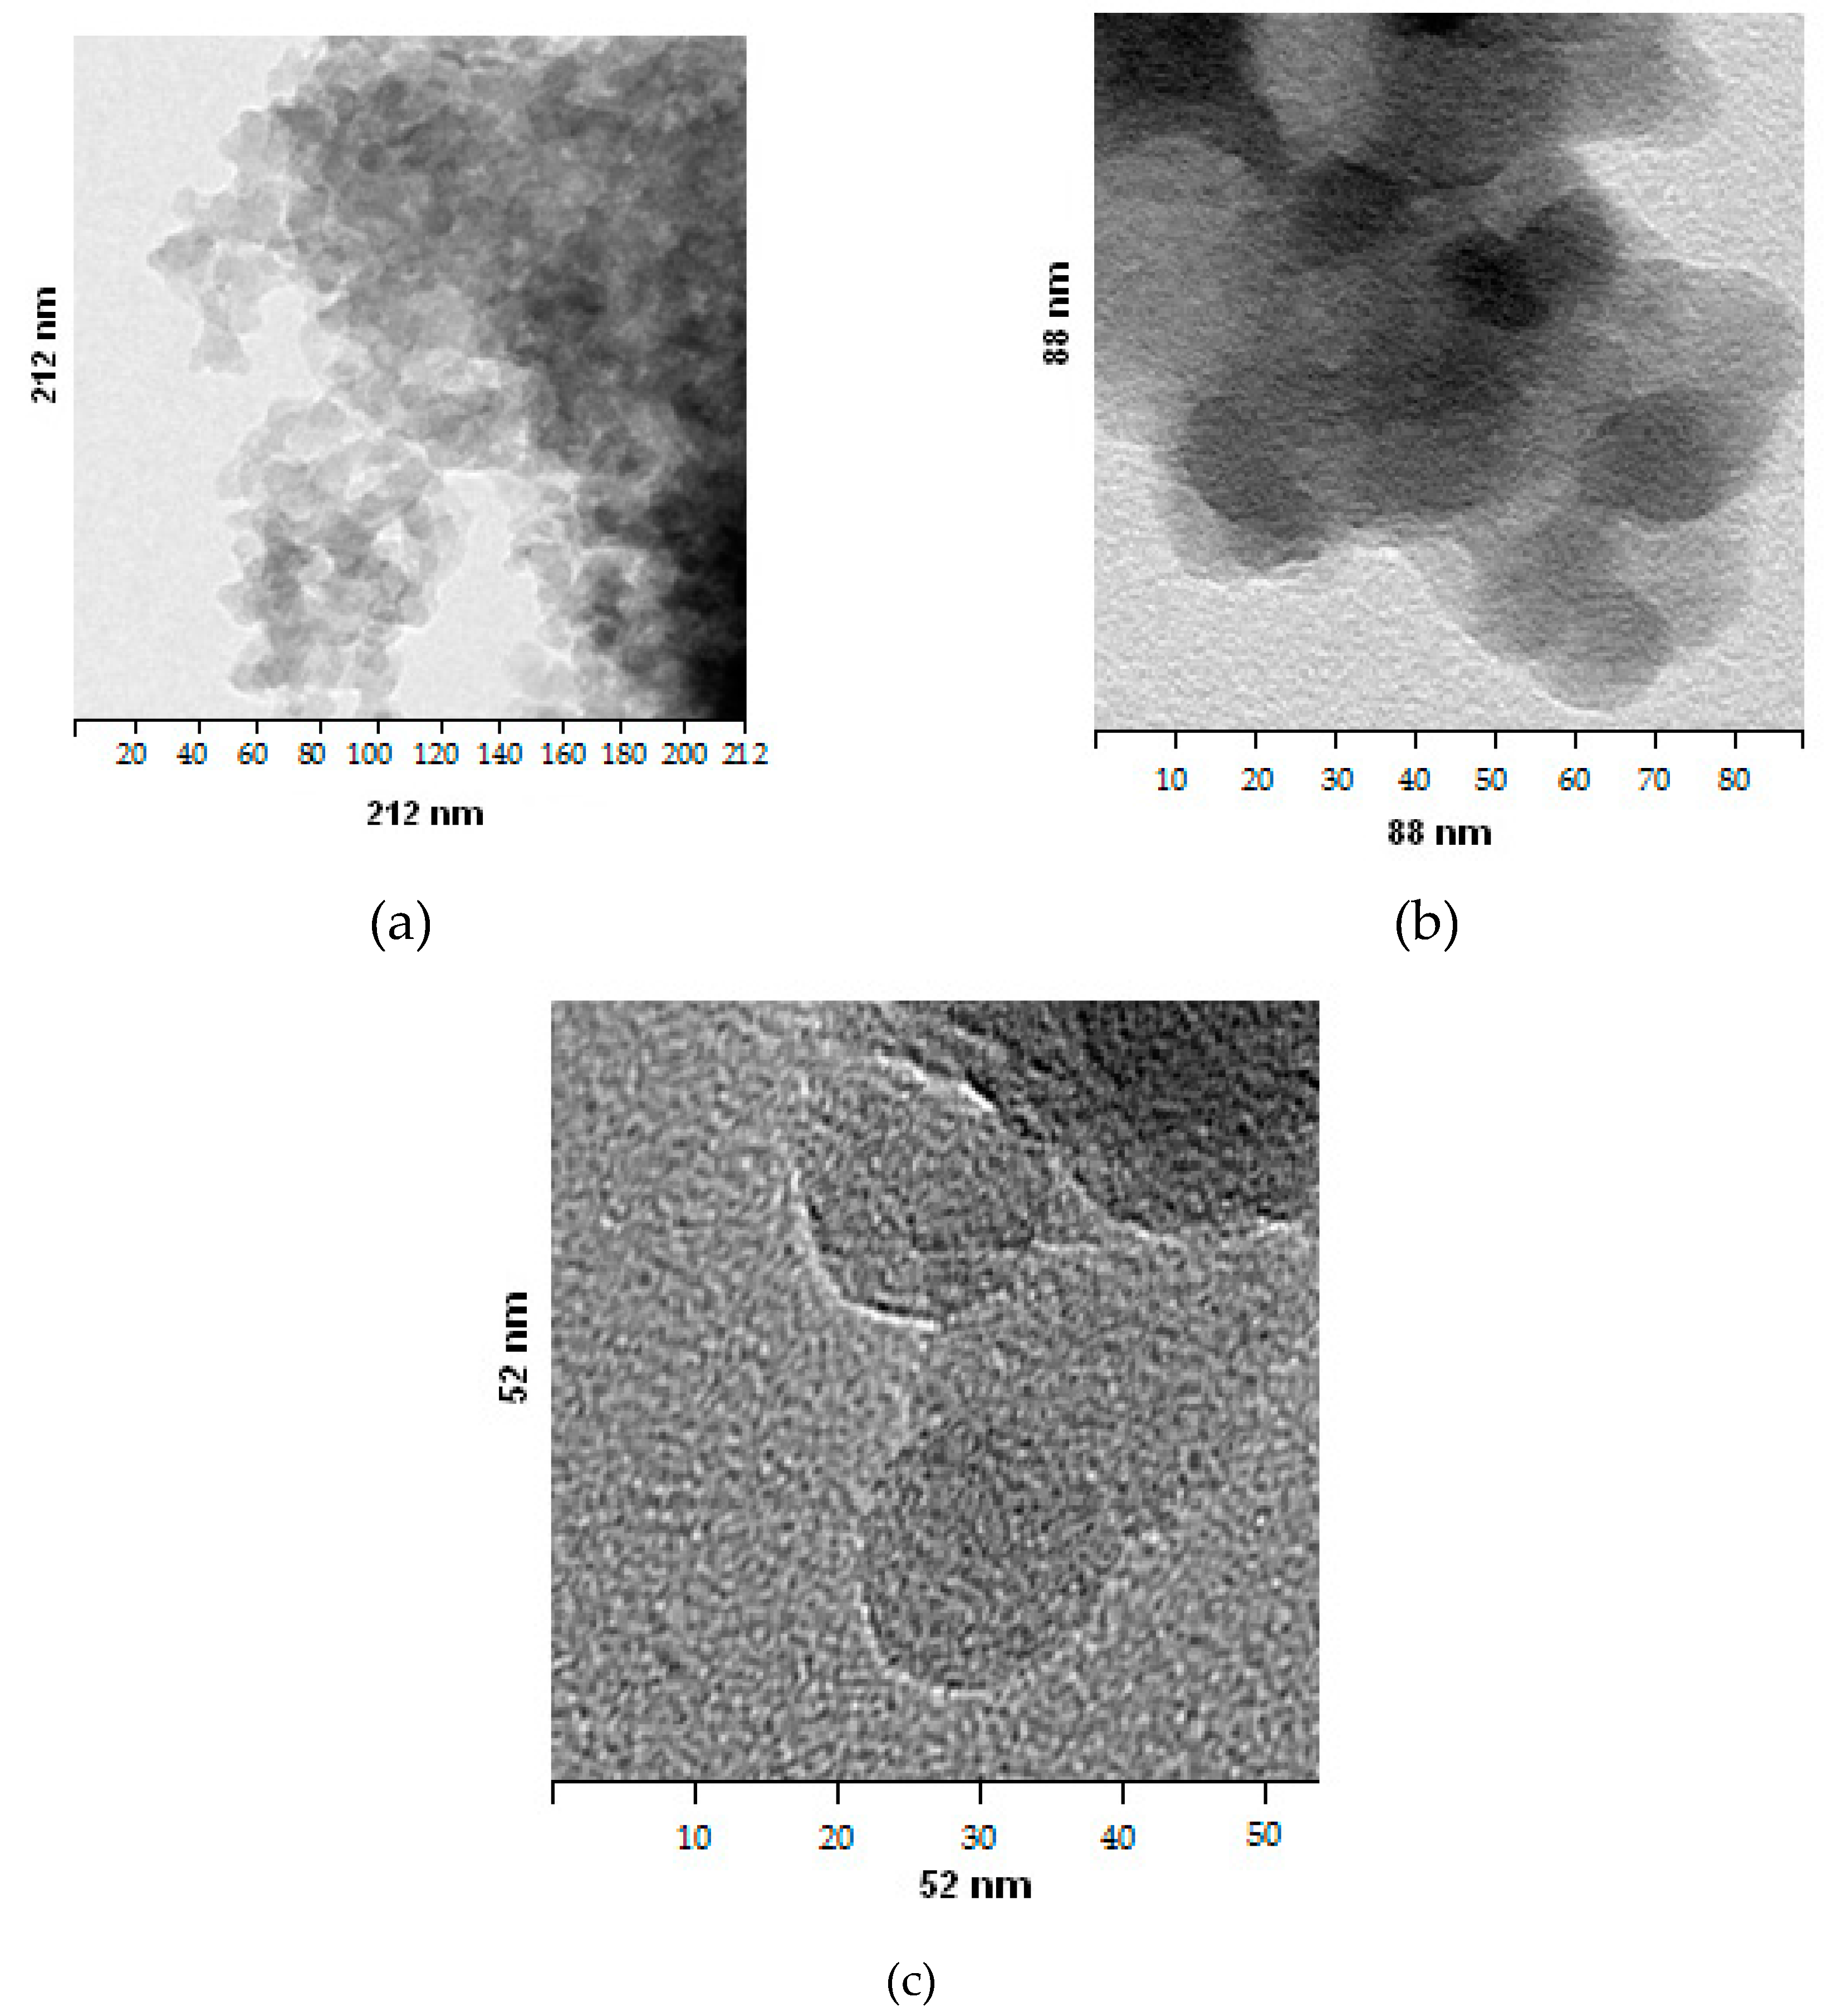
The spherical shape of nanopowder particles was confirmed by TEM images obtained with a transmission electron microscope JEM-100CX, JEOL, Hiroshima, Tokyo, Japan.
Pour density of uncompacted nanopowders were measured using a PT-SV100 Scott volumeter (Pharma Test Apparatebau AG, Germany) with a system of alternating inclined shelves for “transfusion” of samples in the volume for weighing along a S-shaped path, which ensured the uniform distribution of nanopowders.
By the method of low-temperature nitrogen adsorption (ASAP-2010, Micromeritics Instrument Corporation, Norcross, GA, USA), adsorption-desorption curves were obtained. According to the adsorption-desorption curves for samples of nanopowders calculated the:
- BET area;
- specific surface areas, specific volumes, average diameters at one point and along the curves of adsorption and desorption of the area (BJH method);
- differential and integral distribution of area and volume over pore diameters;
- specific areas and volumes of micropores were found (with a diameter of less than 2 nm).
The amorphous structure of nanopowders was established by X-ray diffraction analysis (ARL X’TRA, Thermo Scientific, Basel, Switzerland).
Using small-angle X-ray scattering (SAXS), the dependences of the scattered radiation intensity function on the wave scattering vector were established (RigakuUltima IV, Rigaku Americas Corporation, Woodlands, TX, USA, rotating Cu anode, X-ray wavelength - 1.54 Å).
To determine the concentration of impurity components in nanopowders, a S4 PIONEER X-ray fluorescence spectrometer (Bruker, GmbH, Bremen, Germany) was used. Thermogravimetric analysis and estimation of mass losses during heating of the nanopowder were performed on a Pyris Diamond TG/DTA derivatograph (PerkinElmer LLC, Norwalk, CT, USA).
For determining compressive strength of the samples of compacted nanopowders servohydravlic machine Shimadzu AGS-X (Shimadzu Corporation, Japan) was used.

3. Results

3.1. SEM Images

According to scanning electron microscopy images with magnification factors equal to 250–7000, the sizes of the structures formed because of vacuum sublimation cryogranules of sols were within 20.0 to 100.0 μm. Figure 6 shows images of powder structures after sublimation of the solvent with a successively increasing coefficient of increase of 247, 500, 800, 1000, 2500, and 7000 times. After removal of the solvent, a porous-mesh structure of powder particles remains, preserving the features of a spherical shape and the size of solid cryogranule. Cavities formed inside the residual structures in their central part after solvent removal, which indicates the hardening mechanism of a sol drop of water removal from solid cryogranules. With light exposure, the residual structures were destroyed, forming flakes with a thickness of 0.1 to 0.2 μm.
Figure 7 shows the images of nanopowder particles obtained by transmission electron microscopy (TEM) (the content of [SiO2] in the sol before sublimation is 100 g/dm3).

3.2. Pour Density of SiO2 Nanopowders

Table 2 and Figure 8 show the dependence of the pour density of powders ρp on the content of [SiO2] in sols. When the content of [SiO2] in sols was from 2.4 to 90 g/dm3, the density ρp after sublimation of water molecules from cryogranules and replacing them with air molecules was higher than the content of SiO2 in sols. Accordingly, after the sublimation of water molecules, the volume concentration of SiO2 nanoparticles in the nanopowder increased compared to the sol, and the average distance between the particles decreased. Therefore, at [SiO2] = 2.4 g/dm3, ρp was 20.5 g/dm3. When the content of [SiO2] in sols was higher than 90 g/dm3 after sublimation of water molecules, the concentration of SiO2 nanoparticles in the volume with air molecules decreased, and ρp became lower than [SiO2]: at [SiO2] = 520 g/dm3, ρp = 274 g/dm3. Accordingly, after sublimation of water molecules, the volume concentration of SiO2 nanoparticles decreased, and the average distance between particles increased. The ρp/[SiO2] ratio decreased with increasing [SiO2] content in sols from 8.5 to 0.53, while in the range of [SiO2] = 100–520 g/dm3 it was changing relatively little: from 0.75 to 0.53. In the range of [SiO2] contents in sols from 100 to 520 g/dm3, the ρp ([SiO2]) dependence was close to linear.

3.3. Pore Characteristics of Nanopowders Obtained by Cryochemical Vacuum Sublimation of SiO2 Sols

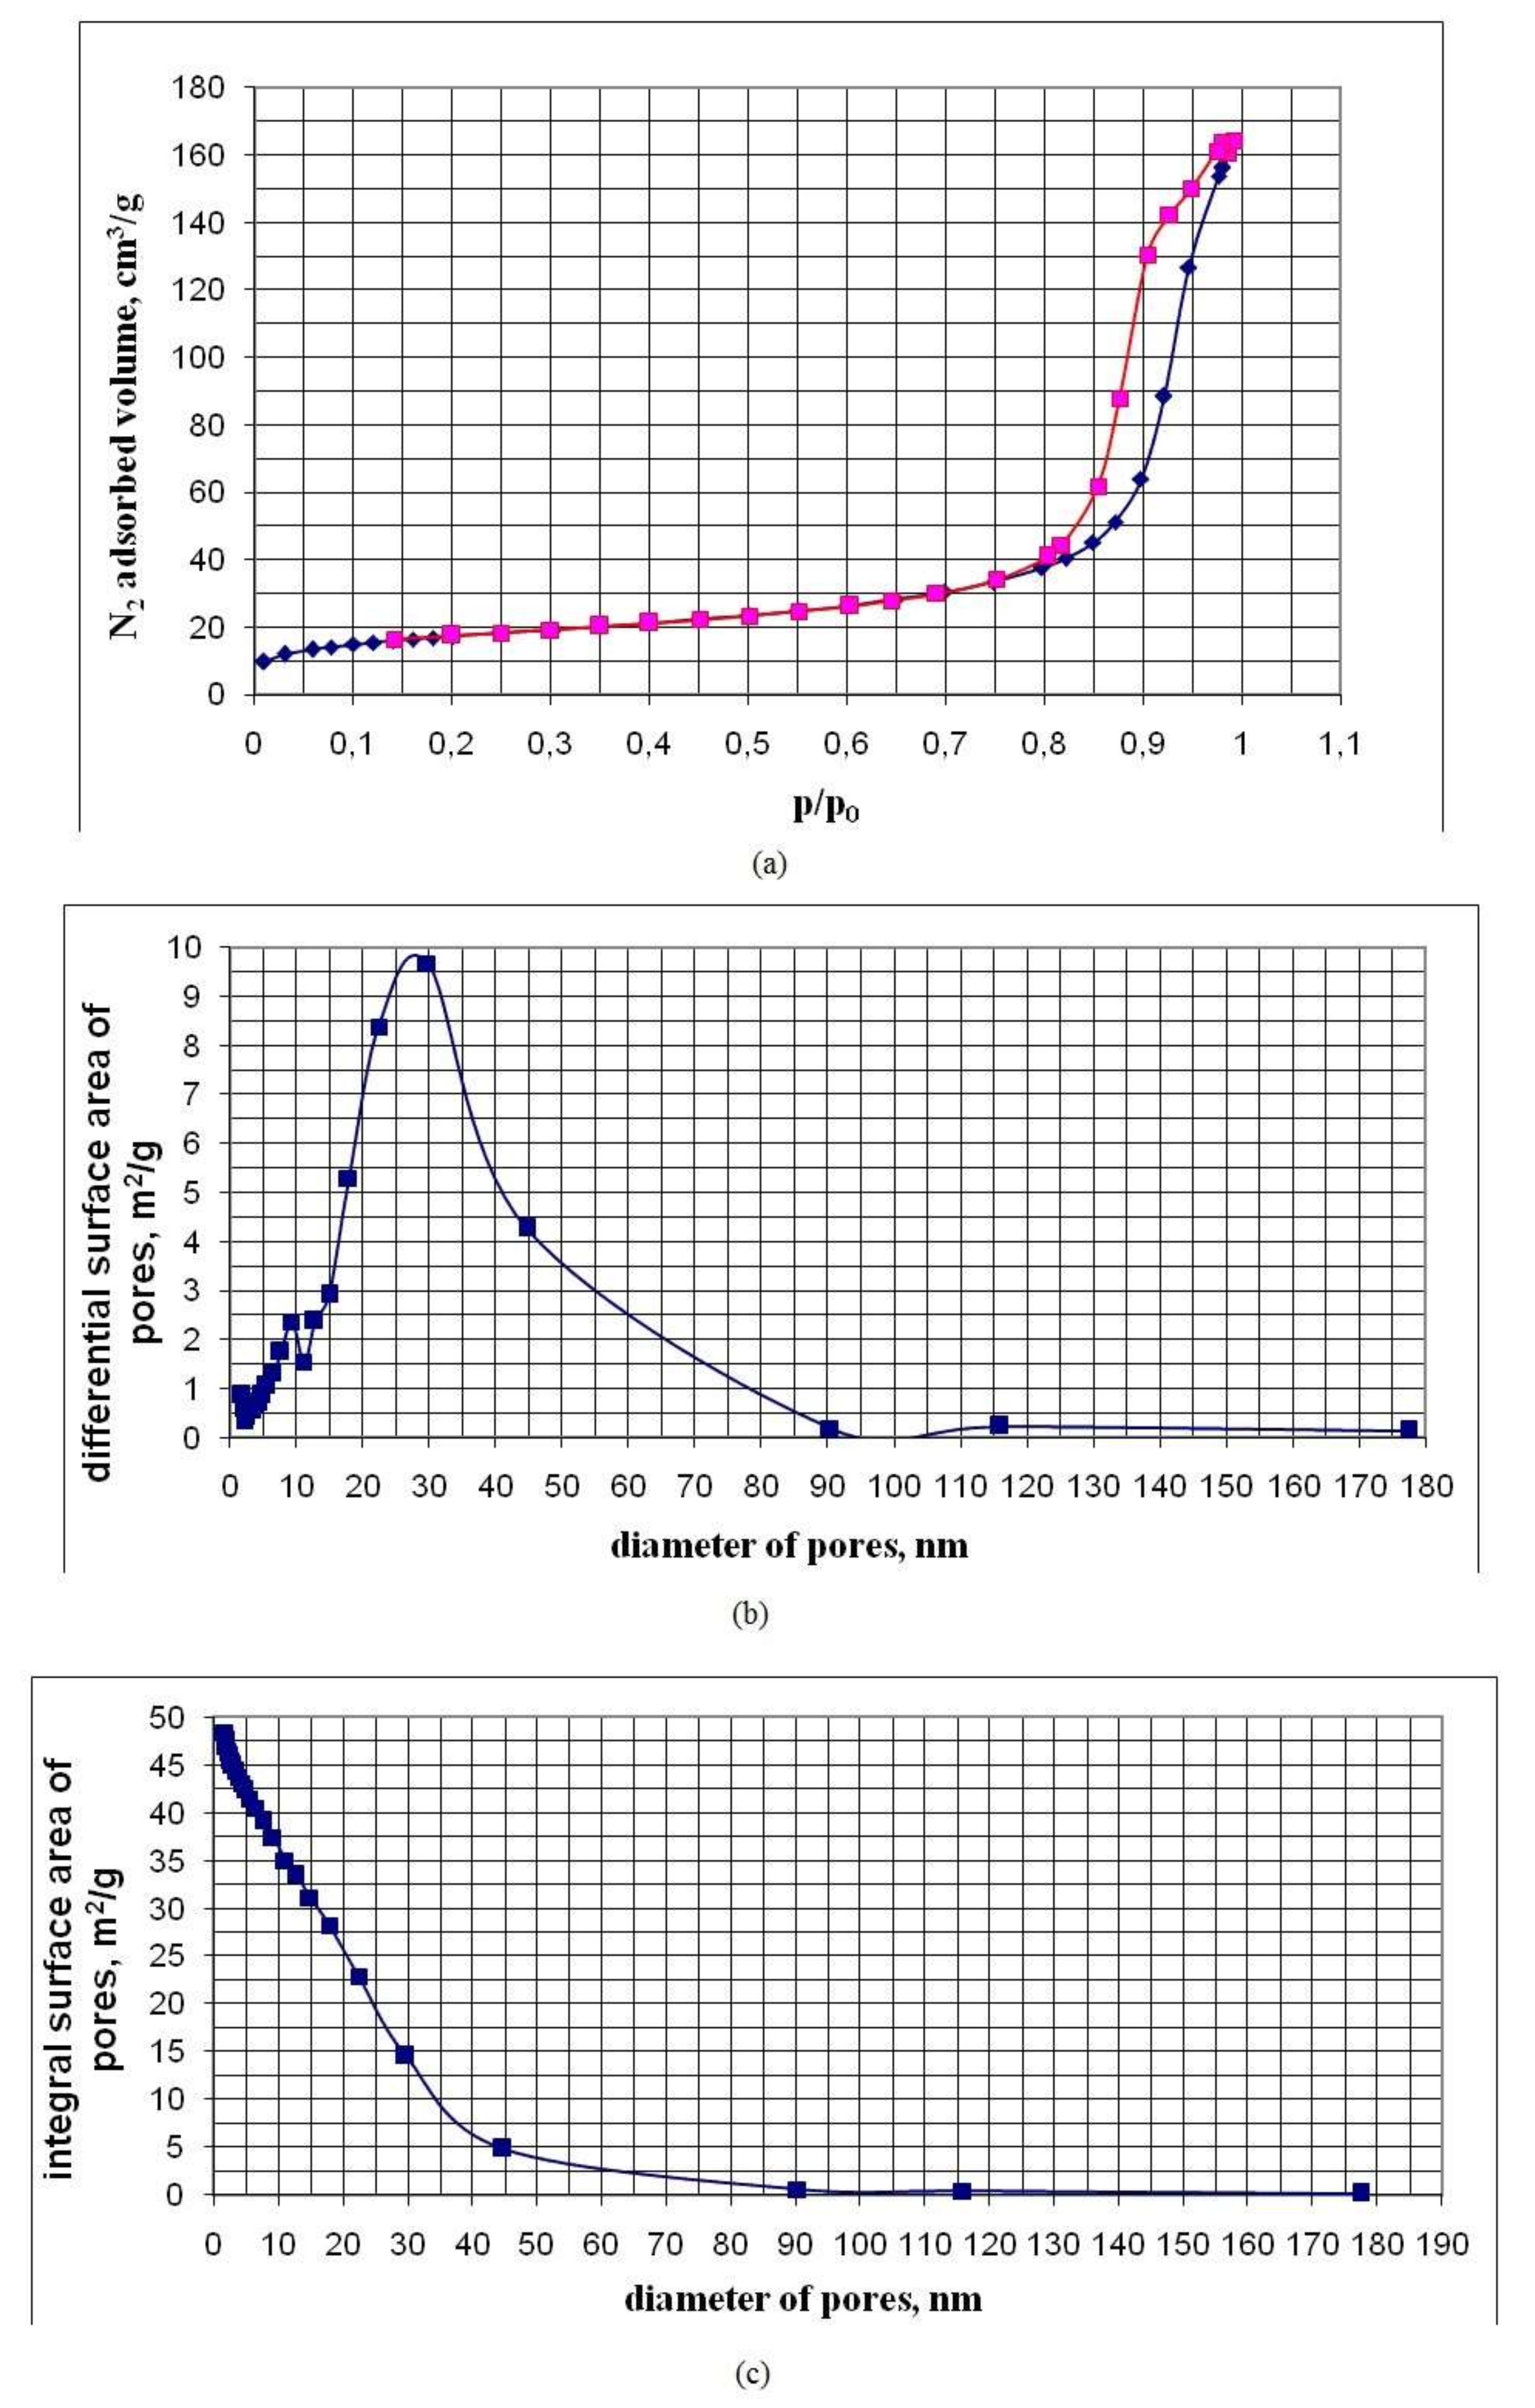
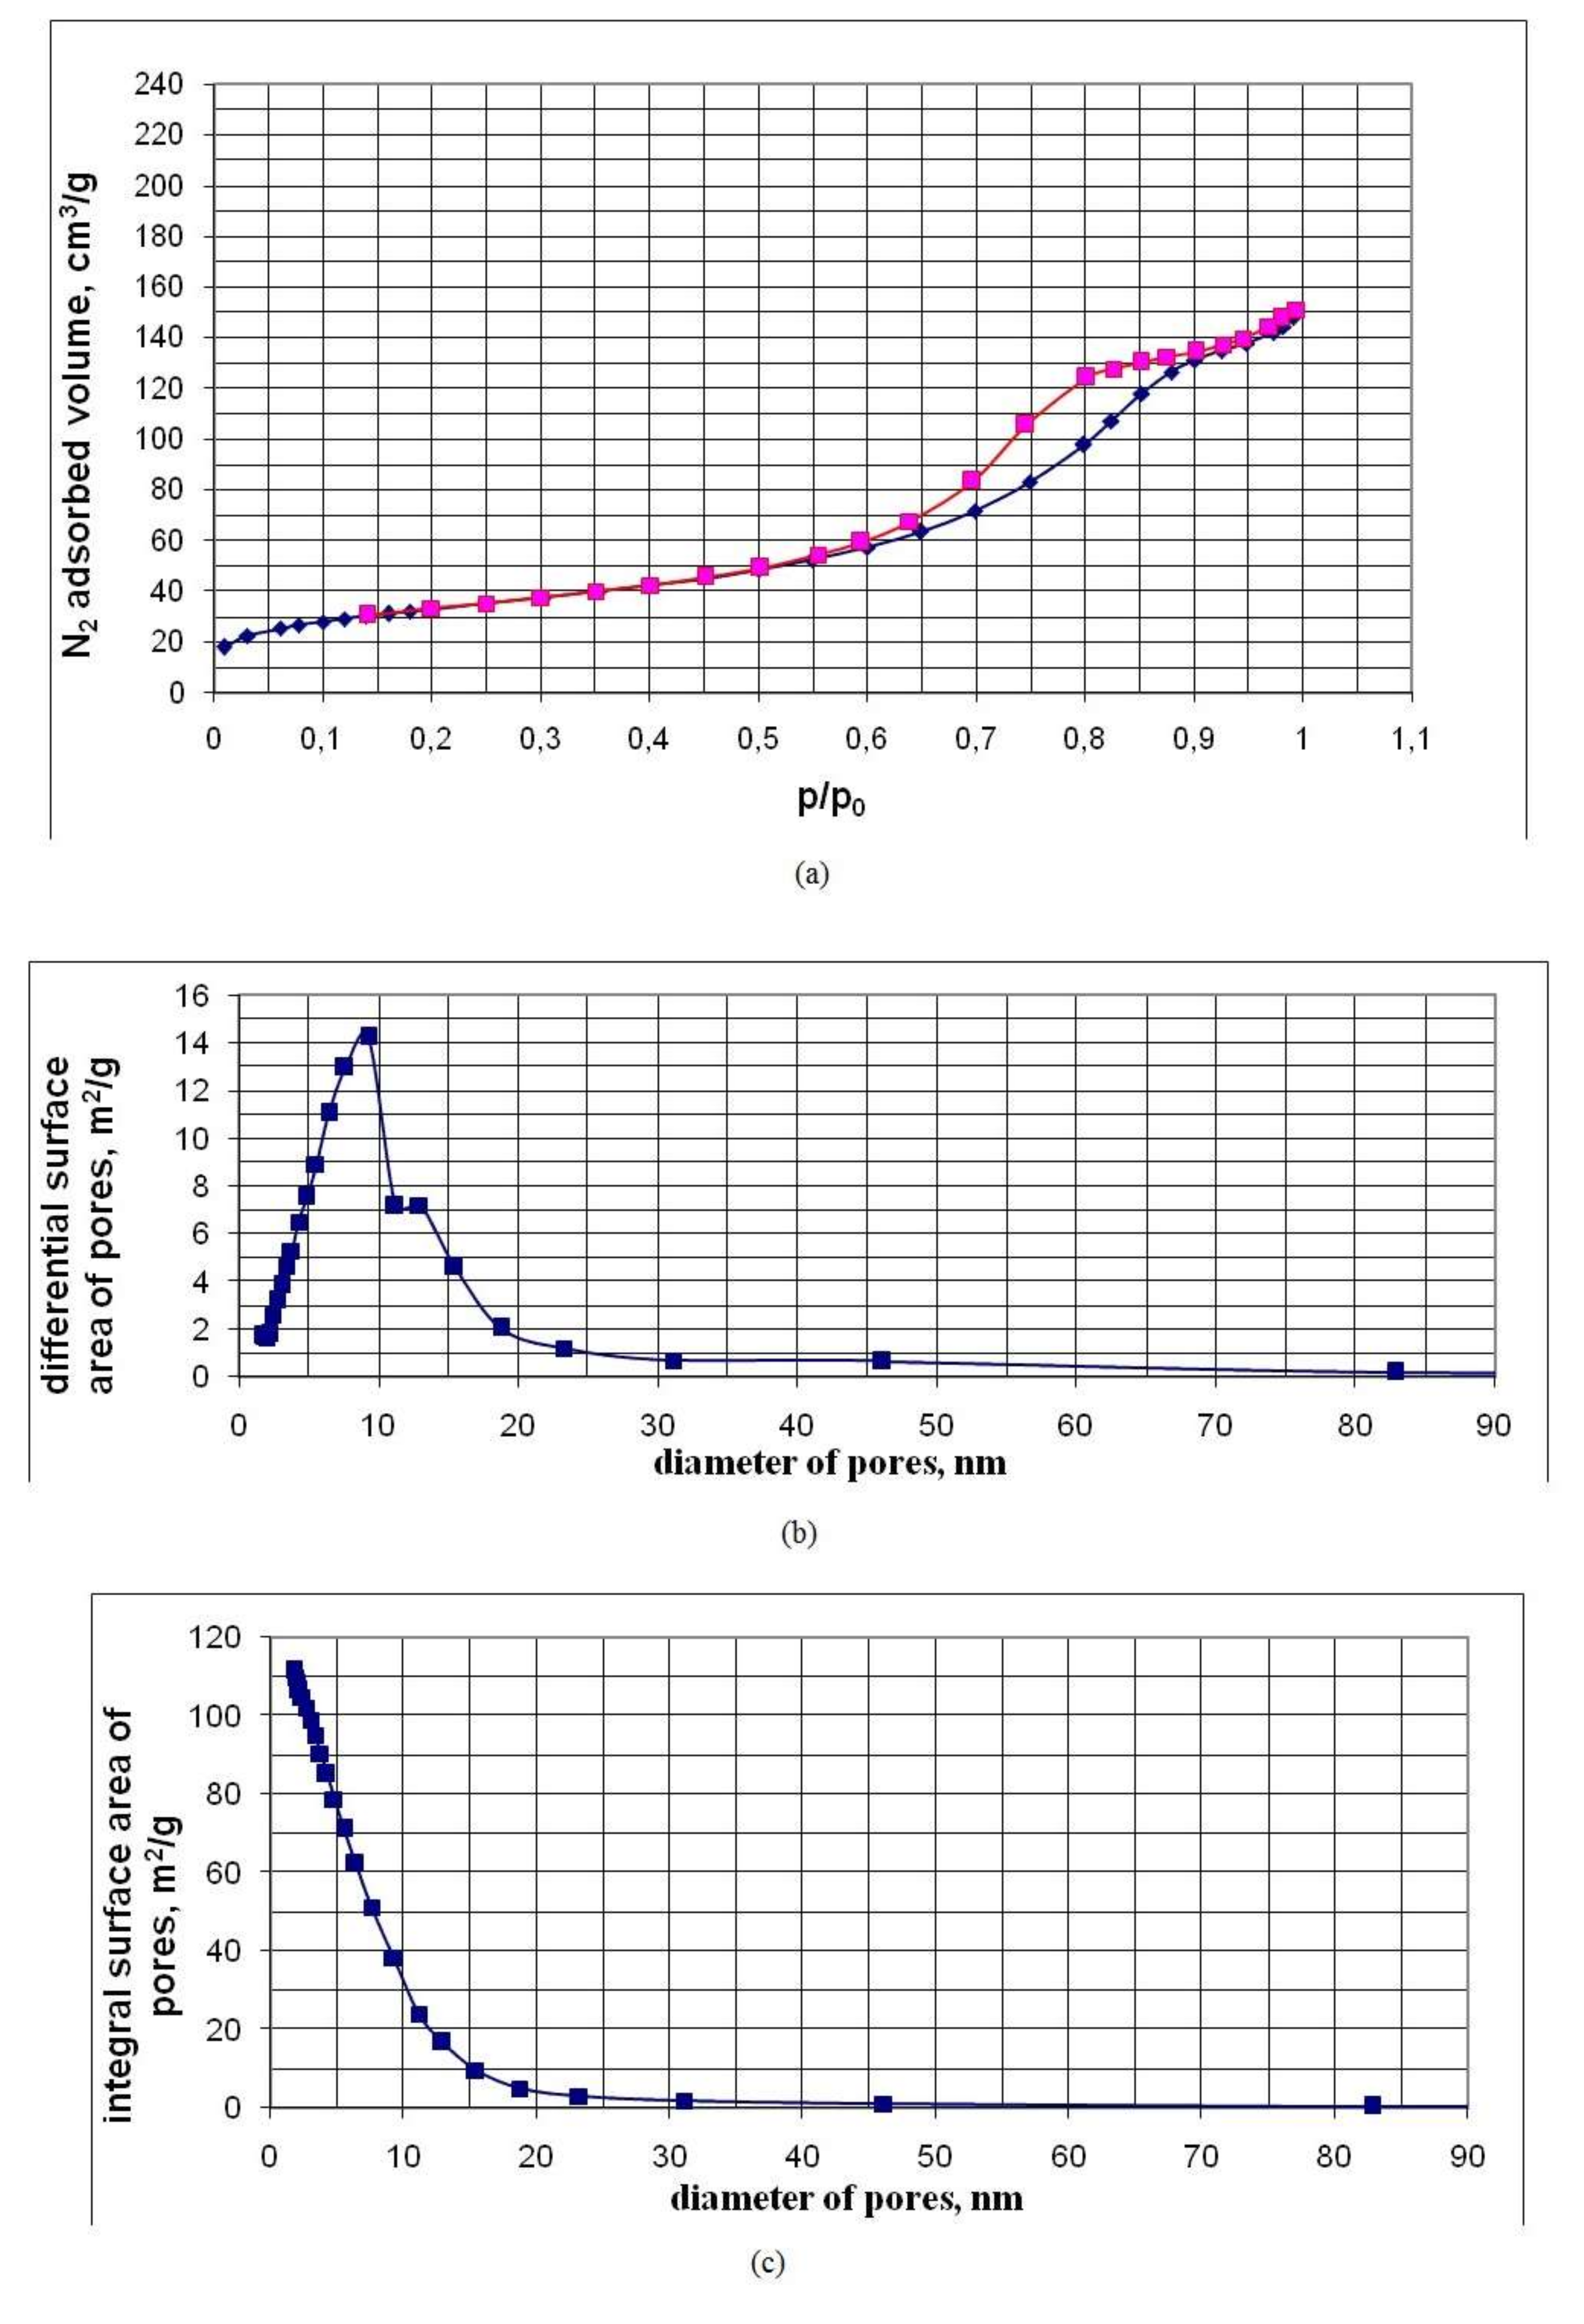
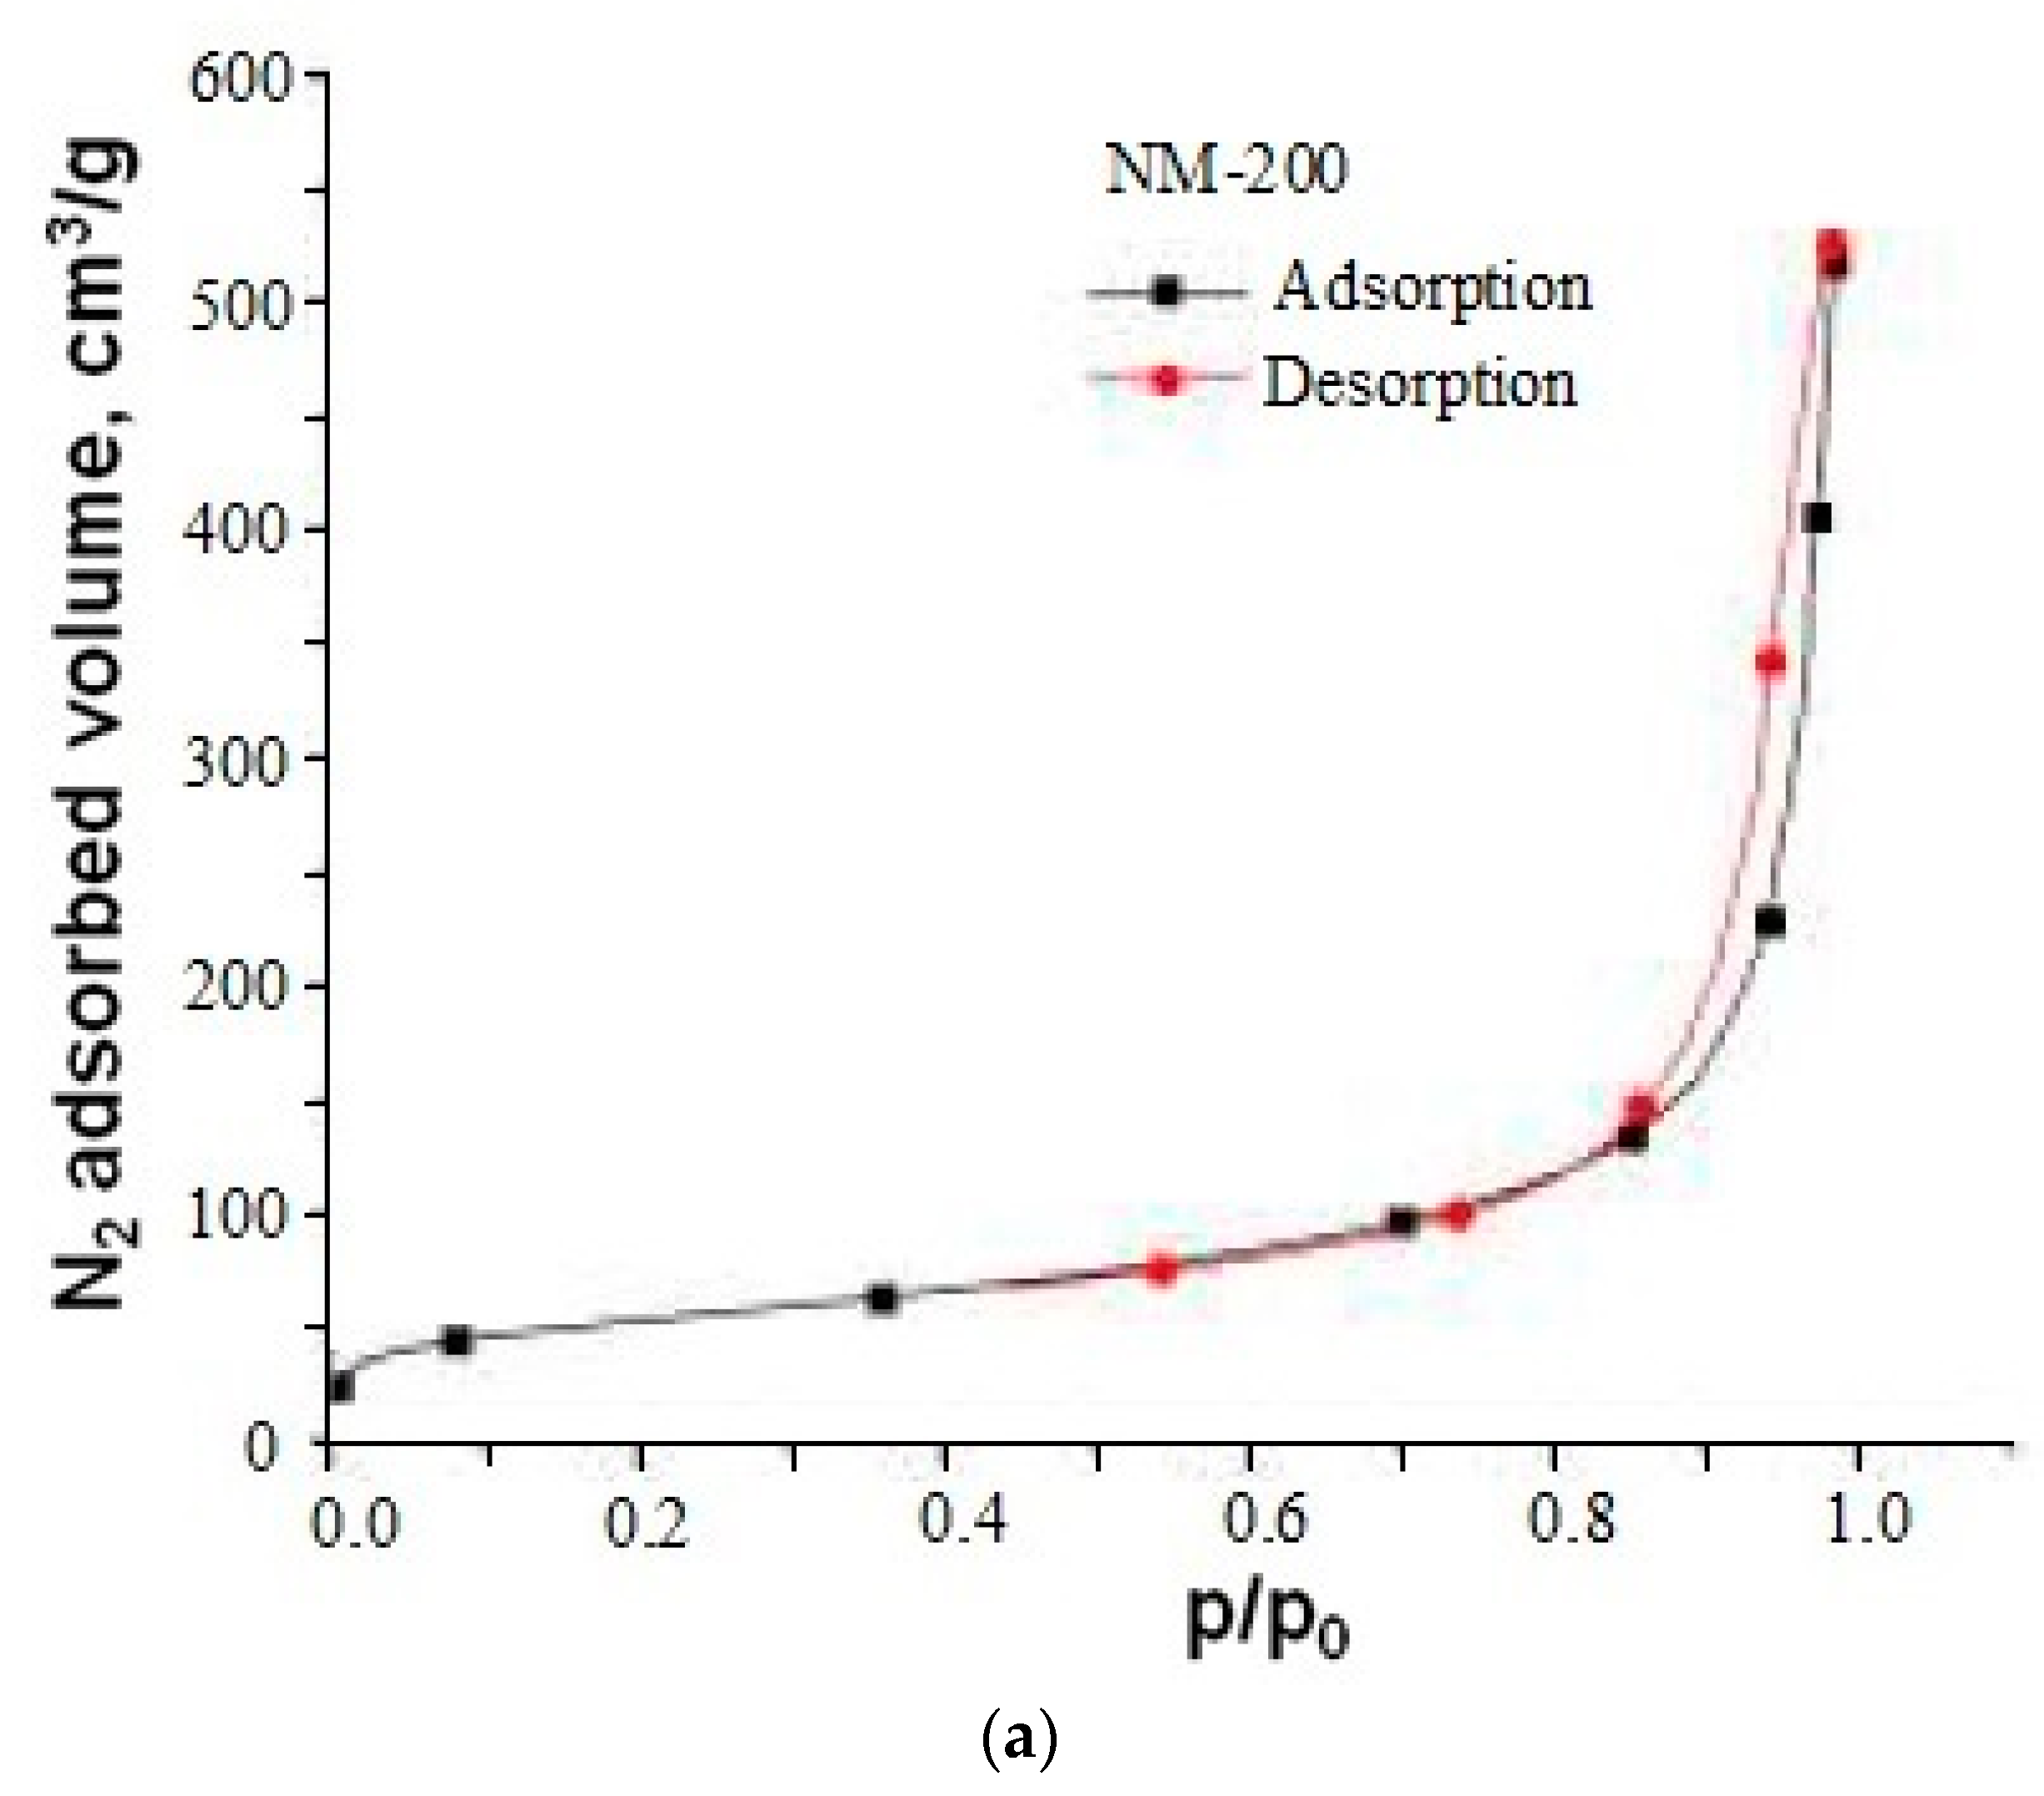
Table 3 shows the characteristics of the pores of powder samples established by low-temperature nitrogen adsorption. The characteristics of the samples are given in order of increasing values of their BET area SBET. Figure 9, Figure 10 and Figure 11, for five of the samples in Table 3, in an ascending order of SBET, show graphs of nitrogen adsorption-desorption isotherms, differential and integral distributions of pore area and volume over diameters.
Nitrogen sorption-desorption isotherms are of type IV and have a hysteresis loop characteristic of mesopores with diameters from 2 to 50 nm and allow one to estimate the pore size distribution. Hysteresis on the isotherm graph allows us to conclude that nanopowders are a globular system consisting of spherical particles, each of which is in contact with two or more neighboring particles. By lowering the temperature of the hydrothermal solution at the OSA polycondensation stage from 90 to 20 °C, a decrease in the sizes of SiO2 particles was achieved. Additionally, there was an increase in their specific surface area and a decrease in the average pore diameter;
dp = 4 × Vp/SBET
With a temperature decrease at the OSA polycondensation to 20 °C, the BET–nanopowder area was regulated and increased to 500 m2/g. In this case, the specific pore volume Vp was in a narrow range of 0.20 to 0.30 cm3/g and the average pore size decreased to 2.7 nm (Table 3). The specific pore volume Vp depended weakly on the density of nanopowders.
The specific pore volume Vp = 0.20–0.30 cm3/g showed that spherical SiO2 particles form aggregates with a high-volume fraction. The volume fraction of SiO2 particles with a density of 2.2 g/cm3 in aggregates at Vp = 0.20–0.30 cm3/g was Vs/Vaggr = 0.7–0.6 (Vs is the volume of SiO2 particles occupied in the aggregate, Vaggr is the aggregate volume), the density of the substance in aggregates was 1.32 to 1.54 g/cm3. The density of the substance in the aggregates was much higher than the density of nanopowders ρp = 0.02–0.274 g/cm3.
The ratio of the average pore diameter dp to the average surface particle diameter dBET for most of the nanopowder samples ranged from 0.3 to 0.43, to 0.5 (Table 3), which also testified to the high-volume density of the packing of SiO2 particles in the aggregates. The differential distributions of the pore area and volume over the diameters are rather narrow and are characterized by a relatively small width. The fraction of micropore area in the studied nanopowders is no more than 10% to 15%, and the proportion of micropore volume is not more than 1% to 3% (Table 3).
The samples NM-200, 201, 204 of SiO2 nanopowders were produced by precipitation from precursor Na2SiO3 and the samples of pyrogenic SiO2 nanopowders were produced by the flame hydrolysis of SiCl4 [1]. Nitrogen sorption-desorption isotherms of precipitated samples NM-200, NM-201 and of pyrogenic SiO2 nanopowder NM-202 were another type then of hydrothermal nanosilica powdes (Figure 9, Figure 10, Figure 11 and Figure 12). Pore characteristics of pyrogenic and precipitated SiO2 nanopowders established by BET-method are in Table 4. The form of the hysteresis loop of NM-200, 201, and 202 samples differs from the form of loop of hydrothermal samples, and the structure of SiO2 particles aggregates and agglomerates differs in precipitated and pyrogenic samples from the hydrothermal samples.
The specific pore volume Vp = 0.499–0.513 cm3/g of pyrogenic SiO2 nanopowder NM-202, 203 showed that the volume fraction Vs/Vaggr of SiO2 particles in aggregates was about 0.5. In the samples of precipitated nanopowders NM-200, 201, 204 with Vp = 0.79, 0.581, 0.50 volume fraction was Vs/Vaggr = 0.364, 0.438, 0.475. The volume fraction Vs/Vagg in the samples NM-(200-204) was lower than in the UF samples of hydrothermal nanopowders and indicated another structure of aggregates. The fraction of the area of the micropore and volume were the same as in UF samples.

3.4. The XRD Data and Small Angle X-ray Scattering

Samples of nanopowders had an amorphous structure without the presence of crystalline phases (Figure 13a). After calcination at 1200 °C for 2 h, cristobalite peaks appeared in the diffractogram of the samples (Figure 13b). In the X-Ray data of all samples NM-200, 201, 204 precipitated from Na2SiO3 precursor the presence of Na3SO4 crystalline impurities at 2Ө = 32, 34 degrees and crystalline impurities of Boehmite (γ-AlO(OH)) were observed [1]. In the pyrogenic samples NM-202 and 203, the presence of Boehmite was detected by XRD [1].
Samples of SiO2 nanopowders isolated from sols were studied by small angle X-ray scattering (SAXS) (Figure 14). The dependences of the intensity of the scattered electromagnetic radiation ISR (q) on the wave vector q = 4π × sin (Ө)/λ (Ө is half the scattering angle and λ is the X-ray wavelength) were obtained for five different samples of SiO2 nanopowders in logarithmic coordinates. Sample 1: nanopowder obtained by cryochemical vacuum sublimation of the sol with a SiO2 content of 100 g/dm3 (precursor: hydrothermal solution). Samples 2 and 3: for nanopowders obtained by sol-gel and cryochemical vacuum sublimation of gels, the precursor is an aqueous solution of sodium silicate, the SiO2 content in the sol is 100 g/dm3. Sample 4: for nanopowder obtained by sol-gel transition and cryochemical vacuum sublimation of the gel, the precursor is an hydrothermal solution, SiO2 content in the sol 100 g/dm3. Sample 5: for nanopowder obtained by sol-gel transition and gel drying, the precursor is tetraethoxysilane.
According to Figure 14, only for sample 1 graph logISR(q) - log (q) in the range q = 0.21 to 0 nm−1 was close to linear, which indicates the mode of scattering by fractal agglomerates [51,52,53,54,55,56,57]:
ISR ~ q-Df,
where Df is the fractal dimension. According to the slope of the dependence logISR(q)–log(q), the dimension Df for the nanopowder of sample 1 was 2.21. In the range q = 1.0 to 3.0 nm−1 for sample 1, the modulus of the slope of the logISR(q)–log(q) dependence was 4.05, in the region q = 0.08 to 0.2 nm−1, it was 3.97, which corresponds to Porod’s scattering regime. For sample 1, approximation of the dependence logISR(q) by the Guinier’s function is ISR(q) = exp (-Rg2×q2/3). Here, Rg is the gyration radius, for the ranges q = 1.0 to 3.0 nm−1 and q = 0.08 -to 0.2 nm−1, respectively, where the primary particle size is 2Rg1 = 4.92 nm and the gyration radius of agglomerates is 2Rg2 = 24.4 nm. The relation between gyration radius Rg2 and outer diameter of agglomerates outer diameter Dagglom is Dagglom = ((Df +2)/Df)0.5×2Rg2 = 33.7 nm. The number Nagglom of primary SiO2 nanoparticles with a diameter of 2Rg1, which are in the fractal agglomerate of size Dagglom, can estimated as [54,55]:
Nagglom = (Dagglom/2×Rg1)Df = 69.3 ~ 69-70.
The average volume fraction of SiO2 primary particles in agglomerate is (Dagglom/2 × Rg1)Df −3 = 0.218.
For sample 4, the scattering mode on ISR ~ q-Df fractals was realized in the range q = 0.2 to 0.5 nm−1. The fractal dimension, determined by the slope of the dependence logISR(q)– log(q), is Df = 2.33.
Nanopowders obtained by cryochemical vacuum sublimation of sols based on a hydrothermal solution were characterized by a fractal dimension in the range Df = 2.04 to 2.21. Sodium silicate and tetraethoxysilane nanopowders were characterized by Df = 2.2 to 2.3.
Sample NM-202 of pyrogenic SiO2 powder obtained by the flame hydrolysis of SiCl4 was characterized by SAXS, TEM, DLS and BET methods in [1]: Df = 2.5, 2×Rg1 = 16 nm, 2×Rg2 = 100 nm, Nagglom = 200. Two samples, NM-200 and NM-201, were produced by precipitation from the precursor solution of Na2SiO3 were characterized by parameters: NM-200—Df = 2.45, 2×Rg1 = 18 nm, 2×Rg2 = 440 nm, Nagglom = 3500; M-201—Df = 2.45, 2×Rg1 = 20 nm, 2×Rg2 = 80 nm, Nagglom = 457. Fractal dimension of the hydrothermal nanopowders samples was lower than of the precipitated and pyrogenic samples [1,52,54,57,58]. Physicochemical and biophysicochemical interactions of nanoparticles with cells are in strong dependence from fractal dimension Df and parameters of the structure of agglomerates 2×Rg1, Dagglom, Nagglom, as from particles shape, surface electric charge and morphology [59,60,61,62,63,64].

3.5. The Limits of the Content of Impurity Components in Nanopowders

Table 5 shows the concentrations of impurity components in the silica nanopowder obtained by cryochemical vacuum sublimation of the sol at a SiO2 content of 500 g/dm3 in the sol. The total content of impurities with respect to SiO2 does not exceed 0.3 wt.%.

3.6. Evaluation of the Density of Surface Silanol Groups of Si-OH

Table 6 shows the dependence of the mass of the nanopowder sample (wt.%) on temperature, according to thermogravimetric analysis.
Taking into account the specific surface area of silica SBET (m2/g) and the mass loss ΔmH2O (wt.%) due to the removal of water and OH-groups during thermogravimetric analysis, one can find the total concentration δOH(OH/nm2) of all silanol groups. These groups are located both on the surface and in the volume of silica conventionally assigned to the specific surface of the nanopowder sample [65]:
δOH = (ΔmH2O 2 × 6.02 × 103)/(18 × SBET).
Having taken SBET = 300 m2/g for the sample, the final temperature at which all silanol groups are completely removed is equal to 1000 °C, and taking into account the data in Table 5, the values of the total δOH (on the surface and inside the volume) were obtained. These values conventionally calculated per unit surface area of the sample for different temperatures (Table 7).
Note. Symbol T, °C—temperature of sample pretreatment in vacuum. δOH is the total water loss obtained by thermogravimetric analysis when the sample was calcined to high temperatures and expressed as the number of OH- groups, referred to the surface unit of SiO2. αOH is the averaged total true concentration of silanols on the SiO2 surface depending on the pretreatment temperature obtained by Zhuravlev according to the method of deutero-exchange [66]. γOH is the content of internal silanols per unit surface area of SiO2, obtained as the difference between the corresponding δOH and αOH values at the same fixed temperature (this value is also formally expressed as the number of OH groups per unit surface area of SiO2 (γOH, OH/nm2)).

3.7. Experiments with Compacted SiO2 Nanopowders

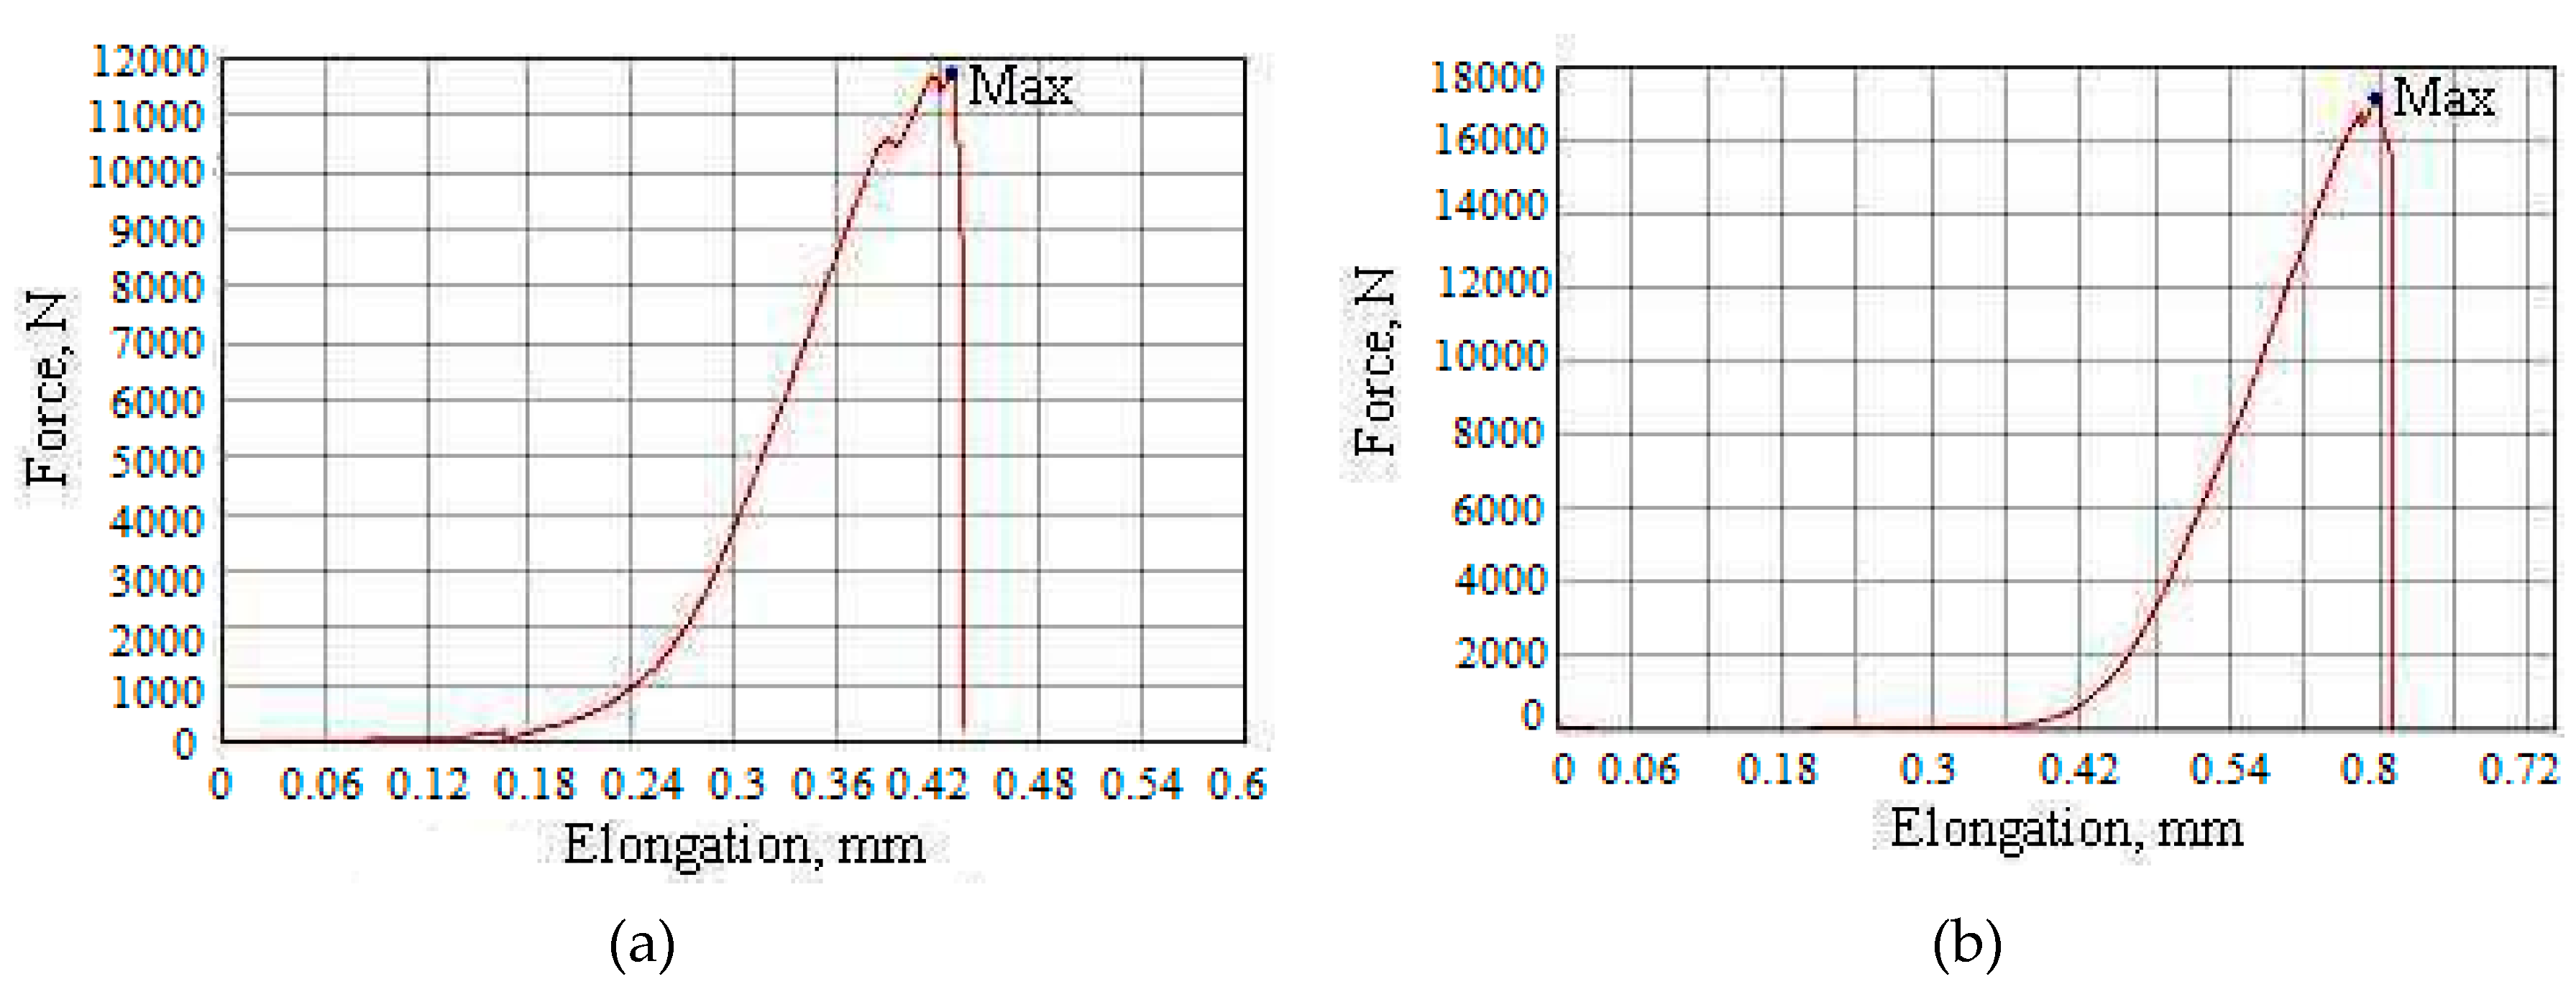
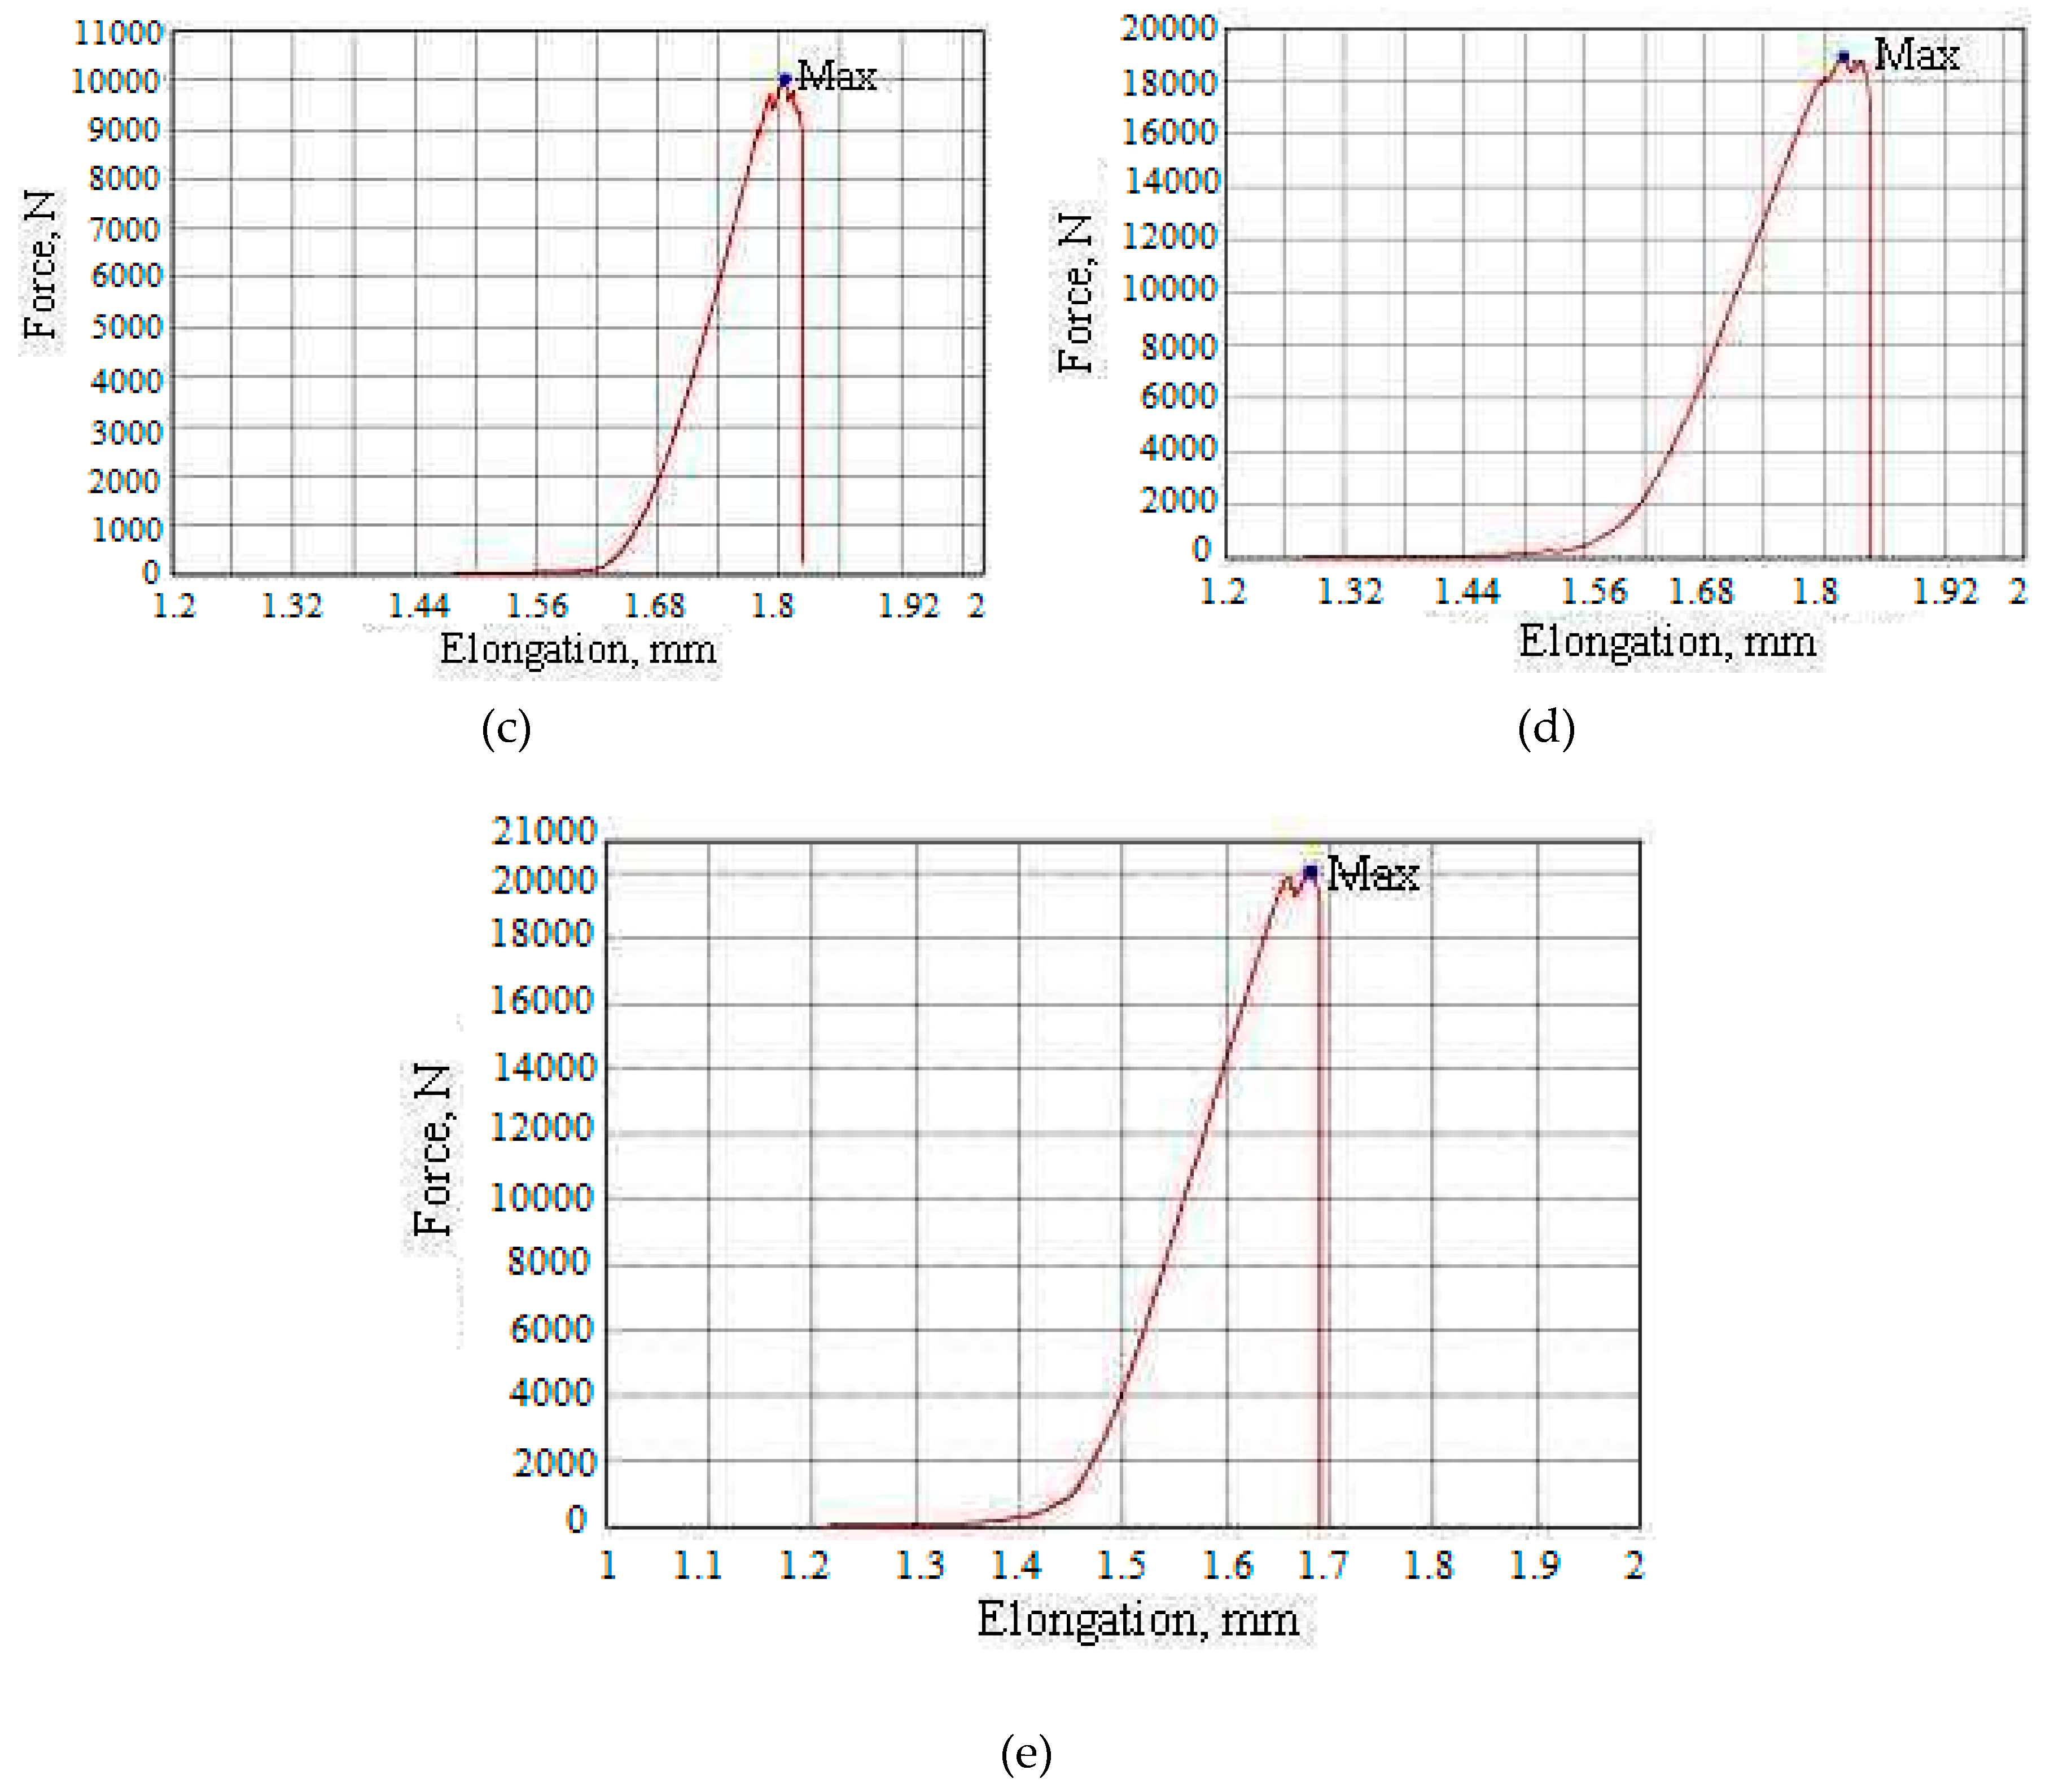
Samples of SiO2 nanopowder were compacted on a hydraulic press at pressures of 1000 to 2000 MPa for 2 to 24 h; then, after hardening, they calcined at temperatures of 700, 800, 1000, and 1100 °C for 2 to 4 h. After compaction and calcination, the mechanical characteristics of solid samples were determined using the Shimadzu complex with registration of the force–strain curves (Figure 15 and Figure 16, Table 8). Table 8 shows the values of compressive strength in the range 135–337 MPa. This indicates a high specific surface and high surface energy of SiO2 nanoparticles.
Sizes of the sample 5 (thickness × width × height), mm: 5.0 × 11.9 × 2.9; sample density 1.7 g/cm3; indentation speed1 mm/min; maximum power 20057.6 N; maximum strain 337.1 N/mm2; amplitude of the stroke, 1.681 mm; maximum elongation, 1.681 mm; maximum deformation 57.88%; maximum time 100.95 s.

4. Prospects for Research and Applications of Hydrothermal Nanopowders SiO2

Further studies of the characteristics and possible applications of hydrothermal SiO2 nanopowders can be continued in the following areas:
- production of silicates of metals [67,68,69];
- receiving glasses;
- obtaining silicon carbide SiC;
- formation of ceramic forms based on SiO2 nanopowders;
- obtaining heat insulators;
- determination of the sorption capacity of nanopowders and obtaining sorbents for water purification and sorbents for gas chromatography;
- studies of the possibility of using nanopowders as catalyst supports.
Using SiO2 nanoparticles, which have a high and chemically active surface, one can purposefully influence [68,69,70,71,72,73,74,75,76,77,78,79]:
- the kinetics of hydration of the basic cement minerals C3S, C2S, C3A, C4AF and increasing the rate of CSH gel formation up to 20% and polymerisation [68,69,77,78];
- reducing the size and shape of the particles of the gel of the hydrates of calcium silicate C-S-H, increasing the density of their volume packaging;
- reducing content of Ca(OH)2 up to 20% to 30% and, thus, increasing content of CSH gel in hardened concrete because of rapid kinetics of pozzolanic reaction of SiO2 nanoparticles with Ca(OH)2 [74,75]; hydrothermal SiO2 nanoparticles with great specific surface area up to 500 m2/g and high chemical activity due the surface density of Si-OH groups up to 4.9 nm−2, which significantly accelerates the kinetics of pozzolanic reaction [68,77,78];
- increase the volume fraction of C-S-H gel phases with greater elasticity and hardness, Ca/Si relation due to modification of nanostructure of hardened concrete, and, as a result, increase the compressive and bending strength of concrete, reduce pore volume, increase water resistance, frost resistance, chemical resistance, and, as a result, the durability of concrete.
Nanosilica obtained based on a hydrothermal solution is applicable as an effective nanomodifier of concrete and is used [77,78,79]:
(1) to accelerate hardening;
(2) increasing the compressive strength of concrete at the early age up to 120% and about 40% in the age of 28 days; increasing of the concrete’s compressive strength with additive of hydrothermal nanosilica was 10% higher than with additive of colloid nanosilica based on Na2SiO3 precursor [72];
(3) reduction of Portland cement consumption up to 30%.
A sufficiently developed application of hydrothermal SiO2 nanoparticles is the intensification of photosynthesis in chloroplasts of plant cells due to the photoluminescent radiation of SiO2 nanoparticles. SiO2 nanoparticles due their optical properties can absorb solar radiation in ultraviolet region with a wave-length of 200 to 360 nm and emit of luminescent radiation in visible region with a wave length of 400 to 500 nm, in which the efficiency to absorb radiation by photosynthetic pigments and carotenoids is high [80,81,82]. An increase in the proportion of photosynthetic pigments of chlorophylls a (62%) and b (79.3%) [82,83,84], as a result, an increase in the growth rate, biochemical and biometric indicators at all stages of plant growth and development, a significant increase crop yields of agricultural plants from 9% to 60% [82,83,84,85], increase of contents of carotenoids—14.5%, B2—130%, B5—60%, B6—230%, B9—230% and C—14.4% vitamins [82,83,84] and rising biological activity of raw plant’s mass with respect to cultures of Daphnia magna—352% and Paramecium caudatum—90.5% [82,83,84,85,86]. Hydrothermal SiO2 nanoparticles have great inhibition ability on microflora (Leveilluia taurica, Ocidiopsis sicula) [87].
Hydrothermal nanosilica used as a feed additive that increases the productivity of farm animals (8% to 10%), rate of mass growth (10% to 40%), strength of the bone (17%), blood characteristics (Ca/P relation) and immunity (25% rising of the proportion of big forms of lymphocytes) [88,89,90,91].
Non-toxic [86,87,88,89,90,91] hydrothermal SiO2 nanopowders can be the basis for the creation of medical preparations:
- enterosorbents,
- drugs that improve the structure of bone, strength and plasticity of the articular-bone tissue and reduce Ca leaking.

5. Conclusions

1. A technological route proposed that allows one to obtain amorphous SiO2 nanopowders based on a hydrothermal solution. The scheme includes the OSA polycondensation processes, ultrafiltration membrane separation, and cryochemical vacuum sublimation. The route allows to regulate parameters of the structure of the powder: the pour density, the diameters of the particle, specific surface area, diameters, pore area and volume, volume fraction of spherical particles in aggregates and agglomerates, sizes of agglomerates and number of particles in agglomerates, and fractal dimension. The parameters of the structure of hydrothermal nanosilica powders (ρp, dBET, SBET, Vp, Vs/Vaggr, 2×Rg1, Dagglom, Nagglom, Df) differs from precipitated and pyrogenic samples. The structure parameters determine physical and chemical activity and applications of nanopowders. The interactions between SiO2 nanoparticles, surface properties, parameters of double electric layer and stability of SiO2 nanoparticles differs in hydrothermal sols and nanopowders from interactions in sols produced from Na2SiO3 solutions or in precipited and pirogenic SiO2 nanopowders. The difference in interactions of SiO2 nanoparticles arised from the ion concentrations, ionic strength of hydrothermal solution and kinetics of OSA’s polycondencation. The difference in nanoparticles interactions leads to the difference in structure parameters of nanopowders. The structure parameters determines physical and chemical activity of SiO2 nanopowders and it’s applications.
The interactions between SiO2 nanoparticles, surface properties, parameters of double electric layer and stability of SiO2 nanoparticles differs in hydrothermal sols and nanopowders from interactions in sols produced from Na2SiO3 solutions or in precipited and pirogenic SiO2 nanopowders. The difference in interactions of SiO2 nanoparticles arised from the ion concentractions, ionic strength of hydrothermal solution and kinetics of OSA’s polycondencation. The difference in nanoparticles interactions leads to the difference in structure parameters of nanopowders. The structure parameters determines physical and chemical activity of SiO2 nanopowders and it’s applications.
2. The values of the average particle diameter of SiO2 in sols, according to the data of dynamic light scattering, ranged from 5 to 100 nm. The average particle diameter of SiO2 in powders, according to tunnel electron microscopy and the BET method, was in the same range of 5 to 100 nm.
3. The pour density of nanopowders ρp depended on the content of [SiO2] in the sol and, therefore, on the concentration of particles and the average distance between them. When the content of [SiO2] in sols ranged from 2.4 to 90 g/dm3, the pour density was higher than [SiO2], respectively SiO2 particles came together after sublimation of water molecules. At a content of [SiO2] above 90 g/dm3, the pour density was lower than [SiO2] and the average distance between SiO2 particles, respectively, increased. In the range of [SiO2] contents in sols from 100 to 520 g/dm3, the ρp ([SiO2]) dependence was close to linear.
4. By lowering the temperature of the hydrothermal solution at the OSA polycondensation stage from 90 to 20 °C, we achieved a decrease in the size of SiO2 particles and, accordingly, an increase in their specific surface to 500 m2/g and a decrease in pore diameter from 15 to 2.7 nm. The specific pore volume was in the range of 0.20 to 0.30 cm3/g and varied little depending on the specific surface area and density of nanopowders. Spherical particles of SiO2 in nanopowders form aggregates with a high-volume fraction of 0.7 to 0.6. The density of matter in aggregates, 1.32–1.54 g/cm3, was significantly higher than the density of nanopowders, which was 0.02–0.274 g/cm3. The ratio of the average pore diameter dp to the average surface particle diameter dBET from 0.3–0.43 to 0.5 also indicated a high-volume fraction of the packing of SiO2 particles in the aggregates. According to the SAXS data, aggregates of SiO2 nanoparticles form agglomerates with a fractal dimension of 2.04–2.21.
5. The content of impurity components in nanopowders can be brought up to 0.3 wt.% due to ultrafiltration membrane separation of SiO2 nanoparticles and ions of dissolved salts, an increase in the SiO2 content in the sol, and an increase in the ratio ms = [SiO2]/TDS to 300 and higher.
6. Tests of compacted SiO2 nanopowders showed values of compressive strength in the range 135–337 MPa. This indicates a high specific surface area and high surface energy of SiO2 nanoparticles.
7. Nanopowders obtained by the proposed technology have prospects for the use in the production of glass, silicon carbide, ceramics, concrete nanomodifiers, sorbents, plant growth stimulants, feed additives for agricultural animals, and medicines.

Author Contributions

Technological route for nanosilica production from hydrothermal solution by using the processes of OSA polycondensation, ultrafiltration membrane concentration and vacuum sublimation proposed by V.P. and R.F. made significant contribution in the plan of research work on nanosilica characteristics, in evaluation of experimental results and analysed the ways of possible applications of hydrothermal nanosilica in chemical industry, building materials, agriculture and medicine. Construction of membrane’s and vacuum sublimation’s plants, experiments on SiO2 nanopowders production under different conditions were done by D.G. All the authors took an active part in manuscript’s preparation and discussion. All authors have read and agreed to the published version of the manuscript.

Funding

This research received no external funding.

Conflicts of Interest

The authors declare that they have no conflict of interests.

References

  1. Synthetic Amorphous Silicon Dioxide (NM-200, NM-201, NM-202, NM-203, NM-204): Characterisation and Physico-Chemical Properties. JRC Repository: NM-series of Representative Manufactured Nanomaterials. Joint Research Centre: Ispra, Italy. Available online: http:www.jrc.ec.europa.eu (accessed on 27 March 2020).
  2. Smith, D.M.; Scherer, G.W.; Anderson, J.M. Shrinkage during drying of silica gel. Non-Cryst. Solids 1995, 188, 191–206. [Google Scholar] [CrossRef]
  3. Ru, Y.; Guangyan, Z.; Min, L.; Nan, J. Obtaining and properties of powdered SiO2 in the form of nanoparticles prepared by drying under supercritical conditions. Chin. Ceram. Soc. 2005, 33, 281–286. [Google Scholar]
  4. Titulaer, M.K.; Jansen JB, H.; Geus, J.W. Fluid composition on silica gel aging. Non-Cryst. Solids 1994, 170, 11–20. [Google Scholar] [CrossRef]
  5. Wijnen, P.W.; Beelen, T.P.; Rummens, K.P.; Saeijs, H.C.; De Haan, J.W.; Van De Ven, L.J.; A Van Santen, R. The molecular basis of aging of aqueous silica gel. J. Colloid Interface Sci. 1991, 145, 17–32. [Google Scholar] [CrossRef]
  6. Rao, K.S.; El-Hami, K.; Kodaki, T.; Matsushige, K.; Makino, K. A novel method for synthesis of silica nanoparticles. J. Colloid Interface Sci. 2005, 289, 125–131. [Google Scholar] [CrossRef]
  7. Costa, R.; Leite CA, P.; Galembeck, F. Size dependence of Stober silica nanoparticle microchemistry. Phys. Chem. B 2003, 107, 4747–4755. [Google Scholar] [CrossRef]
  8. Grun, M.; Unger, K.K.; Matsumoto, A.; Tatsumi, K. Novel pathways for the preparation of mesoporous MCM-41 materials: Control of porosity and morphology. Micropor. Mesopor. Mater. 1999, 27, 207–216. [Google Scholar] [CrossRef]
  9. Schumacher, K.; Grun, M.; Unger, K.K. Novel synthesis of spherical MCM-48. Micropor. Mesopor. Mater. 1999, 27, 201–206. [Google Scholar] [CrossRef]
  10. Scholz, S.; Bare, S.R.; Kelly, S.D.; Lercher, J.A. Controlled one-step synthesis of hierarchically structured macroscopic silica spheres. Microporous Mesoporous Mater. 2011, 146, 18–27. [Google Scholar] [CrossRef]
  11. Edler, K.; White, W. Further improvements in the long-range order of MCM-41 materials. Chem. Mater. 1997, 9, 1226–1233. [Google Scholar] [CrossRef]
  12. Beck, J.S.; Vartuli, J.C.; Roth, W.J.; Leonowicz, M.E.; Kresge, C.T.; Schmitt, K.D.; Chu, C.T.W.; Olson, D.H.; Sheppard, E.W.; McCullen, S.B.; et al. A new family of mesoporous molecular sieves prepared with liquid crystal templates. J. Am. Chem. Soc. 1992, 114, 10834–10843. [Google Scholar] [CrossRef]
  13. Ohkubo, T.; Ogura, T.; Sakai, H.; Abe, M. Synthesis of highly-ordered mesoporous silica particles using mixed cationic and anionic surfactants as templates. J. Colloid Interface Sci. 2007, 312, 42–46. [Google Scholar] [CrossRef] [PubMed]
  14. Kim, J.H.; Yoon, S.B.; Kim, J.Y.; Chae, Y.B.; Yu, J.S. Synthhesis of monodisperse silica spheres with solid core and mesoporous shell: Morphological control of mesopores. Colloids Surf. A Physicochem. Eng. Asp. 2008, 313–314, 77–81. [Google Scholar] [CrossRef]
  15. Firouzi, A.; Kumar, D.; Bull, L.; Besier, T.; Sieger, P.; Huo, Q.; Walker, S.; Zasadzinski, J.; Glinka, C.; Nicol, J.; et al. Cooperative organization of inorganic-surfactant and biomimetic assemblies. Science 1995, 267, 1138–1143. [Google Scholar] [CrossRef] [PubMed] [Green Version]
  16. Suzuki, K.; Ikari, K.; Imai, H. Synthesis of Silica Nanoparticles Having a Well-Ordered Mesostructure Using a Double Surfactant System. J. Am. Chem. Soc. 2004, 126, 462–463. [Google Scholar] [CrossRef]
  17. Grün, M.; Lauer, I.; Unger, K.K. The synthesis of micrometer- and submicrometer-size spheres of ordered mesoporous oxide MCM-41. Adv. Mater. 1997, 9, 254–257. [Google Scholar] [CrossRef]
  18. Fu, X.; He, X.; Wang, Y. Facile preparation of silica hollow microspheres by precipitation-phase separation method. Colloids Surf. A Phys. Eng. Asp. 2011, 380, 241–249. [Google Scholar] [CrossRef]
  19. Guo, W.; Luo, G.; Wang, Y. A new emulsion method to synthesize well-defined mesoporous particles. J. Colloid Interface Sci. 2004, 271, 400–406. [Google Scholar] [CrossRef]
  20. Chen, F.; Song, F.; Li, Q. Mixed cationic–anionic templating route to Al-MCM-48. Micropor. Mesopor. Mater. 1999, 29, 305–310. [Google Scholar] [CrossRef]
  21. Yang, H.; Vovk, G.; Coombs, N.; Sokolov, I.; Ozin, G.A. Synthesis of mesoporous silica spheres under quiescent aqueous acidic conditions. J. Mater. Chem. 1998, 8, 743–750. [Google Scholar] [CrossRef]
  22. Guo, W.; Goh, D.-C.; Zhao, X.S. Synthesis of super-microporous organosilica microspheres through in situ self-assembly of nanoparticles. J. Mater. Chem. 2005, 15, 4112. [Google Scholar] [CrossRef]
  23. Qi, L.; Ma, J.; Cheng, H.; Zhao, Z. Micrometer-Sized Mesoporous Silica Spheres Grown under Static Conditions. Chem. Mater. 1998, 10, 1623–1626. [Google Scholar] [CrossRef]
  24. Zhao, D.; Sun, J.; Li, Q.; Stucky, G.D. Morphological Control of Highly Ordered Mesoporous Silica SBA-15. Chem. Mater. 2000, 12, 275–279. [Google Scholar] [CrossRef]
  25. Nemoto, N.; Kuwahara, M. Dynamic light scattering of CTAB/sodium salicylate long threadlike micelles in the semidilute regime: Applicability of the dynamic scaling law. Langmuir 1993, 9, 419–423. [Google Scholar] [CrossRef]
  26. Ma, Y.; Qi, L.; Ma, J.; Wu, Y.; Liu, O.; Cheng, H. Large-pore mesoporous silica spheres: Synthesis and application in HPLC. Colloids Surf. A Phys. Eng. Asp. 2003, 229, 1–8. [Google Scholar] [CrossRef]
  27. Eiden-Assmann, S.; Lindlar, B.; Maret, G. Synthesis and characterization of colloidal fluorescent mesoporous silica particles. J. Colloid Interface Sci. 2004, 271, 120–123. [Google Scholar] [CrossRef]
  28. Allouche, J.; Dupin, J.-C.; Gonbeau, D. Generation of a mesoporous silica MSU shell onto solid core silica nanoparticles using a simple two-step sol–gel process. Chem. Commun. 2011, 47, 7476. [Google Scholar] [CrossRef]
  29. Ho, J.; Zhu, W.; Wang, H.; Forde, G.M. Mesoporous silica spheres from colloids. J. Colloid Interface Sci. 2007, 308, 374–380. [Google Scholar] [CrossRef]
  30. Yuying, P.U.; Jianzhang FA, N.G.; Feng PE, N.G.; Baojian, L.I.; Huang, L. Microemulsion synthesis of nanosized SiO2/TiO2 particles and their photocatalytic activity. Chin. J. Catal. 2007, 28, 251–256. [Google Scholar]
  31. Yao, T.; Lin, Q.; Zhang, K.; Zhao, D.; Lv, H.; Zhang, J.; Yang, B. Preparation of SiO2 polystyrene–polypyrrole sandwich composites and hollow polypyrrole capsules with movable SiO2 spheres inside. J. Colloid Interface Sci. 2007, 315, 434–438. [Google Scholar] [CrossRef]
  32. Yoldas, B.E. Monolithic glass formation by chemical polymerization. J. Mater. Sci. 1979, 14, 1843–1849. [Google Scholar] [CrossRef]
  33. Zhang, G.; Wang, Y.; Zhengyi, F.; Wang, H.; Wang, W.; Zhang, J.; Lee, S.W.; Niihara, K. Transparent mullite ceramic from single-phase gel by Spark Plasma Sintering. J. Eur. Ceram. Soc. 2009, 29, 2705–2711. [Google Scholar] [CrossRef]
  34. Innocenzi, P.; Martucci, A.; Guglielmi, M.; Bearzotti, A.; Traversa, E.; Pivin, J.C. Mesoporous silica thin films for alcohol sensors. J. Eur. Ceram. Soc. 2001, 21, 1985–1988. [Google Scholar] [CrossRef]
  35. Paul, J.; Romeis, S.; Mačković, M.; Marthala, V.R.R.; Herre, P.; Przybilla, T.; Hartmann, M.; Spiecker, E.; Schmidt, J.; Peukert, W. In situ cracking of silica beads in the SEM and TEM—Effect of particle size on structure–property correlations. Powder Technol. 2015, 270, 337–347. [Google Scholar] [CrossRef]
  36. Bagheri, E.; Ansari, L.; Abnous, K.; Taghdisi, S.M.; Charbgoo, F.; Ramezani, M.; Alibolandi, M. Silica based hybrid materials for drug delivery and bioimaging. J. Control. Release 2018, 277, 57–76. [Google Scholar] [CrossRef] [PubMed]
  37. Jang, J.; Yoon, H. Novel Fabrication of Size-Tunable Silica Nanotubes Using a Reverse- Microemulsion-Mediated Sol–Gel Method. Adv. Mater. 2004, 16, 799–802. [Google Scholar] [CrossRef]
  38. Loganina, V.I.; Kislitsyna, S.N.; Mazhitov, Y.B.; Ivanovna, L.V.; Nikolaevna, K.S.; Bisengalievich, M.Y. Development of sol-silicate composition for decoration of building walls. Case Stud. Constr. Mater. 2018, 9. [Google Scholar] [CrossRef]
  39. Kao, K.-C.; Lin, C.-H.; Chen, T.-Y.; Liu, Y.-H.; Mou, C.-Y. A General Method for Growing Large Area Mesoporous Silica Thin Films on Flat Substrates with Perpendicular Nanochannels. J. Am. Chem. Soc. 2015, 137, 3779–3782. [Google Scholar] [CrossRef]
  40. Chęcmanowski, J.; Szczygieł, I.; Mazur, A.; Szczygiel, B. Protective properties of SiO2 with SiO2 and Al2O3 nanoparticles sol-gel coatings deposited on FeCrAl alloys. Ceram. Int. 2019, 45, 2811–2819. [Google Scholar] [CrossRef]
  41. Matysiak, W.; Tański, T. Analysis of the morphology, structure and optical properties of 1D SiO2 nanostructures obtained with sol-gel and electrospinning methods. Appl. Surf. Sci. 2019, 489, 34–43. [Google Scholar] [CrossRef]
  42. Liu, Y.; Cai, Z.; Sheng, L.; Ma, M.; Xu, Q. Influence of nanosilica on inner structure and performance of chitosan based films. Carbohydr. Polym. 2019, 212, 421–429. [Google Scholar] [CrossRef] [PubMed]
  43. Sowntharya, L.; Gundakaram, R.C.; Raju, K.S.; Subasri, R. Effect of addition of surface modified nanosilica into silica–zirconia hybrid sol–gel matrix. Ceram. Int. 2013, 39, 4245–4252. [Google Scholar] [CrossRef]
  44. Cai, Y.; Li, X.; Dong, J. Microstructure and mechanical properties of porous Si3N4–SiO2 ceramics fabricated by a process combining carbothermal reduction and sol–gel infiltration–sintering. Mater. Sci. Eng. A 2014, 601, 111–115. [Google Scholar] [CrossRef]
  45. Pronin, I.; Goryacheva, M.V. Principles of structure formation and synthesis models produced by the sol–gel method SiO2–MexOy nanocomposites. Surf. Coat. Technol. 2013, 235, 835–840. [Google Scholar] [CrossRef]
  46. Asadi, Z.; Norouzbeigi, R. Synthesis of colloidal nanosilica from water glass powder as a low cost precursor. Ceram. Int. 2018, 44, 22692–22697. [Google Scholar] [CrossRef]
  47. Bakar, R.A.; Yahya, R.; Gan, S.N. Production of High Purity Amorphous Silica from Rice Husk. Procedia Chem. 2016, 19, 189–195. [Google Scholar] [CrossRef] [Green Version]
  48. Weres, O.; Yee, A.; Tsao, L. Kinetics of silica polymerization. J. Colloid Interface Sci. 1981, 84, 379–402. [Google Scholar] [CrossRef] [Green Version]
  49. Potapov, V.V.; Cerdan, A.A.; Kashutina, I.A. Numerical simulation of orthosilicic acid polycondensation and silica particles formation inhydrothermal solutions. Вулканoлoгия и сейсмoлoгия 2019, 4, 18–28. [Google Scholar] [CrossRef]
  50. Potapov, V.V.; Kamashev, D.V. Synthesis of precious opal in a hydrothermal solution. Glas. Phys. Chem. 2006, 32, 89–98. [Google Scholar] [CrossRef]
  51. Beaucage, G. Small-Angle Scattering from Polymeric Mass Fractals of Arbitrary Mass-Fractal Dimension. J. Appl. Cryst. 1996, 29, 134–146. [Google Scholar] [CrossRef] [Green Version]
  52. Kammler, H.K.; Beaucage, G.; Mueller, R.; Pratsinis, S.E. Structure of Flame-Made Silica Nanoparticles by Ultra-Small-Angle X-ray Scattering. Langmuir 2004, 20, 1915–1921. [Google Scholar] [CrossRef]
  53. Kammler, H.K.; Beaucage, G.; Kohls, D.J.; Agashe, N.; Ilavsky, J. Monitoring simultaneously the growth of nanoparticles and aggregates by in situ ultra-smallangle X-ray scattering. Appl. Phys. 2005, 97, 9–11. [Google Scholar] [CrossRef] [Green Version]
  54. Hyeon-Lee, J.; Beaucage, G.; Pratsinis, S.E.; Vemury, S. Fractal Analysis of Flame-Synthesized Nanostructured Silica and Titania Powders Using Small-Angle X-ray Scattering. Langmuir 1998, 14, 5751–5756. [Google Scholar] [CrossRef]
  55. Bushell, G.; Yan, Y.; Woodfield, D.; Raper, J.; Amal, R. On techniques for the measurement of the mass fractal dimension of aggregates. Adv. Colloid Interface Sci. 2002, 95, 1–50. [Google Scholar] [CrossRef]
  56. Brasil, A.M.; Farias, T.L.; Carvalho, M.G. A recipe for image characterization of fractal-like aggregates. J. Aerosol Sci. 1999, 30, 1379–1389. [Google Scholar] [CrossRef]
  57. De Temmerman, P.-J.; Van Doren, E.; Verleysen, E.; Van der Stede, Y.; Francisco, M.A.D.; Mast, J. Quantitative characterization of agglomerates and aggregates of pyrogenic and pprecipitated amorphous silica nanomaterials by transmission electron microscopy. J. Nanobiotechnol. 2012, 10, 24. [Google Scholar] [CrossRef] [Green Version]
  58. Boldridge, D. Morphological Characterization of Fumed Silica Aggregates. Aerosol Sci. Technol. 2010, 44, 182–186. [Google Scholar] [CrossRef]
  59. Nel, A.; Mädler, L.; Velegol, D.; Xia, T.; Hoek, E.M.V.; Somasundaran, P.; Klaessig, F.; Castranova, V.; Thompson, M. Understanding biophysicochemical interactions at the nano–bio interface. Nat. Mater. 2009, 8, 543–557. [Google Scholar] [CrossRef]
  60. Chu, Z.; Huang, Y.; Tao, Q.; Li, Q. Cellular uptake, evolution, and excretion of silica nanoparticles in human cells. Nanoscale 2011, 3, 3291–3299. [Google Scholar] [CrossRef]
  61. Jiang, J.; Oberdörster, G.; Biswas, P. Characterization of size, surface charge, and agglomeration state of nanoparticle dispersions for toxicological studies. J. Nanopart. Res. 2009, 11, 77–89. [Google Scholar] [CrossRef]
  62. Powers, K.W.; Brown, S.C.; Krishna, V.B.; Wasdo, S.C.; Moudgil, B.M.; Roberts, S.M. Research Strategies for Safety Evaluation of Nanomaterials. Part VI. Characterization of Nanoscale Particles for Toxicological Evaluation. Toxicol. Sci. 2006, 90, 296–303. [Google Scholar] [CrossRef]
  63. Roebben, G.; Rasmussen, K.; Kestens, V.; Linsinger, T.P.J.; Rauscher, H.; Emons, H.; Stamm, H. Reference materials and representative test materials: The nanotechnology case. J. Nanoparticle Res. 2013, 15, 1455–1468. [Google Scholar] [CrossRef]
  64. Xia, T.; Kovochich, M.; Brant, J.; Hotze, M.; Sempf, J.; Oberley, T.; Sioutas, C.; Yeh, J.I.; Wiesner, M.R.; Nel, A. Comparison of the Abilities of Ambient and Manufactured Nanoparticles To Induce Cellular Toxicity According to an Oxidative Stress Paradigm. Nano Lett. 2006, 6, 1794–1807. [Google Scholar] [CrossRef] [PubMed]
  65. Potapov, V.V.; Zhuravlev, L.T. Temperature Dependence of the Concentration of Silanol Groups in Silica Precipitated from a Hydrothermal Solution. Glas. Phys. Chem. 2005, 31, 661–670. [Google Scholar] [CrossRef]
  66. Zhuravlev, L. The surface chemistry of amorphous silica. Zhuravlev model. Colloids Surf. A Phys. Eng. Asp. 2000, 173, 1–38. [Google Scholar] [CrossRef] [Green Version]
  67. Potapov, V.V. Physical and chemical processes of nanosilica precipitation from hydrothermal solution. Theor. Found. Chem. Technol. 2003, 37, 1–9. [Google Scholar]
  68. Potapov, V.V. Method of Utilization of Geothermal Silica for Liquid Glass Production. Patent of Russian Federation on Invention No. 2186025, 25 December 2000. [Google Scholar]
  69. Potapov, V.V. Method of Precipitaion of Nanosilica from Hydrothermal Heat Carrier with Production of Metal’s Silicates. Patent of Russian Federation on Invention No. 2259318, 8 August 2003. [Google Scholar]
  70. Sobolev, K.; Gutiérrez, M.F.; Society, T.A.C. How Nanotechnology Can Change the Concrete World. Prog. Nanotechnol. 2014, 10, 117–120. [Google Scholar]
  71. Sanchez, F.; Sobolev, K. Nanotechnology in Concrete—A Review. Constr. Build. Mater. 2010, 24, 2060–2071. [Google Scholar] [CrossRef]
  72. Flores-Vivian, I.; Pradoto, R.G.K.; Moini, M.; Kozhukhova, M.; Potapov, V.; Sobolev, K. The effect of SiO2 nanoparticles derived from hydrothermal solutions on the performance of portland cement based materials. Front. Struct. Civ. Eng. 2017, 11, 436–445. [Google Scholar] [CrossRef]
  73. Fediuk, R. Composite Binders for Concretes with Improved Shock Resistance. Inorg. Mater. 2019, 10, 1177–1184. [Google Scholar] [CrossRef]
  74. Svintsov, A.P.; Shchesnyak, E.L.; Galishnikova, V.V.; Fediuk, R.; Stashevskaya, N.A. Effect of nano-modified additives on properties of concrete mixtures during winter season. Constr. Build. Mater. 2020, 237, 117527. [Google Scholar] [CrossRef]
  75. Artamonova, O.; Slavcheva, G.; Chernyshov, E.M. Effectiveness of combined nanoadditives for cement systems. Inorg. Mater. 2017, 53, 1080–1085. [Google Scholar] [CrossRef]
  76. Elistratkin, M.Y.; Minakov, S.V.; Shatalova, S.V. Composite binding mineral additive influence on the plasticizer efficiency. Constr. Mater. Prod. 2019, 2, 10–16. [Google Scholar]
  77. Potapov, V.; Efimenko, Y.; Gorev, D. Modification of concrete by hydrothermal nanosilica. Nanotechnologies Constr. A. 2019, 11, 248–265. [Google Scholar]
  78. Potapov, V.; Efimenko, Y.; Gorev, D. Determination of the amount of Ca(OH)2 bound by additive nano-SiO2 in cement matrices. Nanotechnol. Constr. A 2019, 11, 415–432. [Google Scholar] [CrossRef]
  79. Potapov, V.V.; Kashutin, A.N. Method of Increasing of Concrete’s Compressive Strength by Using of Nanosilica Recovered from Hydrothermal Solution. Patent of Russian Federation on Invention No. 259739, 5 August 2015. [Google Scholar]
  80. Potapov, V.V.; Revina, A.A.; Baranova, E.K. The optical properties of nanodisperse silica in hydrothermal solutions. Russ. J. Phys. Chem. A 2008, 82, 1002–1009. [Google Scholar] [CrossRef]
  81. Revina, A.A.; Potapov, V.V.; Baranova, E.K.; Smirnov, Y.V. Research of interaction of nanosilica and metall’s nanoparticles by the method of spectrophotometry. Phys. Chem. A 2013, 87, 262–269. [Google Scholar]
  82. Zelenkov, V.N.; Potapov, V.V. Hydrothermal nanosilica in agricultural and crop bitechnology. Nanoindustry 2020, 1, 22–33. [Google Scholar]
  83. Zelenkov, V.N.; Petrichenko, V.N.; Potapov, V.V.; Eliseeva, L.G.; Ivanova, M.I.; Latushkin, V.V.; Novikov, V.B. Verification of the complex preparation of hydrothermal nanosilica with krezacin for hydroponic growing of lettuce in a closed system of the ITS-1 phytotron. Curr. Biotechnol. 2018, 3, 378. [Google Scholar]
  84. Zelenkov, V.N.; Petrichenko, V.N.; Potapov, V.V. Method of Hydrothermal Nanosilica Using for Production of Lettuce in Agricultural Techonological Systems. Patent of Russian Federation on Invention No. 2701495, 11 December 2018. [Google Scholar]
  85. Zelenkov, V.N.; Ivanova, M.I.; Potapov, V.V. Hydrothermal Nanosilica in the Agrotechnology of Radish Cultivated in the Conditions of Low Positive Temperature. In Proceedings of the AIP Conference, Yekaterinburg, Russia, 15–17 November 2018. [Google Scholar]
  86. Lapin, A.A.; Kalayda, M.L.; Potapov, V.V.; Zelenkov, V.N.; Voropaeva, N.L. The influence of hydrothermal nanosilica powder aquaspersions on the vital capacity of Daphnia Magna Straus Crustataceans. Int. J. Nanotechnol. 2018, 15, 422–432. [Google Scholar]
  87. Zelenkov, V.N.; Potapov, V.V. Method of Inhibition of Mealy Dew of Tomatoes. Patent of Russian Federation on Invention No. 2646058, 6 July 2017. [Google Scholar]
  88. Potapov, V.V.; Sivashenko, V.N.A.; Zelenkov, V.N. Nanodispersed silicon dioxide: Plant growing and veterinary science. Nanoindustry 2013, 4, 18–25. [Google Scholar]
  89. Potapov, V.V. Method of Hydrothermal Nanosilica Using as Food Additive. Patent RU on Invention No. 2638322, 12 December 2016. [Google Scholar]
  90. Potapov, V.V. Method of Amorphous Hydrothermal Nanosilica Using in Poultry-Keeping. Patent RU on Invention No. 2655739, 5 June 2017. [Google Scholar]
  91. Potapov, V.V.; Muradov, S.V.; Sivashenko, V.A.; Rogatyh, S.V. Nanodispersed silicon dioxide: Applications in medicine and veterinary. Nanoindustry 2012, 3, 32–36. [Google Scholar]
Figure 1. The particle sizes distribution in the hydrothermal sol sample, determined by dynamic light scattering.
Nanomaterials 10 00624 g001
Figure 2. Scheme of the cryochemical vacuum sublimation setup for producing SiO2 nanopowder: 1—apparatus for the preparation of an aqueous sol; 2—metering pump; 3—cryogranulator; 4—tanker with liquid nitrogen; 5—capacity for storing cryogranules; 6—refrigerator; 7—sublimation apparatus; 8—box for storing nanopowder samples.
Nanomaterials 10 00624 g002
Figure 3. Vacuum sublimation apparatus: 1—sublimation chamber; 2—desublimator; 3—tray with a product; 4—heating stove; 5—vacuum pump; 6—gauge thermocouple; 7—vacuum gauge; 8—control panel; 9—universal voltage regulator, 10—electronic thermometer.
Nanomaterials 10 00624 g003
Figure 4. Dependence of pressure on time during sublimation upon receipt of a sample of nanopowder.
Nanomaterials 10 00624 g004
Figure 5. Dependence of temperature t in a vacuum chamber on the time of sublimation of cryogranules upon receipt of a nanopowder sample.
Nanomaterials 10 00624 g005
Figure 6. Images of structures from silica powder particles formed after sublimation of the solvent from cryogranules. The magnification factors on a scanning electron microscope: (a) 247 times; (b) 500 times; (c) 600 times; (d) 1000 times; (e) 2500 times; (f) 7000 times.
Nanomaterials 10 00624 g006
Figure 7. TEM images of SiO2 nanopowder particles obtained by tunneling electron microscopy. Dimensions of the image area of SiO2 particles: (a) 212 × 212 nm2; (b) 88 × 88 nm2; (c) 52 × 52 nm2.
Nanomaterials 10 00624 g007
Figure 8. Dependence of the pour density of the nanopowder on the content of SiO2 in the sol.
Nanomaterials 10 00624 g008
Figure 9. Pore characteristics of the UF-3-8 sample obtained by the low-temperature nitrogen adsorption method: (a) adsorption-desorption curves (p/p0—relative nitrogen pressure, p0—nitrogen saturation pressure at a temperature of 77 K); (b) differential distribution of area over pore diameter; (c) integral distribution of the area along the pore diameter; (d) xifferential distribution of volume over pore diameter; (e) integral distribution of volume by pore diameter.
Nanomaterials 10 00624 g009aNanomaterials 10 00624 g009b
Figure 10. Pore characteristics of the UF-6-26 sample obtained by the low-temperature nitrogen adsorption method: (a) adsorption-desorption curves (p/p0—relative nitrogen pressure, p0—nitrogen saturation pressure at a temperature of 77 K); (b) differential distribution of area over pore diameter; (c) integral distribution of the area along the pore diameter; (d) differential distribution of volume over pore diameter; (e) integral distribution of volume by pore diameter.
Nanomaterials 10 00624 g010aNanomaterials 10 00624 g010b
Figure 11. Pore characteristics of the UF-12-6 sample obtained by the low-temperature nitrogen adsorption method: (a) adsorption-desorption curves (p/p0—relative nitrogen pressure, p0—nitrogen saturation pressure at a temperature of 77 K); (b) differential distribution of area over pore diameter; (c) integral distribution of the area along the pore diameter; (d) differential distribution of volume over pore diameter; (e) integral distribution of volume by pore diameter.
Nanomaterials 10 00624 g011aNanomaterials 10 00624 g011b
Figure 12. The curves of adsorption-desorption of precipitated NM-200, NM-201 and pyrogenic NM-202 samples of SiO2 nanopowders: (a) sample NM-200, (b) sample NM-201, (c) sample NM-202 [1].
Nanomaterials 10 00624 g012aNanomaterials 10 00624 g012b
Figure 13. The XRD data of the nanopowder: (a) before calcination; (b) after calcination; Ө is the angle between the plane of the sample and the direction of radiation incidence. ARL X’TRA device (CuKa radiation, wavelength: 1.54 Å).
Nanomaterials 10 00624 g013
Figure 14. The results of measurements by the method of small-angle X-ray scattering.
Nanomaterials 10 00624 g014
Figure 15. Strength tests of samples of compacted SiO2 nanopowder: (a) Shimadzu tester; (b) sample of compacted nanopowder; (c) sample before test.
Nanomaterials 10 00624 g015
Figure 16. Curve force and elongation: (a) Sample 1; (b) Sample 2; (c) Sample 3; (d) Sample 4; (e) Sample 5.
Nanomaterials 10 00624 g016aNanomaterials 10 00624 g016b
Table 1. The concentration of the main components of the initial hydrothermal solution.
ComponentNa+K+Li+Ca2+Mg2+Fe2+, 3+Al3+ClSO42HCO3CO32–H3BO3SiO2 total
Concentration, mg/dm328248.11.52.84.7< 0.1< 0.1251.8220.945.261.891.8780
Ionic strength of the solution Is = 14.218 mmol/kg, electrical conductivity σel = 1.1–1.3 mS/cm, pH = 9.2.
Table 2. Pour density of nanopowders, ρp, depending on the SiO2 content in the sol.
[SiO2],g/dm32.45.26.9310.417.563265.85120131.7160260520
ρp, g/dm320.5293543.855558491100117168274
ρp/[SiO2]8.55.65.054.213.131.711.270.760.760.730.650.53
Table 3. Pore characteristics of powders established by low-temperature nitrogen adsorption.
Sample ID[SiO2], g/dm3ρp, g/dm3SBET, m2/gPore area by adsorption curve (BJH), SBET,,m2/gPore area by desorption curve (BJH), m2/gSingle point pore volume, vp,cm3/gPore volume by adsorption curve (BJH), cm3/gPore volume by desorption curve (BJH), cm3/gdBET,nmAverage pore diameter, dp, nmAverage pore diameter by adsorption curve, nmAverage pore diameter by desorption curve, nmArea of micropores, m2/gVolume of micropores, cm3/g
UF-1-9128.08645.435.637.70.100.230.237609.426.425.12.18d.n.
UF-2-32233.822956.847.051.80.150.190.1948.010.916.615.25.60.001
UF-3-824.45262.048.358.00.190.240.2544.012.620.517.311.40.004
UF-4-34586.934474.063.969.70.180.190.2036.810.012.411.65.00.001
UF-5-25108.95297.778.890.40.220.260.2727.99.413.511.913.90.005
UF-6-26114.590120.4111.4121.20.210.220.2322.67.08.27.68.90.002
UF-7-1728.035166.5151.4162.10.250.280.2816.46.27.57.18.20.001
UF-8-2114.015.7200.8158.1166.60.200.220.2313.64.05.85.510.80.001
UF-9-43170.9231.7209.9199.6239.10.210.200.2213.04.04.04.00.1d.n.
UF-10-382.590.0316.0272.1289.90.2430.2160.2218.63.03.23.0d.n.d.n.
UF-11-2033.258360.4256.9280.80.3010.2800.2907.563.34.24.133.80.010
UF-12-1666.086476.3354.3367.10.320.260.275.722.703.02.940.1d.n.
Table 4. Pore characteristics of pyrogenic and precipitated SiO2 nanopowders [1] established by the BET(Brunauer–Emmett–Teller)-method.
Sample IDρp, g/dm3SBET, m2/gPore Volume, cm3/gArea of Micropores, m2/gVolume of Micropores, cm3/g
NM-200120.0189.10.7930.00.01181
NM-201280.0140.40.58123.10.00916
NM-202130.0204.10.5138.260.00084
NM-20330.0203.90.4995.30.0
NM-204160.0136.60.5017.480.00666
Table 5. The concentration of the chemical components of silica nanopowder (X-ray fluorescence spectrometer “S4 PIONEER”).
OxidesConcentration, wt.%
SiO299.7
TiO20.00
Al2O30.173
FeO0.00
Cr2O30.00
MgO0.00
CaO0.034
Na2O0.034
K2O0.069
MnO0.00
NiO0.00
ZnO0.00
Total100.0
Table 6. Dependence of the mass of the nanopowder sample (wt.%) on temperature.
22.6 °C100 °C200 °C 300 °C400 °C500 °C600 °C700 °C800 °C900 °C1000 °C1100 °C
100%94.65%92.81%92.10%91.30%90.58%90.09%89.76%89.49%89.27%89.09%88.61%
Table 7. Distribution of OH-groups between surface and volume for hydrothermal silica sample.
T, °C200300400500600700800900
δOH, OH/nm28.296.714.923.332.231.490.890.40
αOH, OH/nm24.903.562.331.841.521.300.700.40
γOH, OH/nm23.393.152.591.490.710.190.190.0
Table 8. Characteristics of compacted SiO2 nanopowder samples during compressive strength tests.
Sample IDSpeed, mm/minShapeDimensions (Thickness × Width × Height), mmMaximum Force, NMaximum Strain, N/mm2Amplitude of the Stroke, mmMaximum Elongation, %Maximum Elongation, mmMaximum Time, s
11plane4.9 × 11.9 × 3.311735.4201.2590.4283112.97920.4283125.7
21plane4.9 × 11.9 × 3.617145.4294.0400.6571018.25290.6571039.46
31plane5.5 × 13.5 × 3.110032.2135.1141.8061958.26411.80619108.370
41plane5.1 × 12.0 × 3.518897.6308.7841.8196751.99051.81967109.170
51plane5.0 × 11.9 × 2.920057.6337.1021.6819657.99861.68196100.950