Insights into the Effects of Pore Size Distribution on the Flowing Behavior of Carbonate Rocks: Linking a Nano-Based Enhanced Oil Recovery Method to Rock Typing

 ,
,  ,
,  and
and
Abstract

1. Introduction
2. Materials and Methods
2.1. Materials
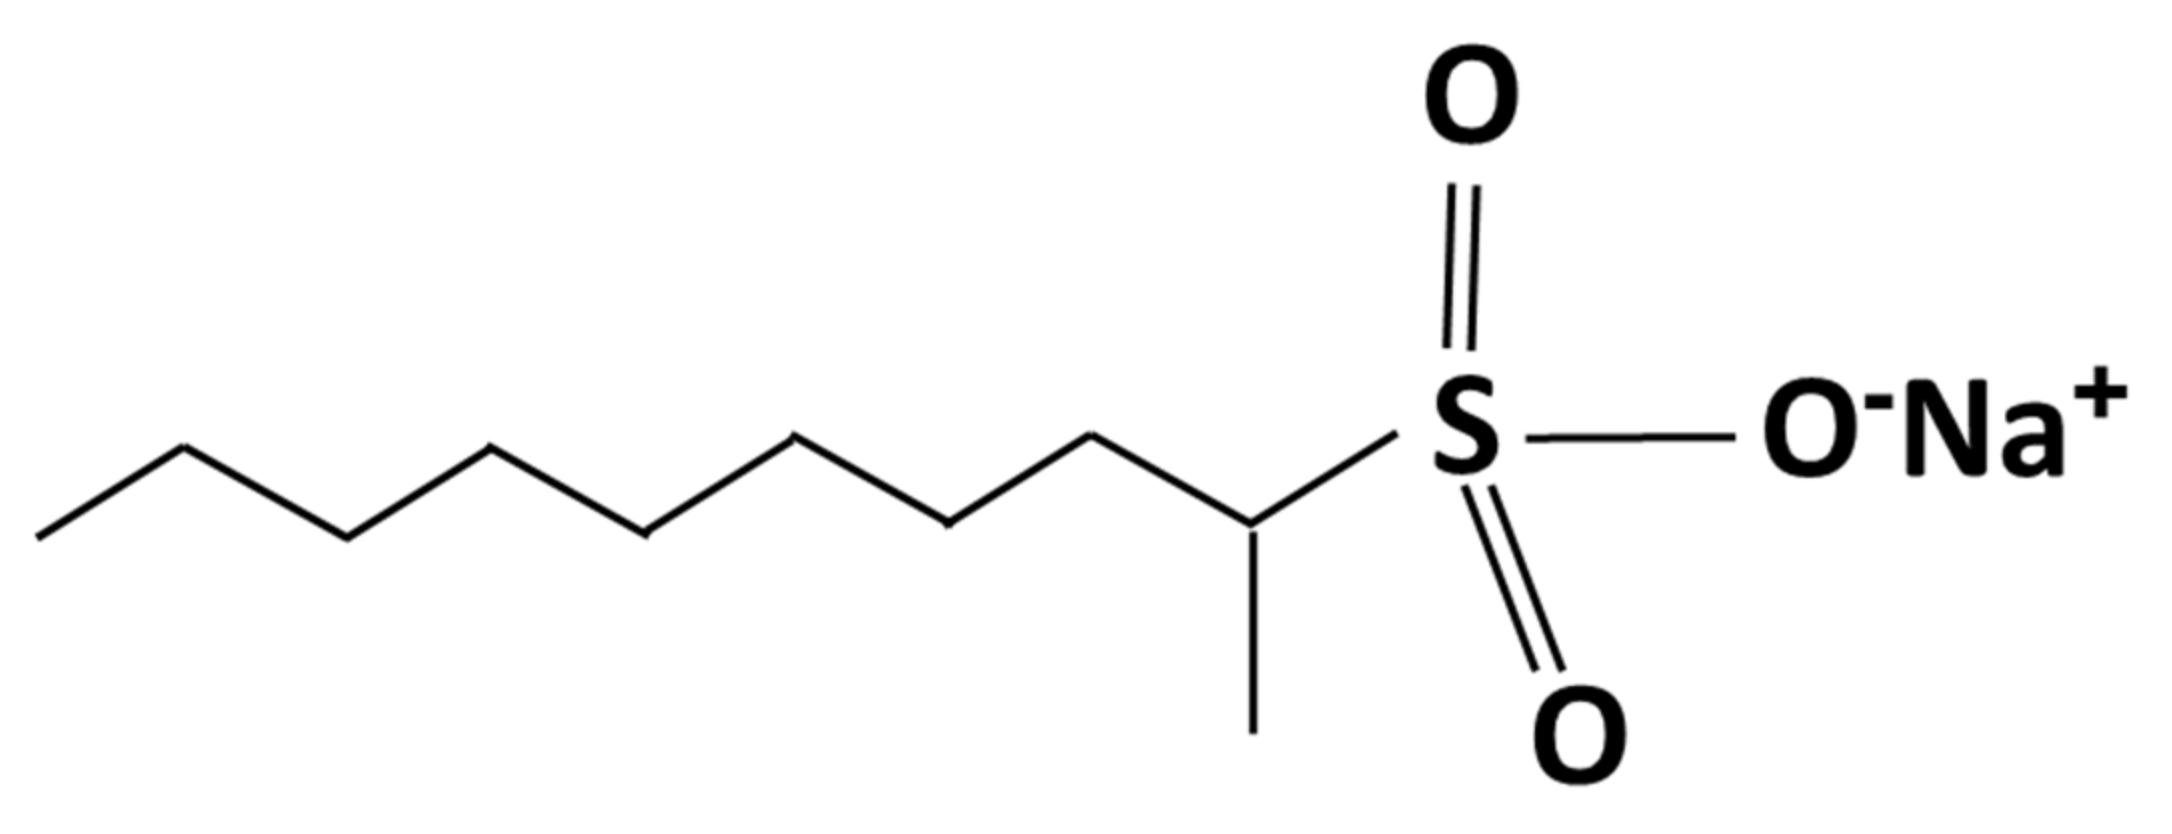
2.1.1. Surfactant
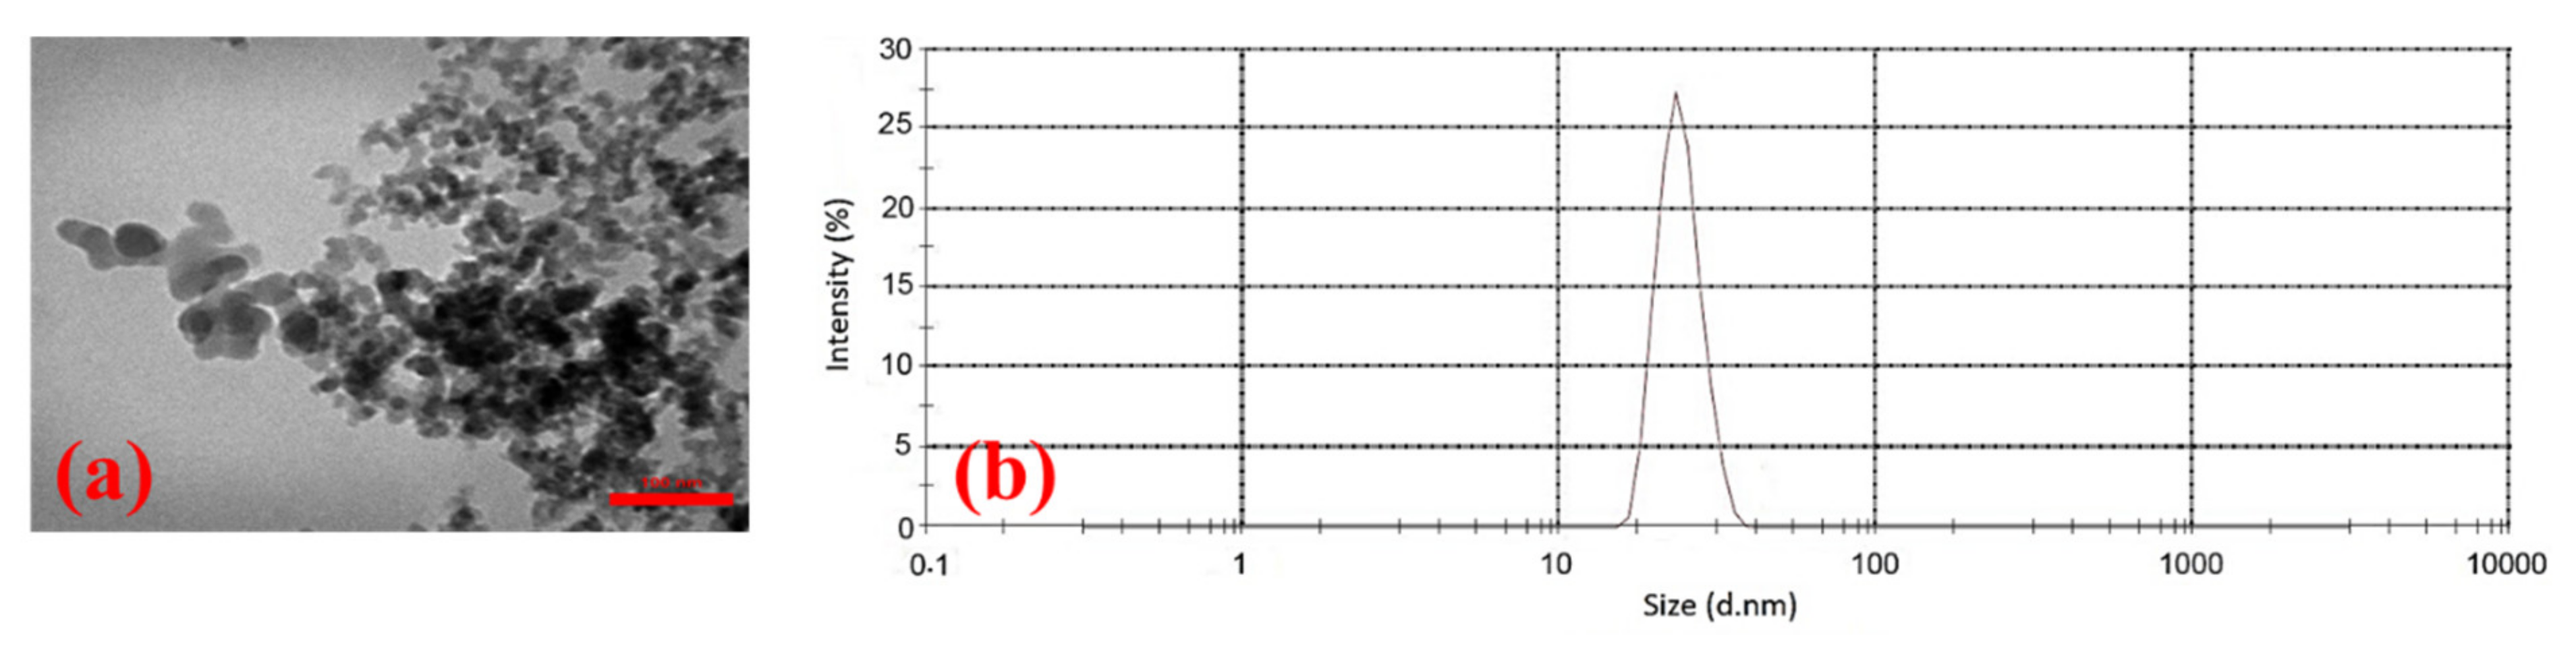
2.1.2. Nanoparticle
2.1.3. Synthetic Brine
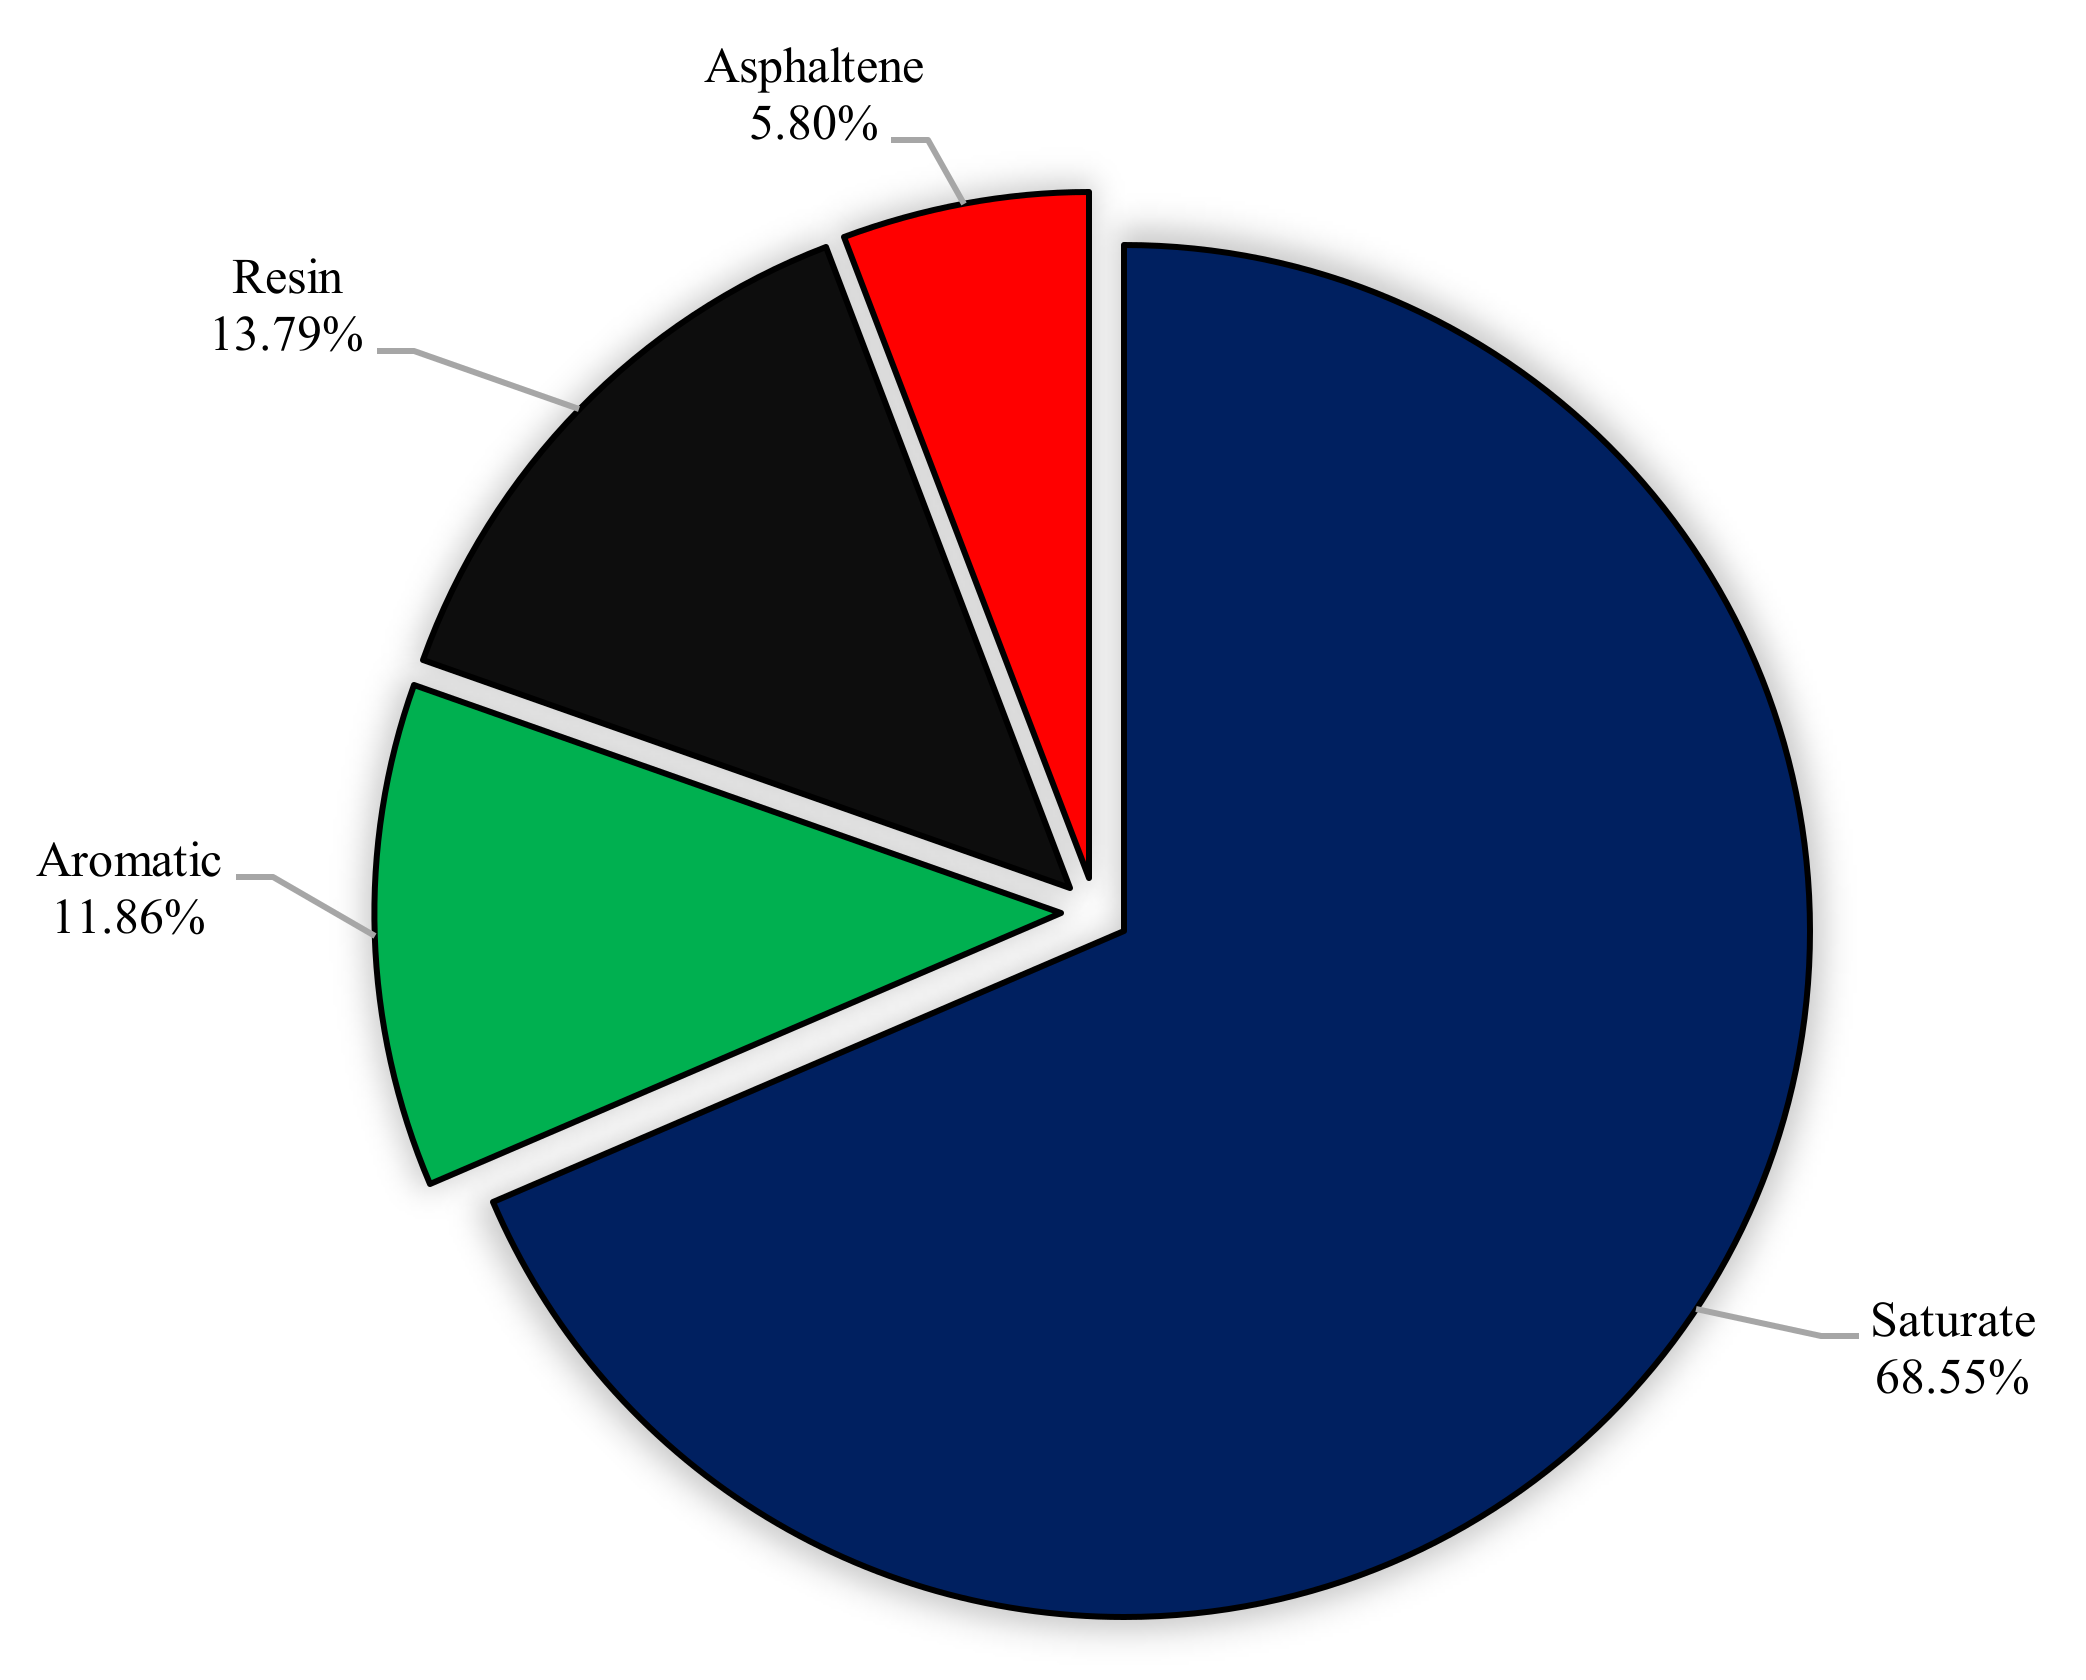
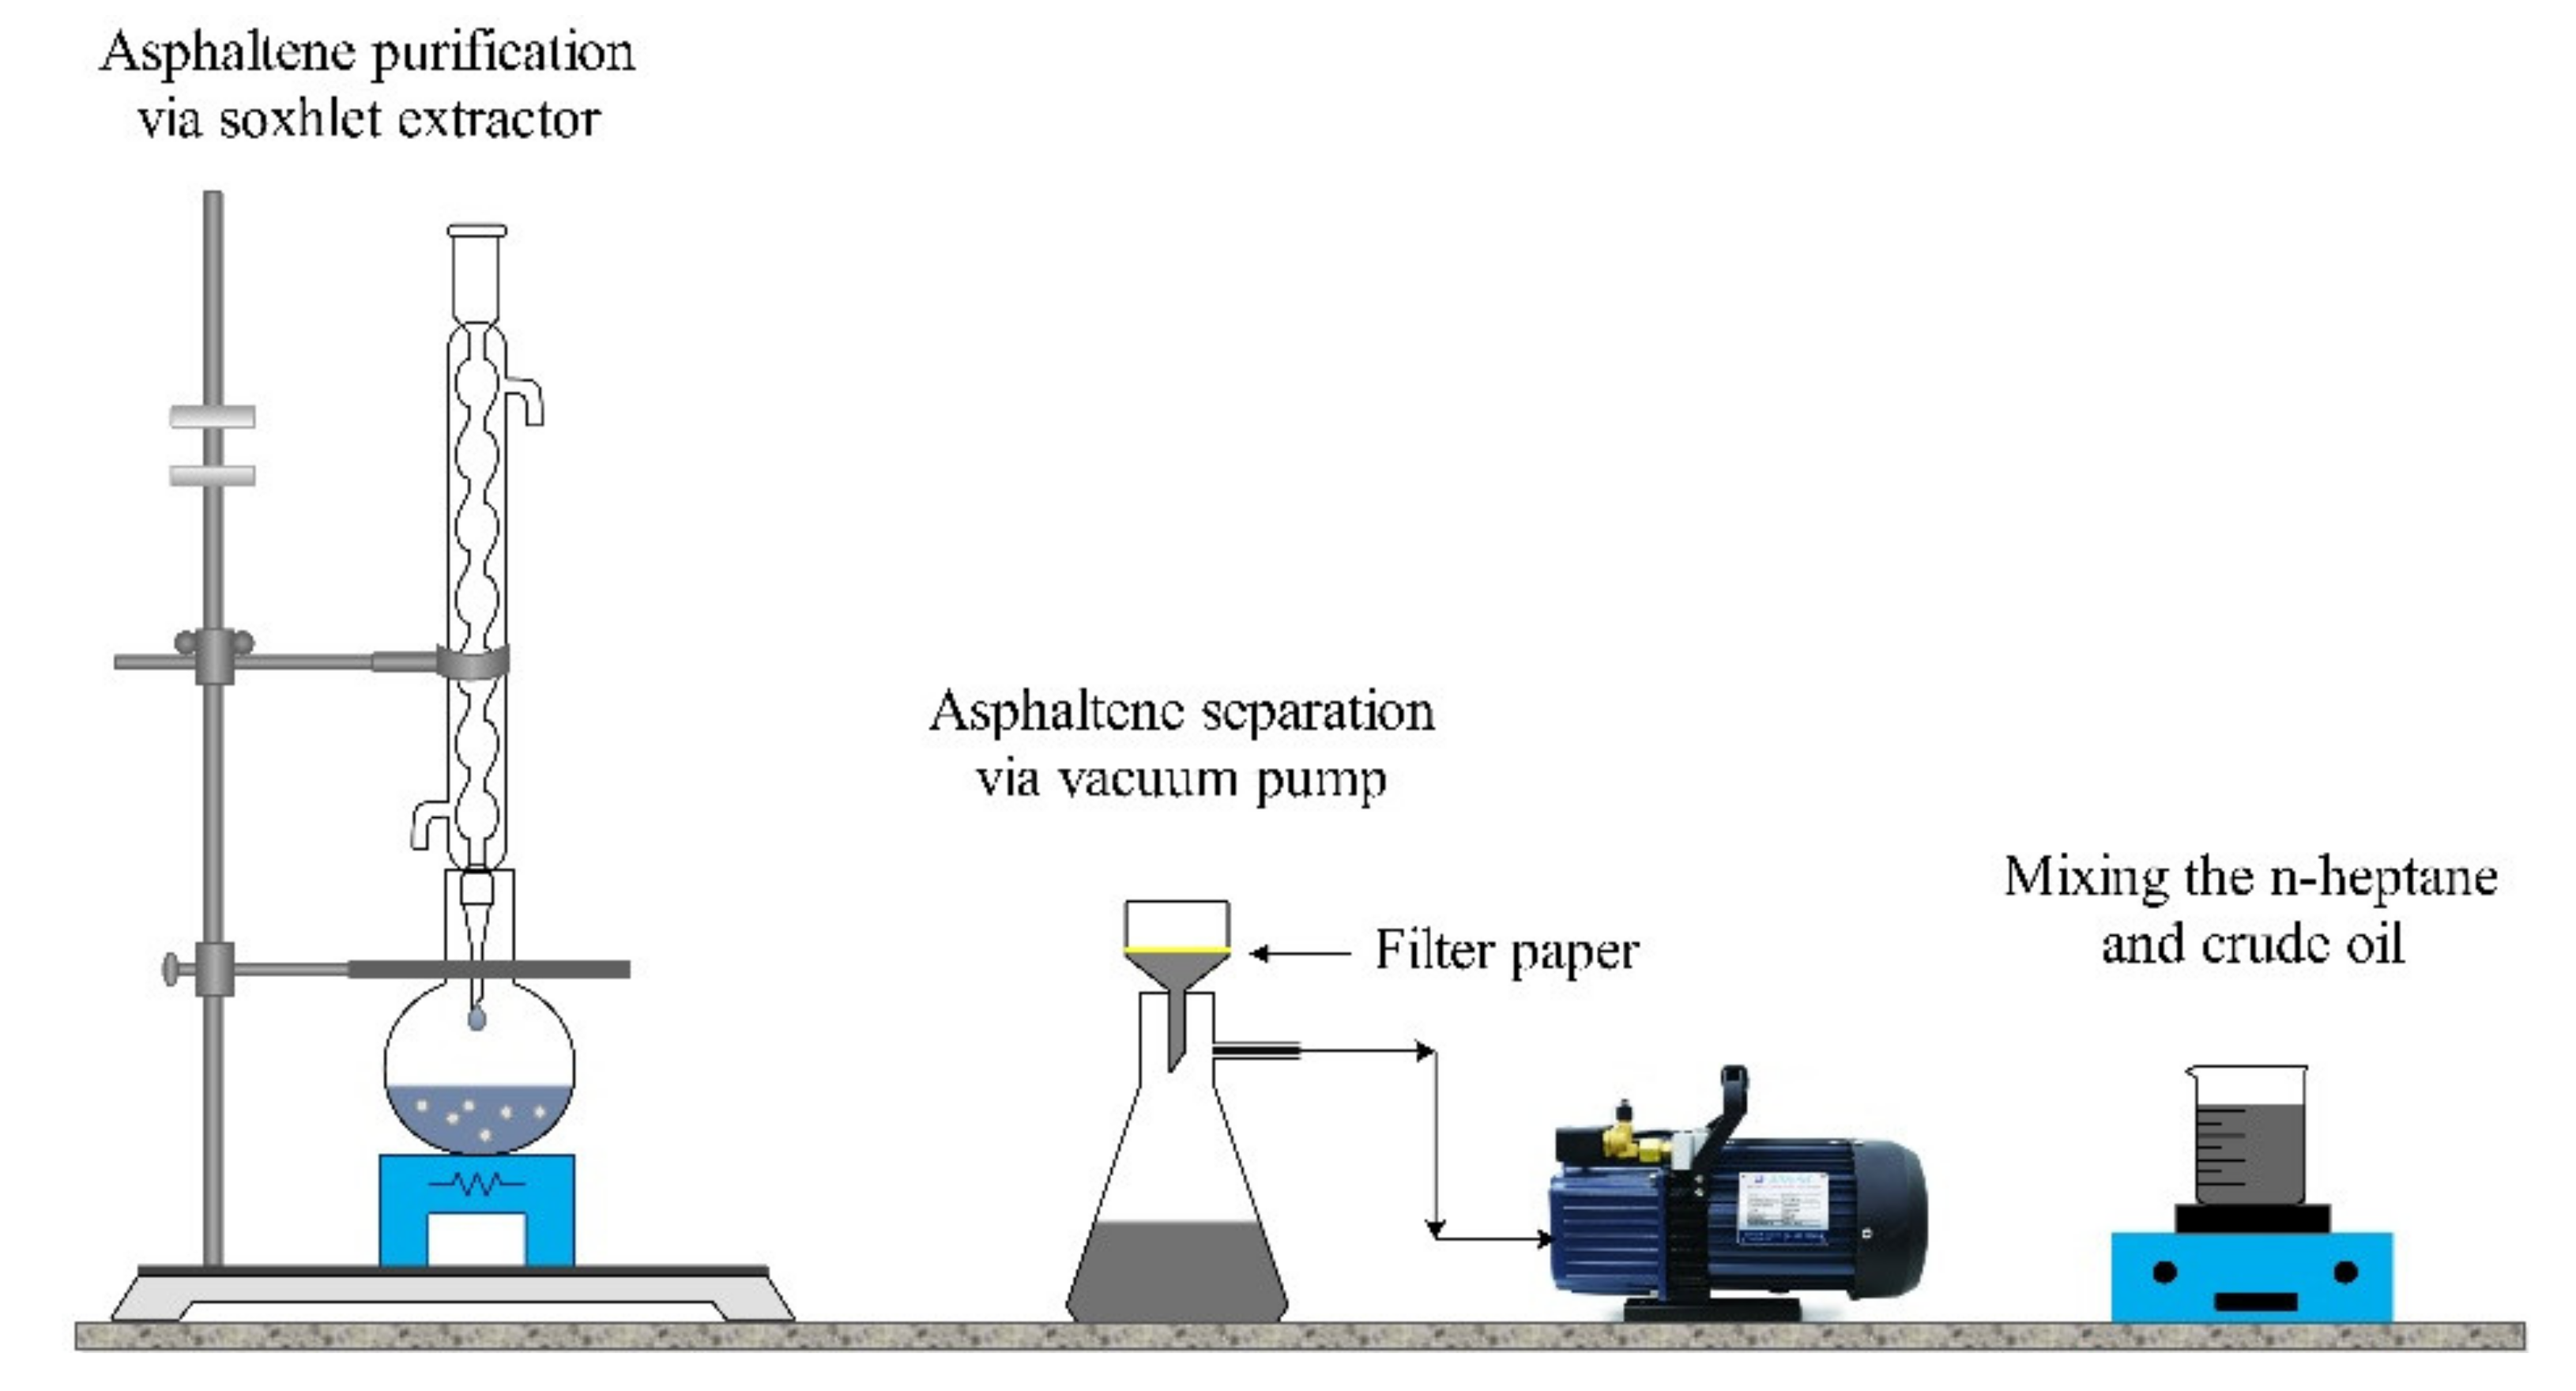
2.1.4. Crude Oil
2.1.5. Rock Samples
2.2. Experimental Procedures
2.2.1. Rock Typing
2.2.2. Zeta Potential Measurement
2.2.3. IFT Measurements
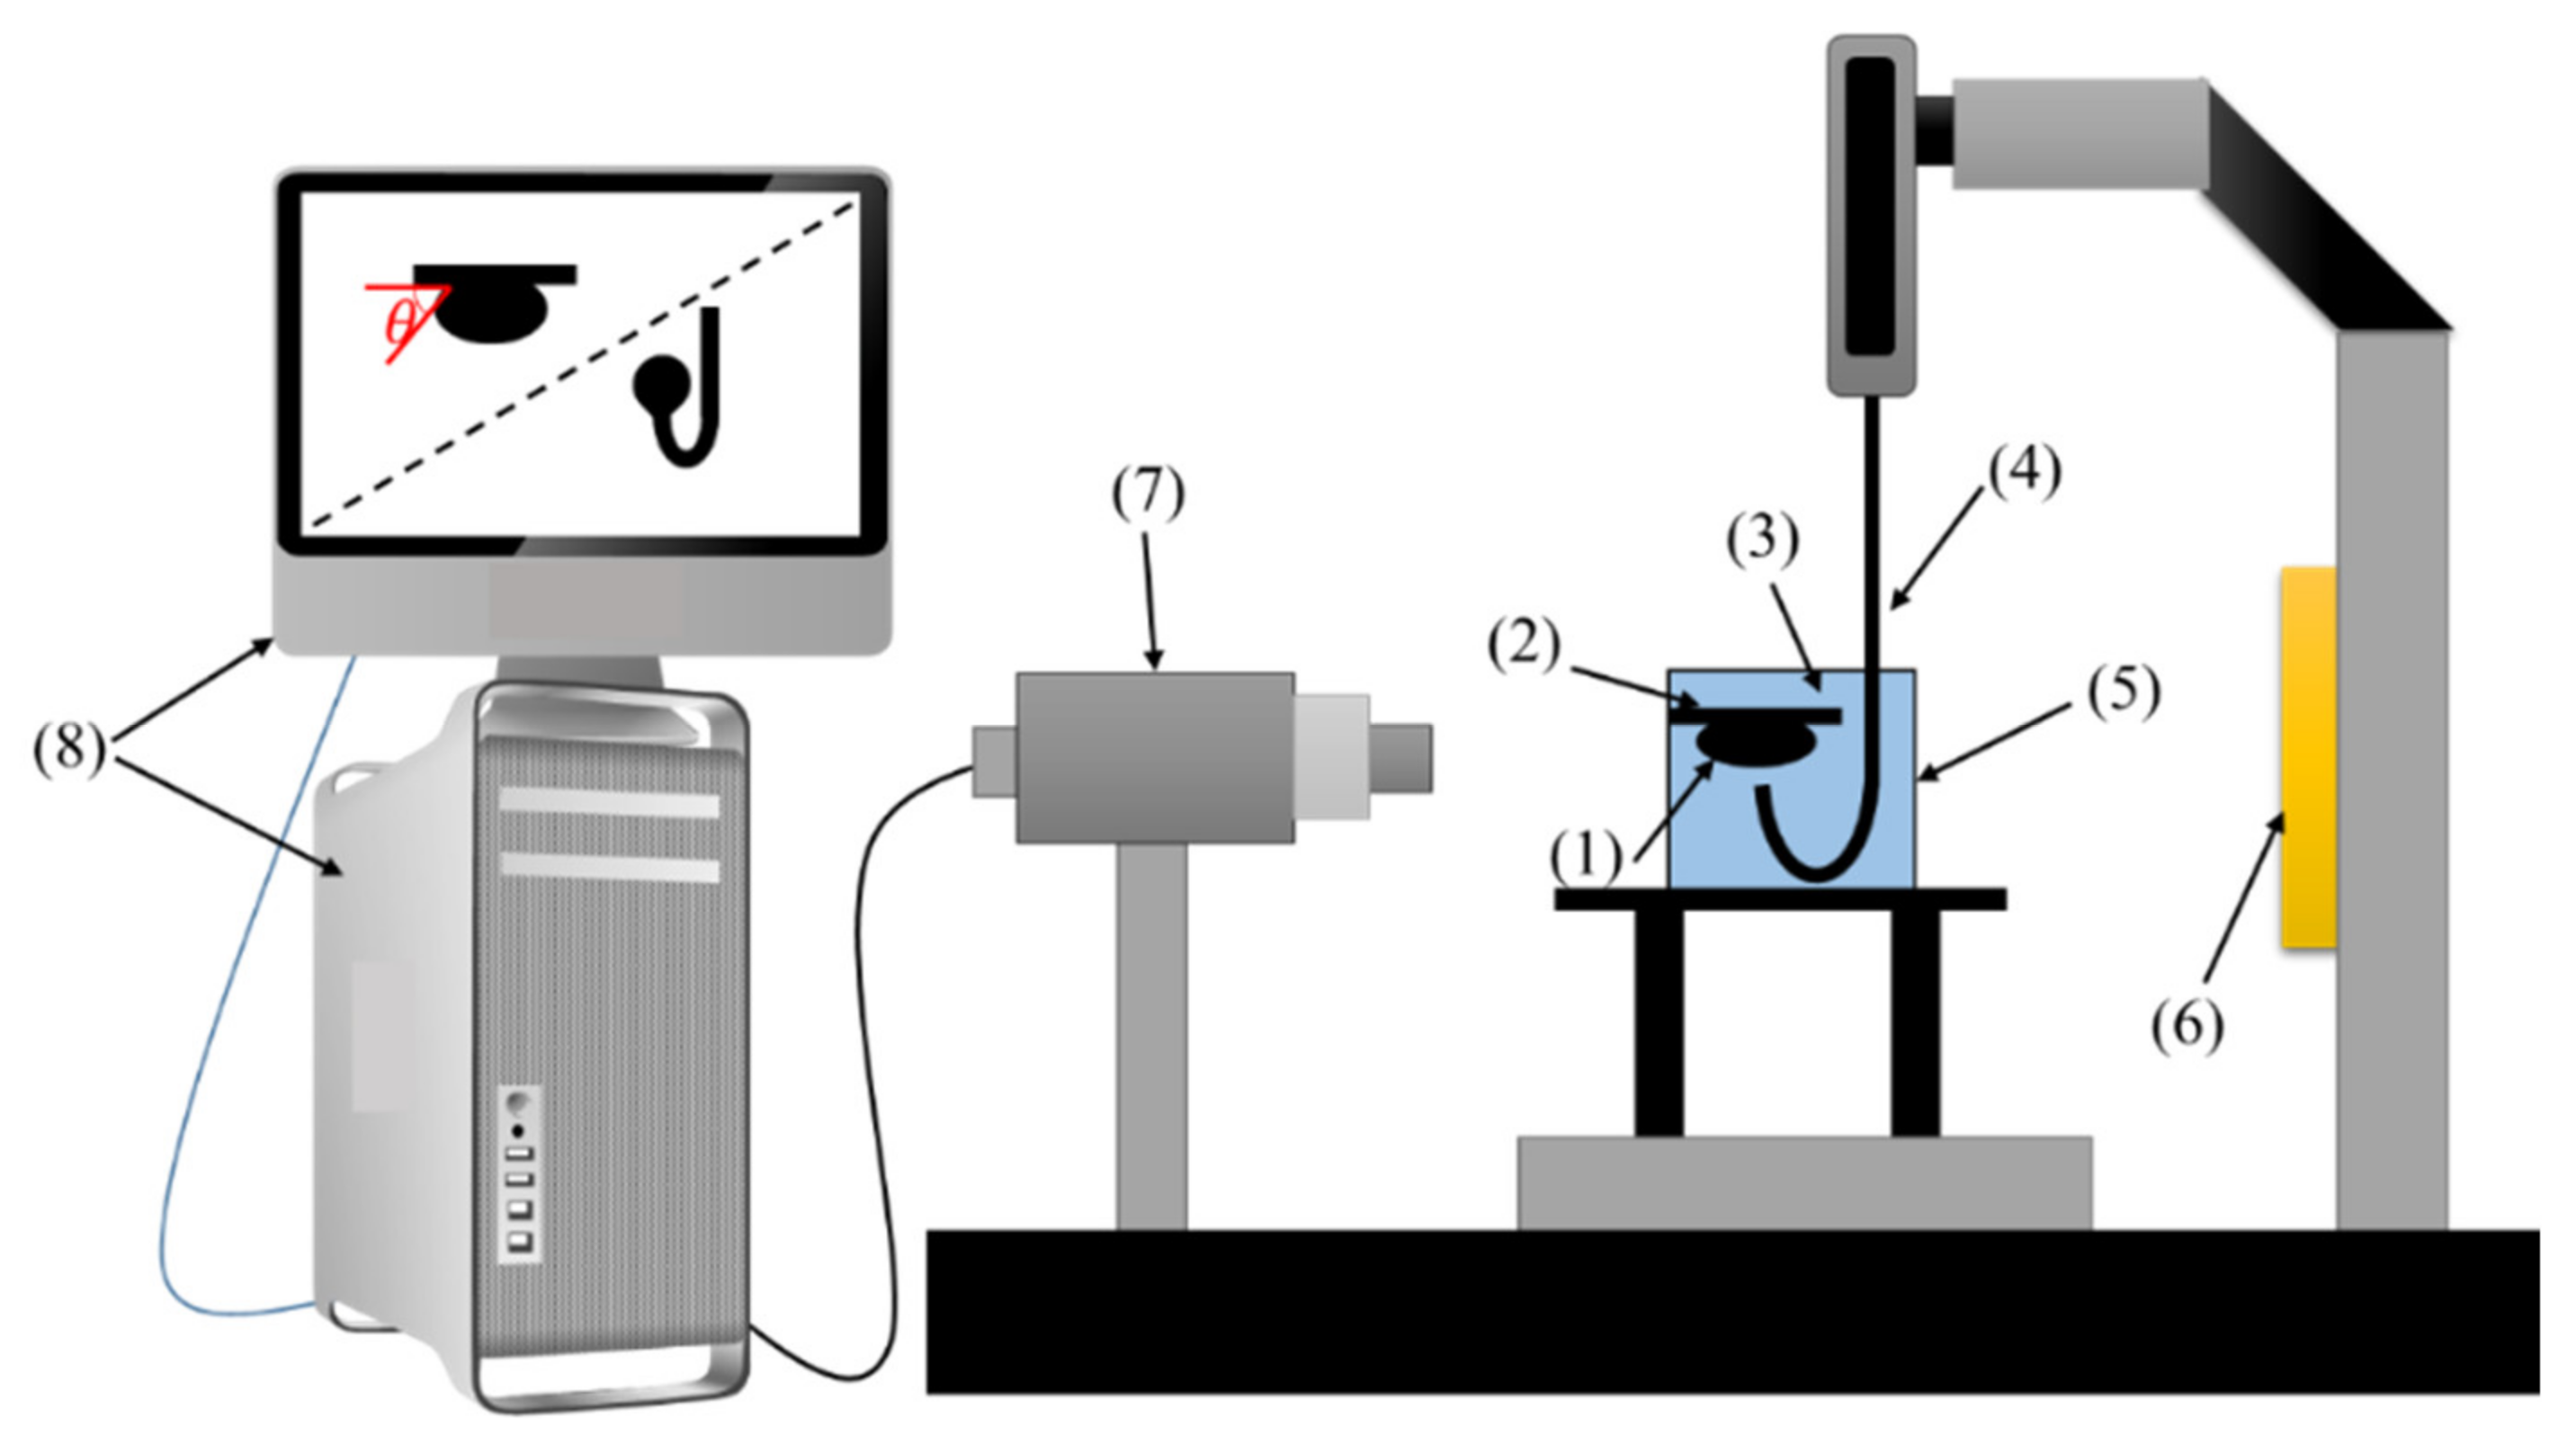
2.2.4. Contact Angle Measurements
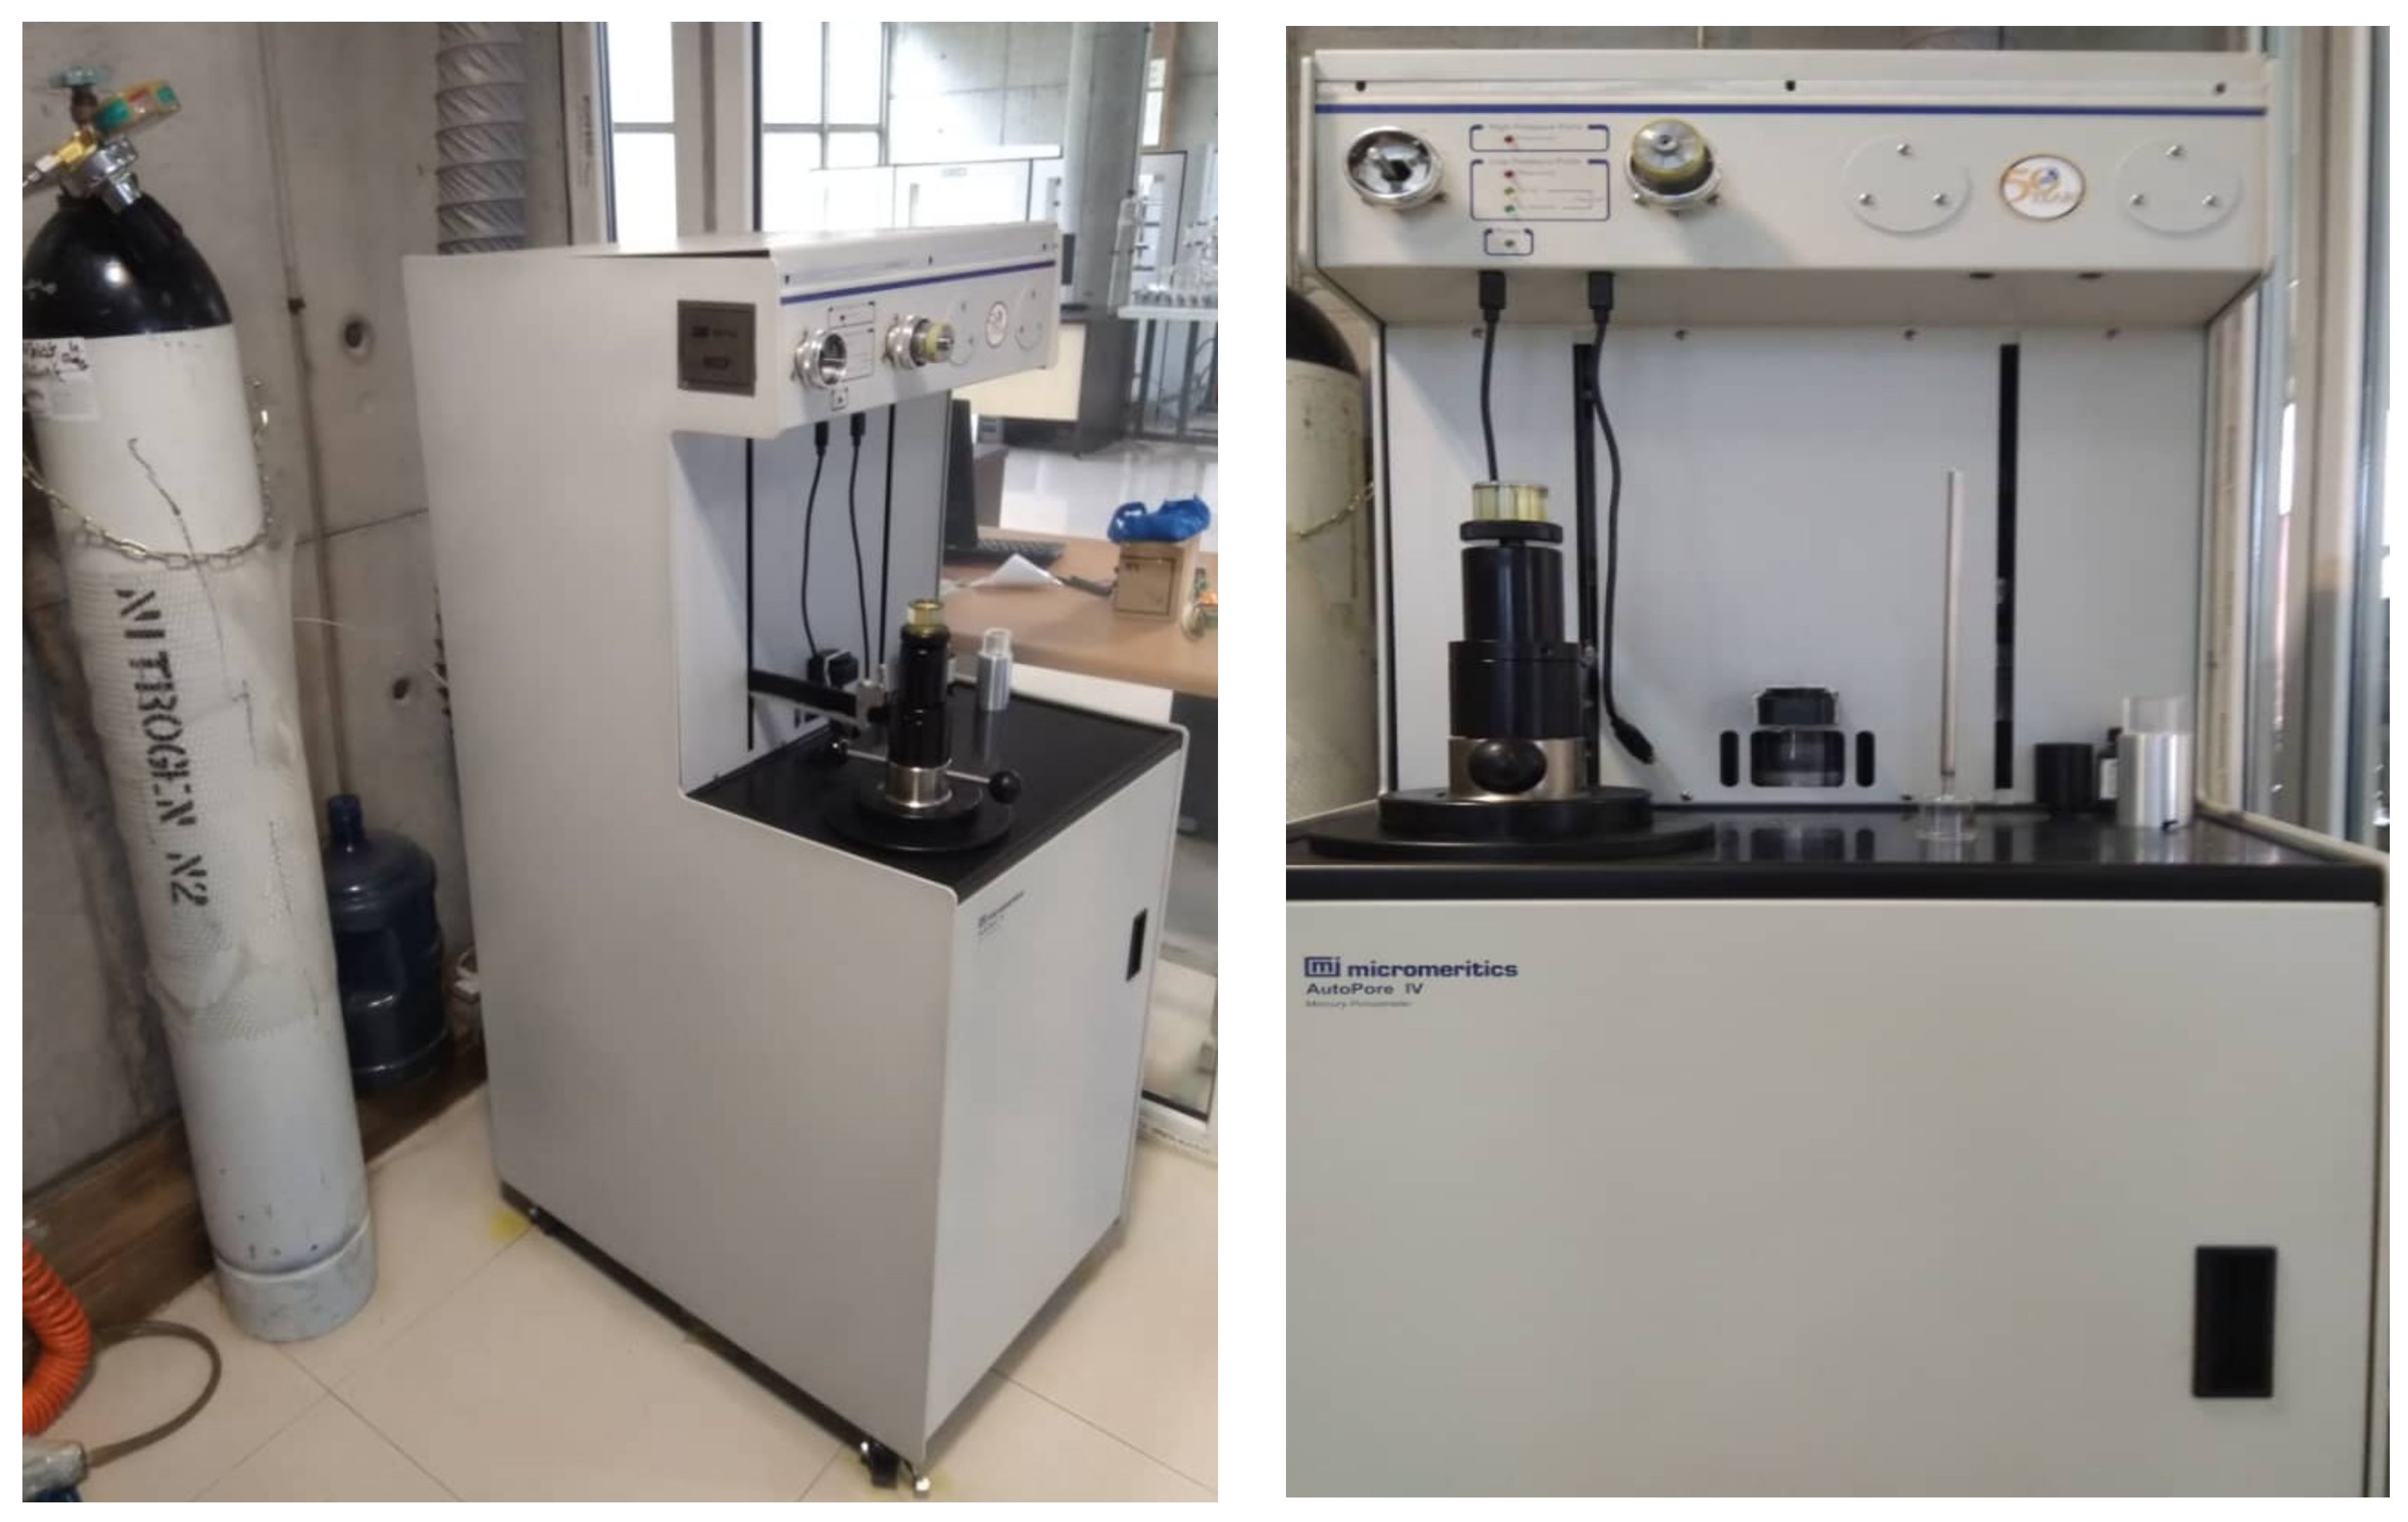
2.2.5. MICP Tests
- Weighting the cleaned and dried sample.
- Selecting a proper penetrometer according to the pore volume of the core cutting.
- Weighting the penetrometer containing the cutting.
- Loading the penetrometer to the low-pressure chamber.
- Measuring the bulk volume of the cutting.
- Increasing the pressure of mercury injection from 0.5 to 30.0 psig incrementally and monitoring the amount of mercury intrusion at each pressure step.
- Loading the sample into the high-pressure chamber.
- Injecting the mercury into the core cutting and raising the pressure (up to 60000 psia) incrementally.
- After equilibrium is established in the last step, the injection pressure is reduced to atmospheric pressure.
- Mercury saturations are calculated as a percentage of the pore volume at each pressure, and the pore volume used for calculation of mercury saturation obtained from the maximum intrusion volume.
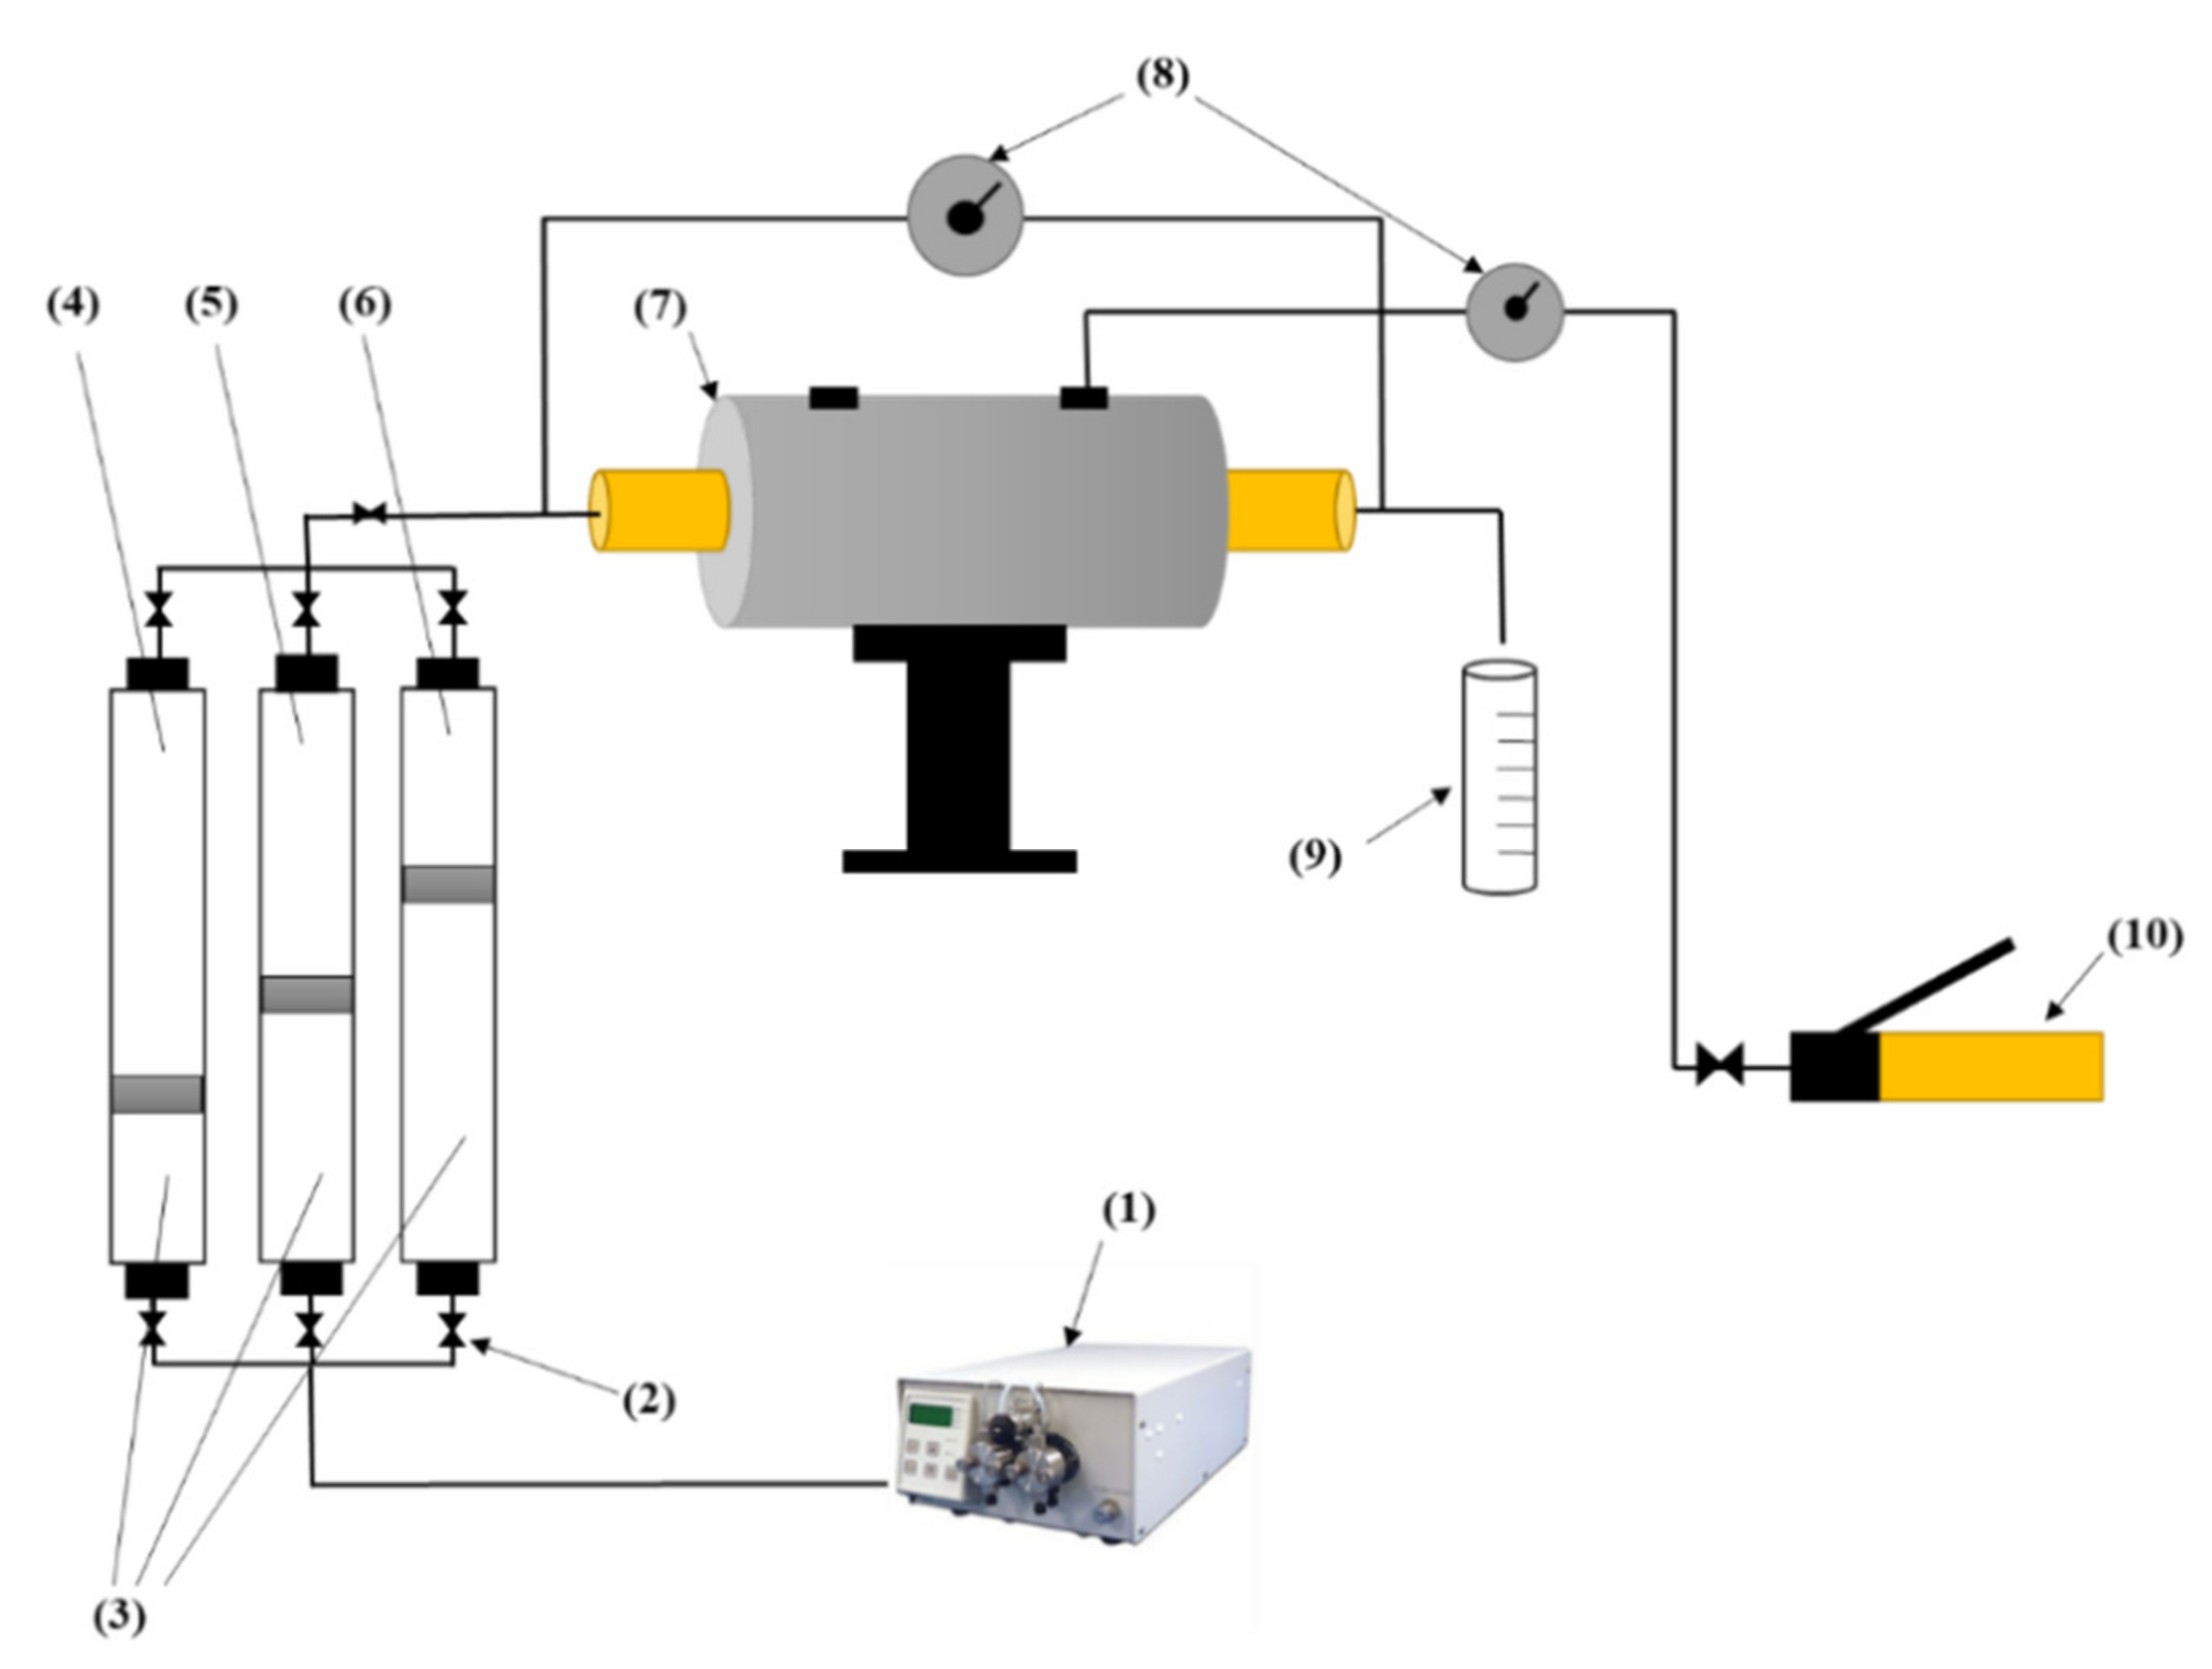
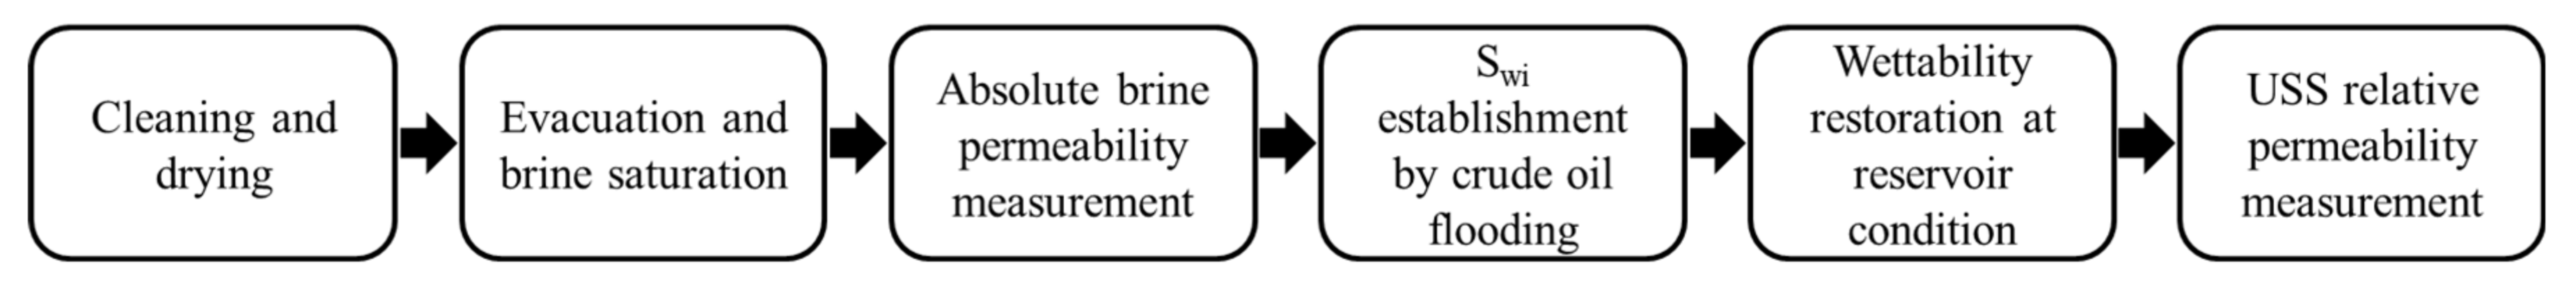
2.2.6. Core Flood Experiments
3. Results and Discussion
3.1. Core Sample Selection
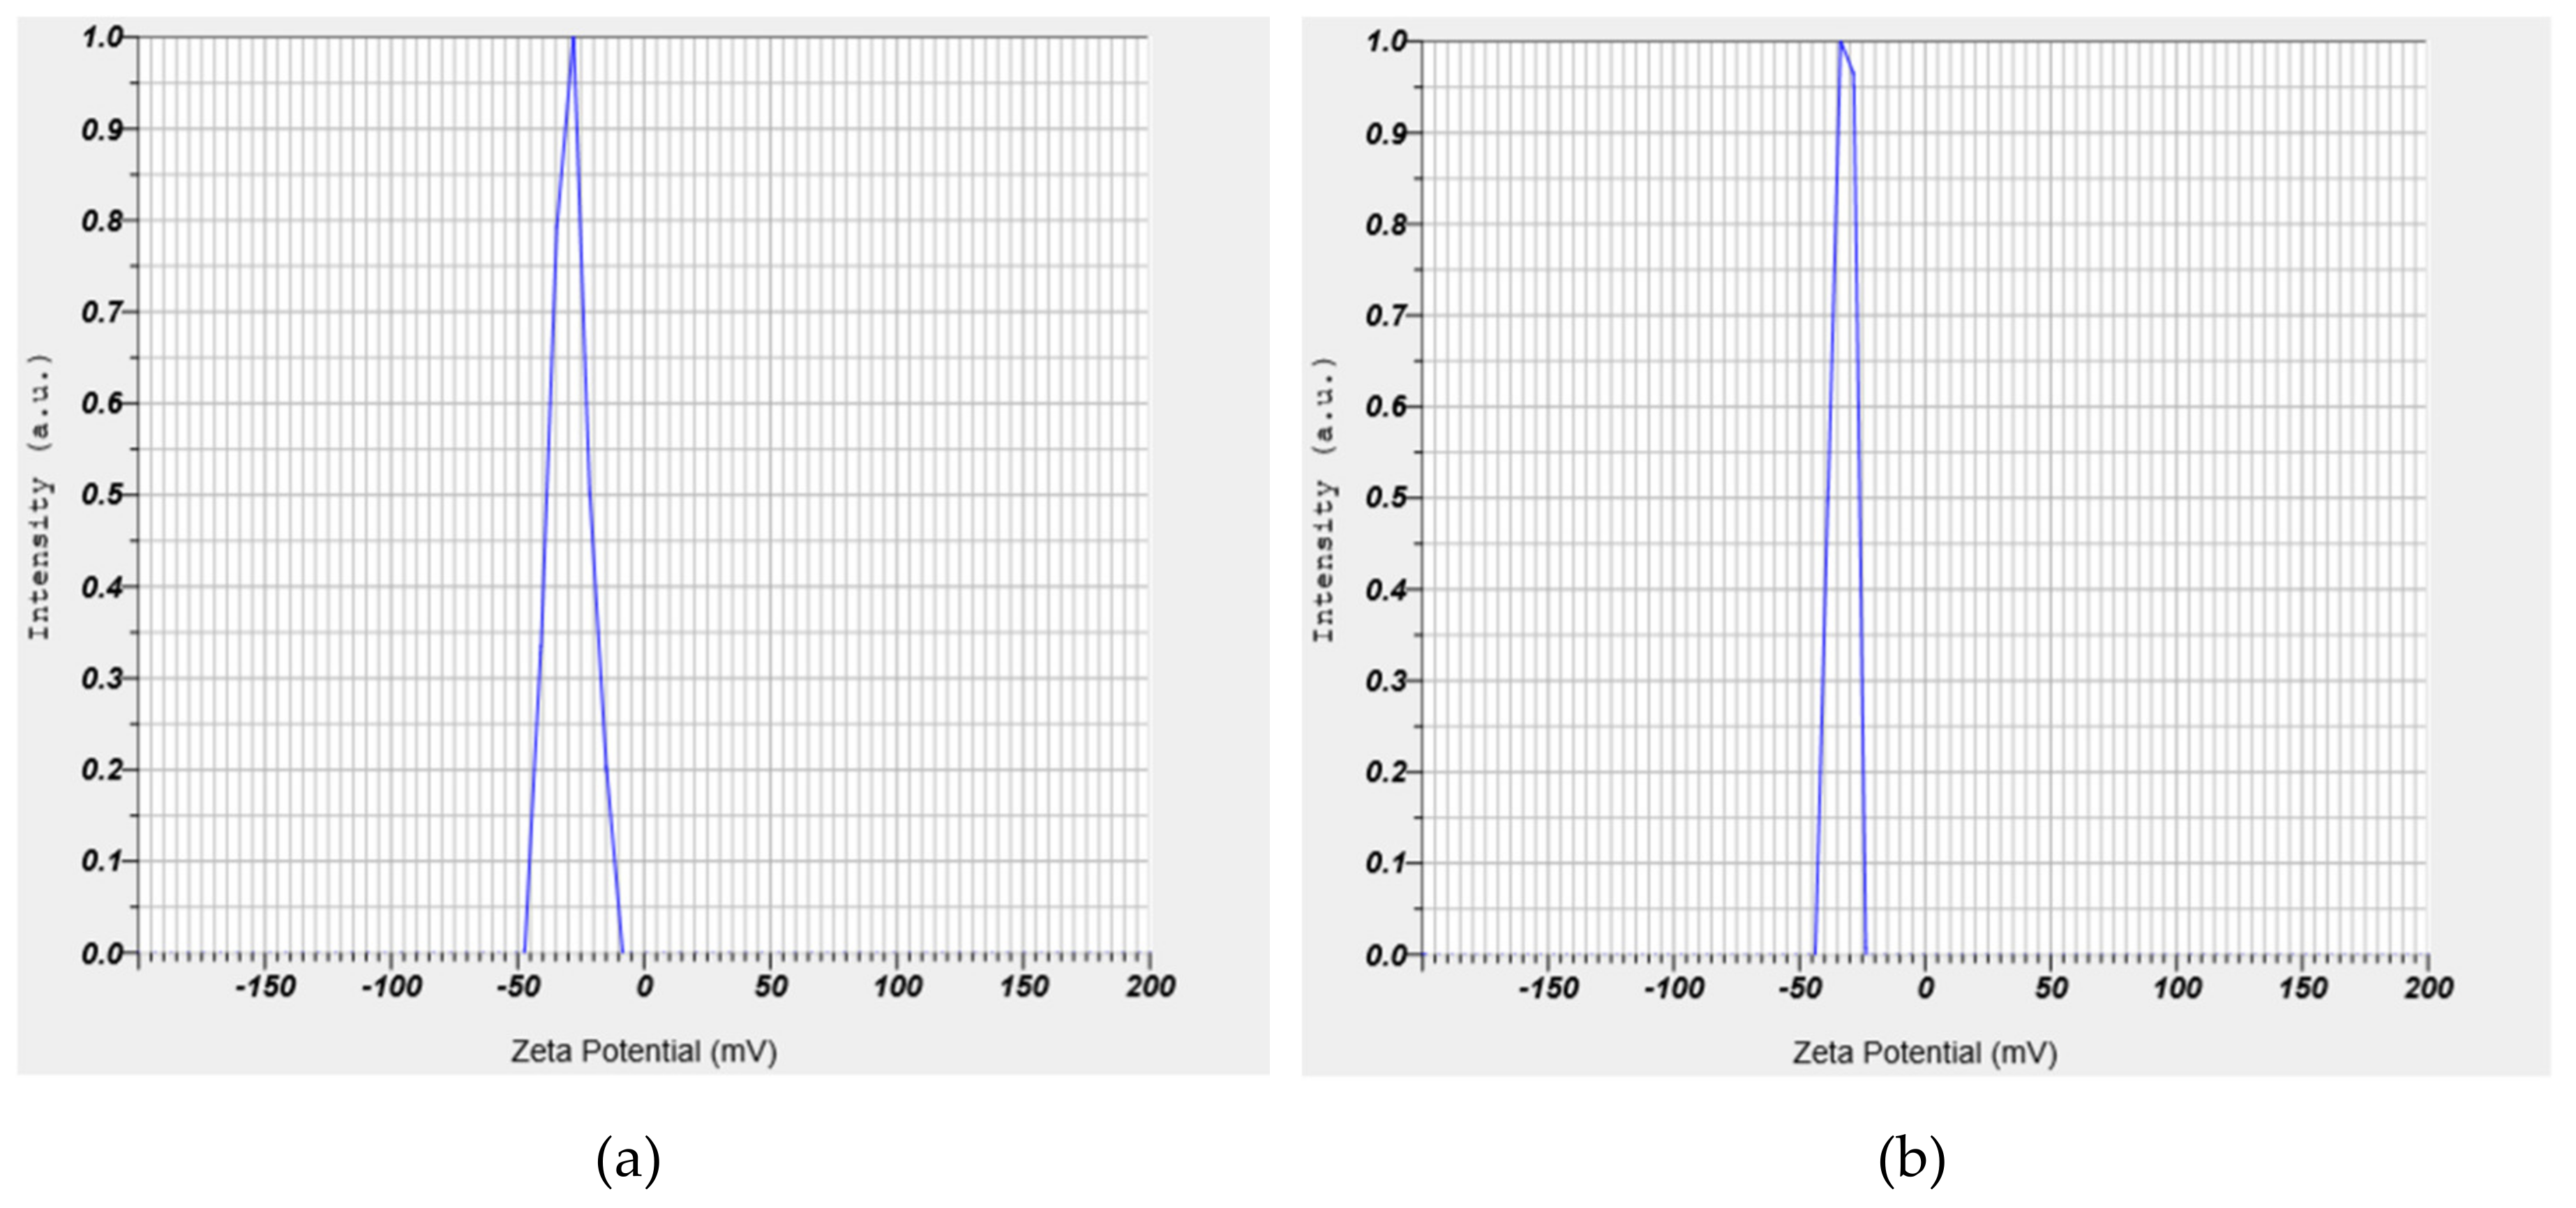
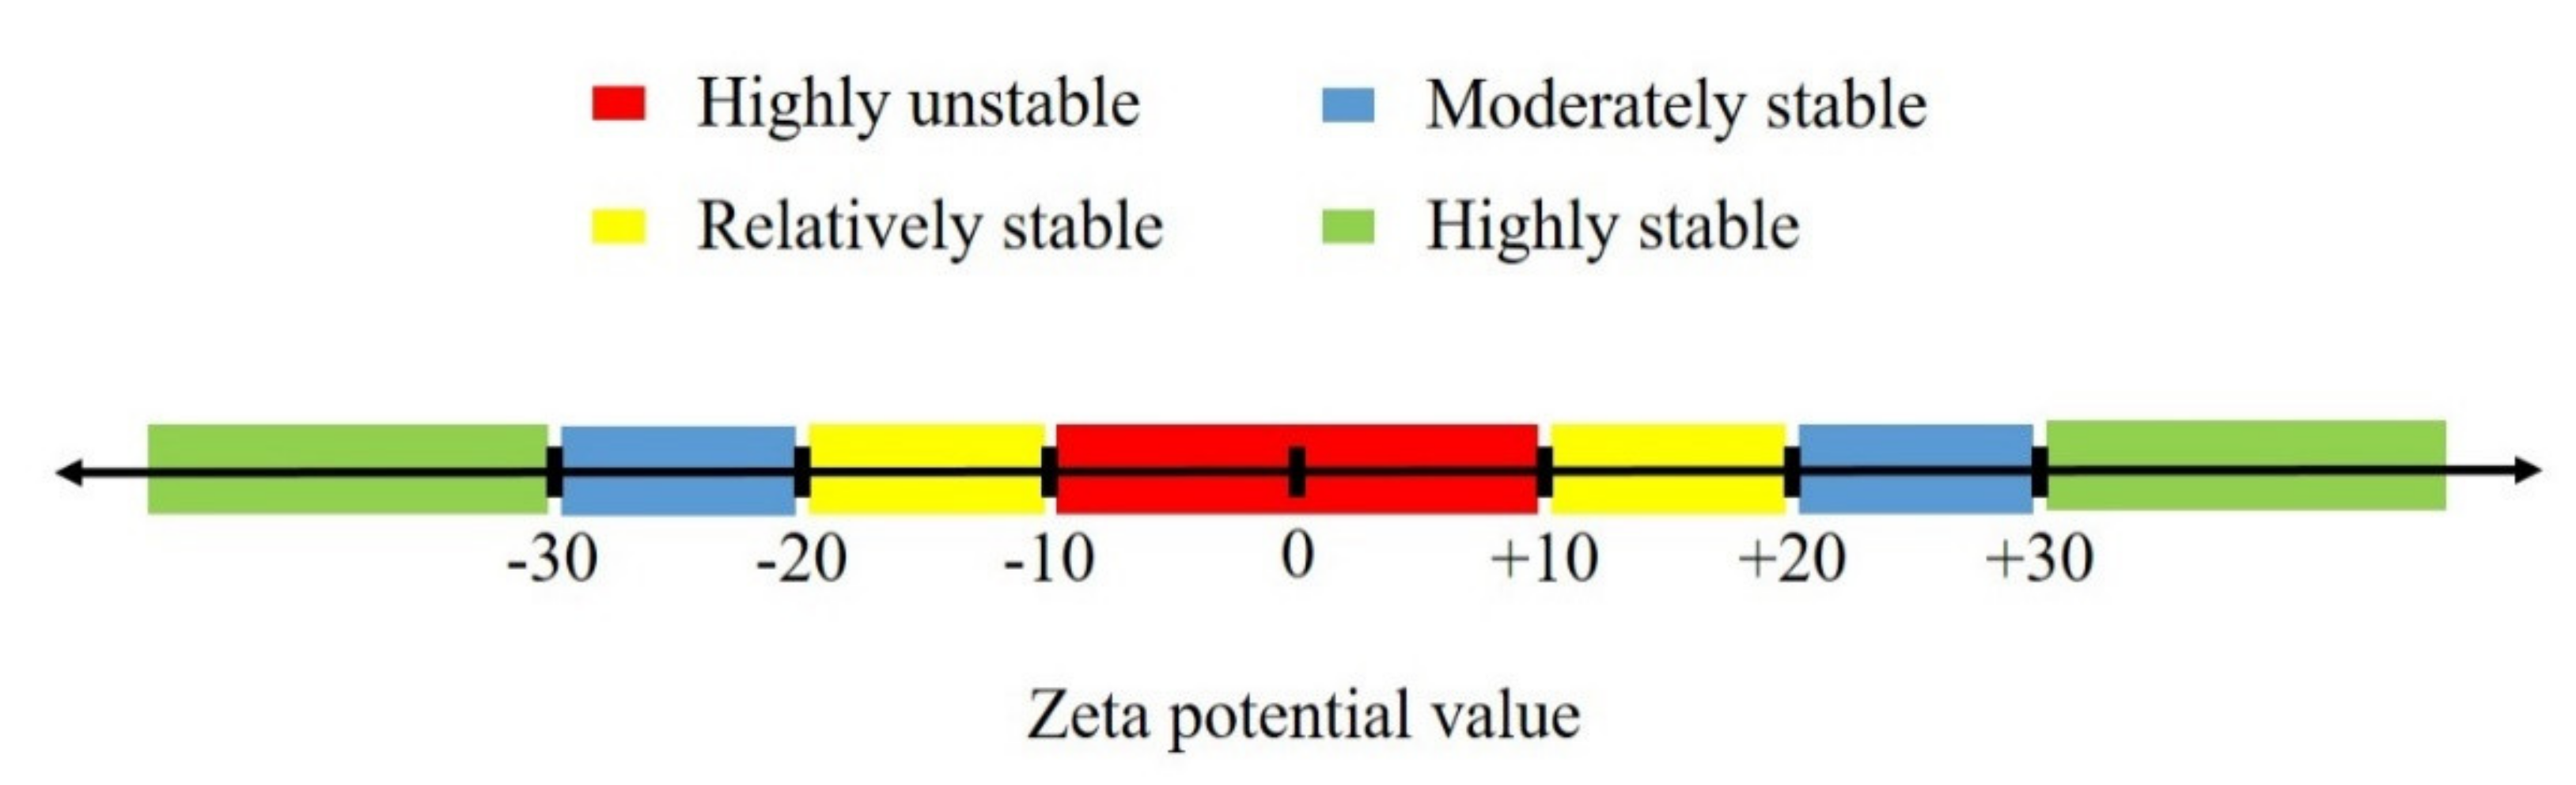
3.2. Static Stability of the Solution
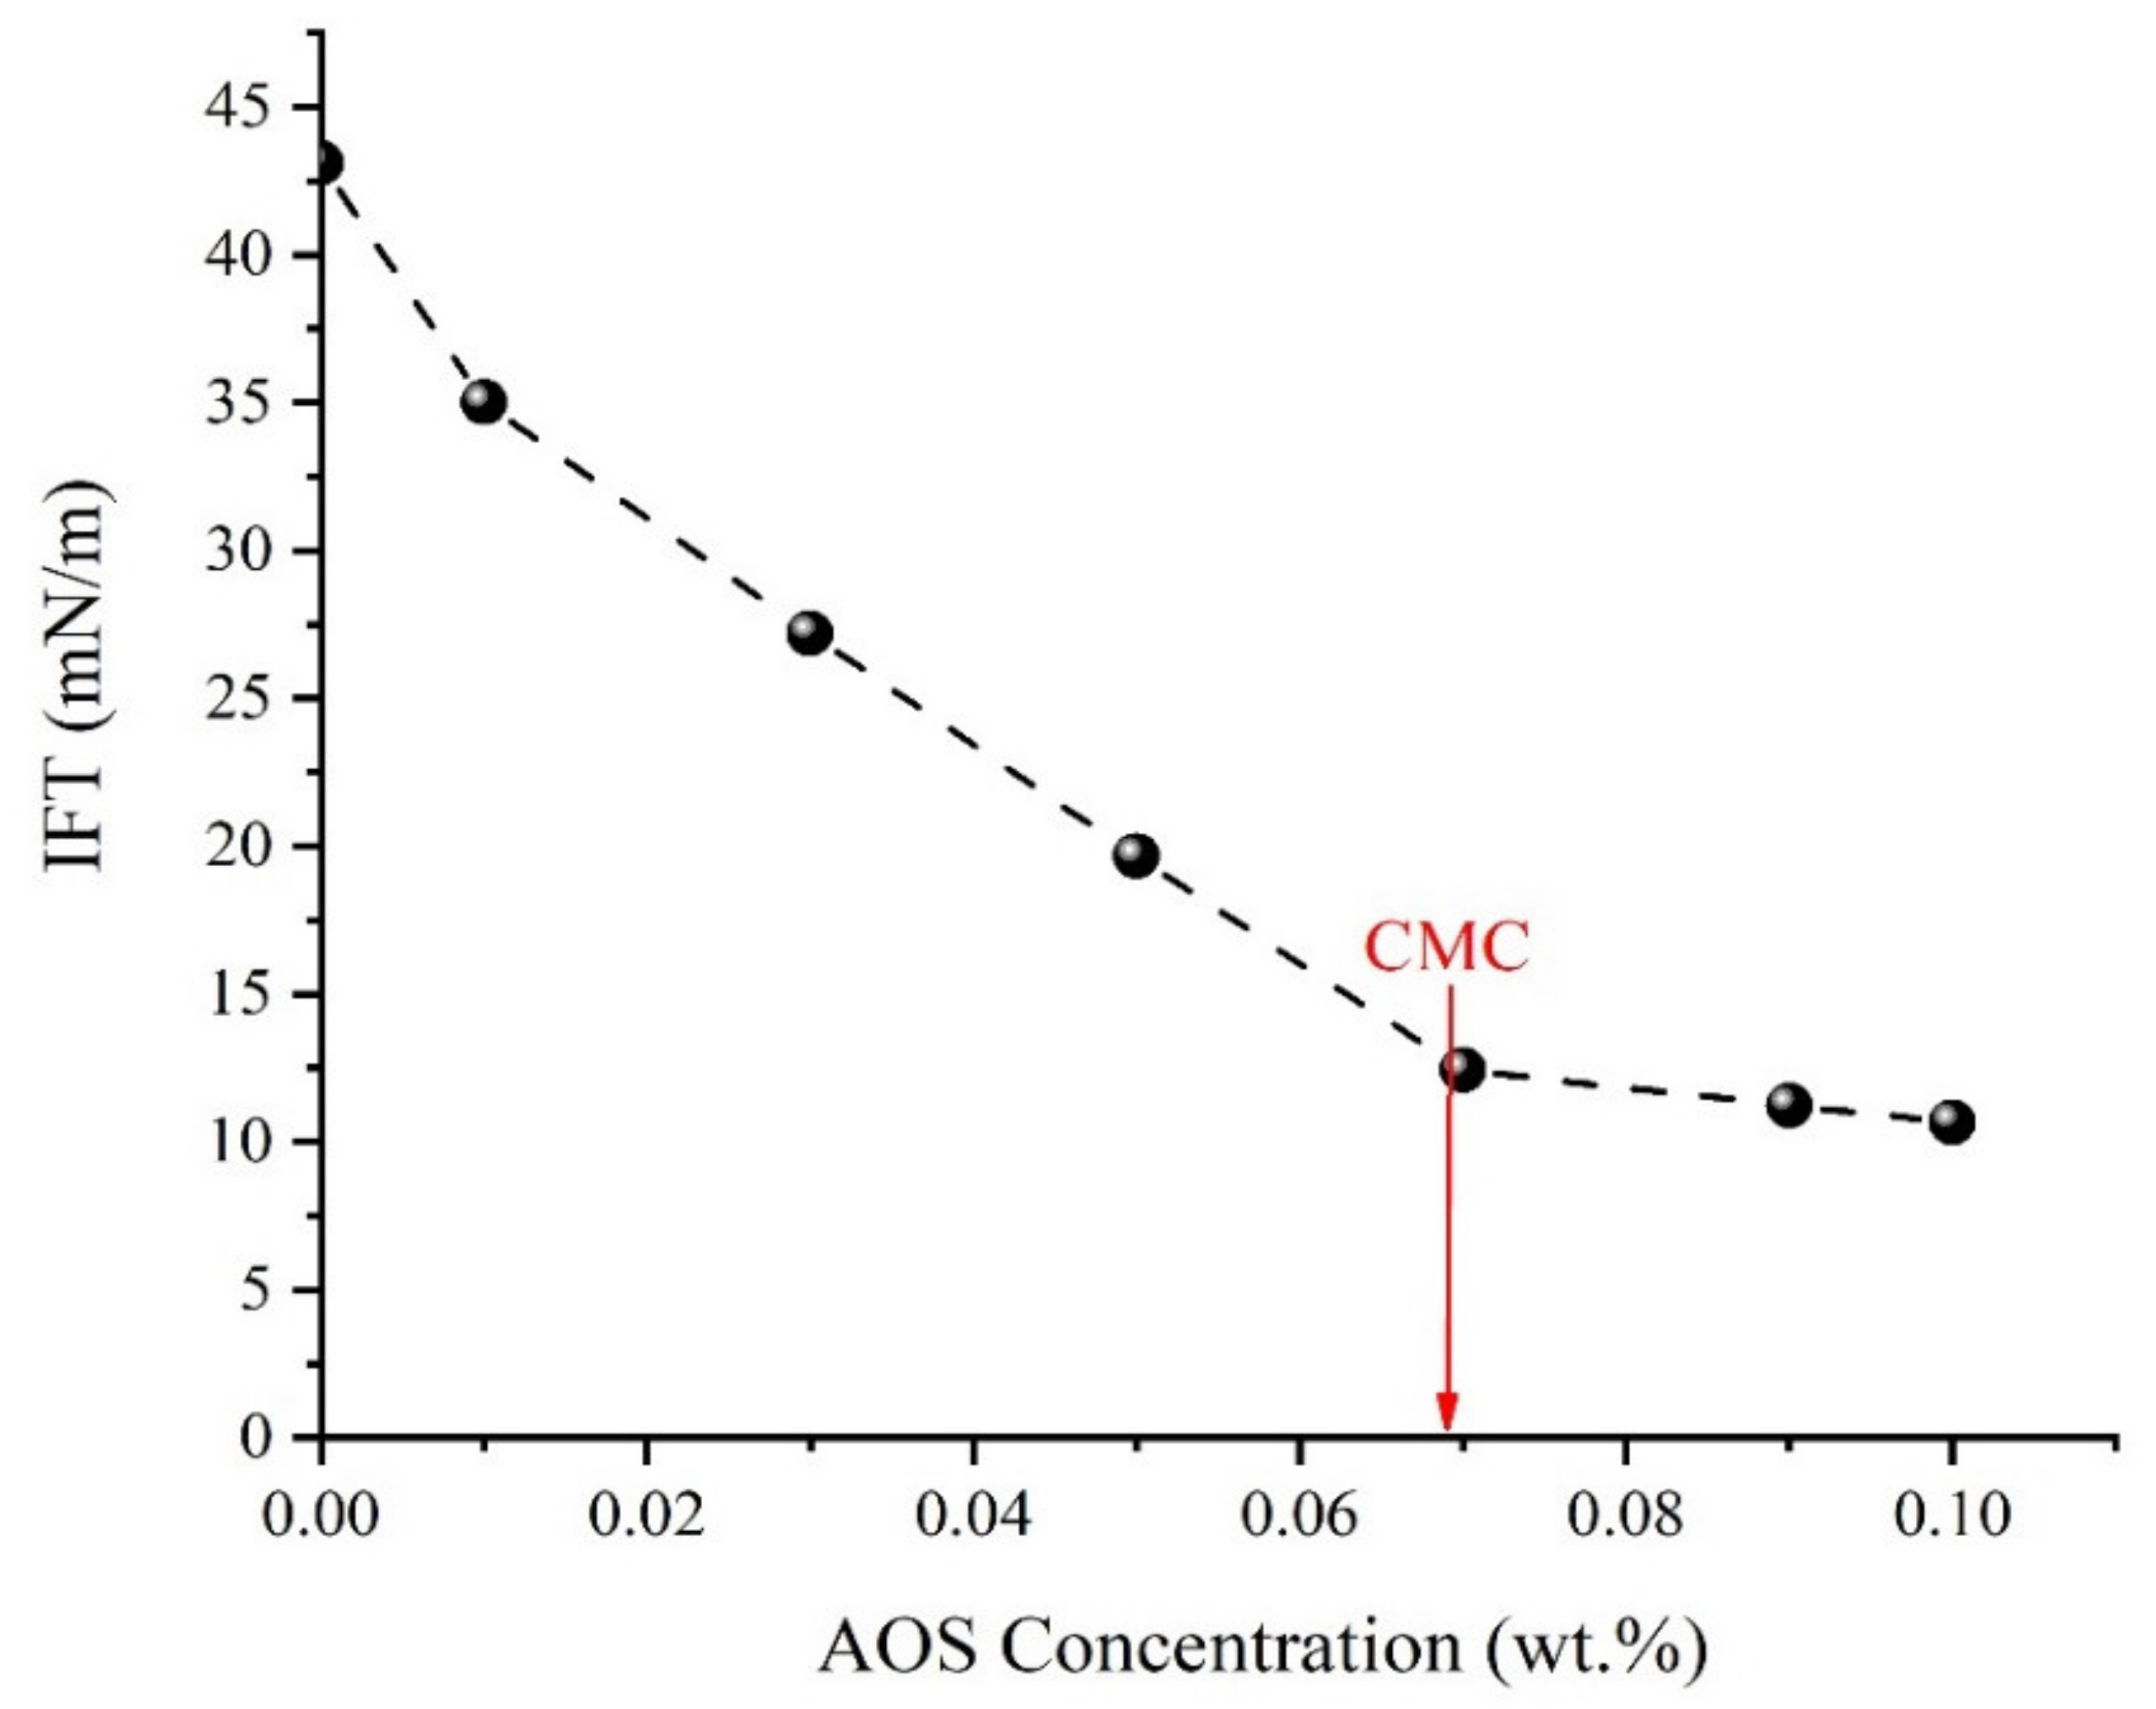
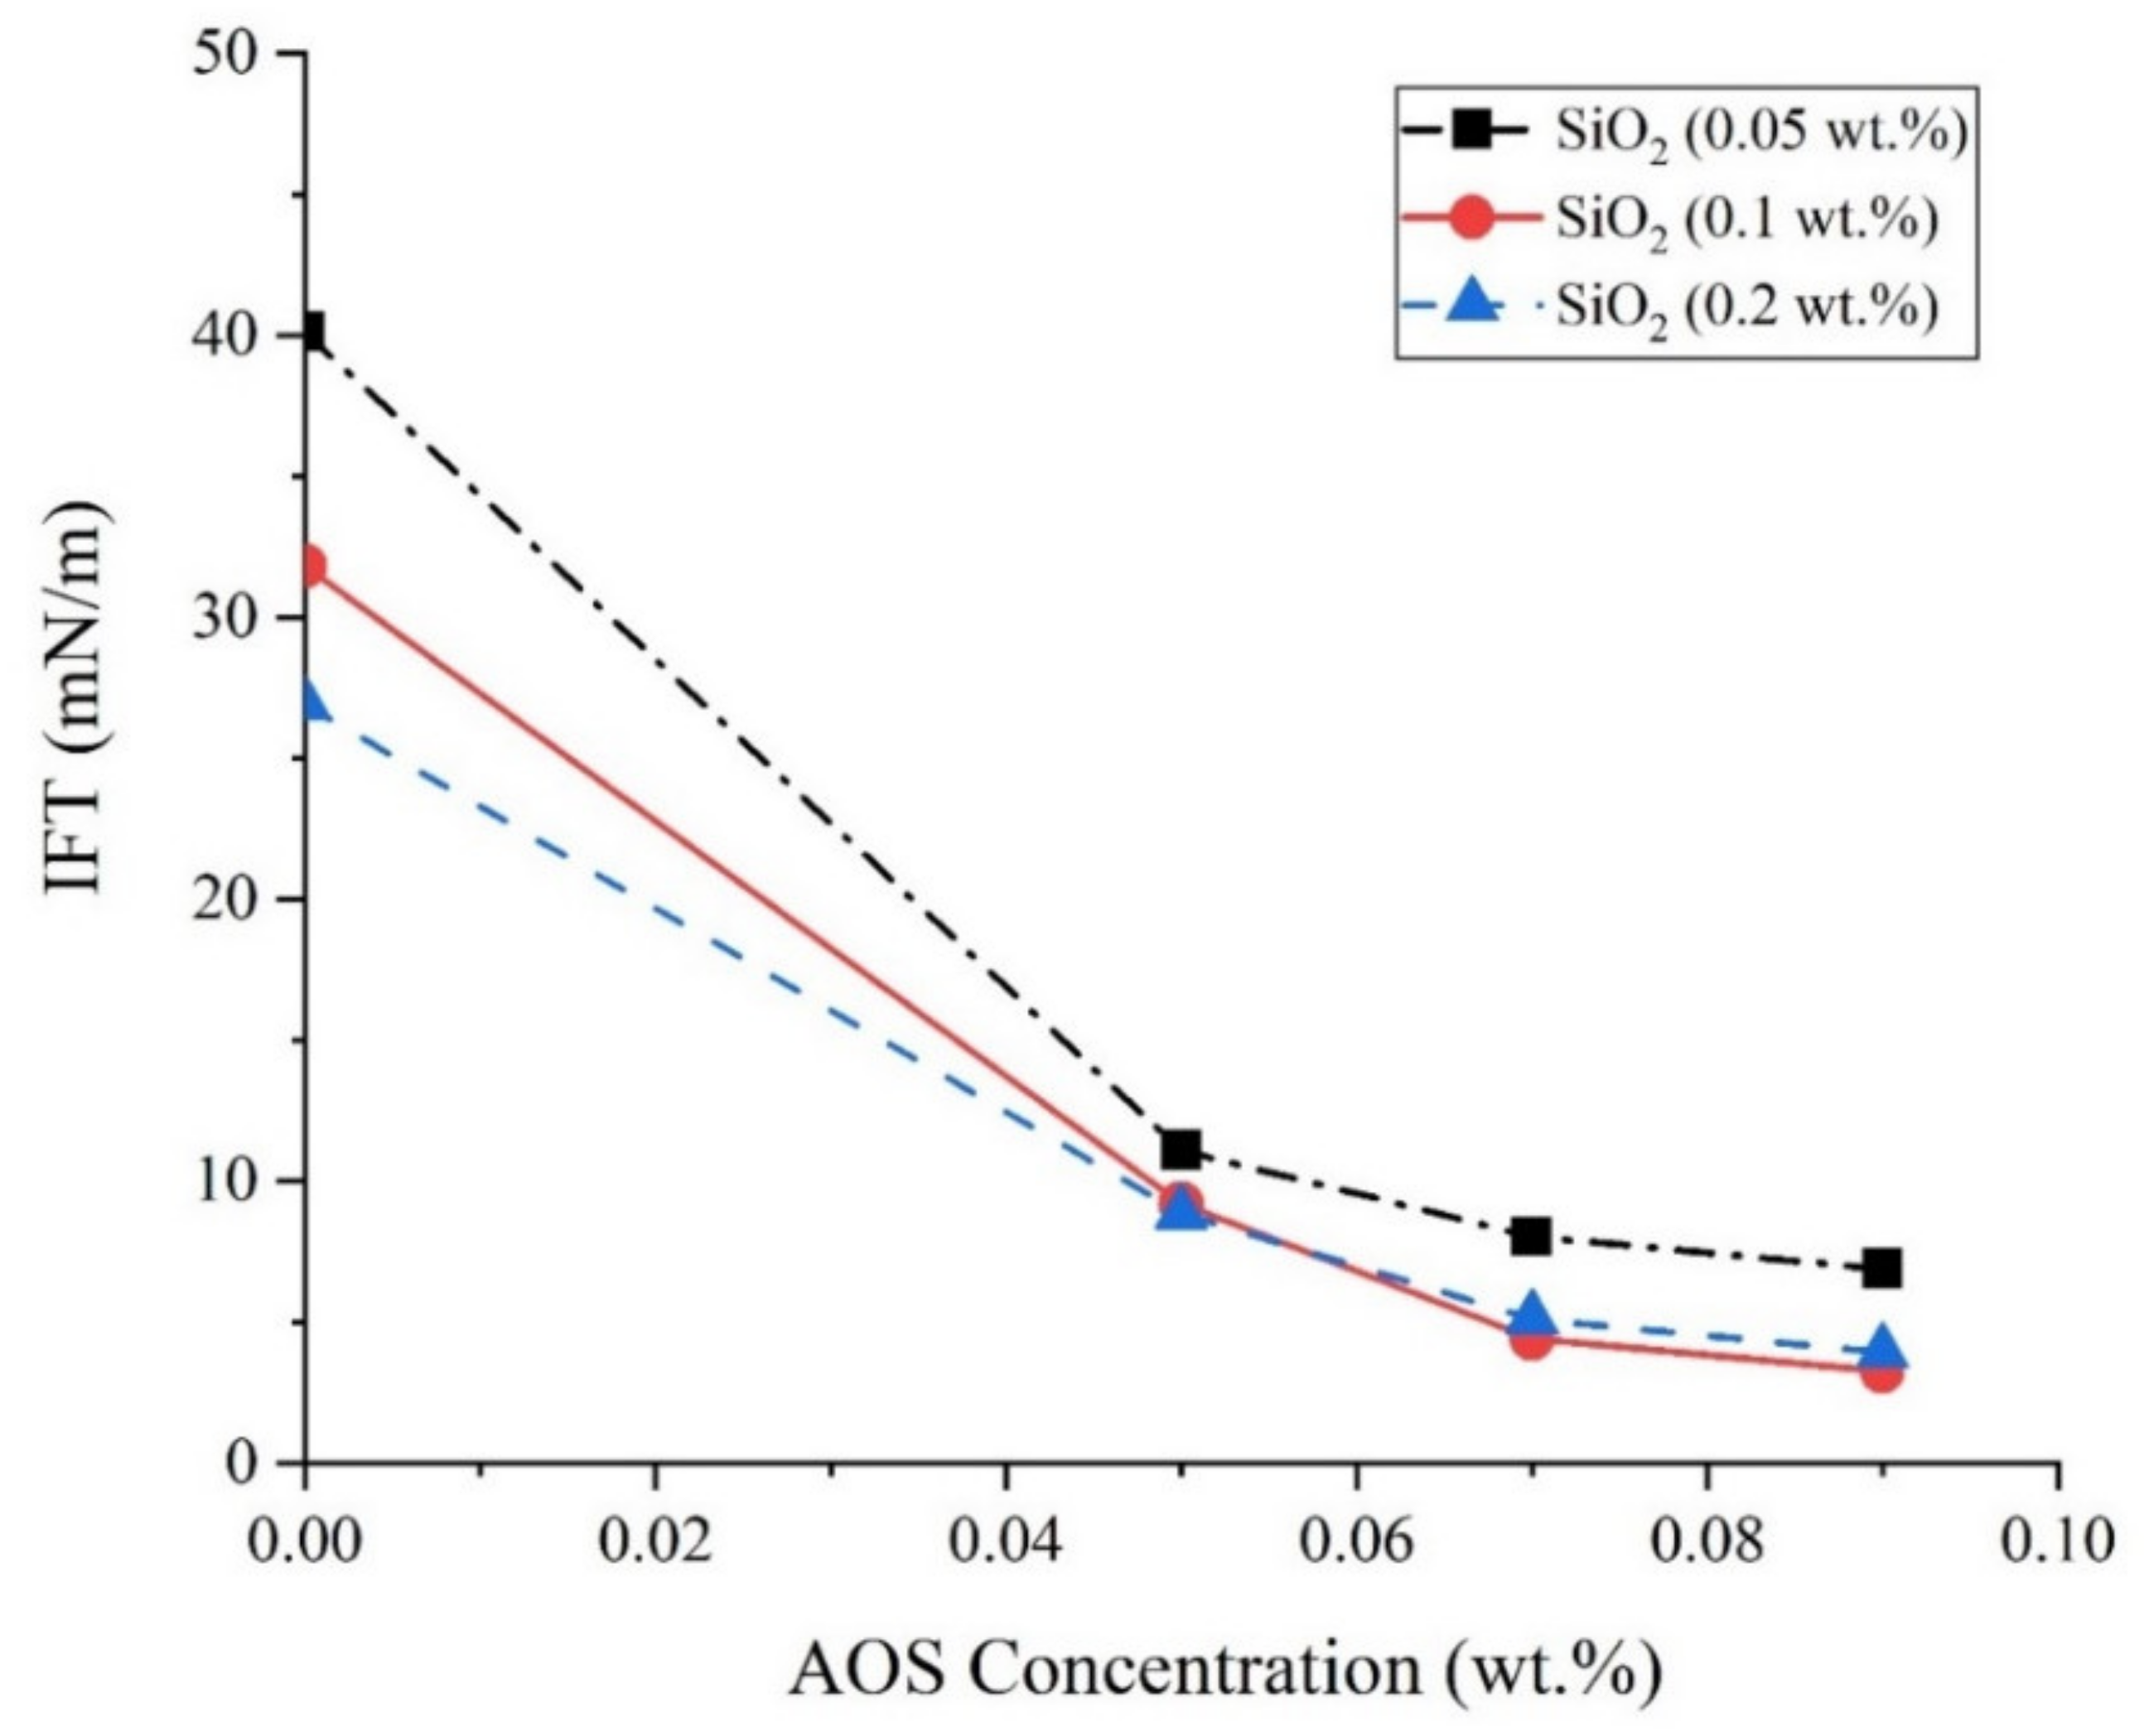
3.3. IFT between the Crude Oil and Aqueous Solutions
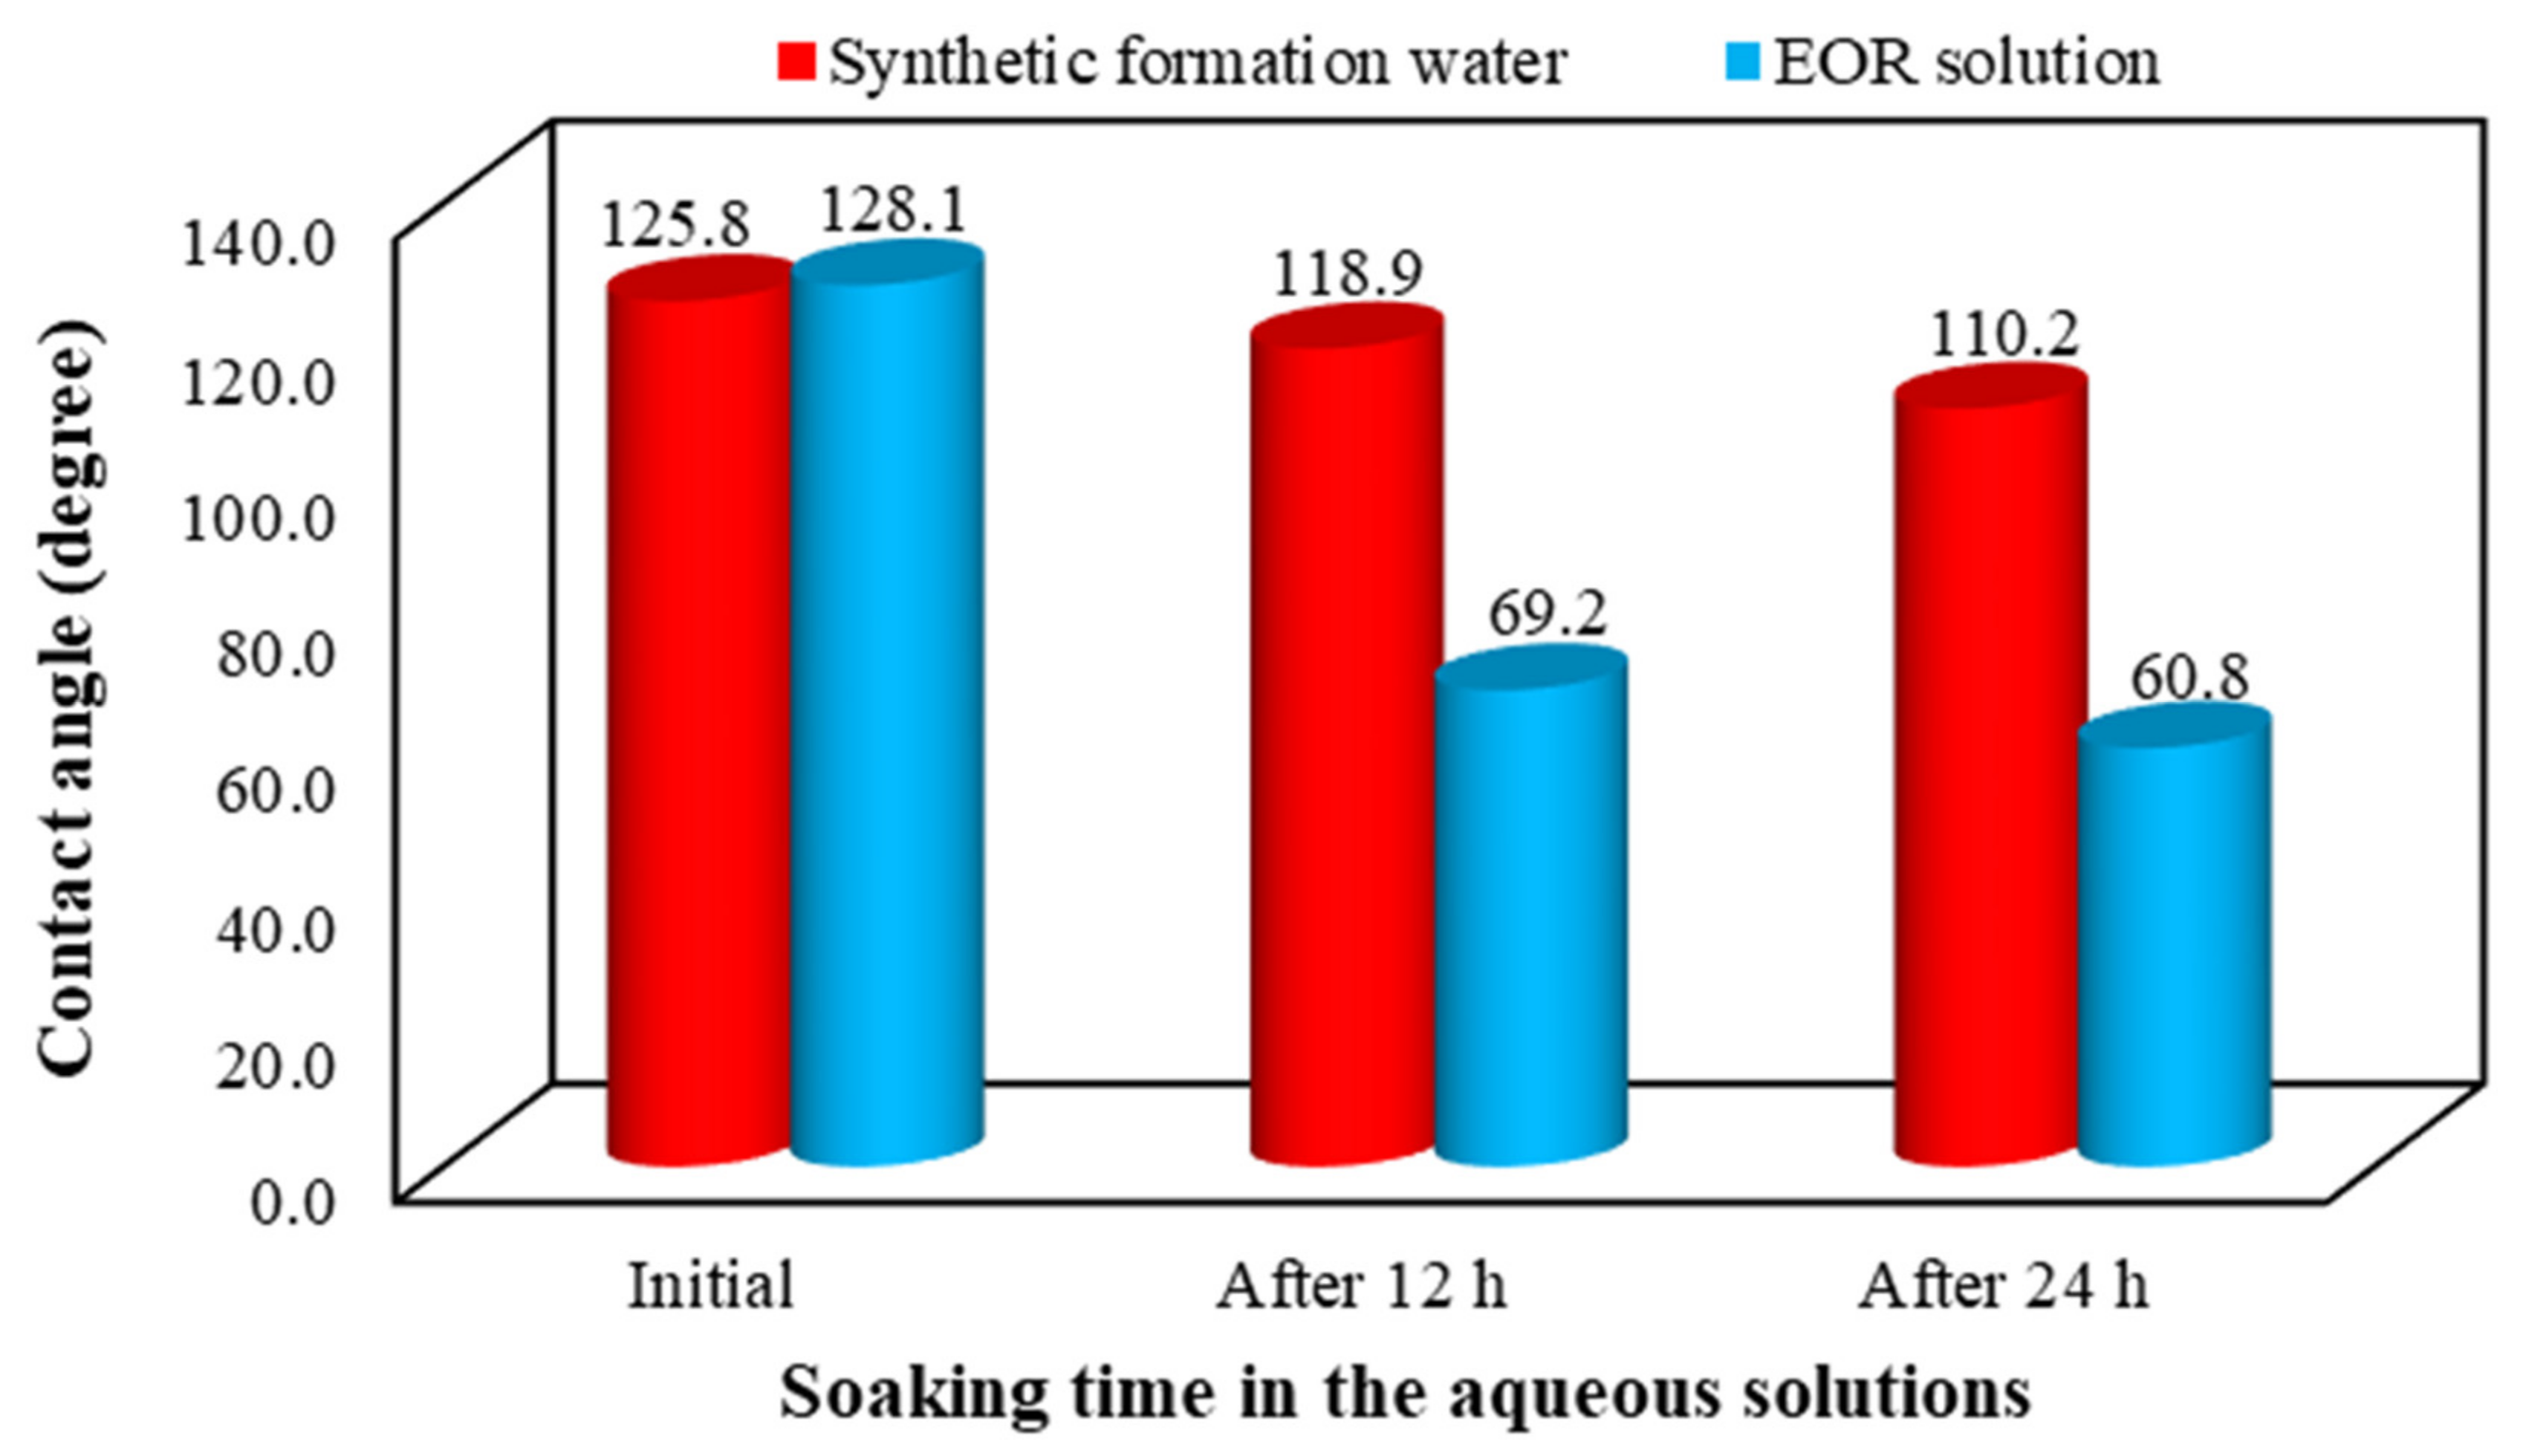
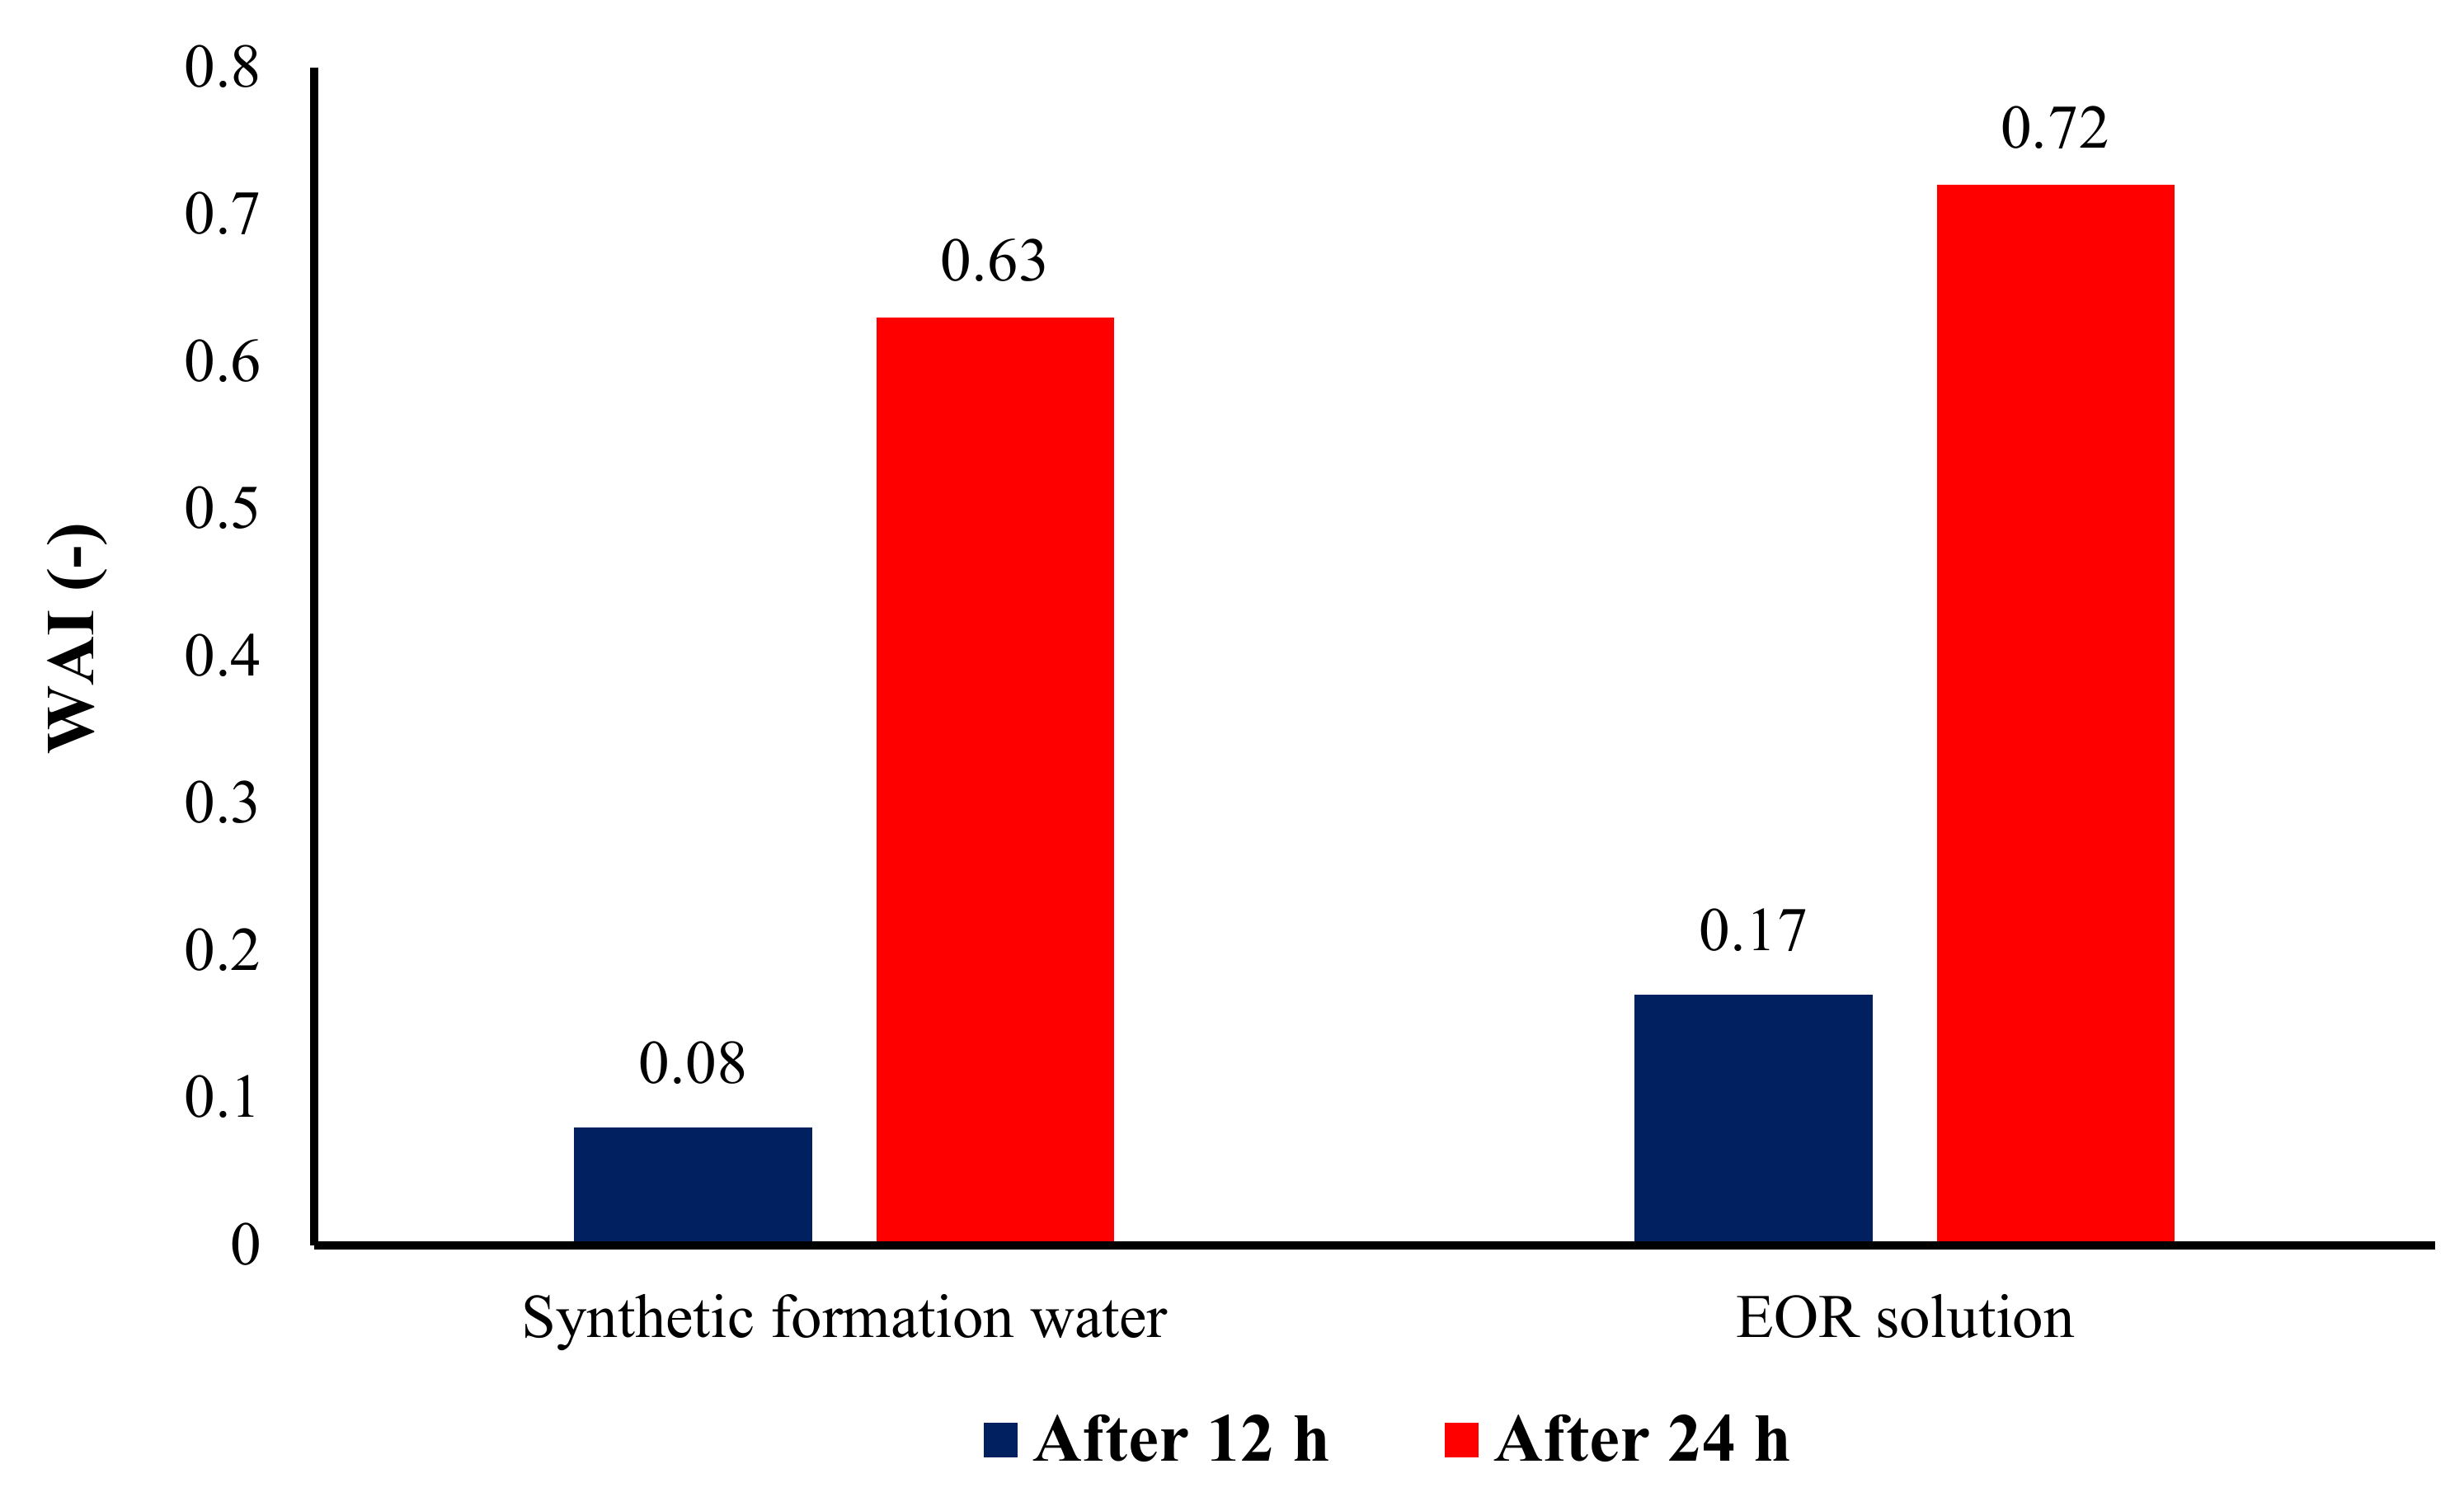
3.4. Wettability Measurement
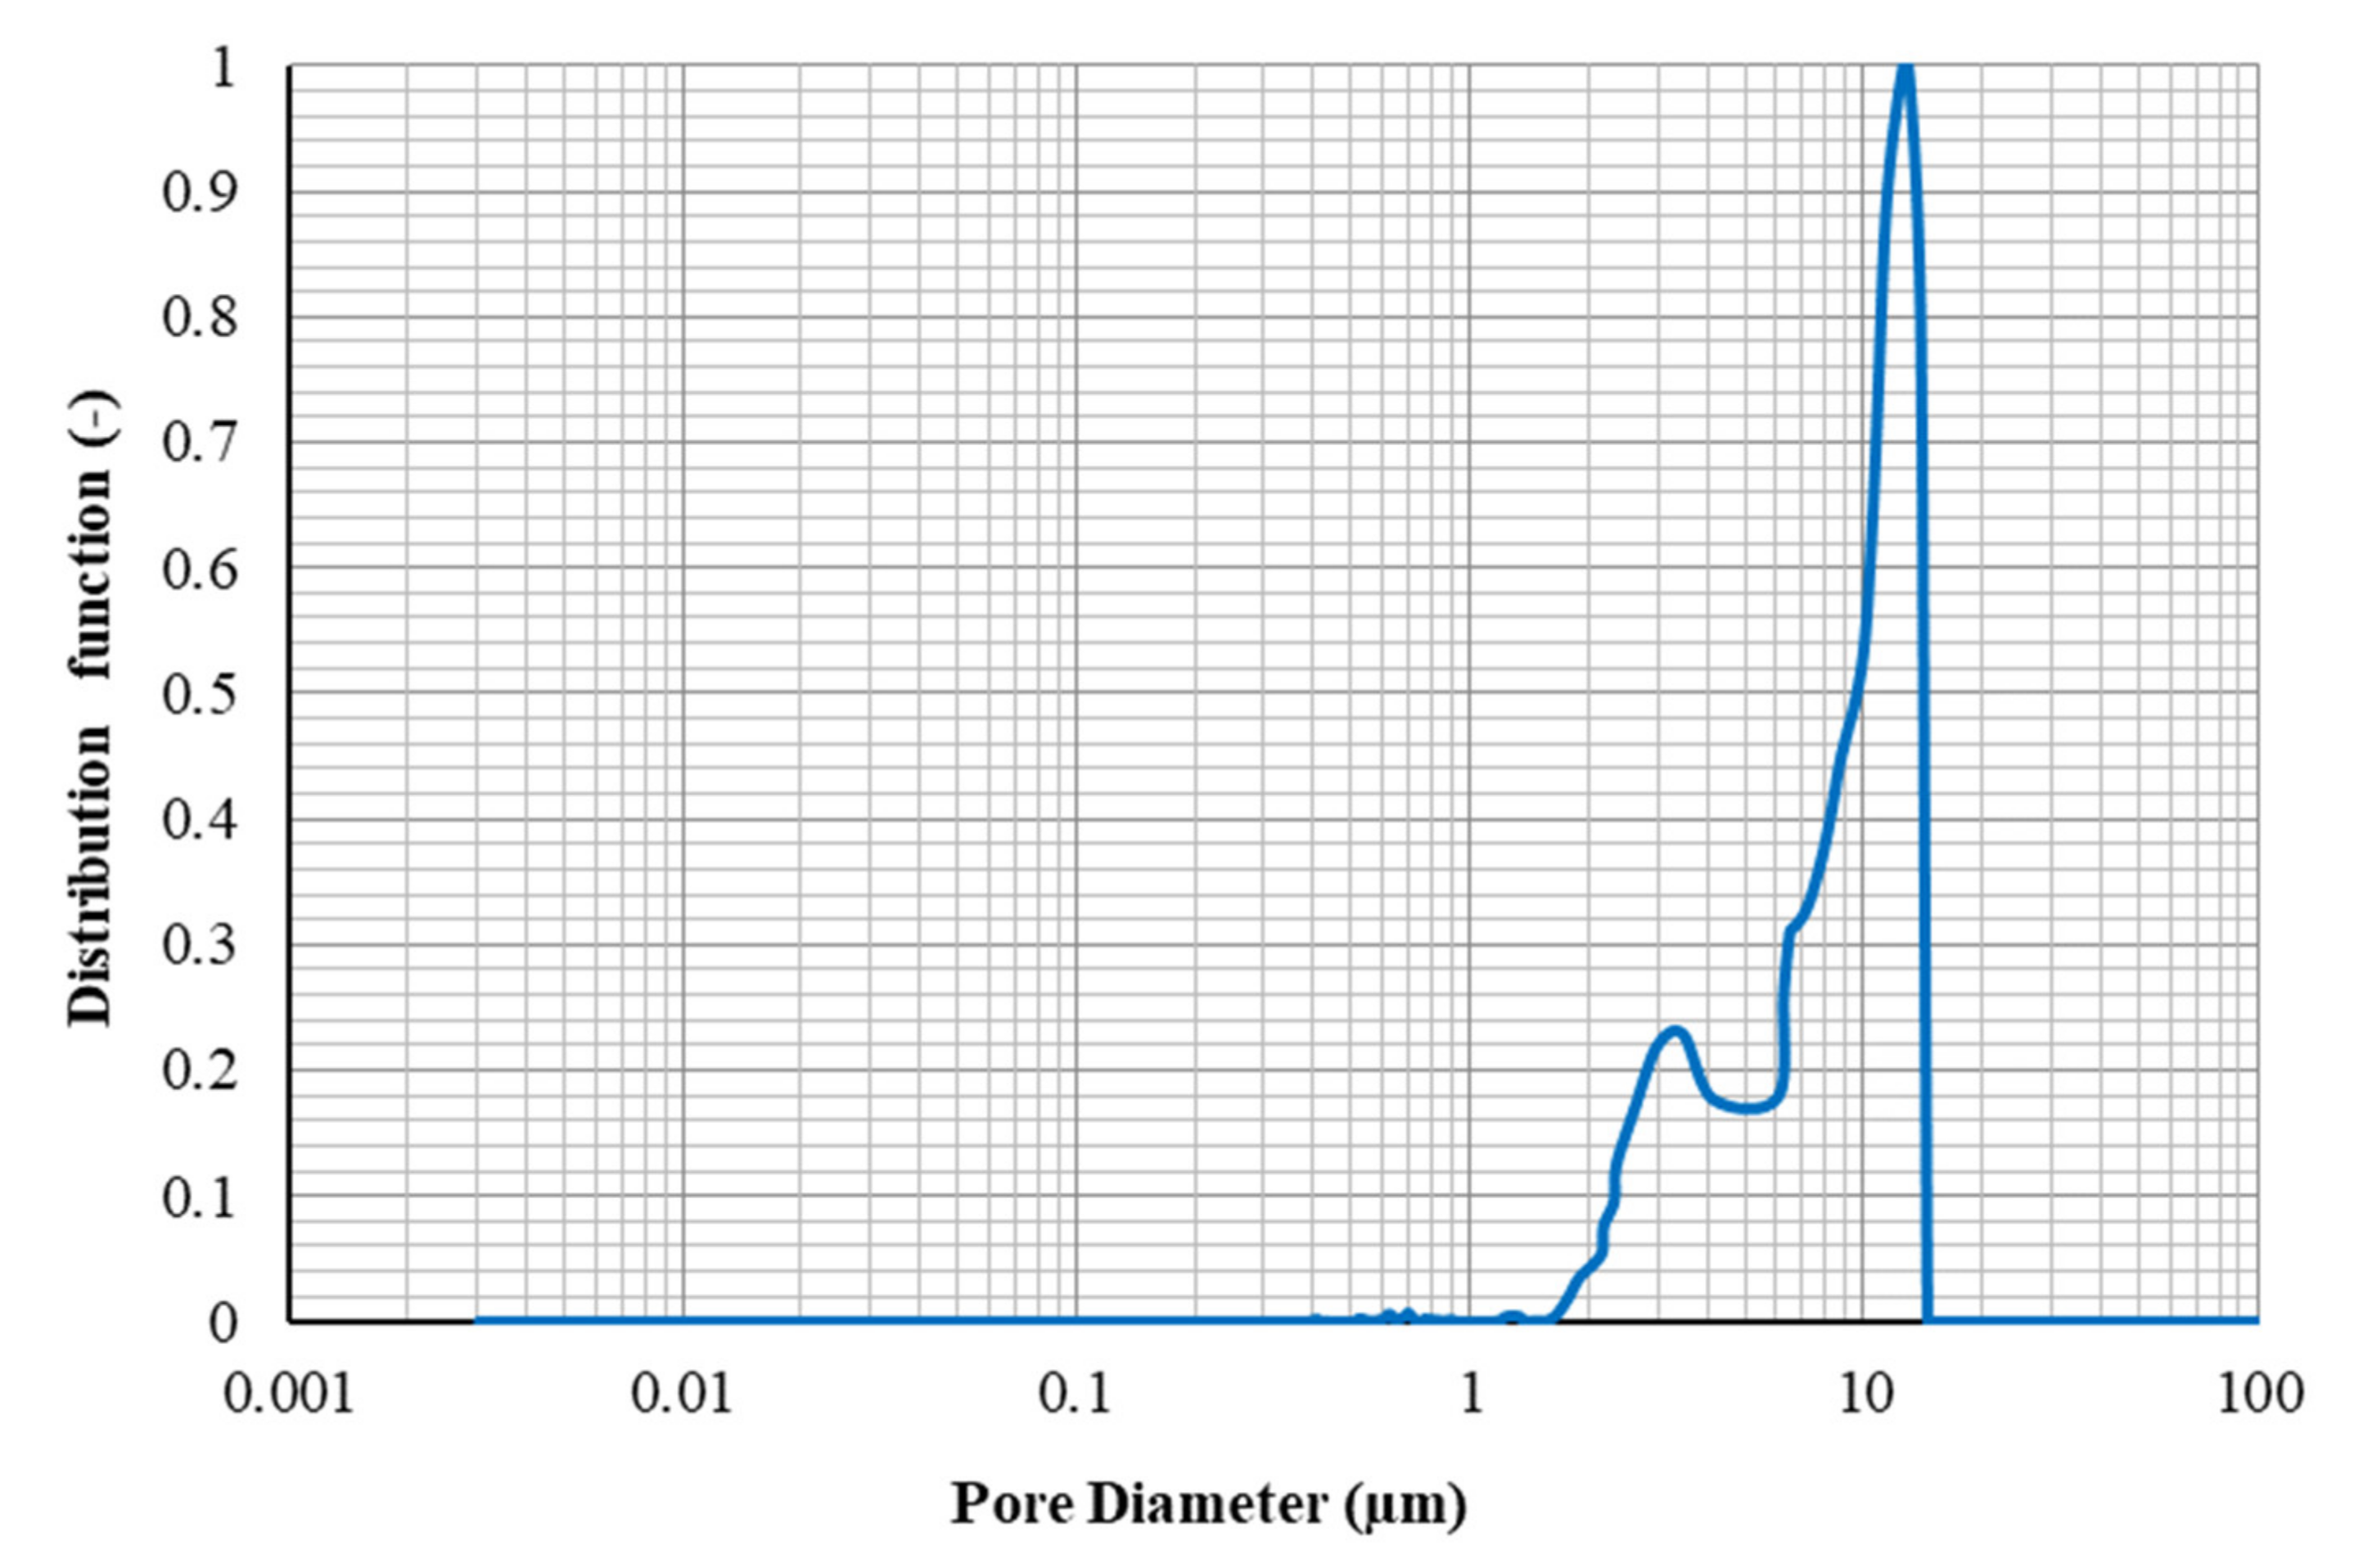
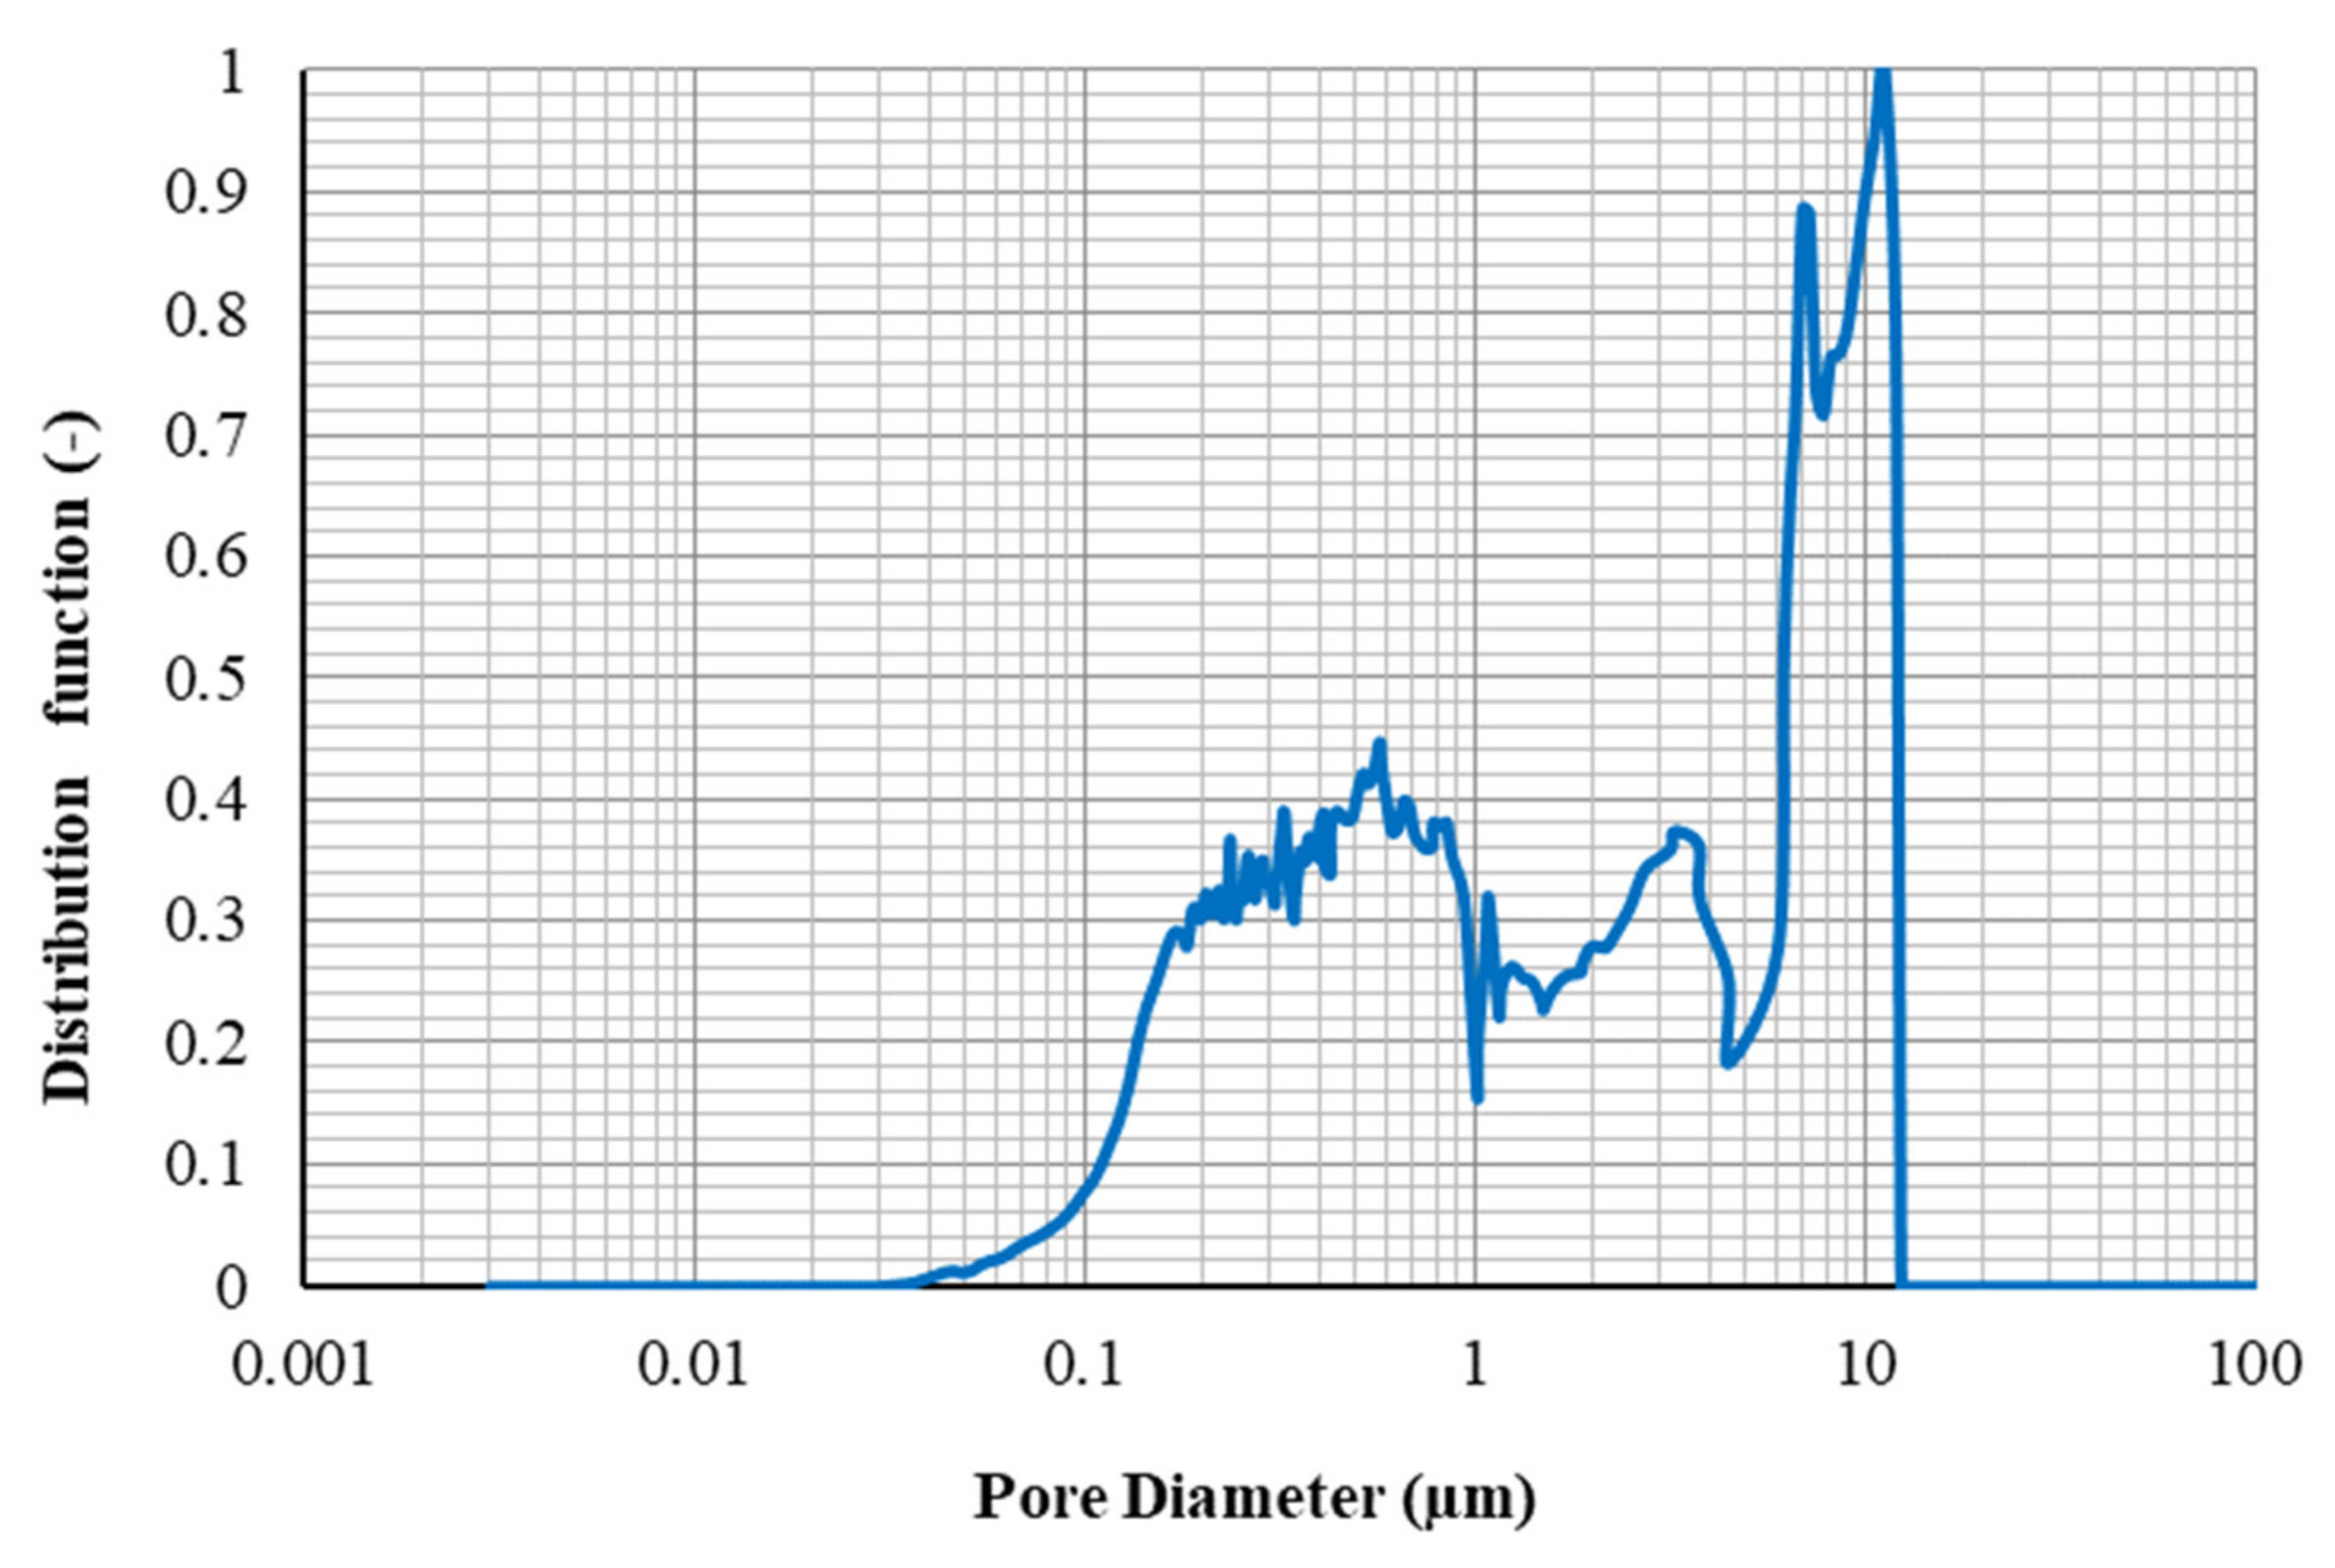
3.5. Determination of the PSD
3.6. Flooding Experiments
3.7. Enhanced Oil Recovery Tests
4. Conclusions
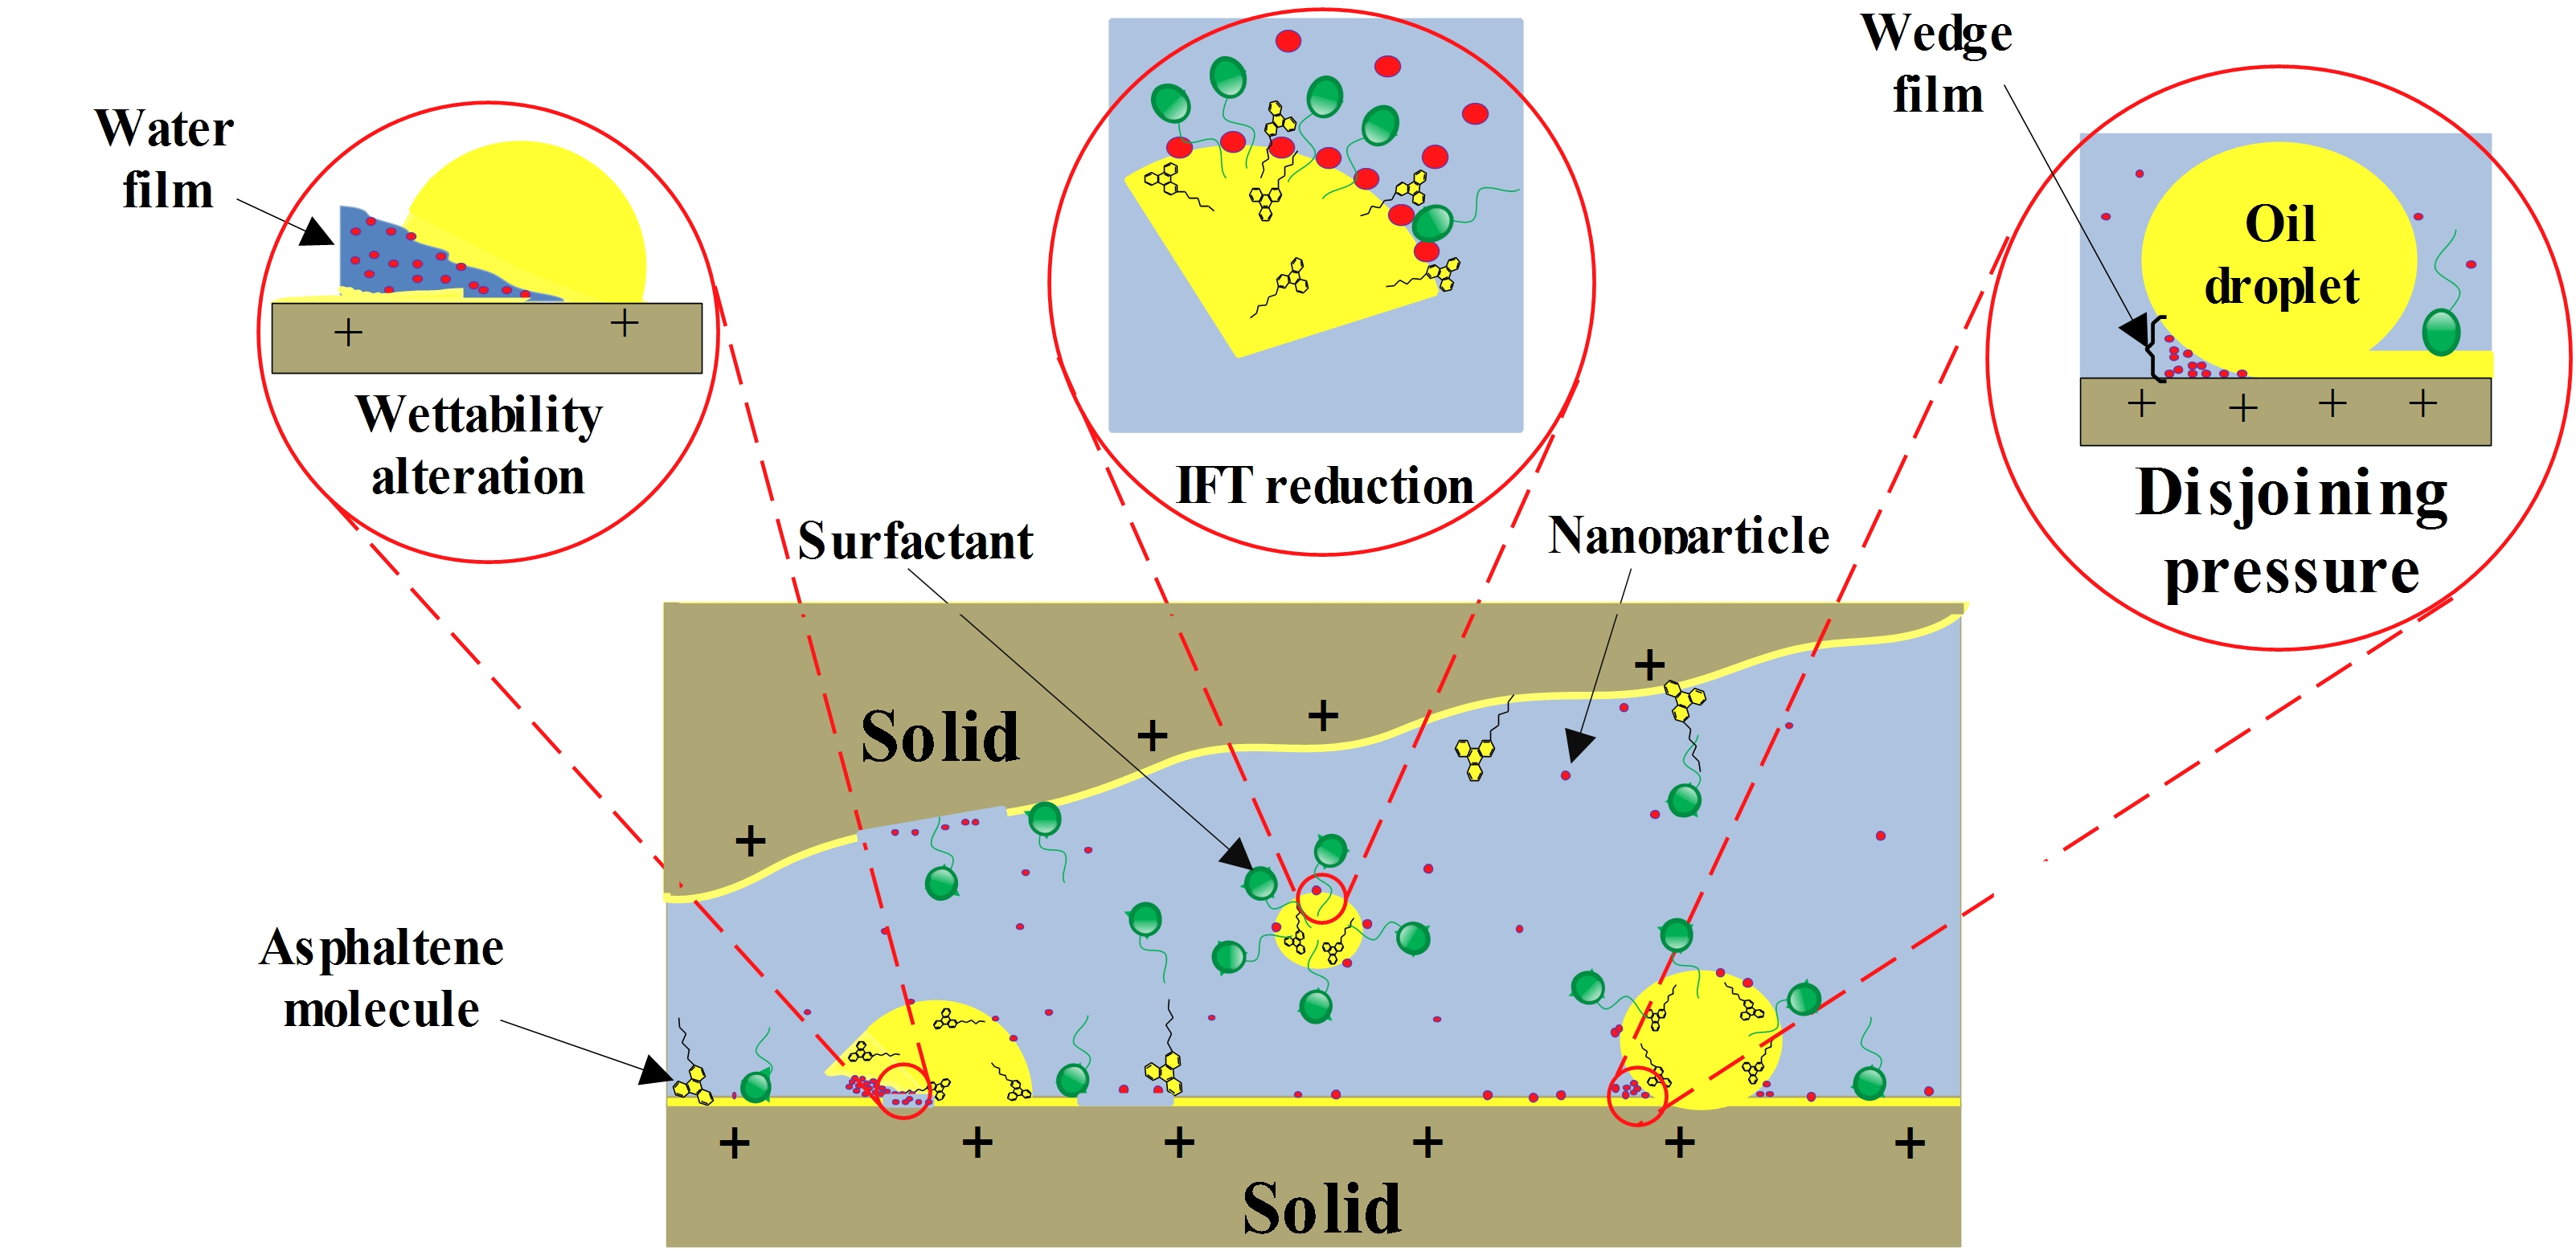
- The presence of 0.1 wt.% silica NPs in combination with the AOS surfactant (CMC), reduces the IFT value from 12.5 mN/m to 4.4 mN/m. The results of zeta potential and DLS tests confirmed the synergy of AOS surfactant and silica nanoparticles.
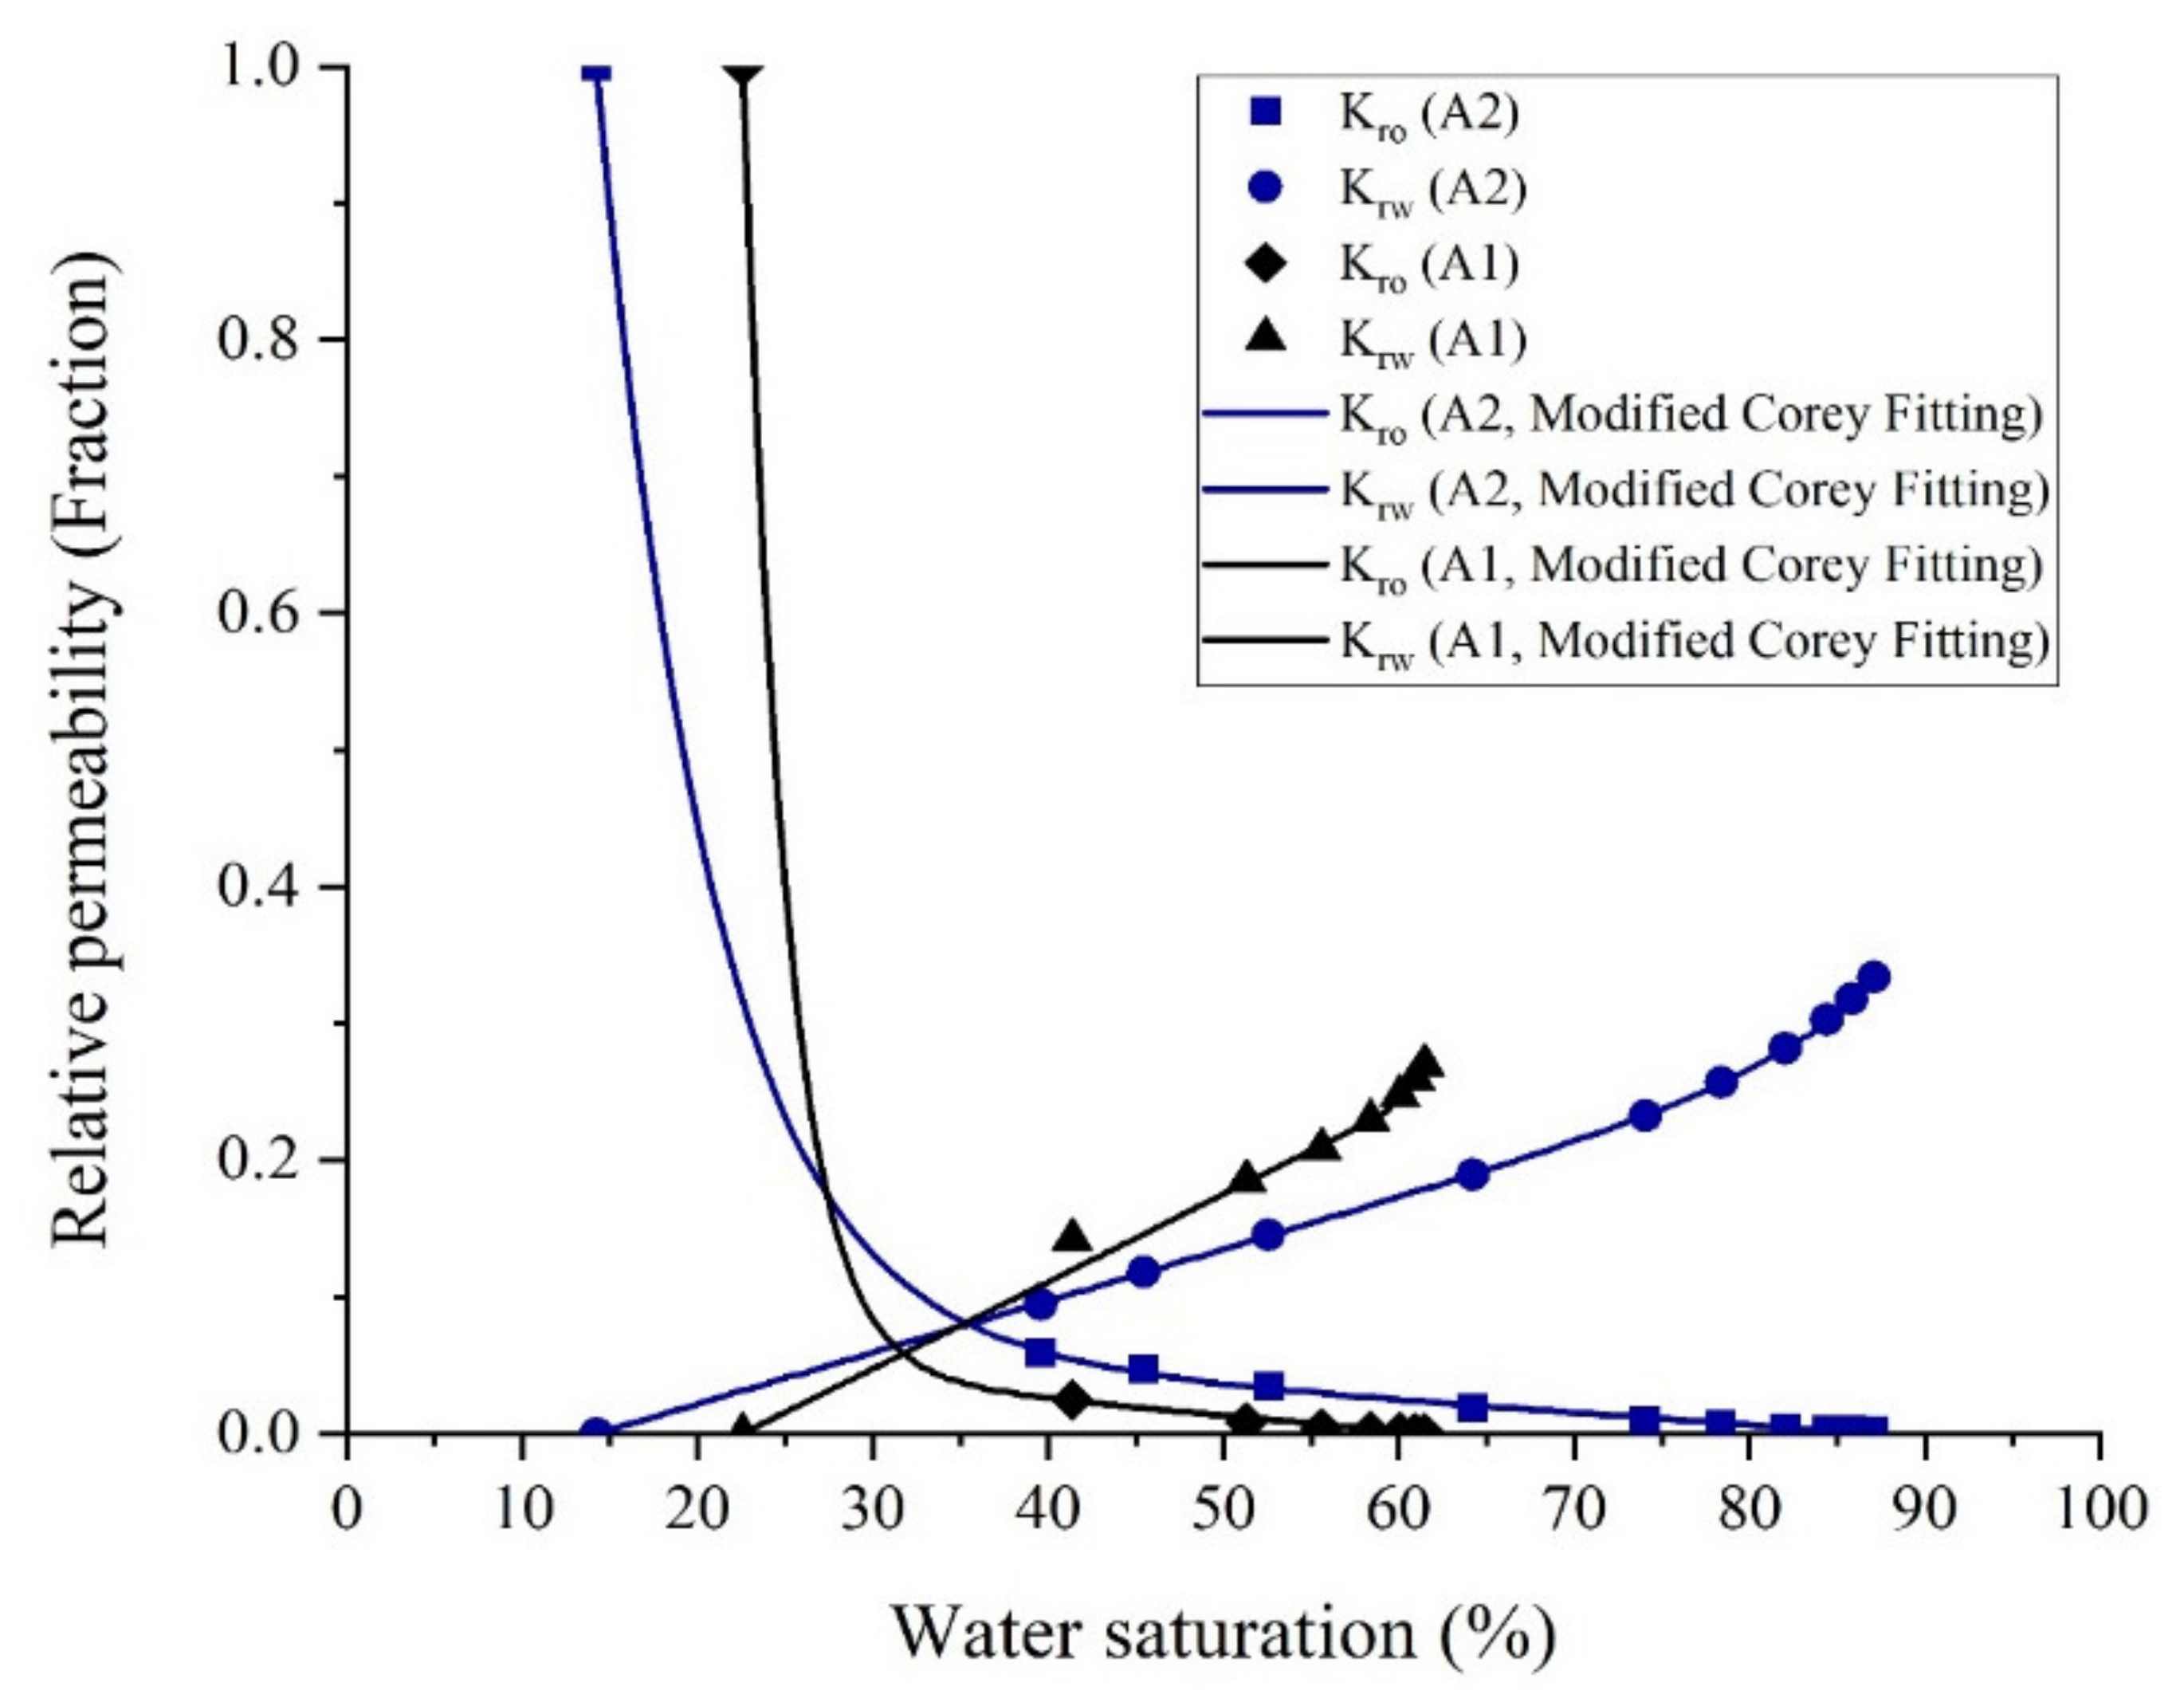
- Results of contact angle measurements, as well as oil–water relative permeability tests, indicate the capability of the AOS + SiO2 solution in altering the wettability of carbonate rocks toward water-wetness.
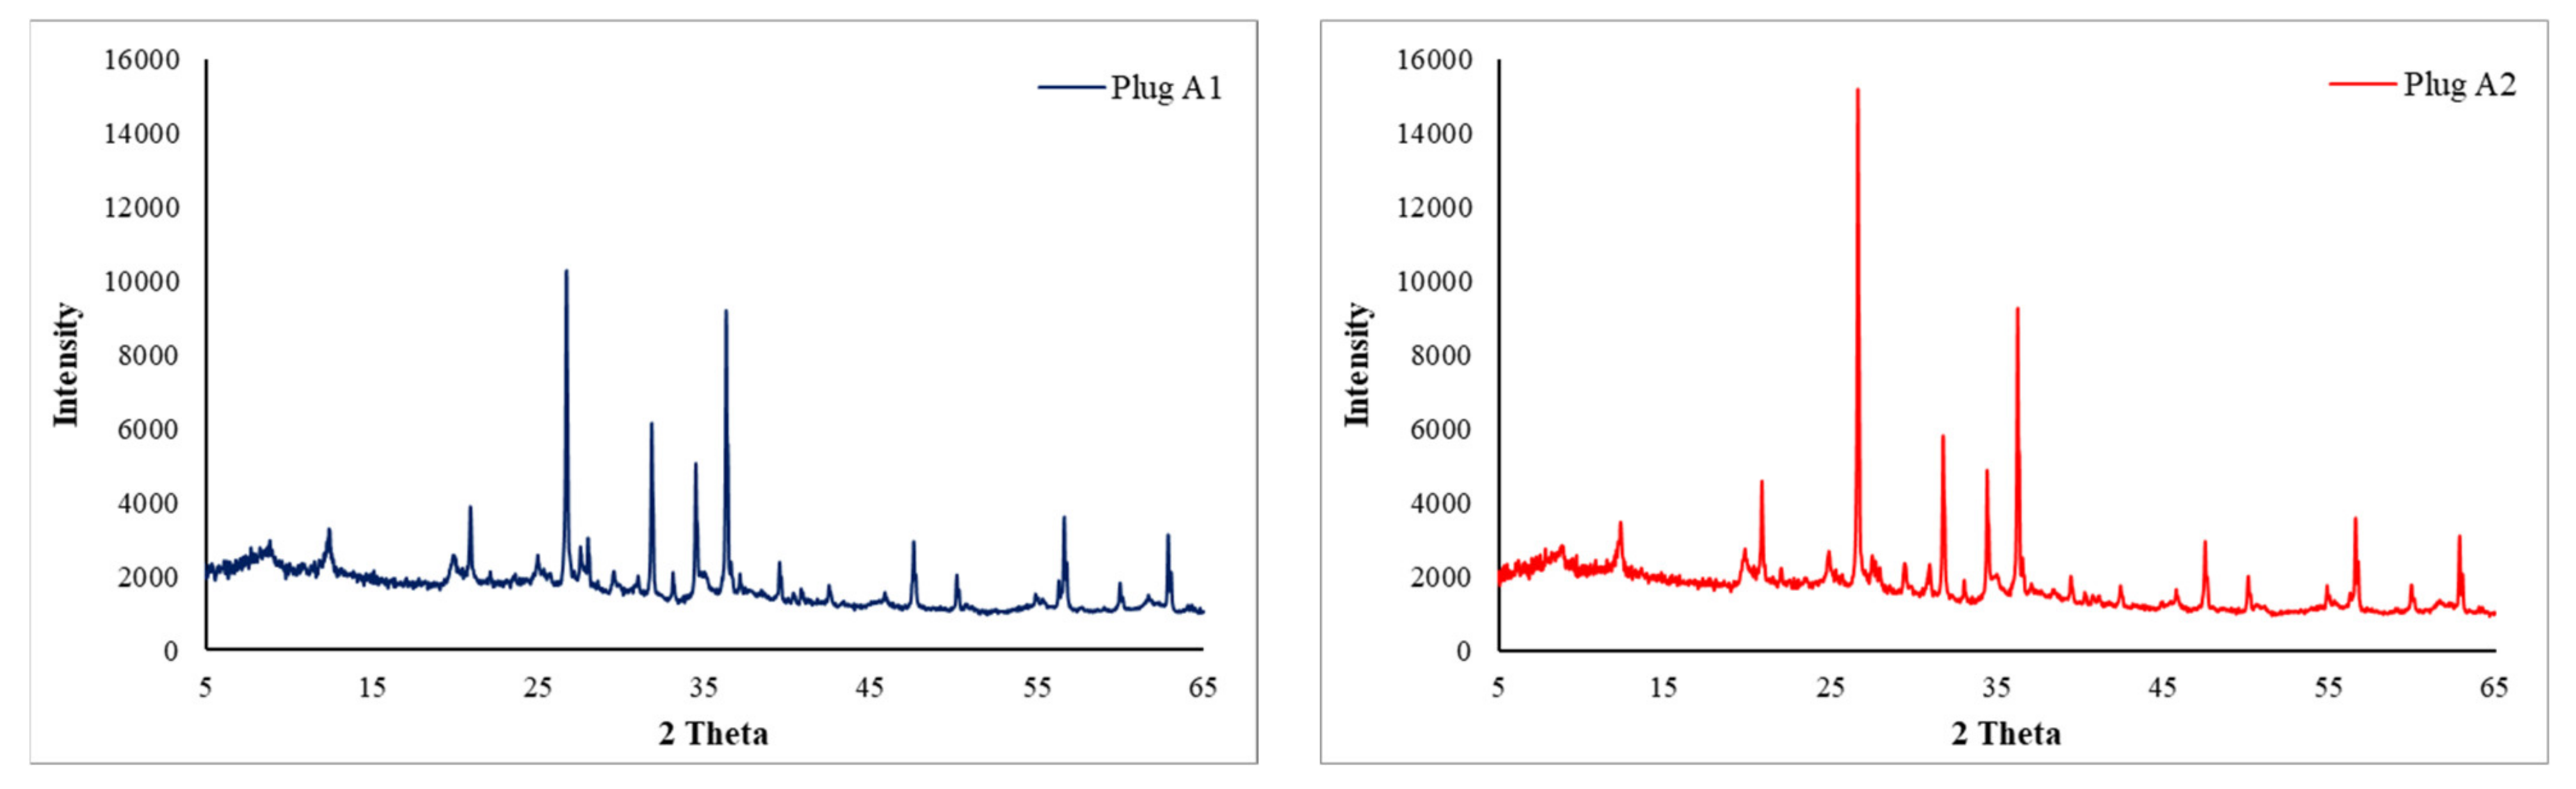
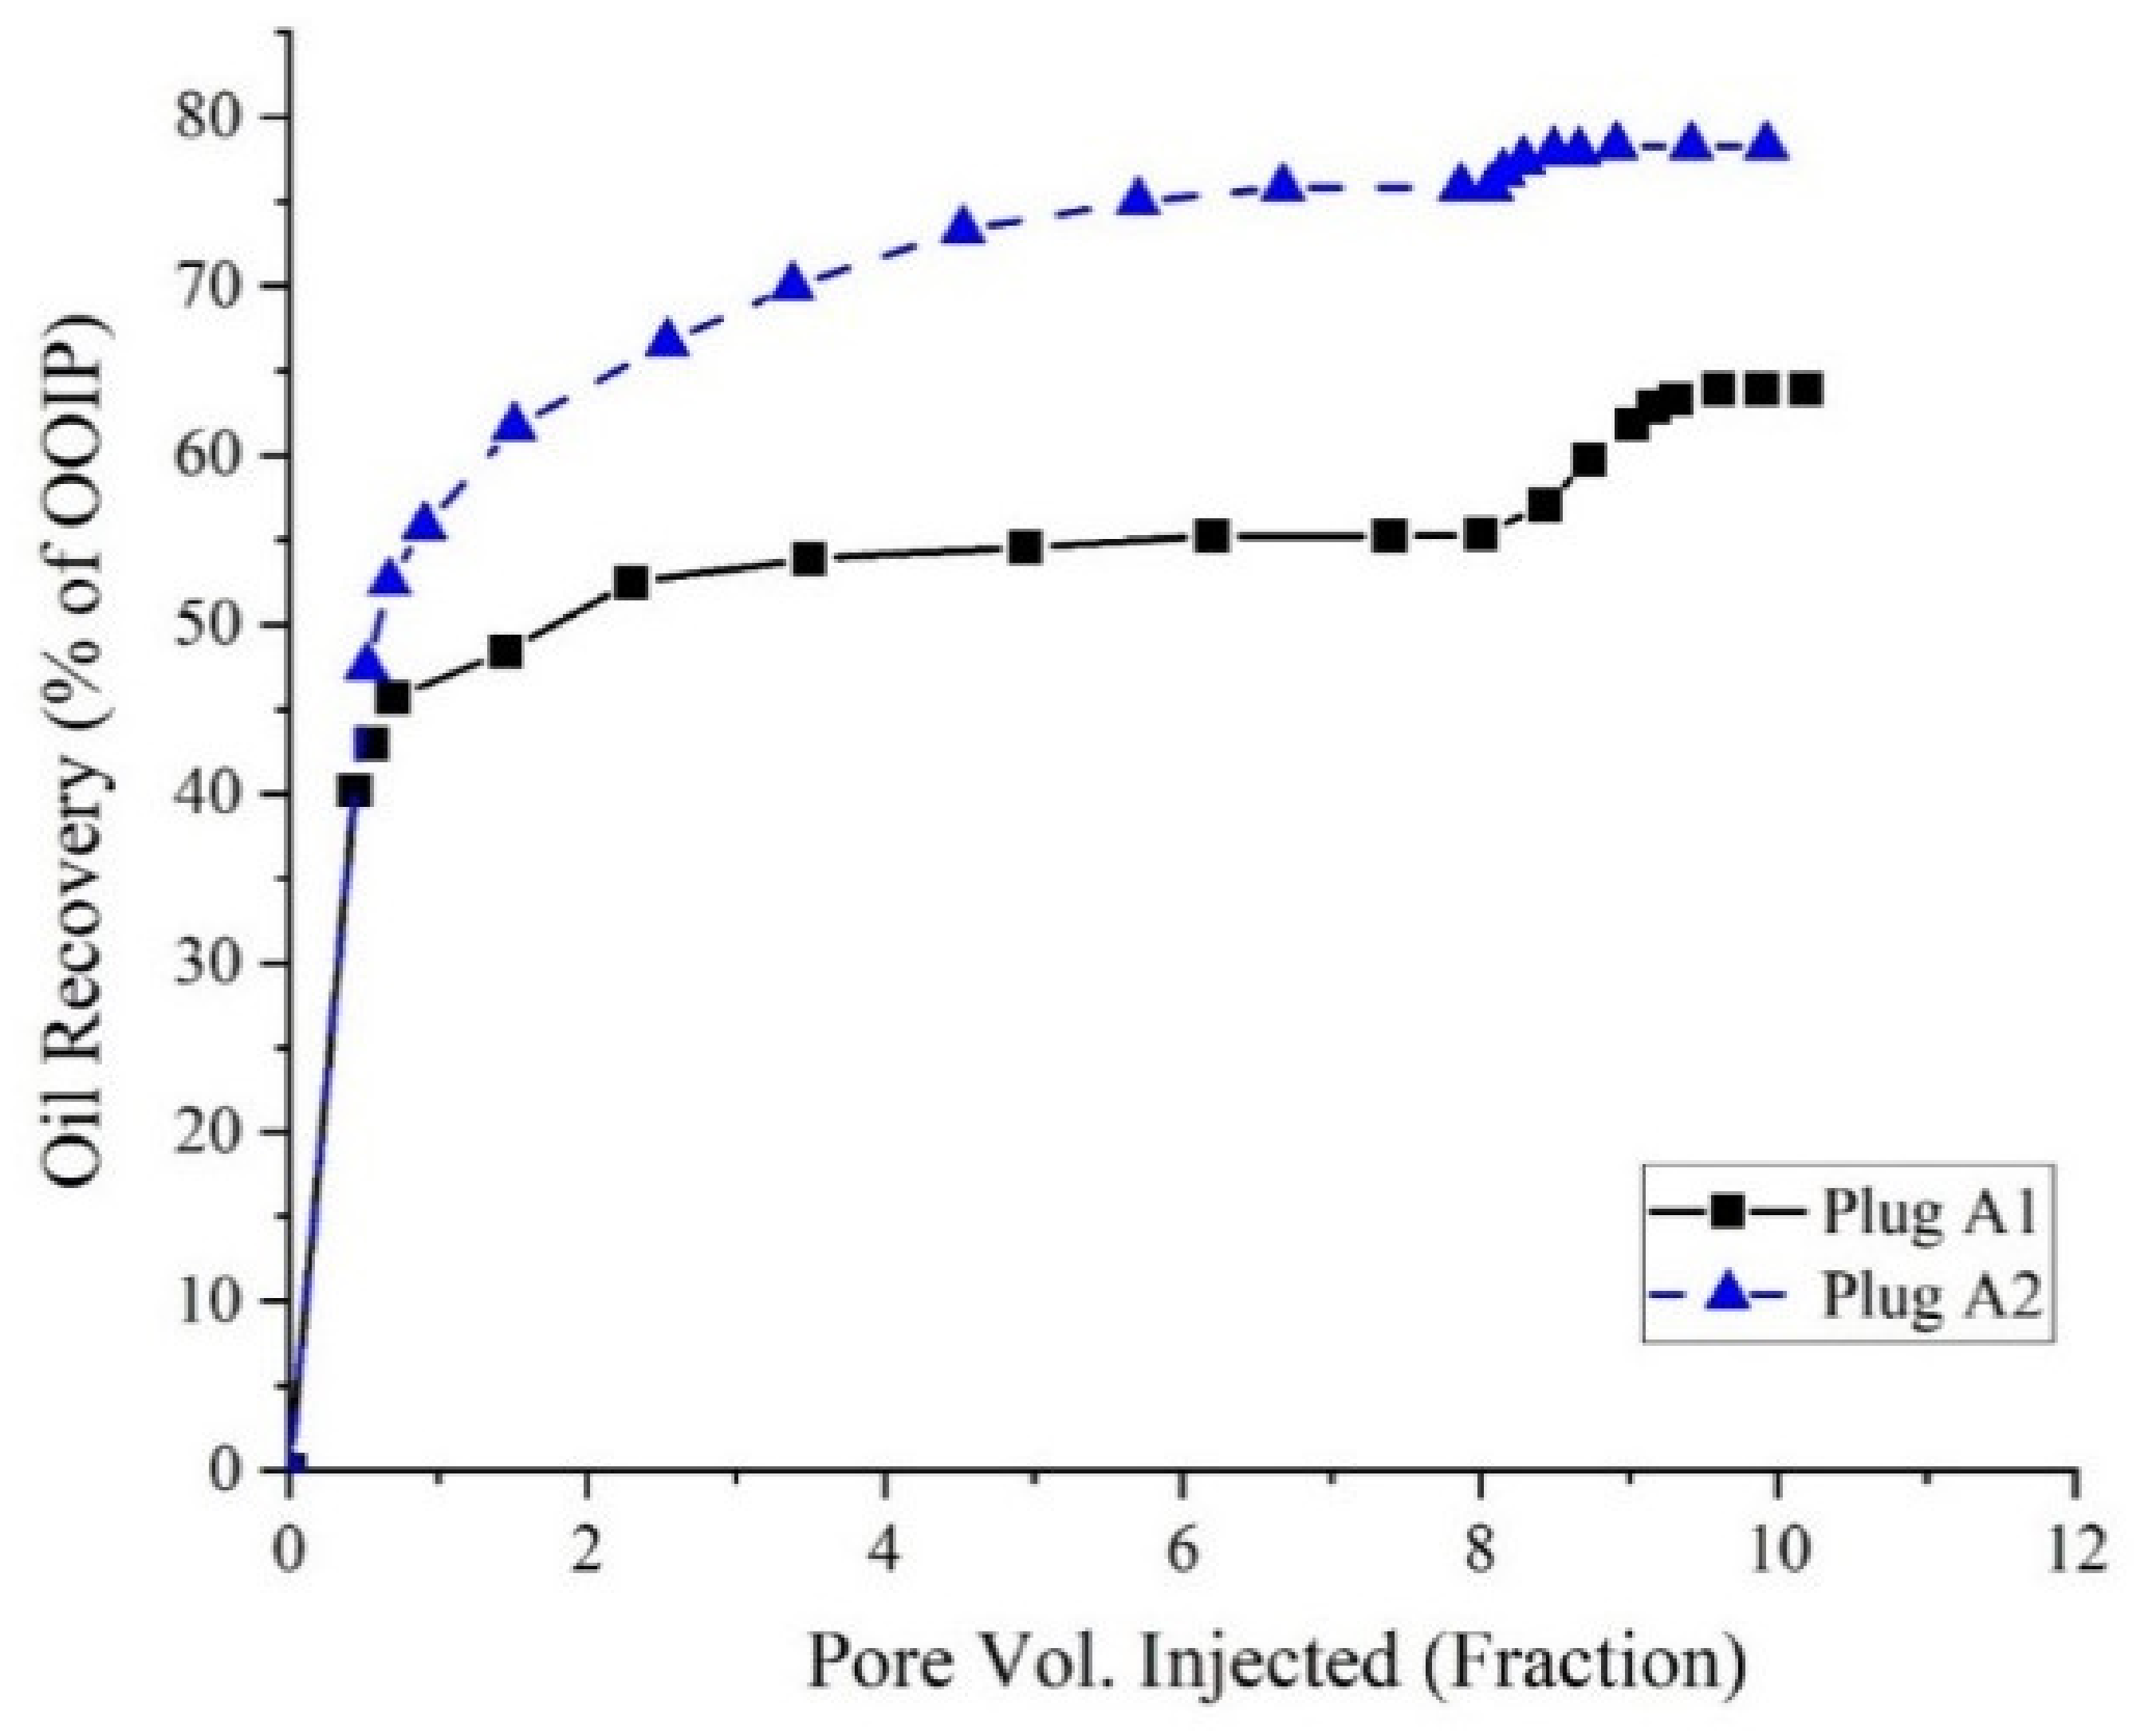
- For core sample A2 with a wide range of uniform pore sizes, the amount of oil recovered by secondary water flooding was more than that for core plug A1. Thus, in conventional water flooding, the homogeneity of the pore sizes is more important than the dimensions of the pores.
- Based upon the results of core flooding experiments, which showed more oil recovery in water flooding for the plug with homogeneous PSDs, it can be deduced that using the results of MICP tests is a more reliable method than the FZI technique for rock typing in carbonate rocks.
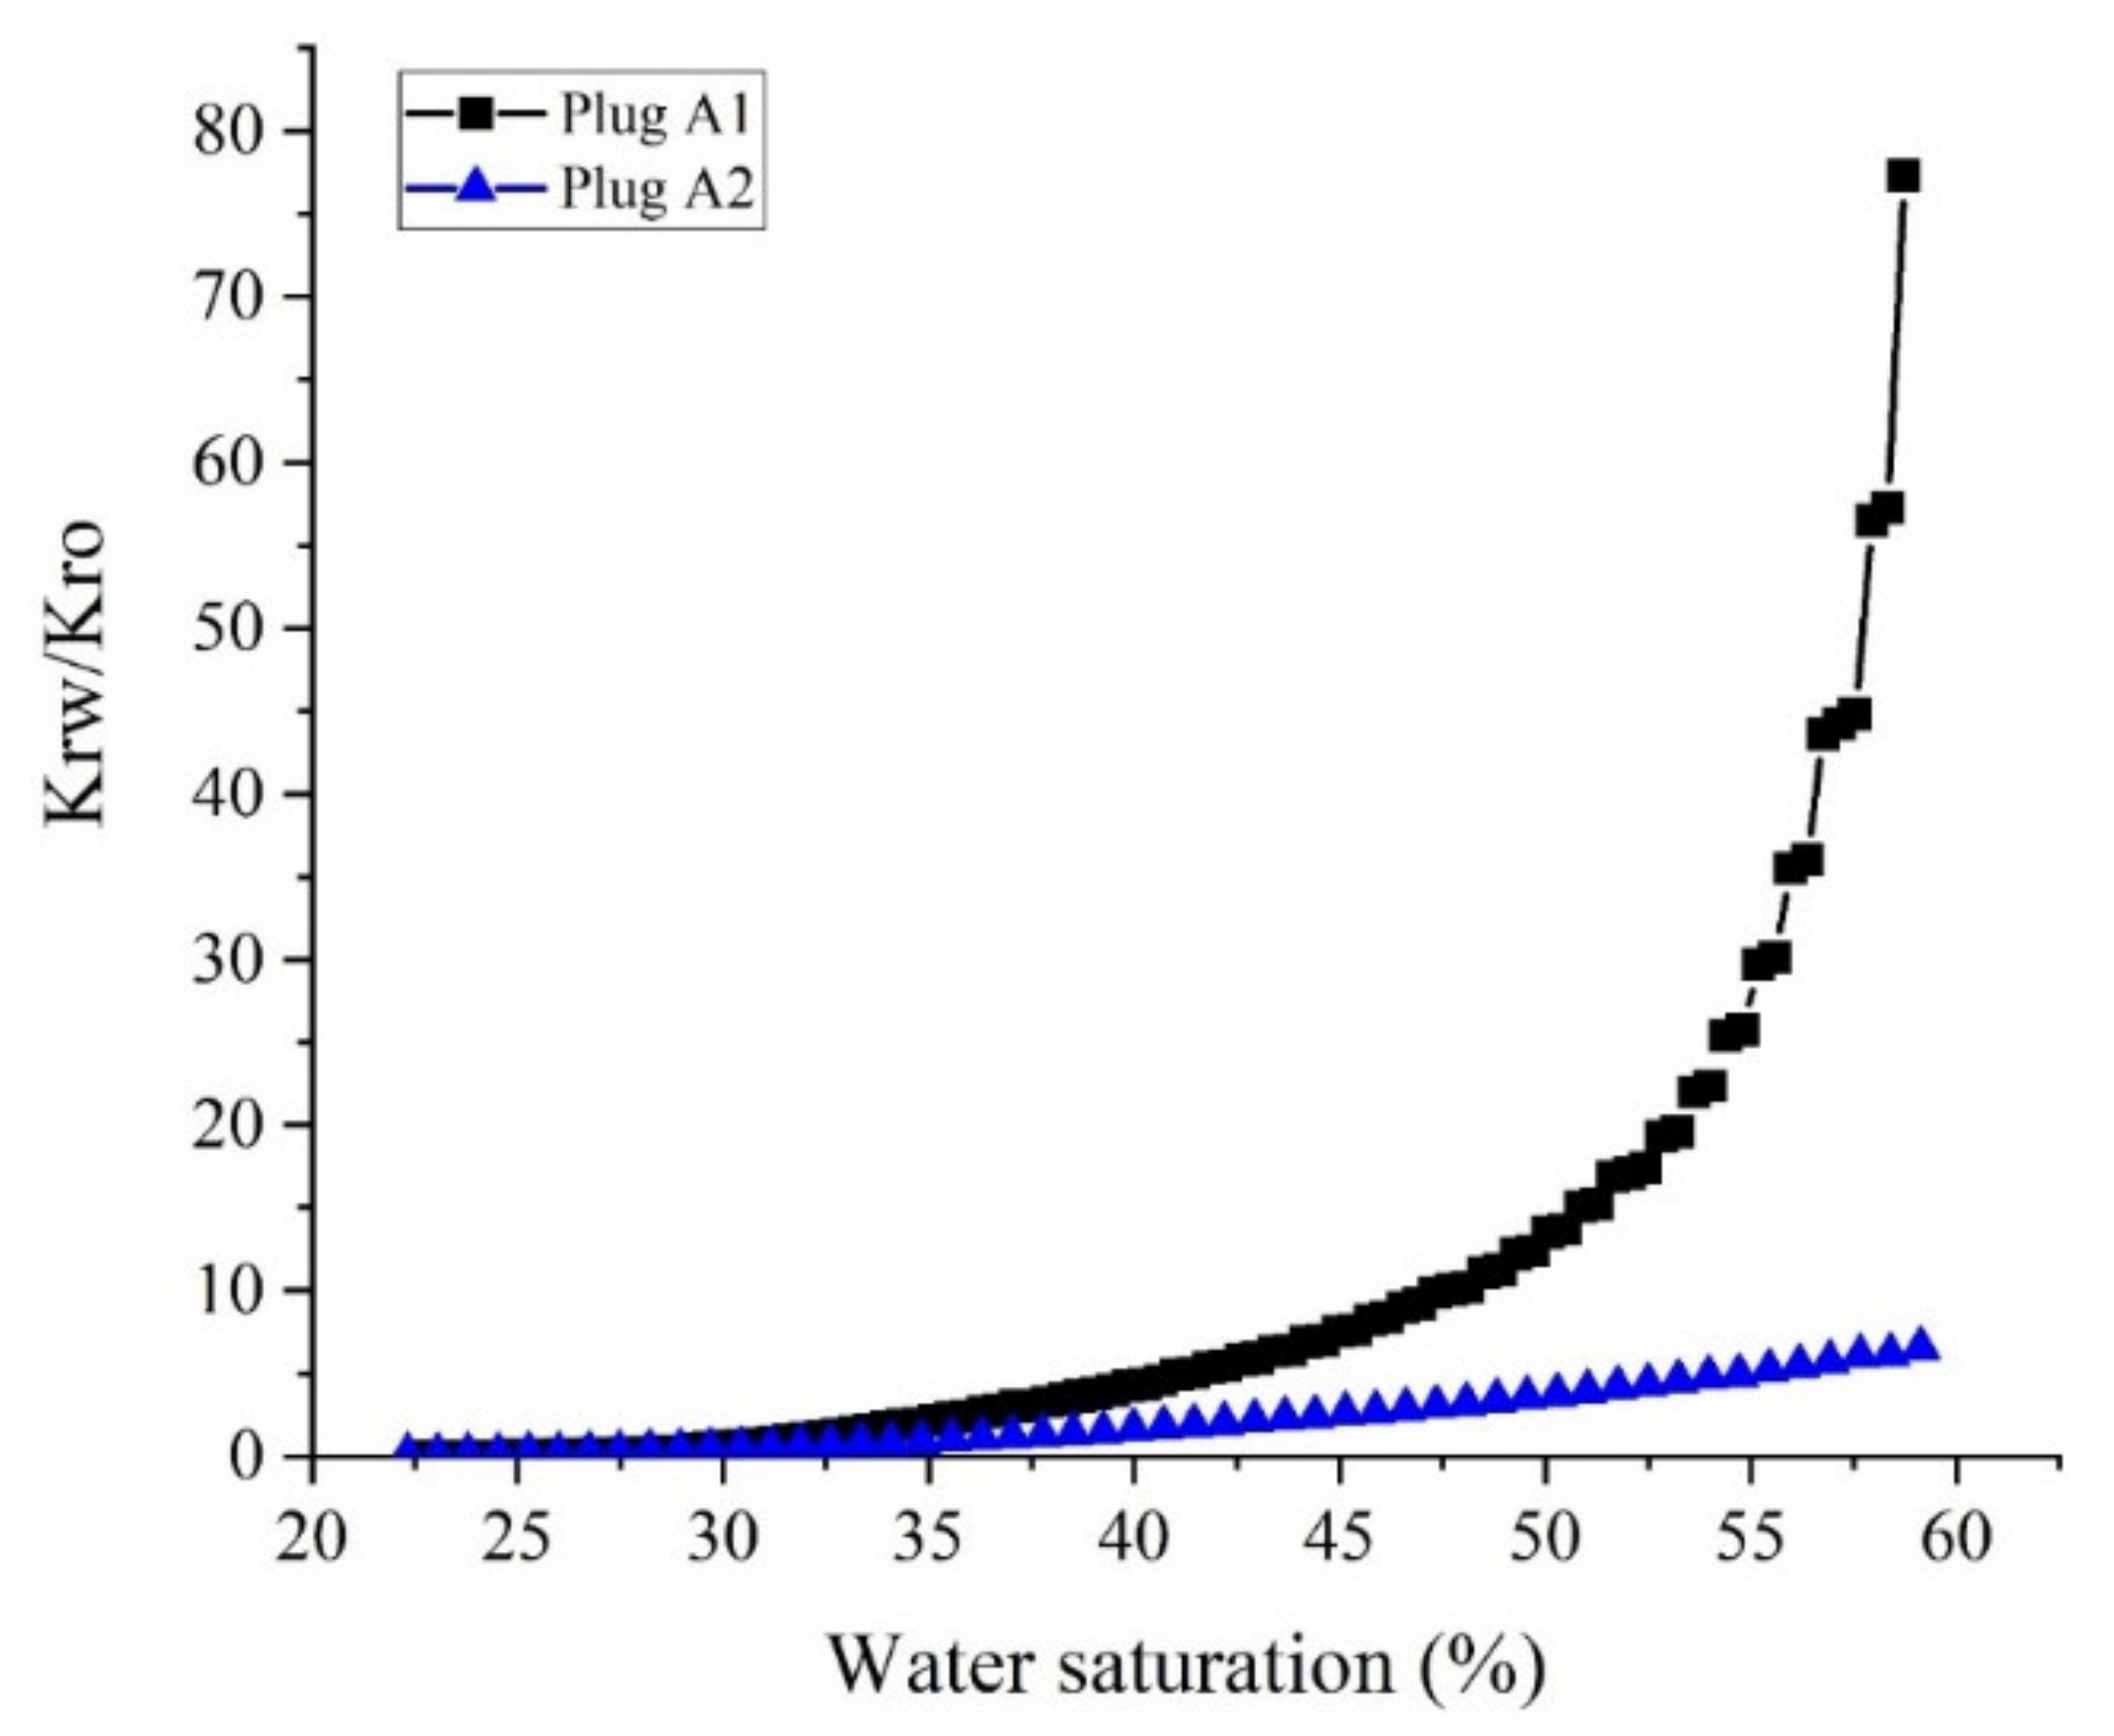
- At the same range of water saturation, the ratio of water to oil relative permeability for core plug with better pore connectivity is much lower than that for the core plug with poor pore connections. This shows how the better connection between the pores can influence oil recovery by water flooding, which is in good agreement with the results of core flooding tests.
- Results of displacement tests outlined that applying the surfactant + NPs solution as an EOR technique could recover up to 2.5% and 8.6% more oil from the core plugs with homogeneous and non-homogeneous PSDs, respectively.
Supplementary Materials
Author Contributions
Funding
Acknowledgments
Conflicts of Interest
Abbreviations
| AOS | Alpha olefin sulfonate |
| DIW | Deionized water |
| DLS | Dynamic light scattering |
| EOR | Enhanced oil recovery |
| FZI | Flow zone index |
| IFT | Interfacial tension |
| MICP | Mercury injection capillary pressure |
| NP | Nanoparticle |
| PSD | Pore throat size distribution |
| SFW | Synthetic formation water |
| TEM | Transmission electron microscopy |
| WAI | Wettability alteration index |
| XRD | X-ray diffraction |
References
- Al-Shalabi, E.W.; Ghosh, B. Effect of pore-scale heterogeneity and capillary-viscous fingering on commingled waterflood oil recovery in stratified porous media. J. Pet. Eng. 2016, 2016, 1708929. [Google Scholar] [CrossRef]
- Rezaei, A.; Riazi, M.; Escrochi, M. Investment Opportunities in Iranian EOR Projects. Saint Petersbg. 2018, 2018, 1–5. [Google Scholar]
- Yazdanpanah, A.; Rezaei, A.; Mahdiyar, H.; Kalantarials, A. Development of an efficient hybrid GA-PSO approach applicable for well placement optimization. Adv Geo-Energy Res. 2019, 3, 365–374. [Google Scholar] [CrossRef]
- Serag El Din, S.; Dernaika, M.; Hannon, L.; Kalam, Z. The Effect of Rock Properties on Remaining and Residual Oil Saturation in Heterogeneous Carbonate Rocks. In Proceedings of the SPE Middle East Oil and Gas Show and Conference, Manama, Bahrain, 10–13 March 2013; Society of Petroleum Engineers: Richardson, TX, USA. [Google Scholar]
- Aliakbardoust, E.; Rahimpour-Bonab, H. Integration of rock typing methods for carbonate reservoir characterization. J. Geophys Eng 2013, 10, 55004. [Google Scholar] [CrossRef]
- Wardlaw, N.C.; Cassan, J.P. Estimation of recovery efficiency by visual observation of pore systems in reservoir rocks. Bull. Can. Pet. Geol 1978, 26, 572–585. [Google Scholar]
- Magara, K. Estimation of Recovery Efficiency by Visual Observation of Pore Systems in Reservoir Rocks: Discussion. Bull. Can. Pet. Geol 1979, 27, 400–401. [Google Scholar]
- Chatzis, I.; Morrow, N.R.; Lim, H.T. Magnitude and detailed structure of residual oil saturation. Soc Pet. Eng J. 1983, 23, 311–326. [Google Scholar] [CrossRef]
- Elgaghah, S. A Novel Technique for the Determination of Microscopic Pore Size Distribution of Heterogemeous Reservoir Rocks. In Proceedings of the Asia Pacific Oil and Gas Conference and Exhibition, Jakarta, Indonesia, 30 October–1 November 2007; Society of Petroleum Engineers: Richardson, TX, USA. [Google Scholar]
- Kianinejad, A.; DiCarlo, D.A. Three-phase oil relative permeability in water-wet media: A comprehensive study. Transp. Porous Media 2016, 112, 665–687. [Google Scholar] [CrossRef]
- Medina, C.R. Influence of Porosity, Permeability, and Pore Size Distribution on Storability, Injectivity, and Seal Efficiency of Carbonate Reservoirs and Shale Caprock: A Multi-Technique Approach for Geologic Carbon Sequestration. Ph.D. Thesis, Indiana University, Bloomington, IN, USA, 2019. [Google Scholar]
- Gharibshahi, R.; Jafari, A.; Haghtalab, A.; Karambeigi, M.S. Application of CFD to evaluate the pore morphology effect on nanofluid flooding for enhanced oil recovery. RSC Adv. 2015, 5, 28938–28949. [Google Scholar] [CrossRef]
- Weger, R.J.; Eberli, G.P.; Baechle, G.T.; Massaferro, J.L.; Sun, Y.-F. Quantification of pore structure and its effect on sonic velocity and permeability in carbonates. Am. Assoc. Pet. Geol. Bull. 2009, 93, 1297–1317. [Google Scholar] [CrossRef]
- Rangel-German, E.R.; Kovscek, A.R. Experimental and analytical study of multidimensional imbibition in fractured porous media. J. Pet. Sci. Eng. 2002, 36, 45–60. [Google Scholar] [CrossRef]
- Nwidee, L.N.; Lebedev, M.; Barifcani, A.; Sarmadivaleh, M.; Iglauer, S. Wettability alteration of oil-wet limestone using surfactant-nanoparticle formulation. J. Colloid Interface Sci. 2017, 504, 334–345. [Google Scholar] [CrossRef] [PubMed]
- Ghadami, N.; Rasaei, M.R.; Hejri, S.; Sajedian, A.; Afsari, K. Consistent porosity–permeability modeling, reservoir rock typing and hydraulic flow unitization in a giant carbonate reservoir. J. Pet. Sci. Eng. 2015, 131, 58–69. [Google Scholar] [CrossRef]
- Porras, J.C. Determination of rock types from pore throat radius and bulk volume water, and their relations to lithofacies, Carito Norte field, eastern Venezuela basin. In Proceedings of the SPWLA 39th Annual Logging Symposium, Keystone, CO, USA, 26–28 May 1998; Society of Petrophysicists and Well-Log Analysts: Houston, TX, USA. [Google Scholar]
- Leal, L.; Barbato, R.; Quaglia, A.; Porras, J.C.; Lazarde, H. Bimodal behavior of mercury-injection capillary pressure curve and its relationship to pore geometry, rock-quality and production performance in a laminated and heterogeneous reservoir. In Proceedings of the SPE Latin American and Caribbean Petroleum Engineering Conference, Buenos Aires, Argentina, 25–28 March 2001; Society of Petroleum Engineers: Richardson, TX, USA. [Google Scholar]
- Skalinski, M.; Jeroen Kenter, S.P.E.; Jenkins, S.; Tengizchevroil, T.T. Updated rock type definition and pore type classification of a carbonate buildup, Tengiz field, Republic of Kazakhstan. Soc. Pet. Eng. 2010, 139986. [Google Scholar] [CrossRef]
- Lehmann, C.T.; Mohamed, K.I.; Cobb, D.O.; Al Hendi, A. Rock-typing of upper jurassic (Arab) carbonates offshore Abu Dhabi. In Proceedings of the Abu Dhabi International Petroleum Exhibition and Conference, Abu Dhabi, UAE, 3–6 November 2008; Society of Petroleum Engineers: Richardson, TX, USA. [Google Scholar]
- Colombo, F.; del Monte, A.A.; Balossino, P.; Paparozzi, E.; Valdisturlo, A.; Tarchiani, C. MICP-Based Elastic Rock Typing Characterisation of Carbonate Reservoir. In Proceedings of the SPE Europec featured at 80th EAGE Conference and Exhibition, Copenhagen, Denmark, 11–14 June 2018; Society of Petroleum Engineers: Richardson, TX, USA. [Google Scholar]
- Green, D.W.; Willhite, G.P. Enhanced Oil Recovery; Henry, L. Doherty Memorial Fund of AIME, Society of Petroleum Engineers: Richardson, TX, USA, 1998; Volume 6. [Google Scholar]
- Saxena, N.; Kumar, A.; Mandal, A. Adsorption analysis of natural anionic surfactant for enhanced oil recovery: The role of mineralogy, salinity, alkalinity and nanoparticles. J. Pet. Sci. Eng. 2019, 173, 1264–1283. [Google Scholar] [CrossRef]
- Karimi, M.; Al-Maamari, R.S.; Ayatollahi, S.; Mehranbod, N. Wettability alteration and oil recovery by spontaneous imbibition of low salinity brine into carbonates: Impact of Mg2+, SO42− and cationic surfactant. J. Pet. Sci. Eng. 2016, 147, 560–569. [Google Scholar] [CrossRef]
- Standnes, D.C.; Austad, T. Wettability alteration in chalk: 2. Mechanism for wettability alteration from oil-wet to water-wet using surfactants. J. Pet. Sci. Eng. 2000, 28, 123–143. [Google Scholar] [CrossRef]
- Derikvand, Z.; Riazi, M. Experimental investigation of a novel foam formulation to improve foam quality. J. Mol. Liq. 2016, 224, 1311–1318. [Google Scholar] [CrossRef]
- Yassin, M.R.; Arabloo, M.; Shokrollahi, A.; Mohammadi, A.H. Prediction of surfactant retention in porous media: A robust modeling approach. J. Dispers Sci. Technol. 2014, 35, 1407–1418. [Google Scholar] [CrossRef]
- Li, K.; Jing, X.; He, S.; Wei, B. Static adsorption and retention of viscoelastic surfactant in porous media: EOR implication. Energy Fuels 2016, 30, 9089–9096. [Google Scholar] [CrossRef]
- Levitt, D.; Bourrel, M. Adsorption of EOR Chemicals Under Laboratory and Reservoir Conditions, Part III: Chemical Treatment Methods. In Proceedings of the SPE Improved Oil Recovery Conference, Tulsa, OK, USA, 11–13 April 2016; Society of Petroleum Engineers: Richardson, TX, USA. [Google Scholar]
- Wu, Y.; Chen, W.; Dai, C.; Huang, Y.; Li, H.; Zhao, M.; He, L.; Jiao, B. Reducing surfactant adsorption on rock by silica nanoparticles for enhanced oil recovery. J. Pet. Sci. Eng. 2017, 153, 283–287. [Google Scholar] [CrossRef]
- Sofla, S.J.D.; Sharifi, M.; Sarapardeh, A.H. Toward mechanistic understanding of natural surfactant flooding in enhanced oil recovery processes: The role of salinity, surfactant concentration and rock type. J. Mol. Liq. 2016, 222, 632–639. [Google Scholar] [CrossRef]
- Derikvand, Z.; Rezaei, A.; Parsaei, R.; Riazi, M.; Torabi, F. A mechanistic experimental study on the combined effect of Mg2+, Ca2+, and SO42-ions and a cationic surfactant in improving the surface properties of oil/water/rock system. Colloids Surfaces A Physicochem Eng. Asp. 2019, 124327. [Google Scholar] [CrossRef]
- Bi, Z.; Liao, W.; Qi, L. Wettability alteration by CTAB adsorption at surfaces of SiO2 film or silica gel powder and mimic oil recovery. Appl. Surf. Sci. 2004, 221, 25–31. [Google Scholar] [CrossRef]
- Amirianshoja, T.; Junin, R.; Idris, A.K.; Rahmani, O. A comparative study of surfactant adsorption by clay minerals. J. Pet. Sci. Eng. 2013, 101, 21–27. [Google Scholar] [CrossRef]
- Franco, C.A.; Zabala, R.; Cortés, F.B. Nanotechnology applied to the enhancement of oil and gas productivity and recovery of Colombian fields. J. Pet. Sci. Eng. 2017, 157, 39–55. [Google Scholar] [CrossRef]
- Cheraghian, G.; Hendraningrat, L. A review on applications of nanotechnology in the enhanced oil recovery part B: Effects of nanoparticles on flooding. Int. Nano Lett. 2016, 6, 1–10. [Google Scholar] [CrossRef]
- Naik, S.; Malgaresi, G.; You, Z.; Bedrikovetsky, P. Well productivity enhancement by applying nanofluids for wettability alteration. APPEA J. 2018, 58, 121–129. [Google Scholar]
- Divandari, H.; Hemmati-Sarapardeh, A.; Schaffie, M.; Ranjbar, M. Integrating synthesized citric acid-coated magnetite nanoparticles with magnetic fields for enhanced oil recovery: Experimental study and mechanistic understanding. J. Pet. Sci. Eng. 2019, 174, 425–436. [Google Scholar] [CrossRef]
- Moghadasi, R.; Rostami, A.; Hemmati-Sarapardeh, A.; Motie, M. Application of Nanosilica for inhibition of fines migration during low salinity water injection: Experimental study, mechanistic understanding, and model development. Fuel 2019, 242, 846–862. [Google Scholar] [CrossRef]
- Corredor-Rojas, L.M.; Hemmati-Sarapardeh, A.; Husein, M.M.; Dong, M.; Maini, B.B. Rheological behavior of surface modified silica nanoparticles dispersed in partially hydrolyzed polyacrylamide and xanthan gum solutions: Experimental measurements, mechanistic understanding, and model development. Energy Fuels 2018, 32, 10628–10638. [Google Scholar] [CrossRef]
- Shojaati, F.; Riazi, M.; Mousavi, S.H.; Derikvand, Z. Experimental investigation of the inhibitory behavior of metal oxides nanoparticles on asphaltene precipitation. Colloids Surfaces A Physicochem. Eng. Asp. 2017, 531, 99–110. [Google Scholar] [CrossRef]
- Almahfood, M.; Bai, B. The synergistic effects of nanoparticle-surfactant nanofluids in EOR applications. J. Pet. Sci. Eng. 2018, 171, 196–210. [Google Scholar] [CrossRef]
- Bagherpour, S.; Rashidi, A.; Mousavi, S.H.; Izadi, N.; Hamidpour, E. Experimental investigation of carboxylate-alumoxane nanoparticles for the enhanced oil recovery performance. Colloids Surfaces A Physicochem. Eng. Asp. 2019, 563, 37–49. [Google Scholar] [CrossRef]
- Roustaei, A. An evaluation of spontaneous imbibition of water into oil-wet carbonate reservoir cores using nanofluid. Petrophysics 2014, 55, 31–37. [Google Scholar]
- Zhao, M.; Lv, W.; Li, Y.; Dai, C.; Wang, X.; Zhou, H.; Zou, C.; Gao, M.; Zhang, Y.; Wu, Y. Study on the synergy between silica nanoparticles and surfactants for enhanced oil recovery during spontaneous imbibition. J. Mol. Liq. 2018, 261, 373–378. [Google Scholar] [CrossRef]
- Ogolo, N.A.; Olafuyi, O.A.; Onyekonwu, M.O. Enhanced oil recovery using nanoparticles. In Proceedings of the SPE Saudi Arabia Section Technical Symposium and Exhibition, Al-Khobar, Saudi Arabia, 8–11 April 2012; Society of Petroleum Engineers: Richardson, TX, USA. [Google Scholar]
- Rezaei, A.; Riazi, M.; Escrochi, M.; Elhaei, R. Integrating surfactant, alkali and nano-fluid flooding for enhanced oil recovery: A mechanistic experimental study of novel chemical combinations. J. Mol. Liq. 2020, 113106. [Google Scholar] [CrossRef]
- Suleimanov, B.A.; Ismailov, F.S.; Veliyev, E.F. Nanofluid for enhanced oil recovery. J. Pet. Sci. Eng. 2011, 78, 431–437. [Google Scholar] [CrossRef]
- Hendraningrat, L.; Li, S.; Torsaeter, O. Enhancing oil recovery of low-permeability berea sandstone through optimised nanofluids concentration. In Proceedings of the SPE Enhanced Oil Recovery Conference, Kuala Lumpur, Malaysia, 2–4 July 2013; Society of Petroleum Engineers: Richardson, TX, USA. [Google Scholar]
- Asemani, M.; Rabbani, A.R. Detailed FTIR spectroscopy characterization of crude oil extracted asphaltenes: Curve resolve of overlapping bands. J. Pet. Sci. Eng. 2020, 185, 106618. [Google Scholar] [CrossRef]
- Amaefule, J.O.; Altunbay, M.; Tiab, D.; Kersey, D.G.; Keelan, D.K. Enhanced reservoir description: Using core and log data to identify hydraulic (flow) units and predict permeability in uncored intervals/wells. In Proceedings of the SPE Annual Technical Conference and Exhibition, Houston, TX, USA, 3–6 October 1993; Society of Petroleum Engineers: Richardson, TX, USA. [Google Scholar]
- Riazi, Z. Application of integrated rock typing and flow units identification methods for an Iranian carbonate reservoir. J. Pet. Sci. Eng. 2018, 160, 483–497. [Google Scholar] [CrossRef]
- Kadkhodaie-Ilkhchi, A.; Kadkhodaie-Ilkhchi, R. A Review of Reservoir Rock Typing Methods in Carbonate Reservoirs: Relation between Geological, Seismic, and Reservoir Rock Types. Iran. J. Oil Gas. Sci. Technol. 2018, 7, 13–35. [Google Scholar]
- Mirzaei-Paiaman, A.; Sabbagh, F.; Ostadhassan, M.; Shafiei, A.; Rezaee, R.; Saboorian-Jooybari, H.; Chene, Z. A further verification of FZI* and PSRTI: Newly developed petrophysical rock typing indices. J. Pet. Sci. Eng. 2019, 175, 693–705. [Google Scholar] [CrossRef]
- Mirzaei-Paiaman, A.; Ostadhassan, M.; Rezaee, R.; Saboorian-Jooybari, H.; Chen, Z. A new approach in petrophysical rock typing. J. Pet. Sci. Eng. 2018, 166, 445–464. [Google Scholar] [CrossRef]
- Moghadasi, R.; Rostami, A.; Hemmati-Sarapardeh, A. Application of nanofluids for treating fines migration during hydraulic fracturing: Experimental study and mechanistic understanding. Adv. Geo-Energy Res. 2019, 3, 198–206. [Google Scholar] [CrossRef]
- Clogston, J.D.; Patri, A.K. Zeta potential measurement. In Characterization of Nanoparticles Intended for Drug Delivery; Springer: Berlin/Heidelberg, Germany, 2011; pp. 63–70. [Google Scholar]
- Rezvani, H.; Riazi, M.; Tabaei, M.; Kazemzadeh, Y.; Sharifi, M. Experimental investigation of interfacial properties in the EOR mechanisms by the novel synthesized Fe3O4@ Chitosan nanocomposites. Colloids Surfaces A Physicochem. Eng. Asp. 2018, 544, 15–27. [Google Scholar] [CrossRef]
- Idogun, A.K.; Iyagba, E.T.; Ukwotije-Ikwut, R.P.; Aseminaso, A. A review study of oil displacement mechanisms and challenges of nanoparticle enhanced oil recovery. In Proceedings of the SPE Nigeria Annual International Conference and Exhibition, Lagos, Nigeria, 2–4 August 2016; Society of Petroleum Engineers: Richardson, TX, USA. [Google Scholar]
- Huang, T.; Han, J.; Agrawal, G.; Sookprasong, P.A. Coupling nanoparticles with waterflooding to increase water sweep efficiency for high fines-containing reservoir-lab and reservoir simulation results. In Proceedings of the SPE Annual Technical Conference and Exhibition, Houston, TX, USA, 28–30 September 2015; Society of Petroleum Engineers: Richardson, TX, USA. [Google Scholar]
- You, Z.; Aji, K.; Badalyan, A.; Bedrikovetsky, P. Effect of nanoparticle transport and retention in oilfield rocks on the efficiency of different nanotechnologies in oil industry. In Proceedings of the SPE International Oilfield Nanotechnology Conference and Exhibition, Noordwijk, The Netherlands, 12–14 June 2012; Society of Petroleum Engineers: Richardson, TX, USA. [Google Scholar]
- Agi, A.; Junin, R.; Gbadamosi, A. Mechanism governing nanoparticle flow behaviour in porous media: Insight for enhanced oil recovery applications. Int. Nano Lett. 2018, 8, 49–77. [Google Scholar] [CrossRef]
- Sheng, J.J. Enhanced Oil Recovery Field Case Studies: Chapter 19. In Introduction to MEOR and Its Field Applications in China; Elsevier Inc.: Amsterdam, The Netherlands, 2013. [Google Scholar]


| Sample | Depth (m) | Length (mm) | Diameter (mm) | Grain Density (g/cm3) | Porosity (%) | Gas Permeability (mD) | Swi (%) |
|---|---|---|---|---|---|---|---|
| A1 | 3609.42 | 48.12 | 37.43 | 2.70 | 15.73 | 1.51 | 22.58 |
| A2 | 3606.39 | 47.50 | 37.51 | 2.70 | 13.48 | 1.05 | 14.23 |
© 2020 by the authors. Licensee MDPI, Basel, Switzerland. This article is an open access article distributed under the terms and conditions of the Creative Commons Attribution (CC BY) license (http://creativecommons.org/licenses/by/4.0/).
Share and Cite
Rezaei, A.; Abdollahi, H.; Derikvand, Z.; Hemmati-Sarapardeh, A.; Mosavi, A.; Nabipour, N. Insights into the Effects of Pore Size Distribution on the Flowing Behavior of Carbonate Rocks: Linking a Nano-Based Enhanced Oil Recovery Method to Rock Typing. Nanomaterials 2020, 10, 972. https://doi.org/10.3390/nano10050972
Rezaei A, Abdollahi H, Derikvand Z, Hemmati-Sarapardeh A, Mosavi A, Nabipour N. Insights into the Effects of Pore Size Distribution on the Flowing Behavior of Carbonate Rocks: Linking a Nano-Based Enhanced Oil Recovery Method to Rock Typing. Nanomaterials. 2020; 10(5):972. https://doi.org/10.3390/nano10050972
Chicago/Turabian StyleRezaei, Amin, Hadi Abdollahi, Zeinab Derikvand, Abdolhossein Hemmati-Sarapardeh, Amir Mosavi, and Narjes Nabipour. 2020. "Insights into the Effects of Pore Size Distribution on the Flowing Behavior of Carbonate Rocks: Linking a Nano-Based Enhanced Oil Recovery Method to Rock Typing" Nanomaterials 10, no. 5: 972. https://doi.org/10.3390/nano10050972
APA StyleRezaei, A., Abdollahi, H., Derikvand, Z., Hemmati-Sarapardeh, A., Mosavi, A., & Nabipour, N. (2020). Insights into the Effects of Pore Size Distribution on the Flowing Behavior of Carbonate Rocks: Linking a Nano-Based Enhanced Oil Recovery Method to Rock Typing. Nanomaterials, 10(5), 972. https://doi.org/10.3390/nano10050972