Developmental Neurotoxicity Screening for Nanoparticles Using Neuron-Like Cells of Human Umbilical Cord Mesenchymal Stem Cells: Example with Magnetite Nanoparticles


Abstract
:1. Introduction
2. Materials and Methods
2.1. Chemicals and Reagents
2.2. Apparatus
2.3. Human Primary Neuronal Cells: Neuronal Induction from Mesenchymal Stem Cells Derived from Human Umbilical Cord
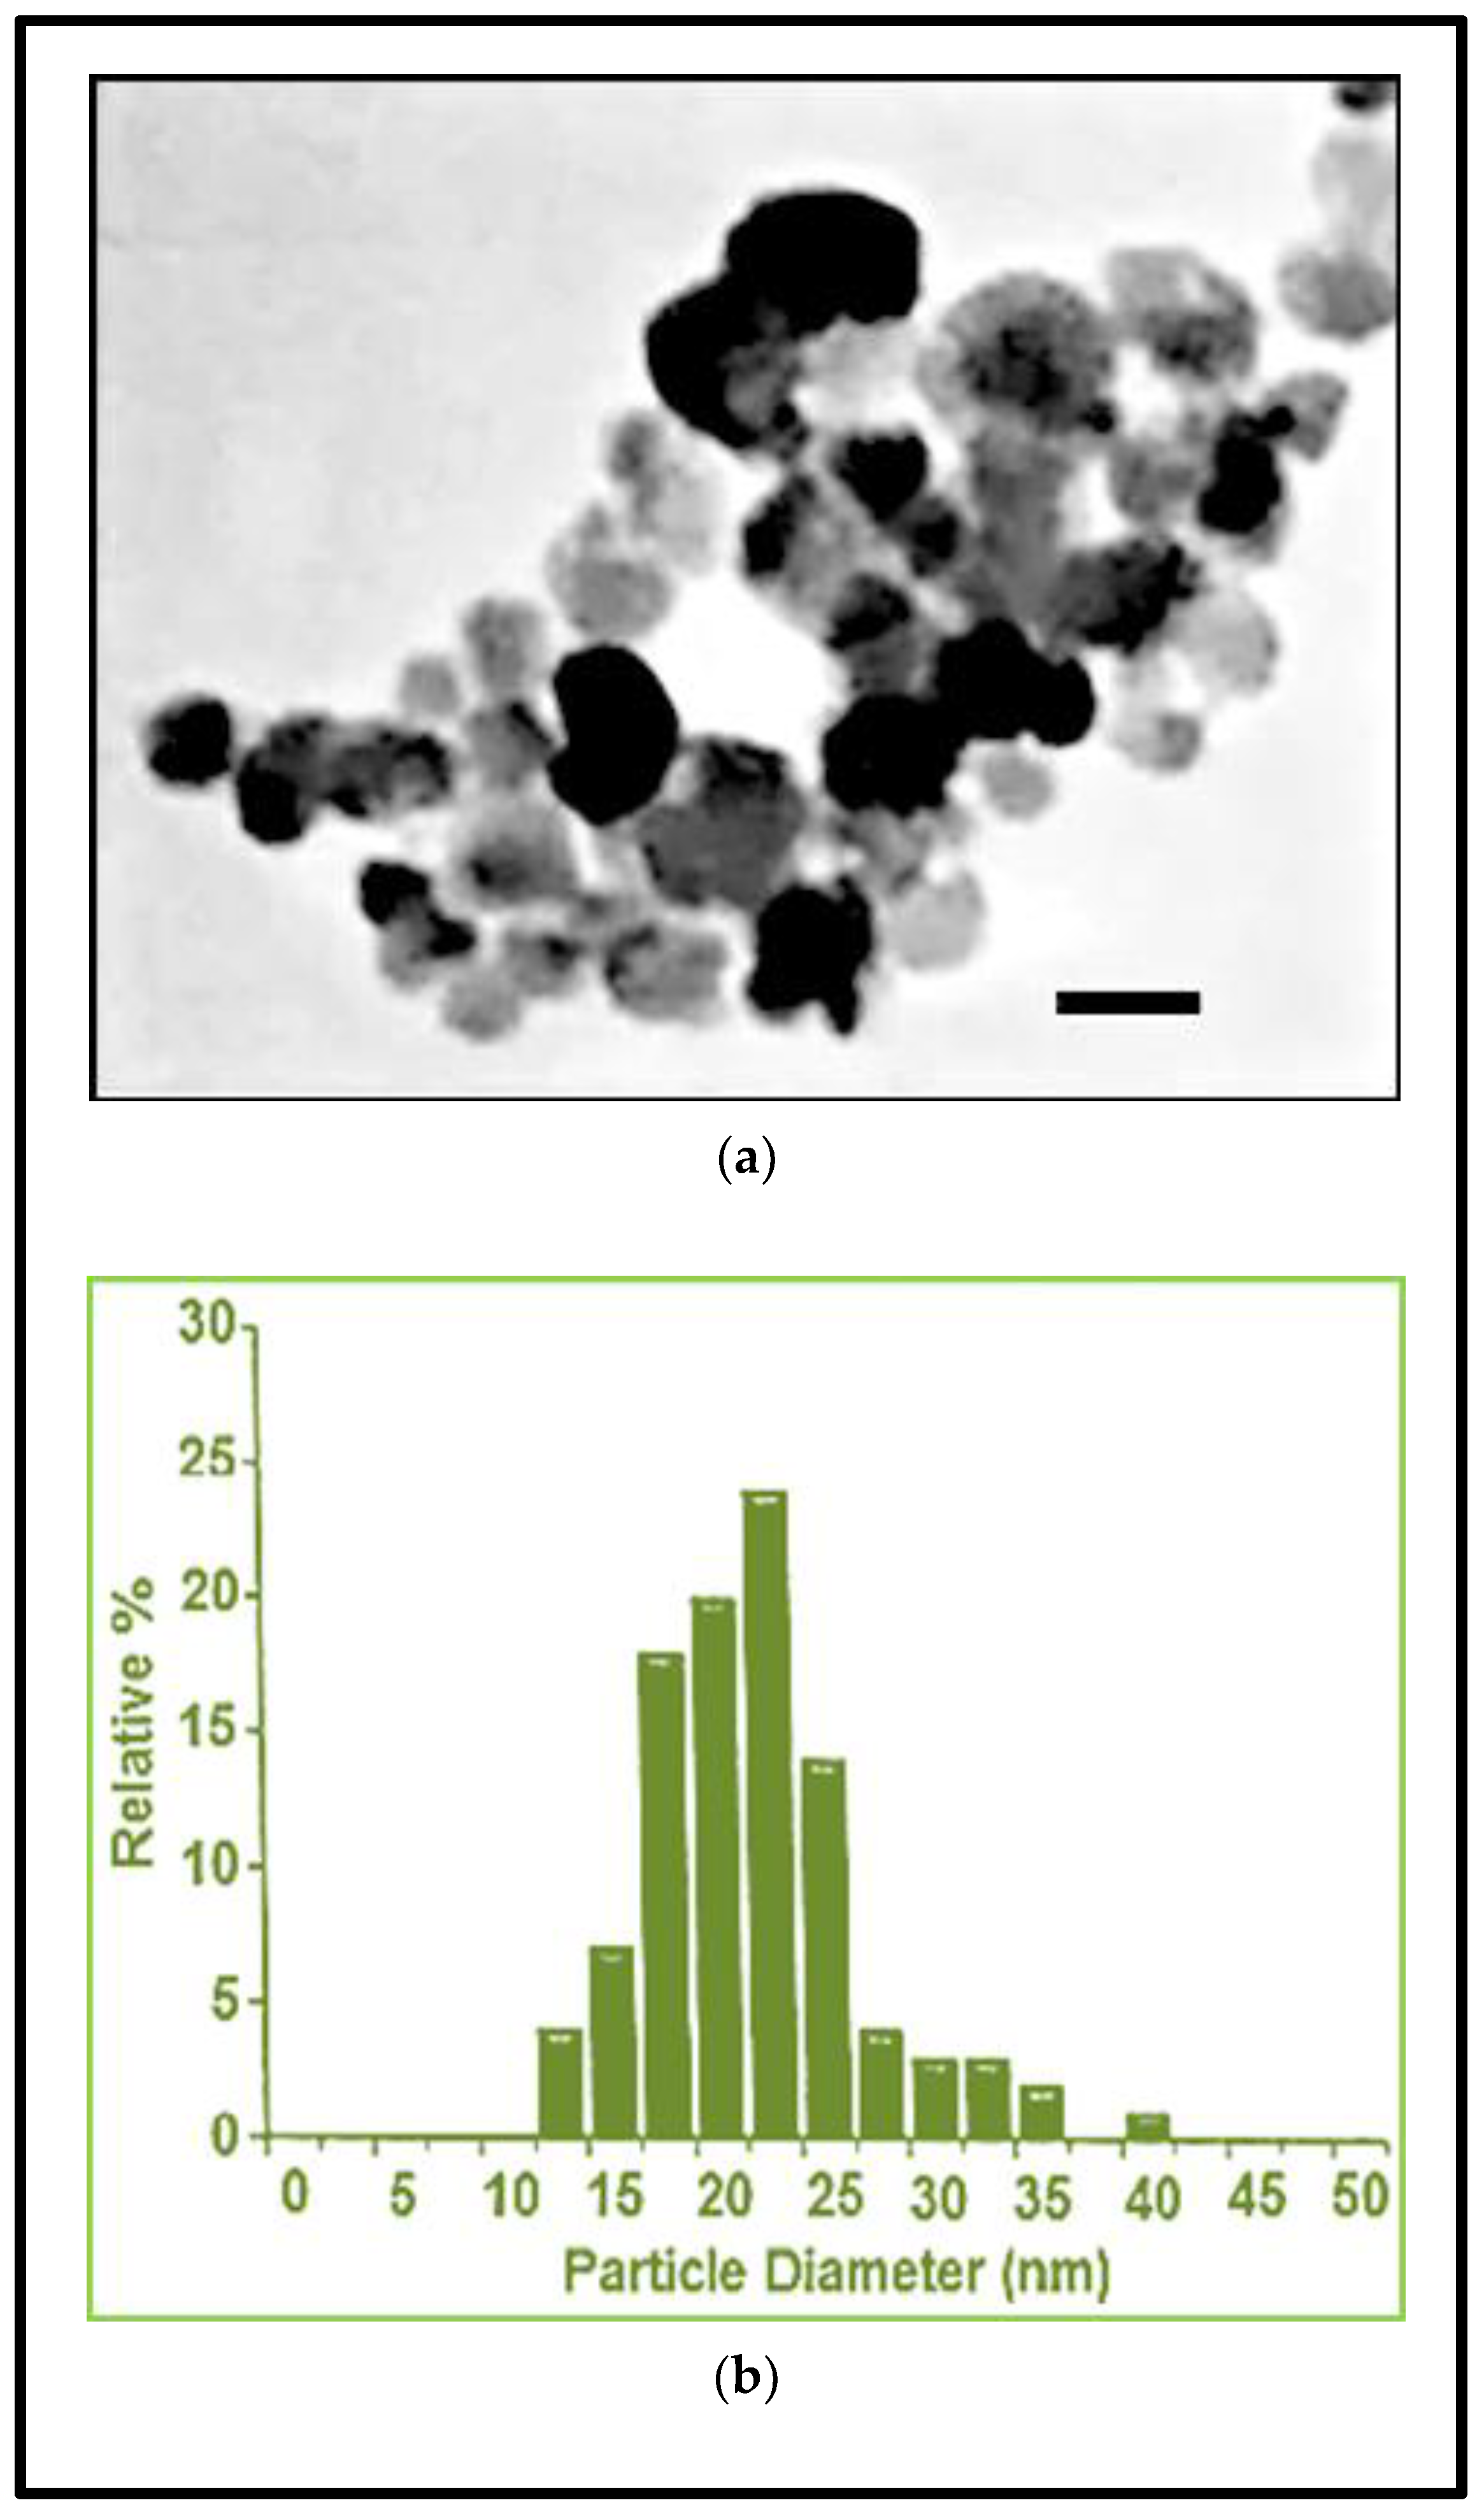
2.4. Fe3O4NPs Stock Suspension
2.5. Fe3O4NPs Exposure
2.6. Intracellular Fe3O4NPs Detected by Perls’ Prussian Blue Staining
2.7. Neuronal Induction Evaluation
2.7.1. Morphological Analysis by Light Phase-Contrast Microscopy
2.7.2. Neuronal Markers
Expression by Immunofluorescence Analysis
Expression by Flow Cytometry Analysis
2.8. ATP Evaluation by CellTiter-Glo® 3D Assay
2.9. Cytotoxicity Assay (Dead Cells)
2.10. Caspase Activity
2.11. Statistical Analysis
3. Results
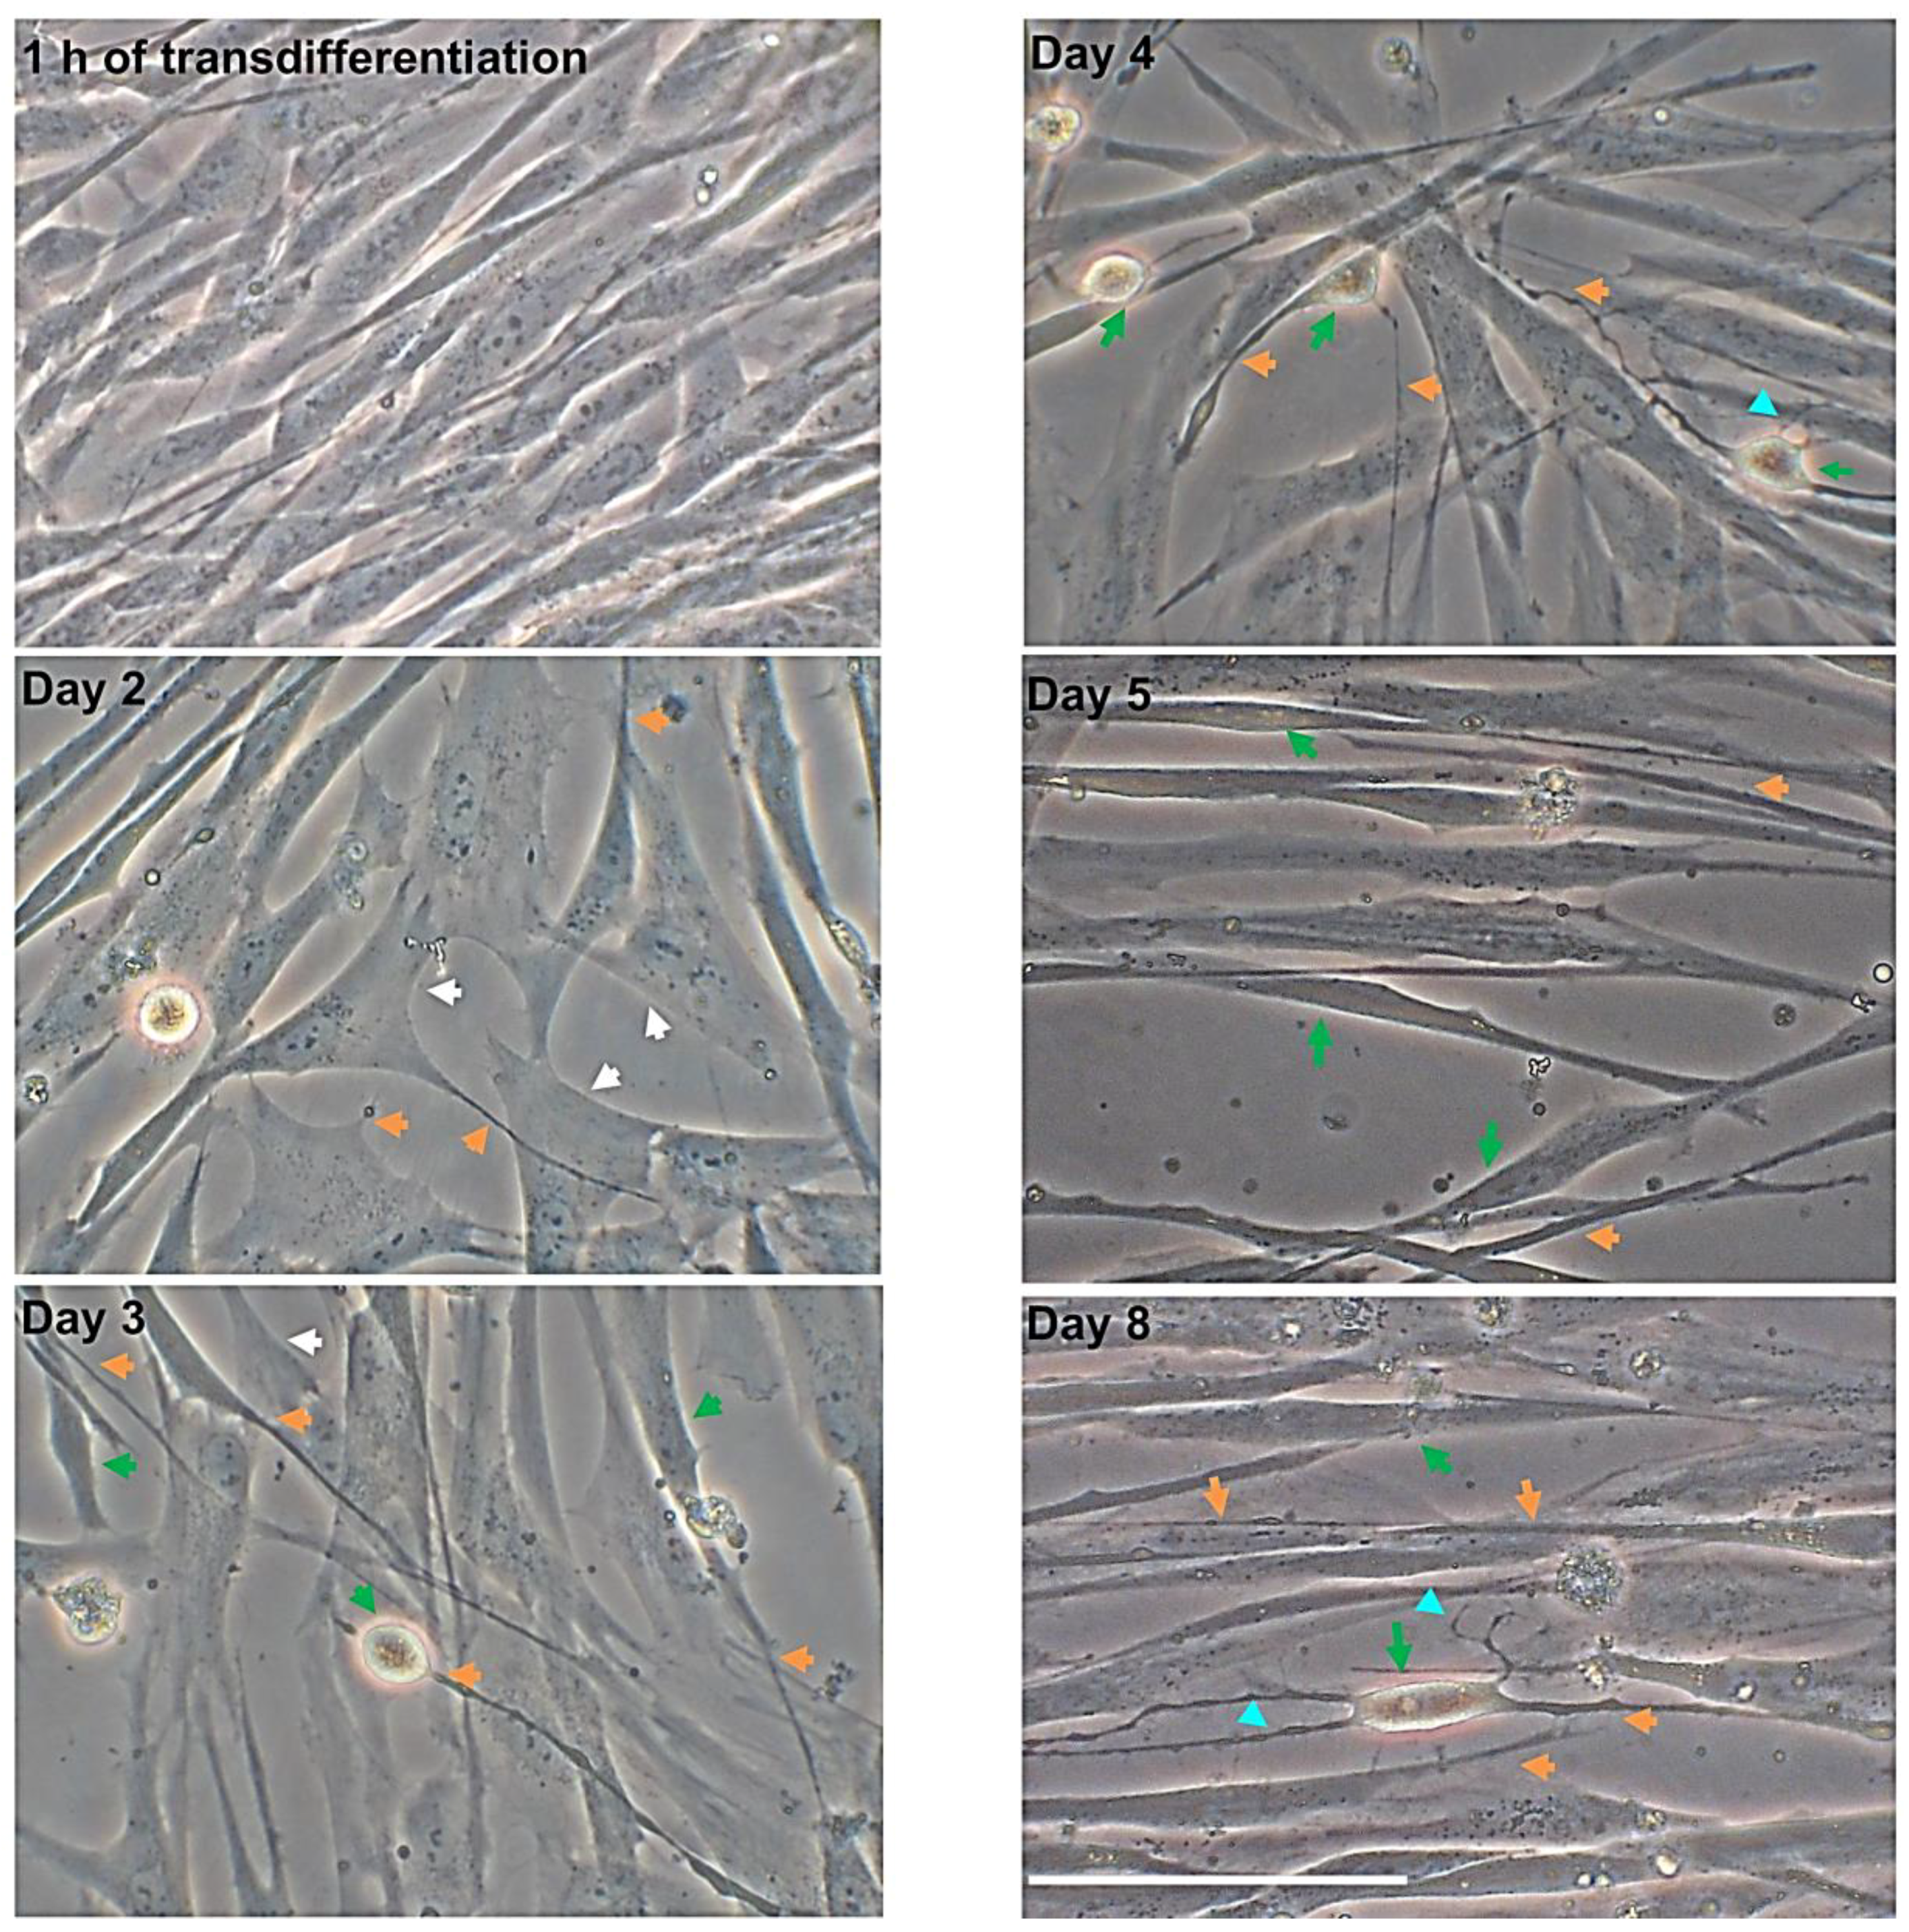
3.1. Morphological Changes over Time after Neuronal Induction
3.1.1. hNLCs Untreated
3.1.2. hNLCs Exposed to Fe3O4NPs
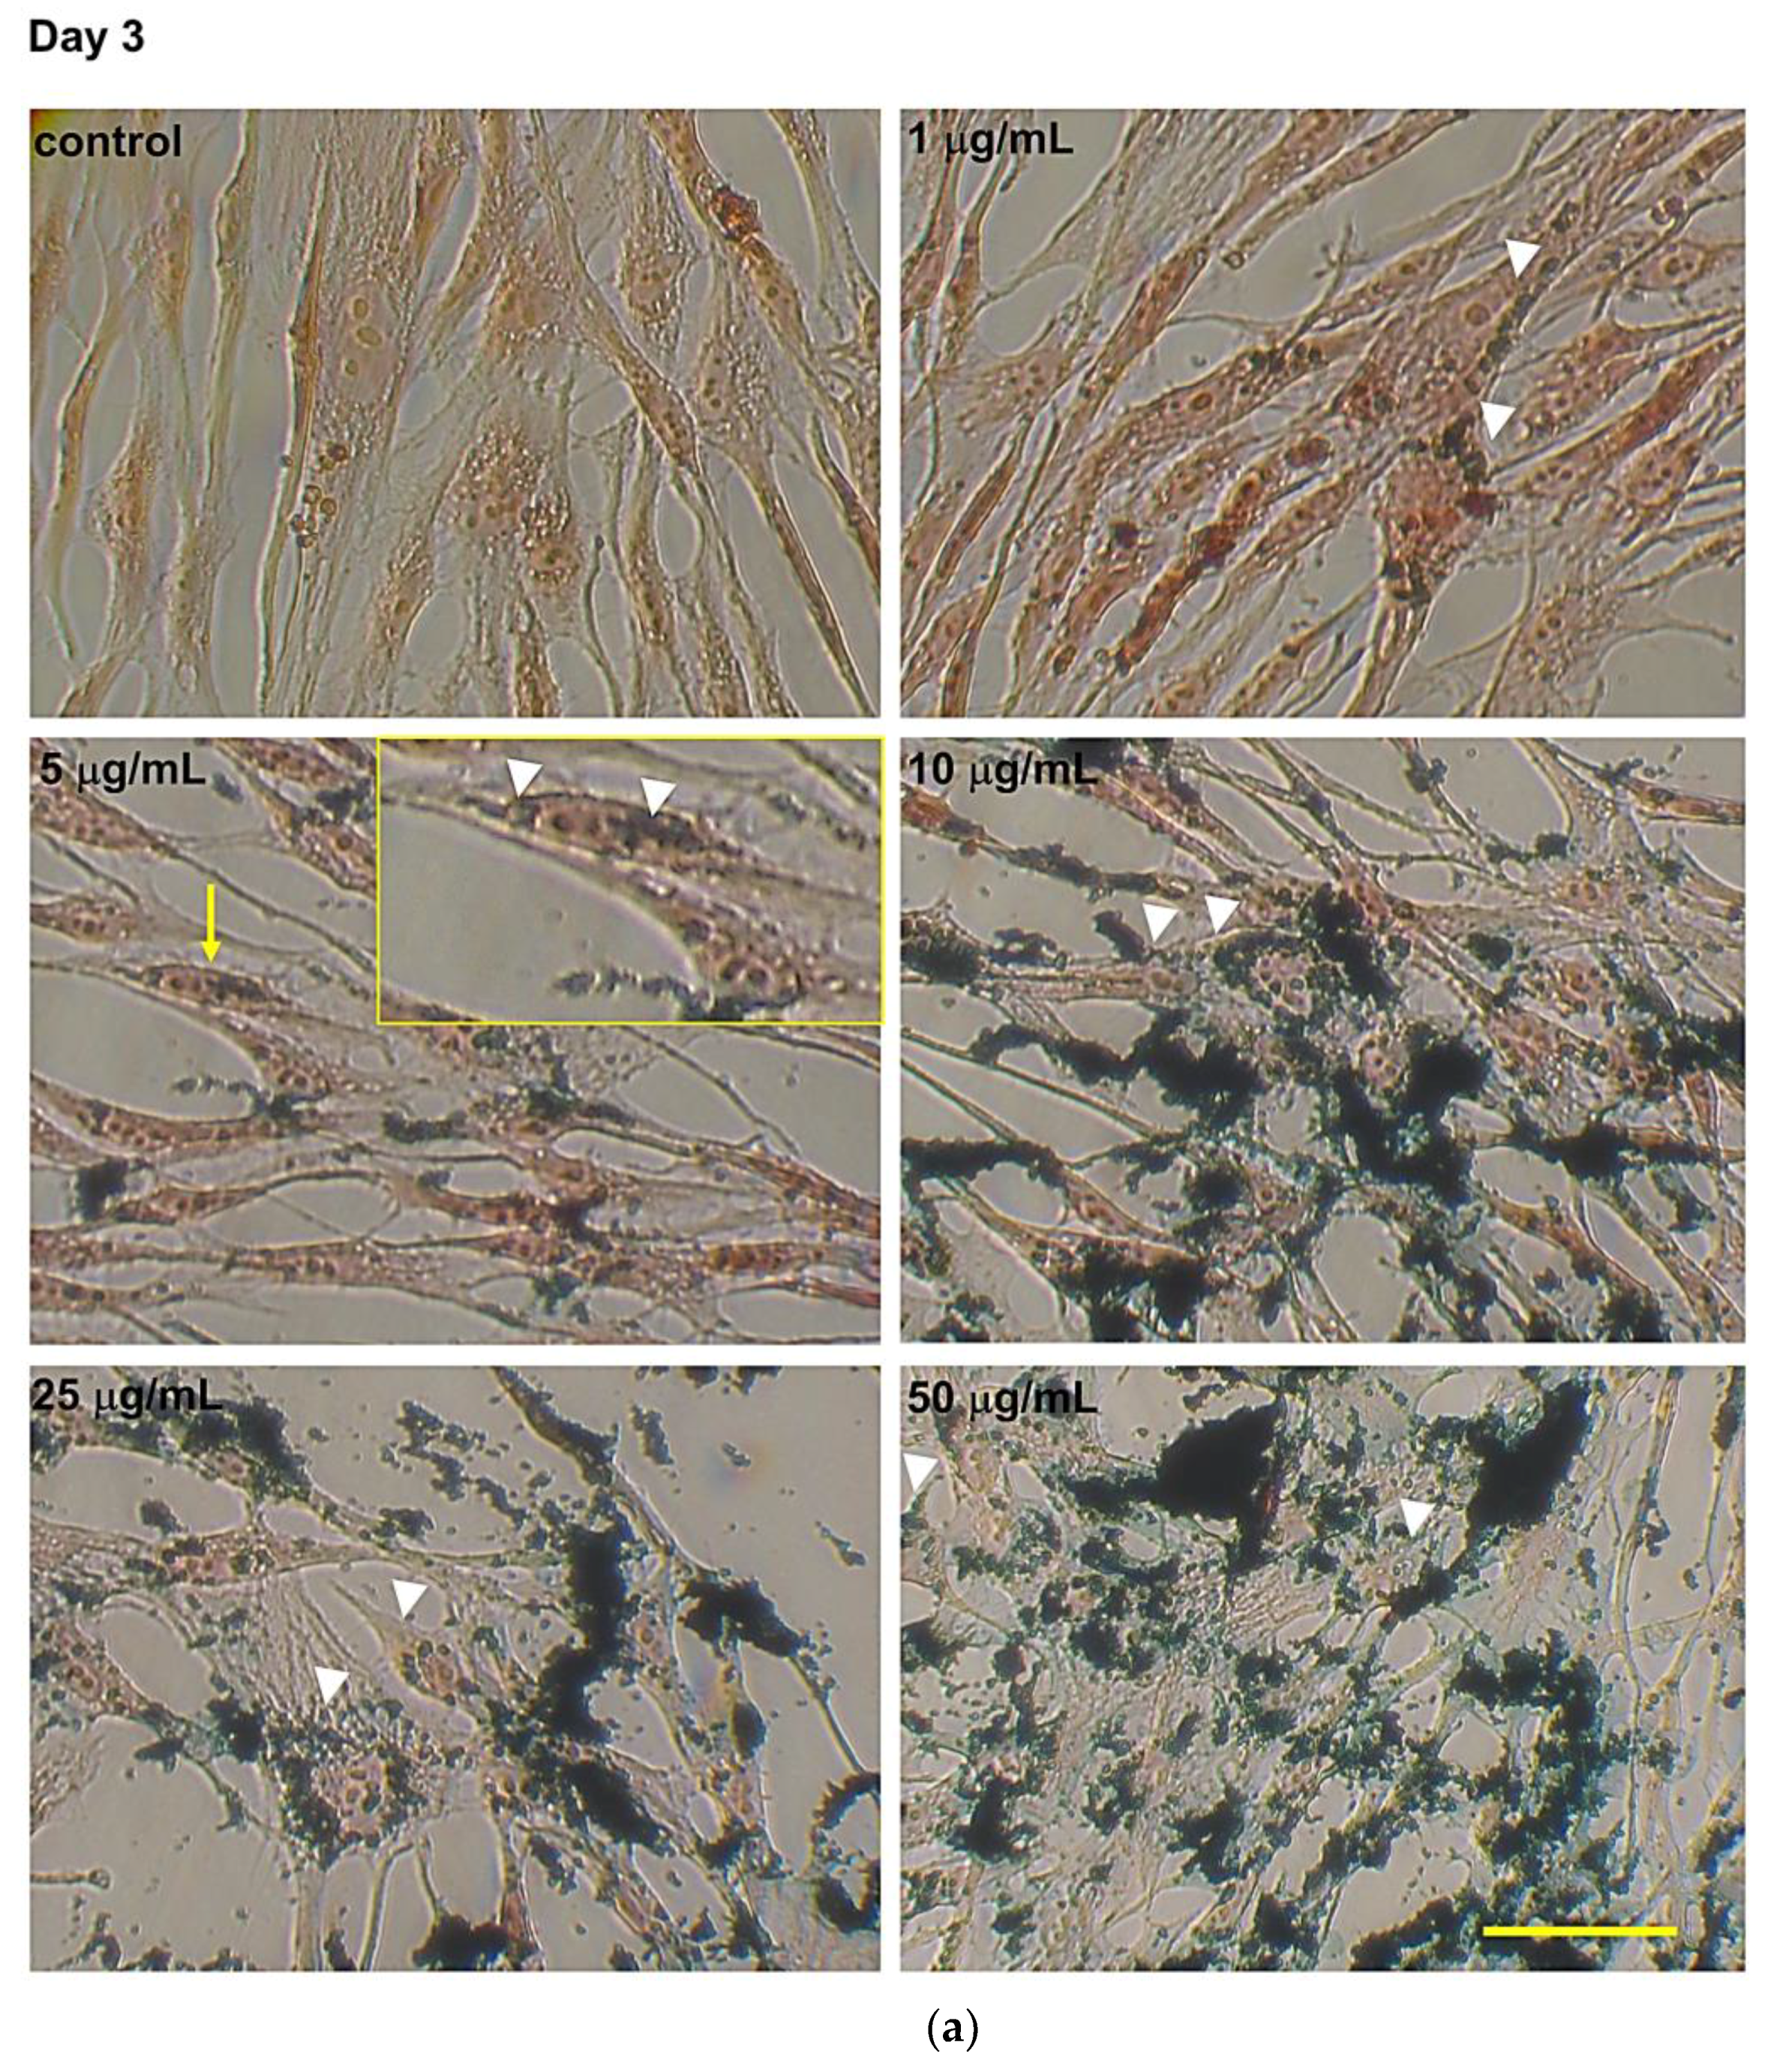
3.2. Intracellular Fe3O4 Nanoparticle Evaluation by Perls’ Prussian Blue Staining
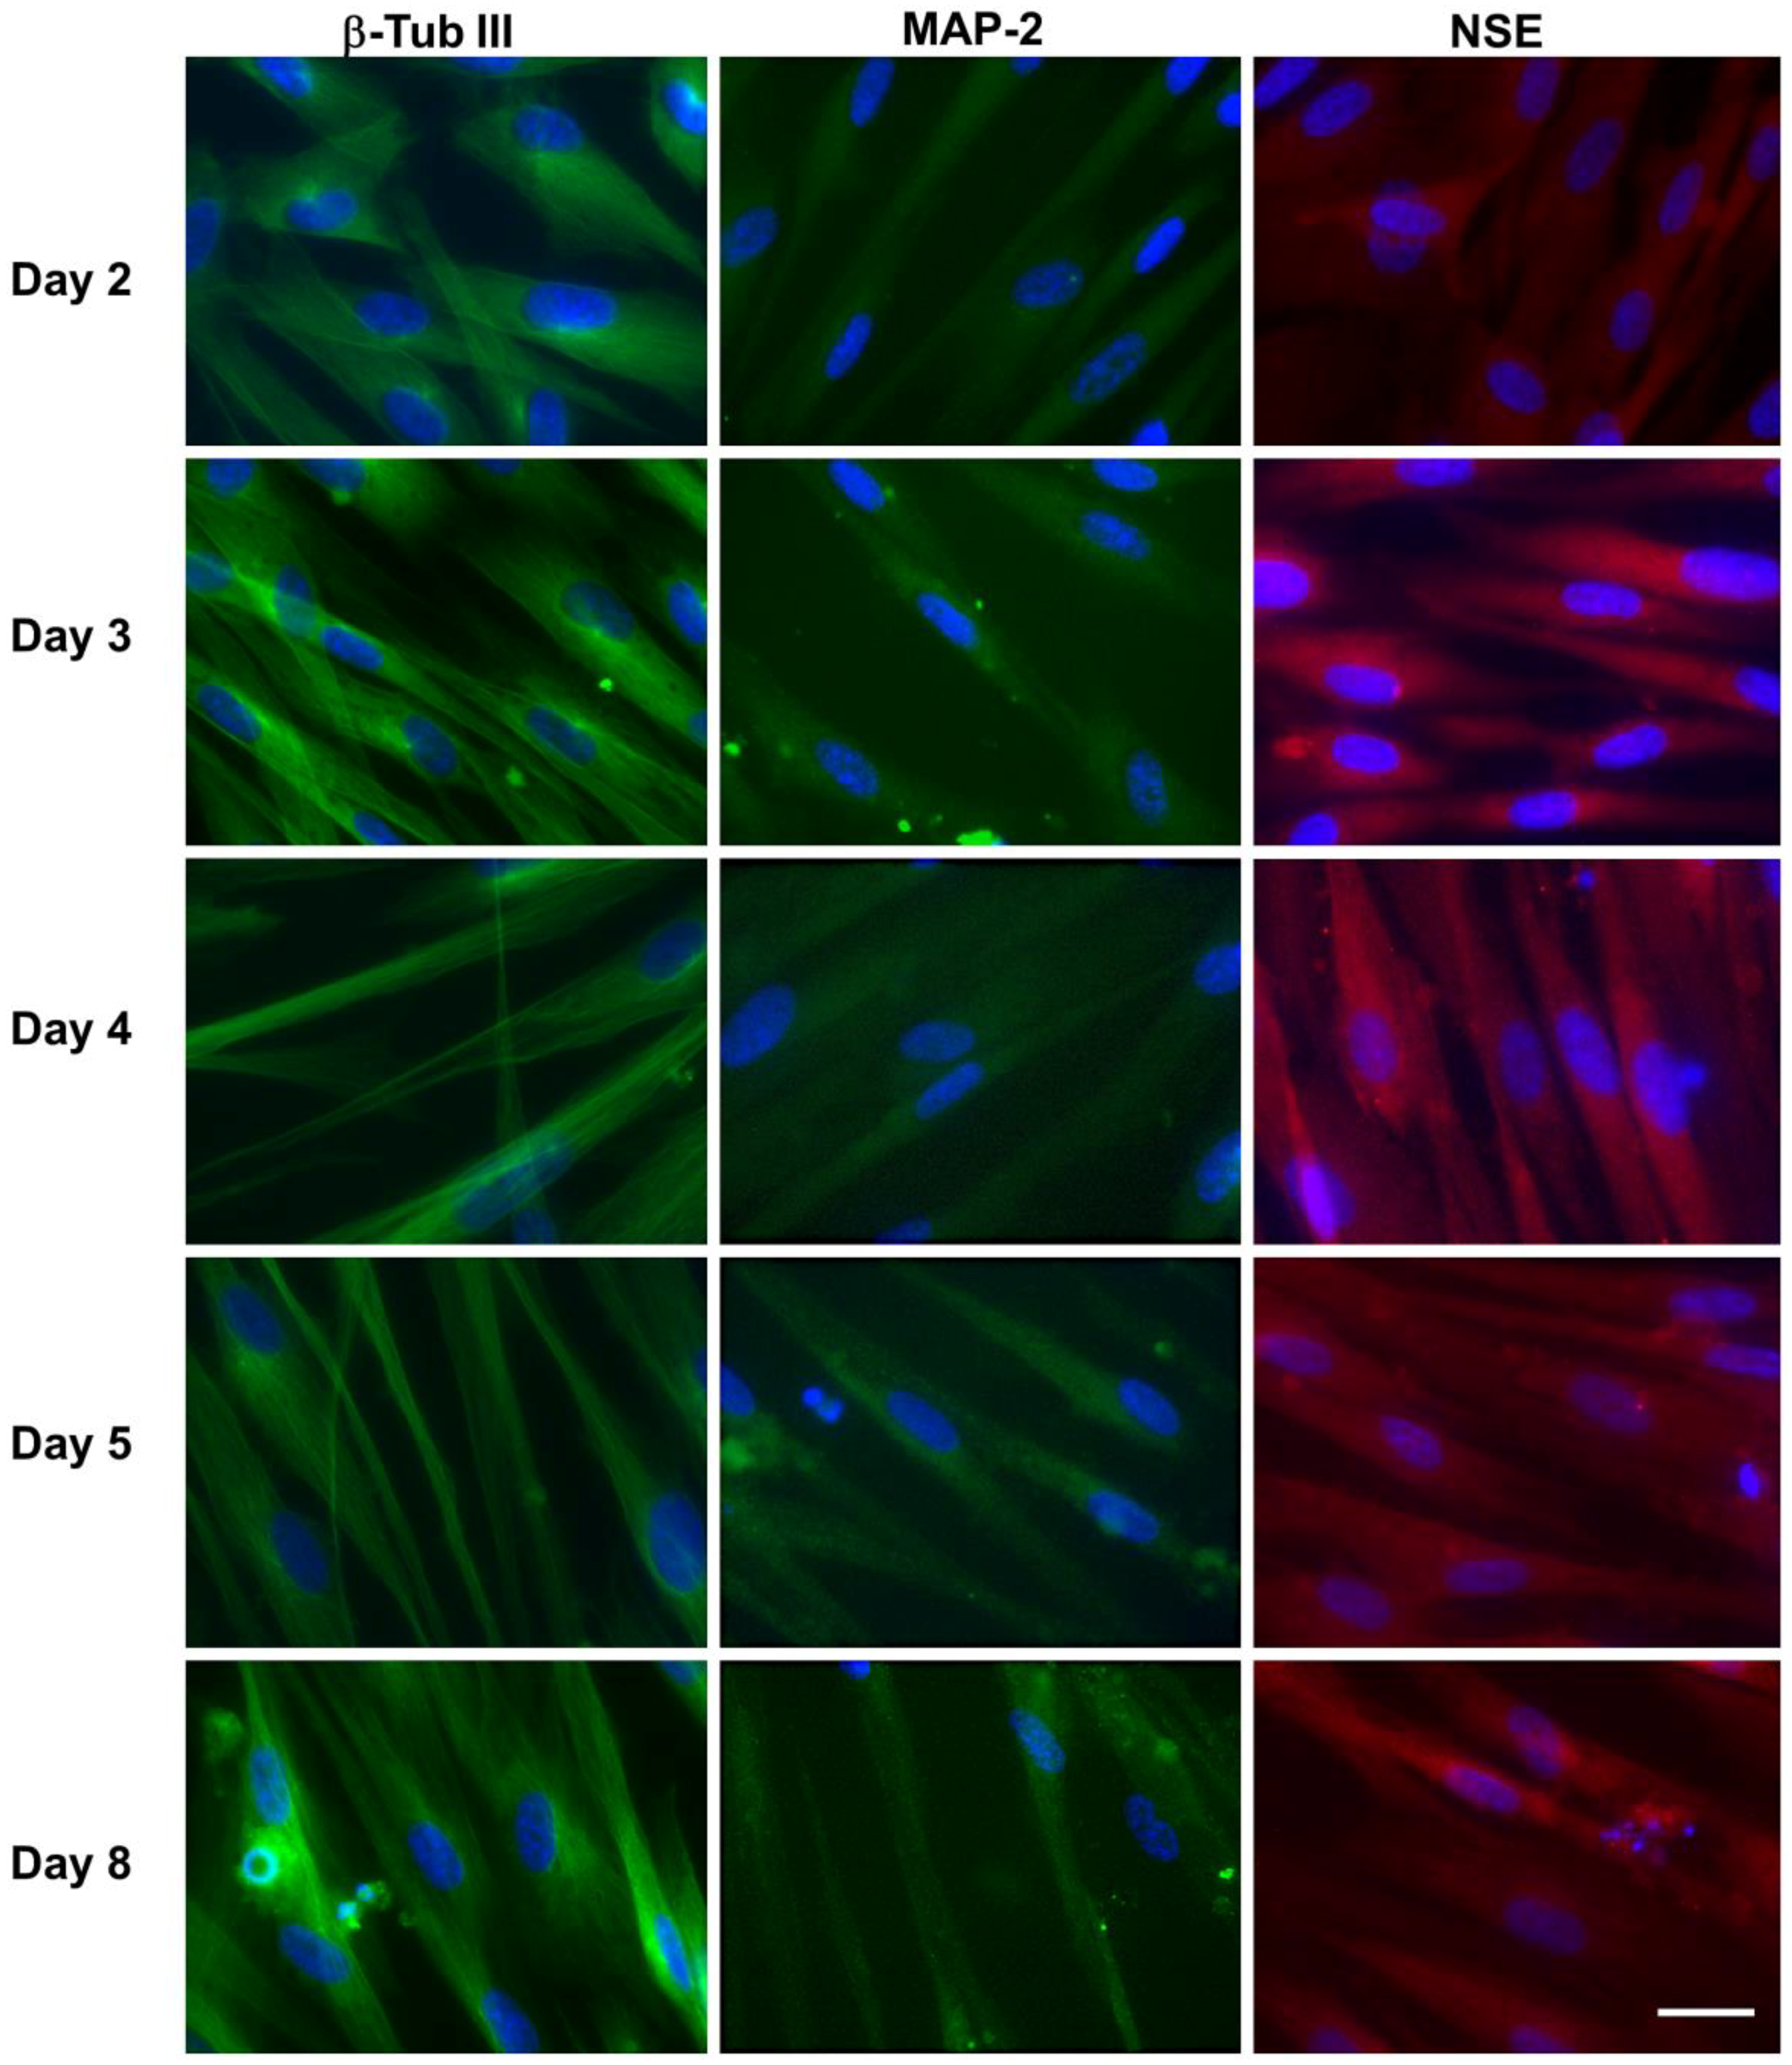
3.3. Expression of Neural Markers
3.3.1. hNLCs Untreated
Evaluation by Immunofluorescence Staining
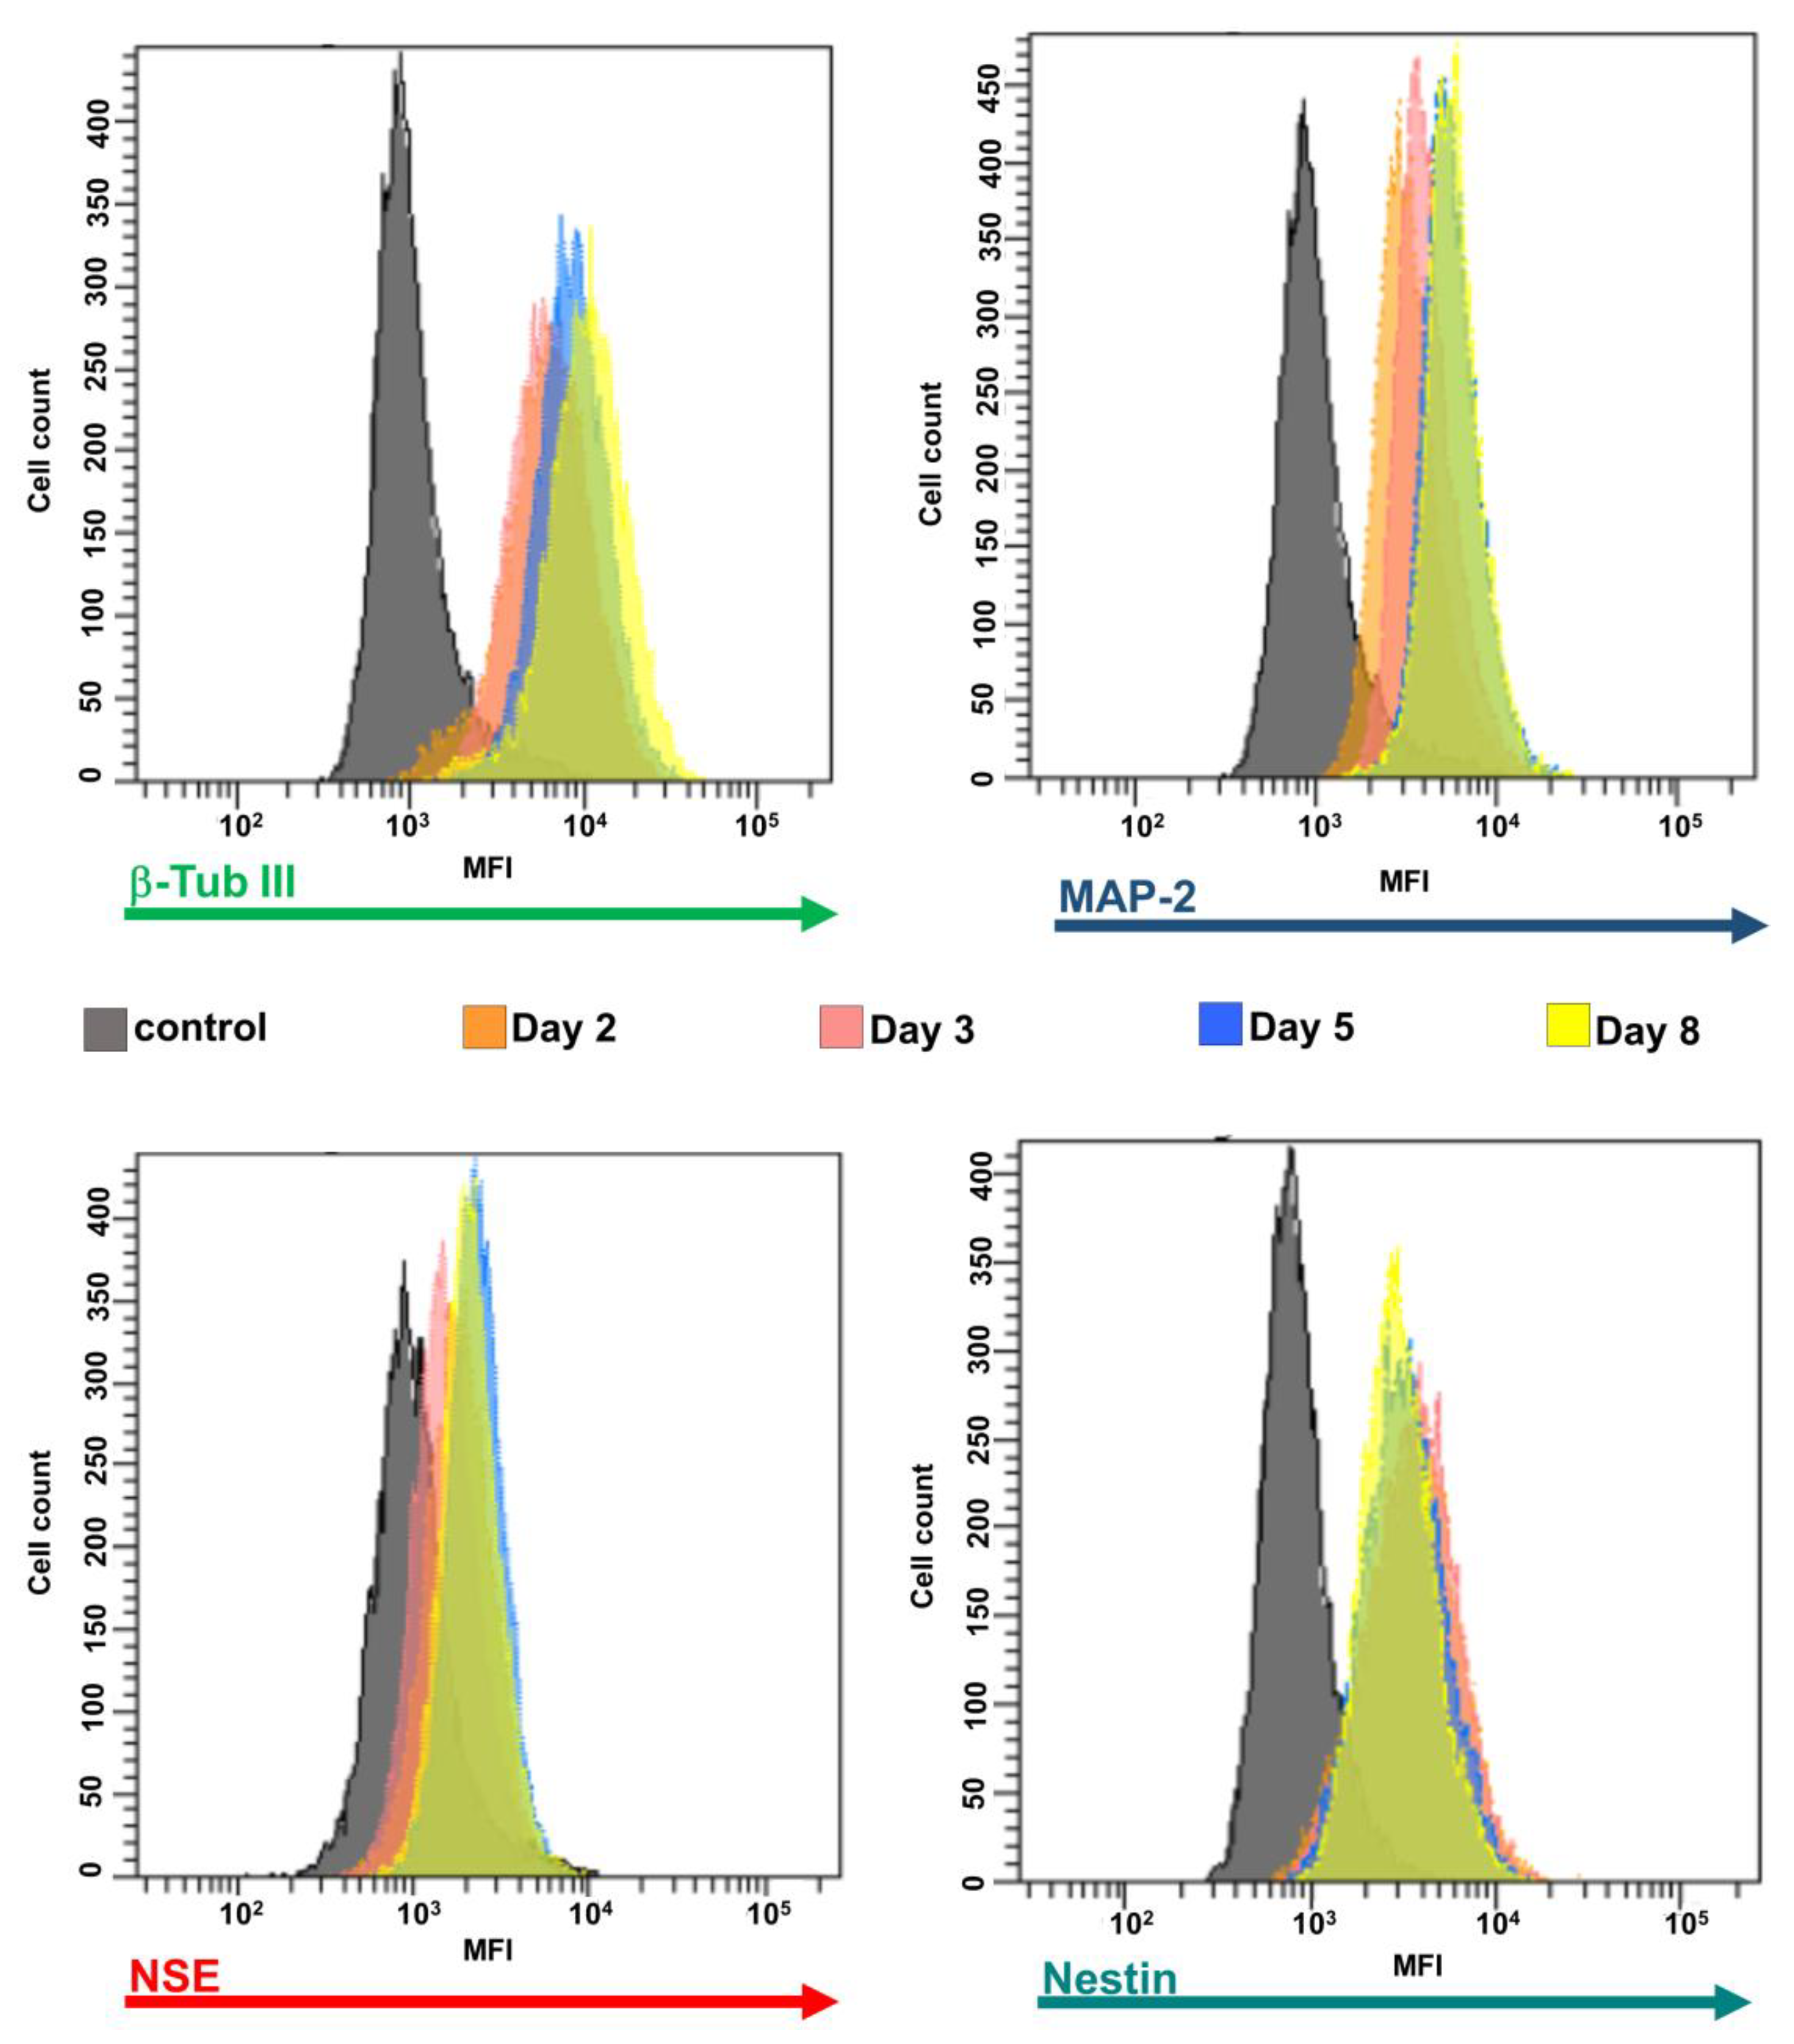
Evaluation by Flow Cytometry
3.3.2. hNLCs Exposed to Fe3O4NPs
Evaluation by Immunofluorescence Staining
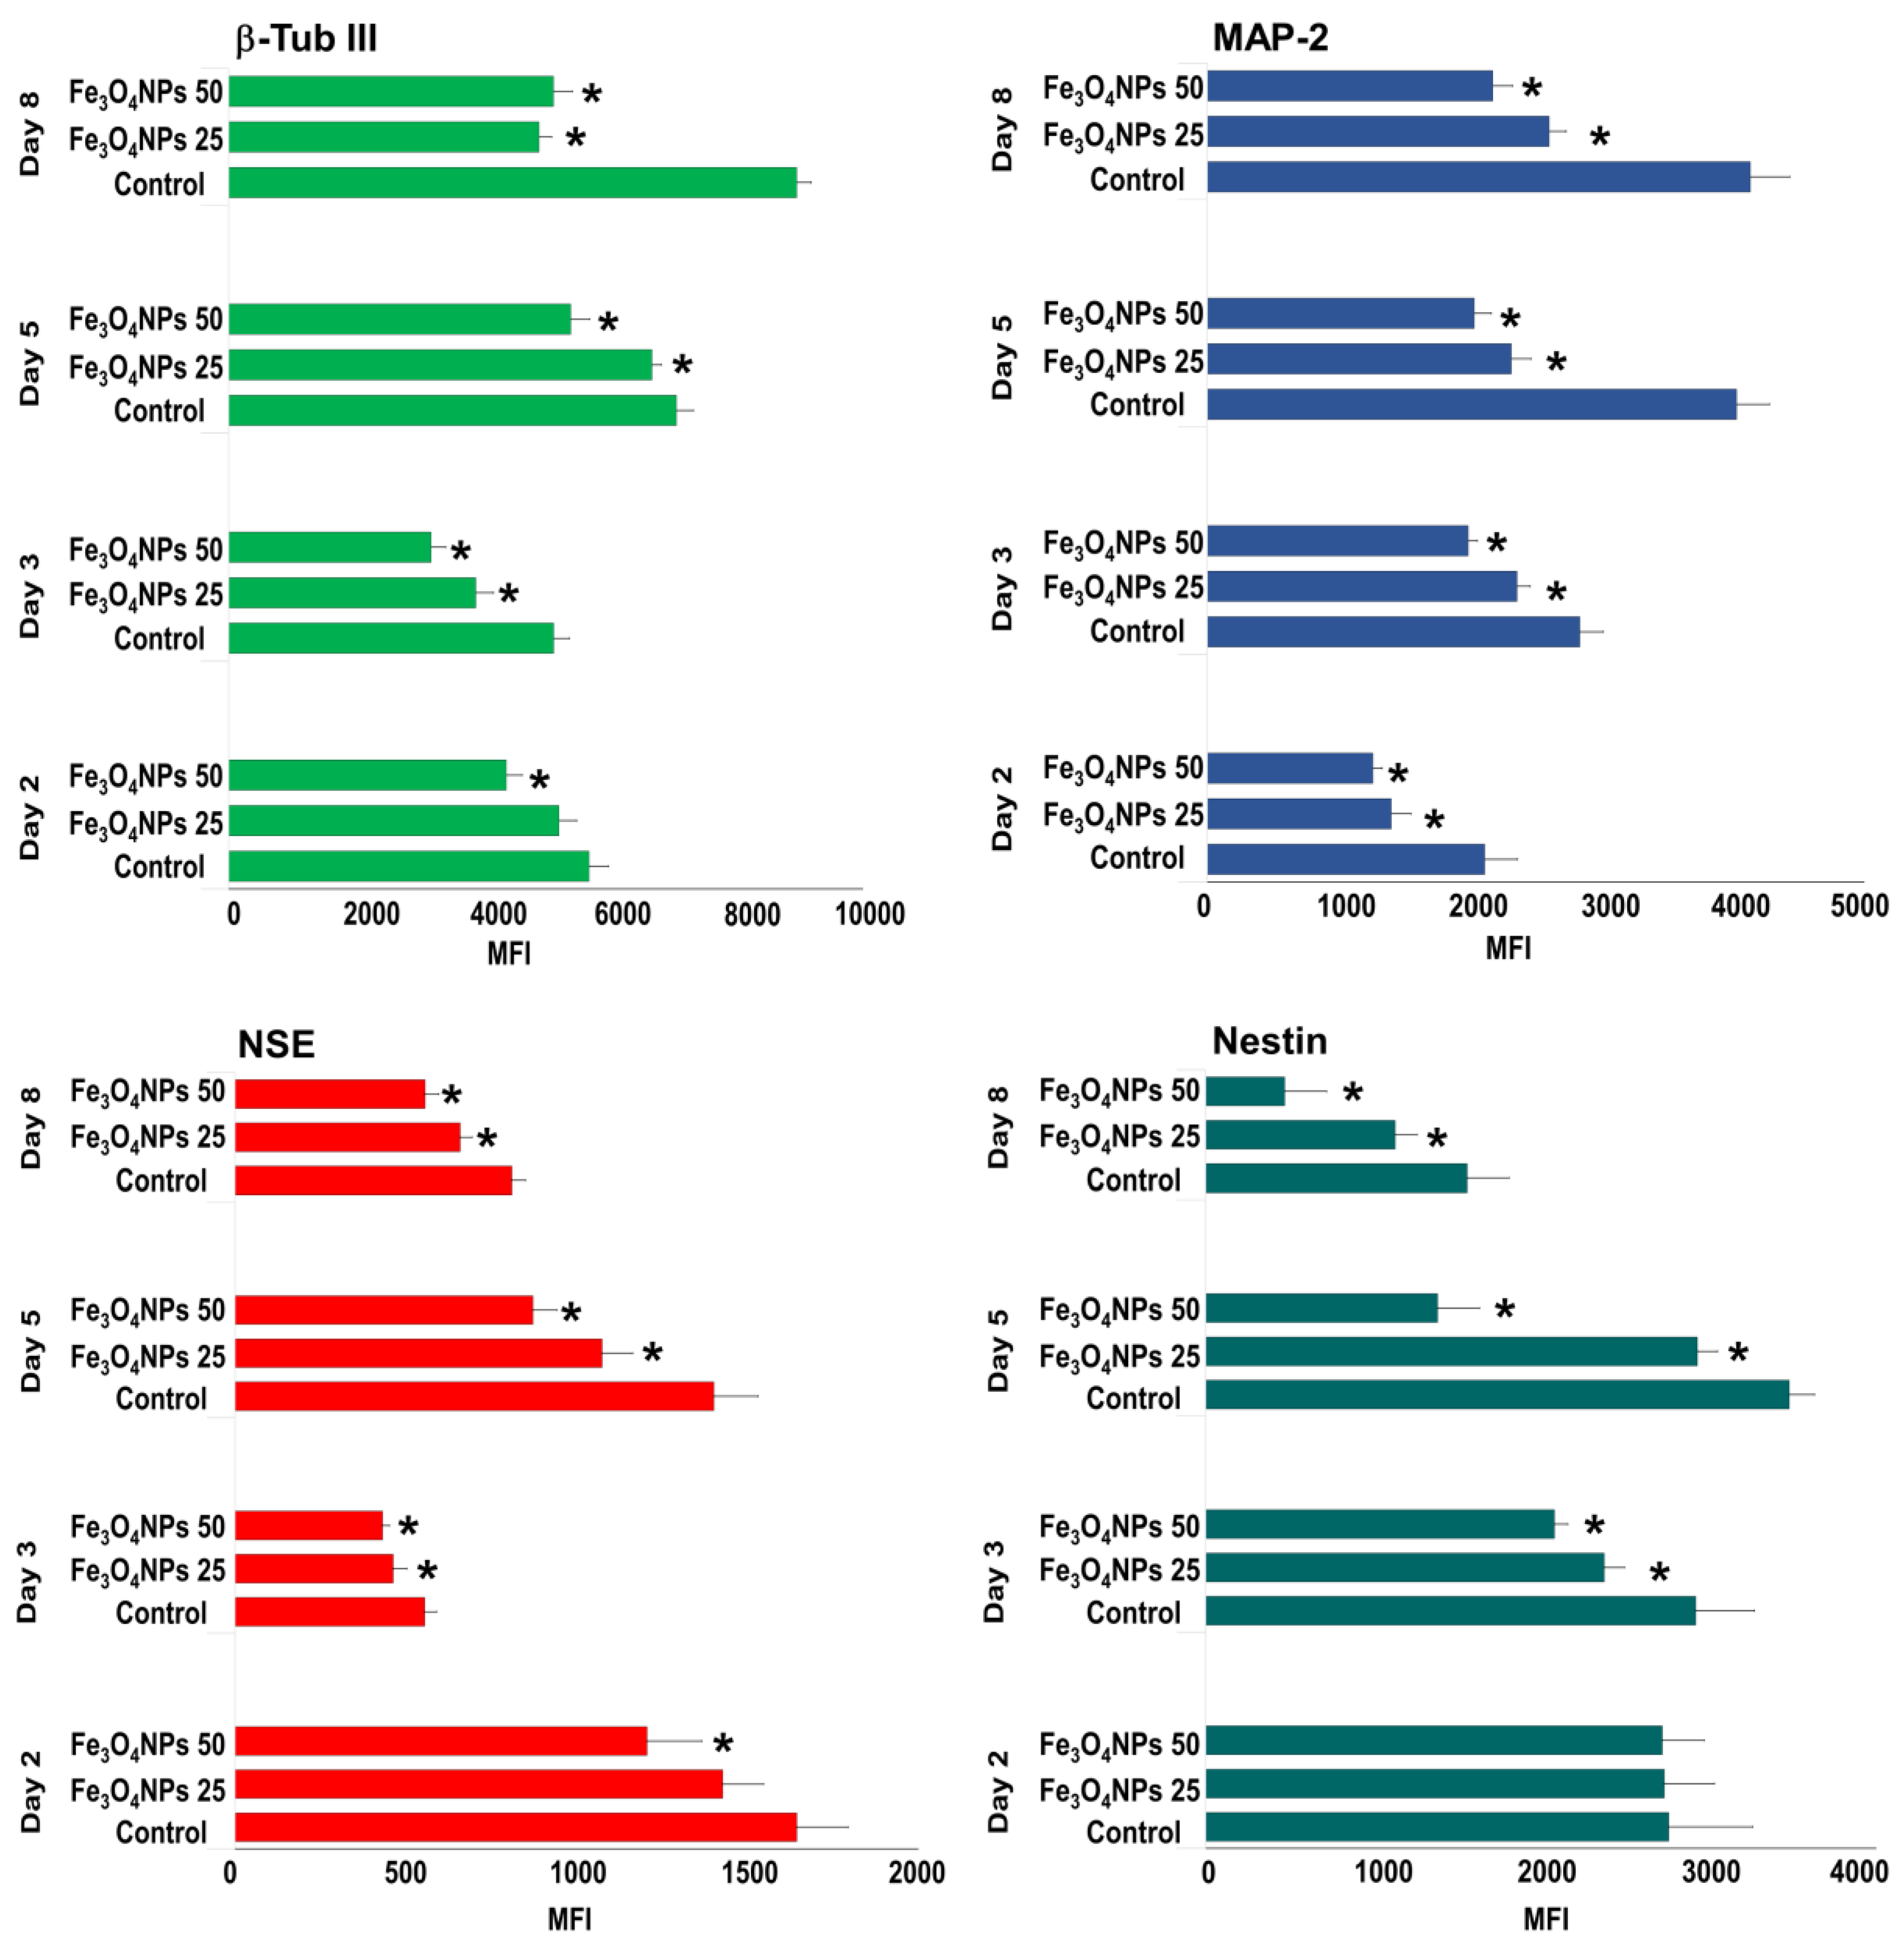
Evaluation by Flow Cytometry
3.4. ATP Content Evaluation during Differentiation Process after Fe3O4NPs Exposure
3.5. Cytotoxicity Evaluation
3.6. Evaluation of Caspase-3/7 Activity
4. Discussion
5. Conclusions
Supplementary Materials
Author Contributions
Funding
Conflicts of Interest
References
- Bencsik, A.; Lestaeve, L.P.; Guseva Canu, I. Nano- and neurotoxicology: An emerging discipline. Prog. Neurobiol. 2018, 160, 45–63. [Google Scholar] [CrossRef] [Green Version]
- Semmler-Behnke, M.; Fertsch, S.; Schmid, G.; Wenk, A.; Kreyling, W.G. Uptake of 1.4 nm versus 18 nm gold nanoparticles in secondary target organs is size dependent in control and pregnant rats after intratracheal or intravenous application. Proc. EuroNanoForum. 2007, 2007, 19–21. [Google Scholar]
- Takeda, K.; Suzuki, K.I.; Ishihara, A.; Kubo-Irie, M.; Fujimoto, R.; Tabata, M.; Oshio, S.; Nihei, Y.; Ihara, T.; Sugamata, M. Nanoparticles transferred from pregnant mice to their offspring can damage the genital and cranial nerve systems. J. Health Sci. 2009, 55, 95–102. [Google Scholar] [CrossRef] [Green Version]
- Chu, M.; Wu, Q.; Yang, H.; Yuan, R.; Hou, S.; Yang, Y.; Zou, Y.; Xu, S.; Xu, K.; Ji, A.; et al. Transfer of quantum dots from pregnant mice to pups across the placental barrier. Small 2010, 6, 670–678. [Google Scholar] [CrossRef]
- Sumner, S.C.; Fennell, T.R.; Snyder, R.W.; Taylor, G.F.; Lewin, A.H. Distribution of carbon-14 labeled C60 ([14C] C60) in the pregnant and in the lactating dam and the effect of C60 exposure on the biochemical profile of urine. J. Appl. Toxicol. 2010, 30, 354–360. [Google Scholar] [CrossRef]
- Refuerzo, J.S.; Godin, B.; Bishop, K.; Srinivasan, S.; Shah, S.K.; Amra, S.; Ramin, S.M.; Ferrari, M. Size of the nanovectors determines the transplacental passage in pregnancy: Study in rats. Am. J. Obstet. Gynecol. 2011, 204, 546.e5–546.e9. [Google Scholar] [CrossRef] [PubMed] [Green Version]
- Yamashita, K.; Yoshioka, Y.; Higashisaka, K.; Mimura, K.; Morishita, Y.; Nozaki, M.; Yoshida, T.; Ogura, T.; Nabeshi, H.; Nagano, K.; et al. Silica and titanium dioxide nanoparticles cause pregnancy complications in mice. Nat. Nanotechnol. 2011, 6, 321–328. [Google Scholar] [CrossRef] [PubMed]
- Kloet, S.K.; Walczak, A.P.; Louisse, J.; van den Berg, H.H.J.; Bouwmeester, H.; Tromp, P.; Fokkink, R.G.; Rietjens, I.M.C.M. Translocation of positively and negatively charged polystyrene nanoparticles in an in vitro placental model. Toxicol. Vitr. 2015, 29, 1701–1710. [Google Scholar] [CrossRef] [PubMed] [Green Version]
- Braakhuis, H.M.; Kloet, S.K.; Kezic, S.; Kuper, F.; Park, M.V.; Bellmann, S.; van der Zande, M.; Le Gac, S.; Krystek, P.; Peters, R.J.; et al. Bouwmeester, H. Progress and future of in vitro models to study translocation of nanoparticles. Arch. Toxicol. 2015, 89, 1469–1495. [Google Scholar] [CrossRef] [PubMed] [Green Version]
- Wick, P.; Malek, A.; Manser, P.; Meili, D.; Maeder-Althaus, X.; Diener, L.; Zisch, A.; Krug, H.F.; von Mandach, U. Barrier capacity of human placenta for nanosized materials. Environ. Health Perspect. 2010, 118, 432–436. [Google Scholar] [CrossRef] [PubMed]
- Xu, L.; Dan, M.; Shao, A.; Cheng, X.; Zhang, C.; Yokel, R.A.; Takemura, T.; Hanagata, N.; Niwa, M.; Watanabe, D. Silver nanoparticles induce tight junction disruption and astrocyte neurotoxicity in a rat blood-brain barrier primary triple coculture model. Int. J. Nanomed. 2015, 10, 6105–6118. [Google Scholar] [CrossRef] [Green Version]
- Song, B.; Zhou, T.; Liu, J.; Shao, L. Involvement of programmed cell death in neurotoxicity of metallic nanoparticles: Recent advances and future perspectives. Nanoscale Res. Lett. 2016, 11, 484. [Google Scholar] [CrossRef] [PubMed] [Green Version]
- Disdier, C.; Chalansonnet, M.; Gagnaire, F.; Gaté, L.; Cosnier, F.; Devoy, J.; Saba, W.; Lund, A.K.; Brun, E.; Mabondzo, A. Brain inflammation, blood brain barrier dysfunction and neuronal synaptophysin decrease after inhalation exposure to titanium dioxide nano-aerosol in aging rats. Sci. Rep. 2017, 7, 12196. [Google Scholar] [CrossRef] [PubMed]
- Brohi, R.D.; Wang, L.; Talpur, H.S.; Wu, D.; Khan, F.A.; Bhattarai, D.; Rehman, Z.U.; Farmanullah, F.; Huo, L.J. Toxicity of nanoparticles on the reproductive system in animal models: A review. Front. Pharmacol. 2017, 8, 606. [Google Scholar] [CrossRef]
- Powers, C.M.; Bale, A.S.; Kraft, A.D.; Makris, S.L.; Trecki, J.; Cowden, J.; Hotchkiss, A.; Gillespie, P.A. Developmental neurotoxicity of engineered nanomaterials: Identifying research needs to support human health risk assessment. Toxicol. Sci. 2013, 134, 225–242. [Google Scholar] [CrossRef] [Green Version]
- Hartung, T. Food for Thought on Alternative Methods for Nanoparticle Safety Testing. ALTEX 2010, 27, 87–95. [Google Scholar] [CrossRef] [Green Version]
- Liu, W.; Deng, Y.; Liu, Y.; Gong, W.; Deng, W. Stem cell models for drug discovery and toxicology studies. J. Biochem. Mol. Toxicol. 2013, 27, 17–27. [Google Scholar] [CrossRef]
- Hazeltine, L.B.; Selekman, J.A.; Palecek, S.P. Engineering the human pluripotent stem cell microenvironment to direct cell fate. Biotechnol. Adv. 2013, 31, 1002–1019. [Google Scholar] [CrossRef] [Green Version]
- Lu, D.; Chen, E.Y.; Lee, P.; Wang, Y.C.; Ching, W.; Markey, C.; Gulstrom, C.; Chen, L.C.; Nguyen, T.; Chin, W.C. Accelerated neuronal differentiation toward motor neuron lineage from human embryonic stem cell line (H9). Tissue Eng. Part C Methods 2015, 21, 242–252. [Google Scholar] [CrossRef] [Green Version]
- Ferroni, L.; Gardin, C.; Tocco, I.; Epis, R.; Casadei, A.; Vindigni, V.; Mucci, G.; Zavan, B. Potential for neural differentiation of mesenchymal stem cells. In Mesenchymal Stem Cells-Basics and Clinical Application I; Springer: Berlin, Heidelberg, 2013; Volume 129, pp. 89–115. [Google Scholar]
- Mostafavi, F.S.; Razavi, S.; Mardani, M.; Esfandiari, E.; Esfahani, H.Z.; Kazemi, M. Comparative study of microtubule-associated protein-2 and glial fibrillary acidic proteins during neural induction of human bone marrow mesenchymal stem cells and adipose-derived stem cells. Int. J. Prev. Med. 2014, 5, 584–595. [Google Scholar]
- Okolicsanyi, R.K.; Griffiths, L.R.; Haupt, L.M. Mesenchymal stem cells, neural lineage potential, heparan sulfate proteoglycans and the matrix. Dev. Biol. 2014, 388, 1–10. [Google Scholar] [CrossRef] [PubMed]
- Thompson, L.H.; Björklund, A. Reconstruction of brain circuitry by neural transplants generated from pluripotent stem cells. Neurobiol. Dis. 2015, 79, 28–40. [Google Scholar] [CrossRef] [PubMed]
- Zarrinpour, V.; Hajebrahimi, Z.; Jafarinia, M. Expression pattern of neurotrophins and their receptors during neuronal differentiation of adipose-derived stem cells in simulated microgravity condition. Iran. J. Basic Med. Sci. 2017, 20, 178–186. [Google Scholar] [CrossRef] [PubMed]
- Buzanska, L.; Sypecka, J.; Nerini-Molteni, S.; Compagnoni, A.; Hogberg, H.T.; del Torchio, R.; Domanska-Janik, K.; Zimmer, J.; Coecke, S. A human stem cell-based model for identifying adverse effects of organic and inorganic chemicals on the developing nervous system. Stem Cells 2009, 27, 2591–2601. [Google Scholar] [CrossRef] [PubMed]
- Zychowicz, M.; Dziedzicka, D.; Mehn, D.; Kozlowska, H.; Kinsner-Ovaskainen, A.; Stepien, P.P.; Rossi, F.; Buzanska, L. Developmental stage dependent neural stem cells sensitivity to methylmercury chloride on different biofunctional surfaces. Toxicol. Vitr. 2014, 28, 76–87. [Google Scholar] [CrossRef] [PubMed]
- Kashyap, M.P.; Kumar, V.; Singh, A.K.; Tripathi, V.K.; Jahan, S.; Pandey, A.; Srivastava, R.K.; Khanna, V.K.; Pant, A.B. Differentiating neurons derived from human umbilical cord blood stem cells work as a test system for developmental neurotoxicity. Mol. Neurobiol. 2015, 51, 791–807. [Google Scholar] [CrossRef]
- Singh, S.; Srivastava, A.; Kumar, V.; Pandey, A.; Kumar, D.; Rajpurohit, C.S.; Khanna, V.K.; Yadav, S.; Pant, A.B. Stem cells in neurotoxicology/developmental neurotoxicology: Current scenario and future prospects. Mol. Neurobiol. 2015, 53, 6938–6949. [Google Scholar] [CrossRef]
- Singh, A.K.; Kashyap, M.P. An overview on human umbilical cord blood stem cell-based alternative in vitro models for developmental neurotoxicity assessment. Mol. Neurobiol. 2016, 53, 3216–3226. [Google Scholar] [CrossRef]
- De Simone, U.; Spinillo, A.; Caloni, F.; Gribaldo, L.; Coccini, T. Neuron-like cells generated from human umbilical cord lining-derived mesenchymal stem cells as a new in vitro model for neuronal toxicity screening: Using magnetite nanoparticles as an example. Int. J. Mol. Sci. 2020, 21, 271. [Google Scholar] [CrossRef] [Green Version]
- Lim, I.J.; Phan, T.T. Epithelial and mesenchymal stem cells from the umbilical cord lining membrane. Cell Transpl. 2014, 23, 497–503. [Google Scholar] [CrossRef]
- Akbarzadeh, A.; Samiei, M.; Davaran, S. Magnetic nanoparticles: Preparation, physical properties, and applications in biomedicine. Nanoscale Res. Lett. 2012, 7, 144. [Google Scholar] [CrossRef] [PubMed] [Green Version]
- Shi, D.; Mi, G.; Bhattacharya, S.; Nayar, S.; Webster, T.J. Optimizing superparamagnetic iron oxide nanoparticles as drug carriers using an in vitro blood-brain barrier model. Int. J. Nanomed. 2016, 11, 5371–5379. [Google Scholar] [CrossRef] [PubMed] [Green Version]
- Willmann, W.; Dringen, R. How to study the uptake and toxicity of nanoparticles in cultured brain cells: The dos and don’t forgets. Neurochem. Res. 2019, 44, 1330–1345. [Google Scholar] [CrossRef] [PubMed]
- Maher, B.A.; Ahmed, I.A.; Karloukovski, V.; MacLaren, D.A.; Foulds, P.G.; Allsop, D.; Mann, D.M.; Torres-Jardón, R.; Calderon-Garciduenas, L. Magnetite pollution nanoparticles in the human brain. Proc. Natl. Acad. Sci. USA. 2016, 113, 10797–10801. [Google Scholar] [CrossRef] [Green Version]
- Maher, B.A. Airborne magnetite and iron-rich pollution nanoparticles: Potential neurotoxicants and environmental risk factors for neurodegenerative disease, including Alzheimer’s disease. J. Alzheimers Dis. 2019, 71, 361–375. [Google Scholar] [CrossRef] [Green Version]
- Sly, P.D.; Flack, F. Susceptibility of children to environmental pollutants. Ann. N. Y. Acad. Sci. 2008, 1140, 163–183. [Google Scholar] [CrossRef]
- Landrigan, P.J.; Miodovnik, A. Children’s health and the environment: An overview. Mt. Sinai J. Med. 2011, 78, 1–10. [Google Scholar] [CrossRef]
- Grandjean, P.; Landrigan, P.J. Neurobehavioural effects of developmental toxicity. Lancet Neurol. 2014, 13, 330–338. [Google Scholar] [CrossRef] [Green Version]
- OECD/OCDE. Guideline 426 for the Testing of Chemicals-Developmental Neurotoxicity Study; Organisation for Economic Co-operation and Development (OECD/OCDE): Paris, France, 2007. [Google Scholar]
- National Research Council (NRC). Toxicity Testing in the 21st Century: A Vision and a Strategy; National Academies Press: Washington, DC, USA, 2007. [Google Scholar] [CrossRef]
- Coccini, T.; De Simone, U.; Roccio, M.; Croce, S.; Lenta, E.; Zecca, M.; Spinillo, A.; Avanzini, M.A. In vitro toxicity screening of magnetite nanoparticles by applying mesenchymal stem cells derived from human umbilical cord lining. J. Appl. Toxicol. 2019, 39, 1320–1336. [Google Scholar] [CrossRef]
- Sanchez-Ramos, J.; Song, S.; Cardozo-Pelaez, F.; Hazzi, C.; Stedeford, T.; Willing, A.; Freeman, T.B.; Saporta, S.; Janssen, W.; Patel, N.; et al. Adult bone marrow stromal cells differentiate into neural cells in vitro. Exp. Neurol. 2000, 164, 247–256. [Google Scholar] [CrossRef] [Green Version]
- Deng, W.; Obrocka, M.; Fischer, I.; Prockop, D.J. In vitro differentiation of human marrow stromal cells into early progenitors of neural cells by conditions that increase intracellular cyclic AMP. Biochem. Biophys. Res. Commun. 2001, 282, 148–152. [Google Scholar] [CrossRef] [PubMed] [Green Version]
- Woodbury, D.; Schwarz, E.J.; Prockop, D.J.; Black, I.B. Adult rat and human bone marrow stromal cells differentiate into neurons. J. Neurosci. Res. 2000, 61, 364–370. [Google Scholar] [CrossRef]
- Woodbury, D.; Reynolds, K.; Black, I.B. Adult bone marrow stromal stem cells express germline, ectodermal, endodermal, and mesodermal genes prior to neurogenesis. J. Neurosci. Res. 2002, 96, 908–917. [Google Scholar] [CrossRef] [PubMed]
- Levy, Y.S.; Merims, D.; Panet, H.; Barhum, Y.; Melamed, E.; Offen, D. Induction of Neuron-Specific Enolase Promoter and Neuronal Markers in Differentiated Mouse Bone Marrow Stromal Cells. J. Mol. Neurosci. 2003, 21, 120–132. [Google Scholar] [CrossRef]
- Ducray, A.D.; Stojiljkovic, A.; Möller, A.; Stoffel, M.H.; Widmer, H.R.; Frenz, M.; Mevissen, M. Uptake of silica nanoparticles in the brain and effects on neuronal differentiation using different in vitro models. Nanomedicine 2017, 13, 1195–1204. [Google Scholar] [CrossRef] [PubMed] [Green Version]
- Gliga, A.R.; Edoff, K.; Caputo, F.; Källman, T.; Blom, H.; Karlsson, H.L.; Ghibelli, L.; Traversa, E.; Ceccatelli, S.; Fadeel, B. Cerium oxide nanoparticles inhibit differentiation of neural stem cells. Sci. Rep. 2017, 71, 9284. [Google Scholar] [CrossRef] [PubMed]
- Rostami, A.A.; Mohseni Kouchesfahani, H.; Kiani, S.; Fakheri, R. Iron oxide nanoparticles reduced retinoic acid induced-neuronal differentiation of mouse embryonic stem cells by ROS generation. Arch. Iran. Med. 2015, 89, 586–590. [Google Scholar] [CrossRef]
- Soenen, S.J.; Nuytten, N.; De Meyer, S.F.; De Smedt, S.C.; De Cuyper, M. High intracellular iron oxide nanoparticle concentrations affect cellular cytoskeleton and focal adhesion kinase-mediated signaling. Small 2010, 6, 832–842. [Google Scholar] [CrossRef]
- Zeng, G.; Wang, G.; Guan, F.; Chang, K.; Jiao, H.; Gao, W.; Xi, S.; Yang, B. Human amniotic membrane-derived mesenchymal stem cells labeled with superparamagnetic iron oxide nanoparticles: The effect on neuron-like differentiation in vitro. Mol. Cell Biochem. 2011, 357, 331–341. [Google Scholar] [CrossRef]
- Lu, C.W.; Hsiao, J.K.; Liu, H.M.; Wu, C.H. Characterization of an iron oxide nanoparticle labelling and MRI-based protocol for inducing human mesenchymal stem cells into neural-like cells. Sci. Rep. 2017, 7, 3587. [Google Scholar] [CrossRef]
- Valdiglesias, V.; Kiliç, G.; Costa, C.; Fernández-Bertólez, N.; Pásaro, E.; Teixeira, J.P.; Laffon, B. Effects of iron oxide nanoparticles: Cytotoxicity, genotoxicity, developmental toxicity, and neurotoxicity. Environ. Mol. Mutagen. 2015, 56, 125–148. [Google Scholar] [CrossRef] [PubMed]
- Ma, W.; Gehret, P.M.; Hoff, R.E.; Kelly, L.P.; Suh, W.H. The investigation into the toxic potential of iron oxide nanoparticles utilizing rat pheochromocytoma and human neural stem cells. Nanomaterials (Basel) 2019, 9, 453. [Google Scholar] [CrossRef] [PubMed] [Green Version]
- Petters, C.; Thiel, K.; Dringen, R. Lysosomal iron liberation is responsible for the vulnerability of brain microglial cells to iron oxide nanoparticles: Comparison with neurons and astrocytes. Nanotoxicology 2015, 10, 332–342. [Google Scholar] [CrossRef] [PubMed]
- Petters, C.; Dringen, R. Accumulation of iron oxide nanoparticles by cultured primary neurons. Neurochem. Int. 2015, 81, 1–9. [Google Scholar] [CrossRef] [PubMed]
- Geppert, M.; Hohnholt, M.C.; Nürnberger, S.; Dringen, R. Ferritin upregulation and transient ROS production in cultured brain astrocytes after loading with iron oxide nanoparticles. Acta Biomater. 2012, 8, 3832–3839. [Google Scholar] [CrossRef]
- Petters, C.; Irrsack, E.; Koch, M.; Dringen, R. Uptake and metabolism of iron oxide nanoparticles in brain cells. Neurochem. Res. 2014, 39, 1648–1660. [Google Scholar] [CrossRef]
- Rivet, C.J.; Yuan, Y.; Borca-Tasciuc, D.A.; Gilbert, R.J. Altering iron oxide nanoparticle surface properties induce cortical neuron cytotoxicity. Chem. Res. Toxicol. 2012, 25, 153–161. [Google Scholar] [CrossRef] [Green Version]
- Sun, Z.; Yathindranath, V.; Worden, M.; Thliveris, J.A.; Chu, S.; Parkinson, F.E.; Hegmann, T.; Miller, D.W. Characterization of cellular uptake and toxicity of aminosilane-coated iron oxide nanoparticles with different charges in central nervous system-relevant cell culture models. Int. J. Nanomed. 2013, 8, 961–970. [Google Scholar] [CrossRef] [Green Version]
- Wang, J.; Chen, Y.; Chen, B.; Ding, J.; Xia, G.; Gao, C.; Cheng, J.; Jin, N.; Zhou, Y.; Li, X.; et al. Pharmacokinetic parameters and tissue distribution of magnetic Fe3O4 nanoparticles in mice. Int. J. Nanomed. 2010, 5, 861–866. [Google Scholar] [CrossRef] [Green Version]
- Wu, J.; Ding, T.; Sun, J. Neurotoxic potential of iron oxide nanoparticles in the rat brain striatum and hippocampus. NeuroToxicology 2013, 34, 243–253. [Google Scholar] [CrossRef]
- Chahinez, T.; Rachid, R.; Salim, G.; Lamia, B.; Ghozala, Z.; Nadjiba, T.; Aya, S.; Sara, H.; Hajer, C.; Samira, B.; et al. Toxicity of Fe3O4 nanoparticles on oxidative stress status, stromal enzymes and mitochondrial respiration and swelling of Oryctolagus cuniculus brain cortex. Toxicol. Environ. Health Sci. 2016, 8, 349–355. [Google Scholar] [CrossRef]
- Askri, D.; Ouni, S.; Galai, S.; Arnaud, J.; Chovelon, B.; Lehmann, S.G.; Sturm, N.; Sakly, M.; Sève, M.; Amara, S. Intranasal instillation of iron oxide nanoparticles induces inflammation and perturbation of trace elements and neurotransmitters, but not behavioral impairment in rats. Environ. Sci. Pollut. Res. Int. 2018, 25, 16922–16932. [Google Scholar] [CrossRef] [PubMed]
- Liu, Y.; Li, J.; Xu, K.; Gu, J.; Huang, L.; Zhang, L.; Liu, N.; Kong, J.; Xing, M.; Zhang, L.; et al. Characterization of superparamagnetic iron oxide nanoparticle-induced apoptosis in PC12 cells and mouse hippocampus and striatum. Toxicol. Lett. 2018, 292, 151–161. [Google Scholar] [CrossRef] [PubMed]
- Manickam, V.; Dhakshinamoorthy, V.; Perumal, E. Iron oxide nanoparticles induces cell cycle dependent neuronal apoptosis in mice. J. Mol. Neurosci. 2018, 64, 352–362. [Google Scholar] [CrossRef] [PubMed]
- Goodman, L. Alzheimer’s disease-A clinicopathologic analysis of 23 cases with a theory on pathogenesis. J. Nerv. Ment. Dis. 1953, 118, 97–130. [Google Scholar] [CrossRef]
- Beard, J.L.; Connor, J.R.; Jones, B.C. Iron in the brain. Nutr. Rev. 1993, 51, 157–170. [Google Scholar] [CrossRef]
- Smith, M.A.; Harris, P.L.R.; Sayres, L.M.; Perry, G. Iron accumulation in Alzheimer disease is a source of redox-generated free radicals. Proc. Natl. Acad. Sci. USA. 1997, 94, 9866–9868. [Google Scholar] [CrossRef] [Green Version]
- Thompson, K.J.; Shoham, S.; Connor, J.R. Iron and neurodegenerative disorders. Brain Res. Bull. 2001, 55, 155–164. [Google Scholar] [CrossRef]
- Zecca, L.; Youdim, M.B.; Riederer, P.; Connor, J.R.; Crichton, R.R. Iron, brain ageing and neurodegenerative disorders. Nat. Rev. Neurosci. 2004, 5, 863–873. [Google Scholar] [CrossRef]
- Dobson, J. Nanoscale biogenic iron oxides and neurodegenerative disease. FEBS Lett. 2001, 496, 1–5. [Google Scholar] [CrossRef] [Green Version]
- Hautot, D.; Pankhurst, Q.A.; Khan, N.; Dobson, J. Preliminary evaluation of nanoscale biogenic magnetite in Alzheimer’s disease brain tissue. Proc. Biol. Sci. 2003, 270, S62–S64. [Google Scholar] [CrossRef] [PubMed] [Green Version]
- Takahashi, Y.; Mizuo, K.; Shinkai, Y.; Oshio, S.; Takeda, K. Prenatal exposure to titanium dioxide nanoparticles increases dopamine levels in the prefrontal cortex and neostriatum of mice. J. Toxicol. Sci. 2010, 35, 749–756. [Google Scholar] [CrossRef] [PubMed] [Green Version]
- Umezawa, M.; Tainaka, H.; Kawashima, N.; Shimizu, M.; Takeda, K. Effect of fetal exposure to titanium dioxide nanoparticle on brain development-brain region information. J. Toxicol. Sci. 2012, 37, 1247–1252. [Google Scholar] [CrossRef] [PubMed] [Green Version]
- Cui, Y.H.; Chen, X.Y.; Zhou, Z.; Lei, Y.; Ma, M.N.; Cao, R.J.; Wen, C.; Che, Y. Prenatal exposure to nanoparticulate titanium dioxide enhances depressive-like behaviors in adult rats. Chemosphere 2014, 96, 99–104. [Google Scholar] [CrossRef]
- Hoelting, L.; Scheinhardt, B.; Bondarenko, O.; Schildknecht, S.; Kapitza, M.; Tanavde, V.; Tan, B.; Lee, Q.Y.; Mecking, S.; Leist, M.; et al. A 3-dimensional human embryonic stem cell (hESC)-derived model to detect developmental neurotoxicity of nanoparticles. Arch. Toxicol. 2013, 87, 721–733. [Google Scholar] [CrossRef] [Green Version]


| Fe3O4NPs Stock Suspension | |
|---|---|
| Diameter (TEM) (nm) | 20.3 ± 5 |
| Coefficient of Variation (%) | 24.6 |
| Surface Area (TEM) (m2/g) | 50.2 |
| Mass Concentration (mg/mL) | 20.3 |
| Hydrodynamic Diameter (nm) | 42 |
| Zeta Potential (mV) | −51 |
| pH Solution | 7.4 |
| 10 μg/mL Fe3O4NPs | ||||
| Mean diameter (nm) | Zp (mV) | PdI | pH | |
| Time | ||||
| 30 min | 1213 (23.5) | −9.5 (0.59) | 0.264 (0.01) | 8.09 |
| 24 h | 1321 (50.9) | −8.9 (0.68) | 0.305 (0.09) | 7.78 |
| 48 h | 1552 (158.0) | −9.40 (034) | 0.230 (0.05) | 7.65 |
| 25 μg/mL Fe3O4NPs | ||||
| Mean diameter (nm) | Zp (mV) | PdI | pH | |
| Time | ||||
| 30 min | 1368 (10.0) | −11.30 (0.59) | 0.264 (0.01) | 8.09 |
| 24 h | 1405 (38.7) | −10.20 (0.32) | 0.229 (0.01) | 7.64 |
| 48 h | 1450 (36.7) | −10.30 (0.25) | 0.227 (0.03) | 7.65 |
| Fe3O4NP (μ/mL) | ||||||
|---|---|---|---|---|---|---|
| hNLCs | 0 | 1 | 5 | 10 | 25 | 50 |
| day 2 | 100 ± 7.16 | 109.60 ± 3.40 | 96.70 ± 1.18 | 104.61 ± 0.94 | 85.96 ± 2.35 * | 84.68 ± 2.61 * |
| day 3 | 100 ± 3.74 | 106.87 ± 4.87 | 92.12 ± 2.89 * | 88.50 ± 6.52 * | 78.70 ± 4.50 * | 79.91 ± 4.40 * |
| day 4 | 100 ± 5.22 | 95.89 ± 2.85 | 89.18 ± 4.77 * | 93.71 ± 0.61 * | 87.38 ± 1.69 * | 91.07 ± 3.16 * |
| day 5 | 100 ± 3.71 | 102.34 ± 1.21 | 84.12 ± 3.98 * | 87.27 ± 4.38 * | 83.89 ± 3.65 * | 84.07 ± 5.10 * |
| day 8 | 100 ± 6.20 | 111.81 ± 3.04 | 90.95 ± 2.09 * | 85.90 ± 4.48 * | 75.49 ± 3.66 * | 74.46 ± 1.62 * |
| Fe3O4NP (μ/mL) | ||||||
|---|---|---|---|---|---|---|
| hNLCs | 0 | 1 | 5 | 10 | 25 | 50 |
| day 2 | 100 ± 4.20 | 99.52 ± 1.38 | 97.33 ± 2.18 | 98.97 ± 1.10 | 96.37 ± 1.42 | 90.79 ± 5.88 * |
| day 3 | 100 ± 6.58 | 98.46 ± 12.93 | 96.13 ± 7.08 | 94.39 ± 5.11 | 91.14 ± 2.15 | 90.75 ± 0.84 * |
| day 4 | 100 ± 3.76 | 101.39 ± 1.42 | 95.51 ± 2.07 | 94.45 ± 1.95 | 89.58 ± 0.66 * | 89.56 ± 1.61 * |
| day 5 | 100 ± 2.41 | 92.90 ± 3.94 | 90.34 ± 4.35 * | 90.11 ± 1.94 * | 81.86 ± 2.51 * | 81.19 ± 0.87 * |
| day 8 | 100 ± 4.48 | 92.92 ± 0.01 | 89.61 ± 4.04 * | 84.01 ± 3.13 * | 85.95 ± 2.56 * | 78.64 ± 2.03 * |
© 2020 by the authors. Licensee MDPI, Basel, Switzerland. This article is an open access article distributed under the terms and conditions of the Creative Commons Attribution (CC BY) license (http://creativecommons.org/licenses/by/4.0/).
Share and Cite
Coccini, T.; Pignatti, P.; Spinillo, A.; De Simone, U. Developmental Neurotoxicity Screening for Nanoparticles Using Neuron-Like Cells of Human Umbilical Cord Mesenchymal Stem Cells: Example with Magnetite Nanoparticles. Nanomaterials 2020, 10, 1607. https://doi.org/10.3390/nano10081607
Coccini T, Pignatti P, Spinillo A, De Simone U. Developmental Neurotoxicity Screening for Nanoparticles Using Neuron-Like Cells of Human Umbilical Cord Mesenchymal Stem Cells: Example with Magnetite Nanoparticles. Nanomaterials. 2020; 10(8):1607. https://doi.org/10.3390/nano10081607
Chicago/Turabian StyleCoccini, Teresa, Patrizia Pignatti, Arsenio Spinillo, and Uliana De Simone. 2020. "Developmental Neurotoxicity Screening for Nanoparticles Using Neuron-Like Cells of Human Umbilical Cord Mesenchymal Stem Cells: Example with Magnetite Nanoparticles" Nanomaterials 10, no. 8: 1607. https://doi.org/10.3390/nano10081607
APA StyleCoccini, T., Pignatti, P., Spinillo, A., & De Simone, U. (2020). Developmental Neurotoxicity Screening for Nanoparticles Using Neuron-Like Cells of Human Umbilical Cord Mesenchymal Stem Cells: Example with Magnetite Nanoparticles. Nanomaterials, 10(8), 1607. https://doi.org/10.3390/nano10081607