3.1. The Precipitation of ZnO Nanostructures
The identification of the controlled growth and agglomeration mechanisms of wurtzite ZnO nanocrystals in the presence of TA has been planned based on the implemented experimental work. The primary attention was dedicated to analyzing the initial stages of agglomeration. The hydrothermal reaction between bulk ZnO (precursor) and distilled water (reactant medium) can be expressed based on these equations:
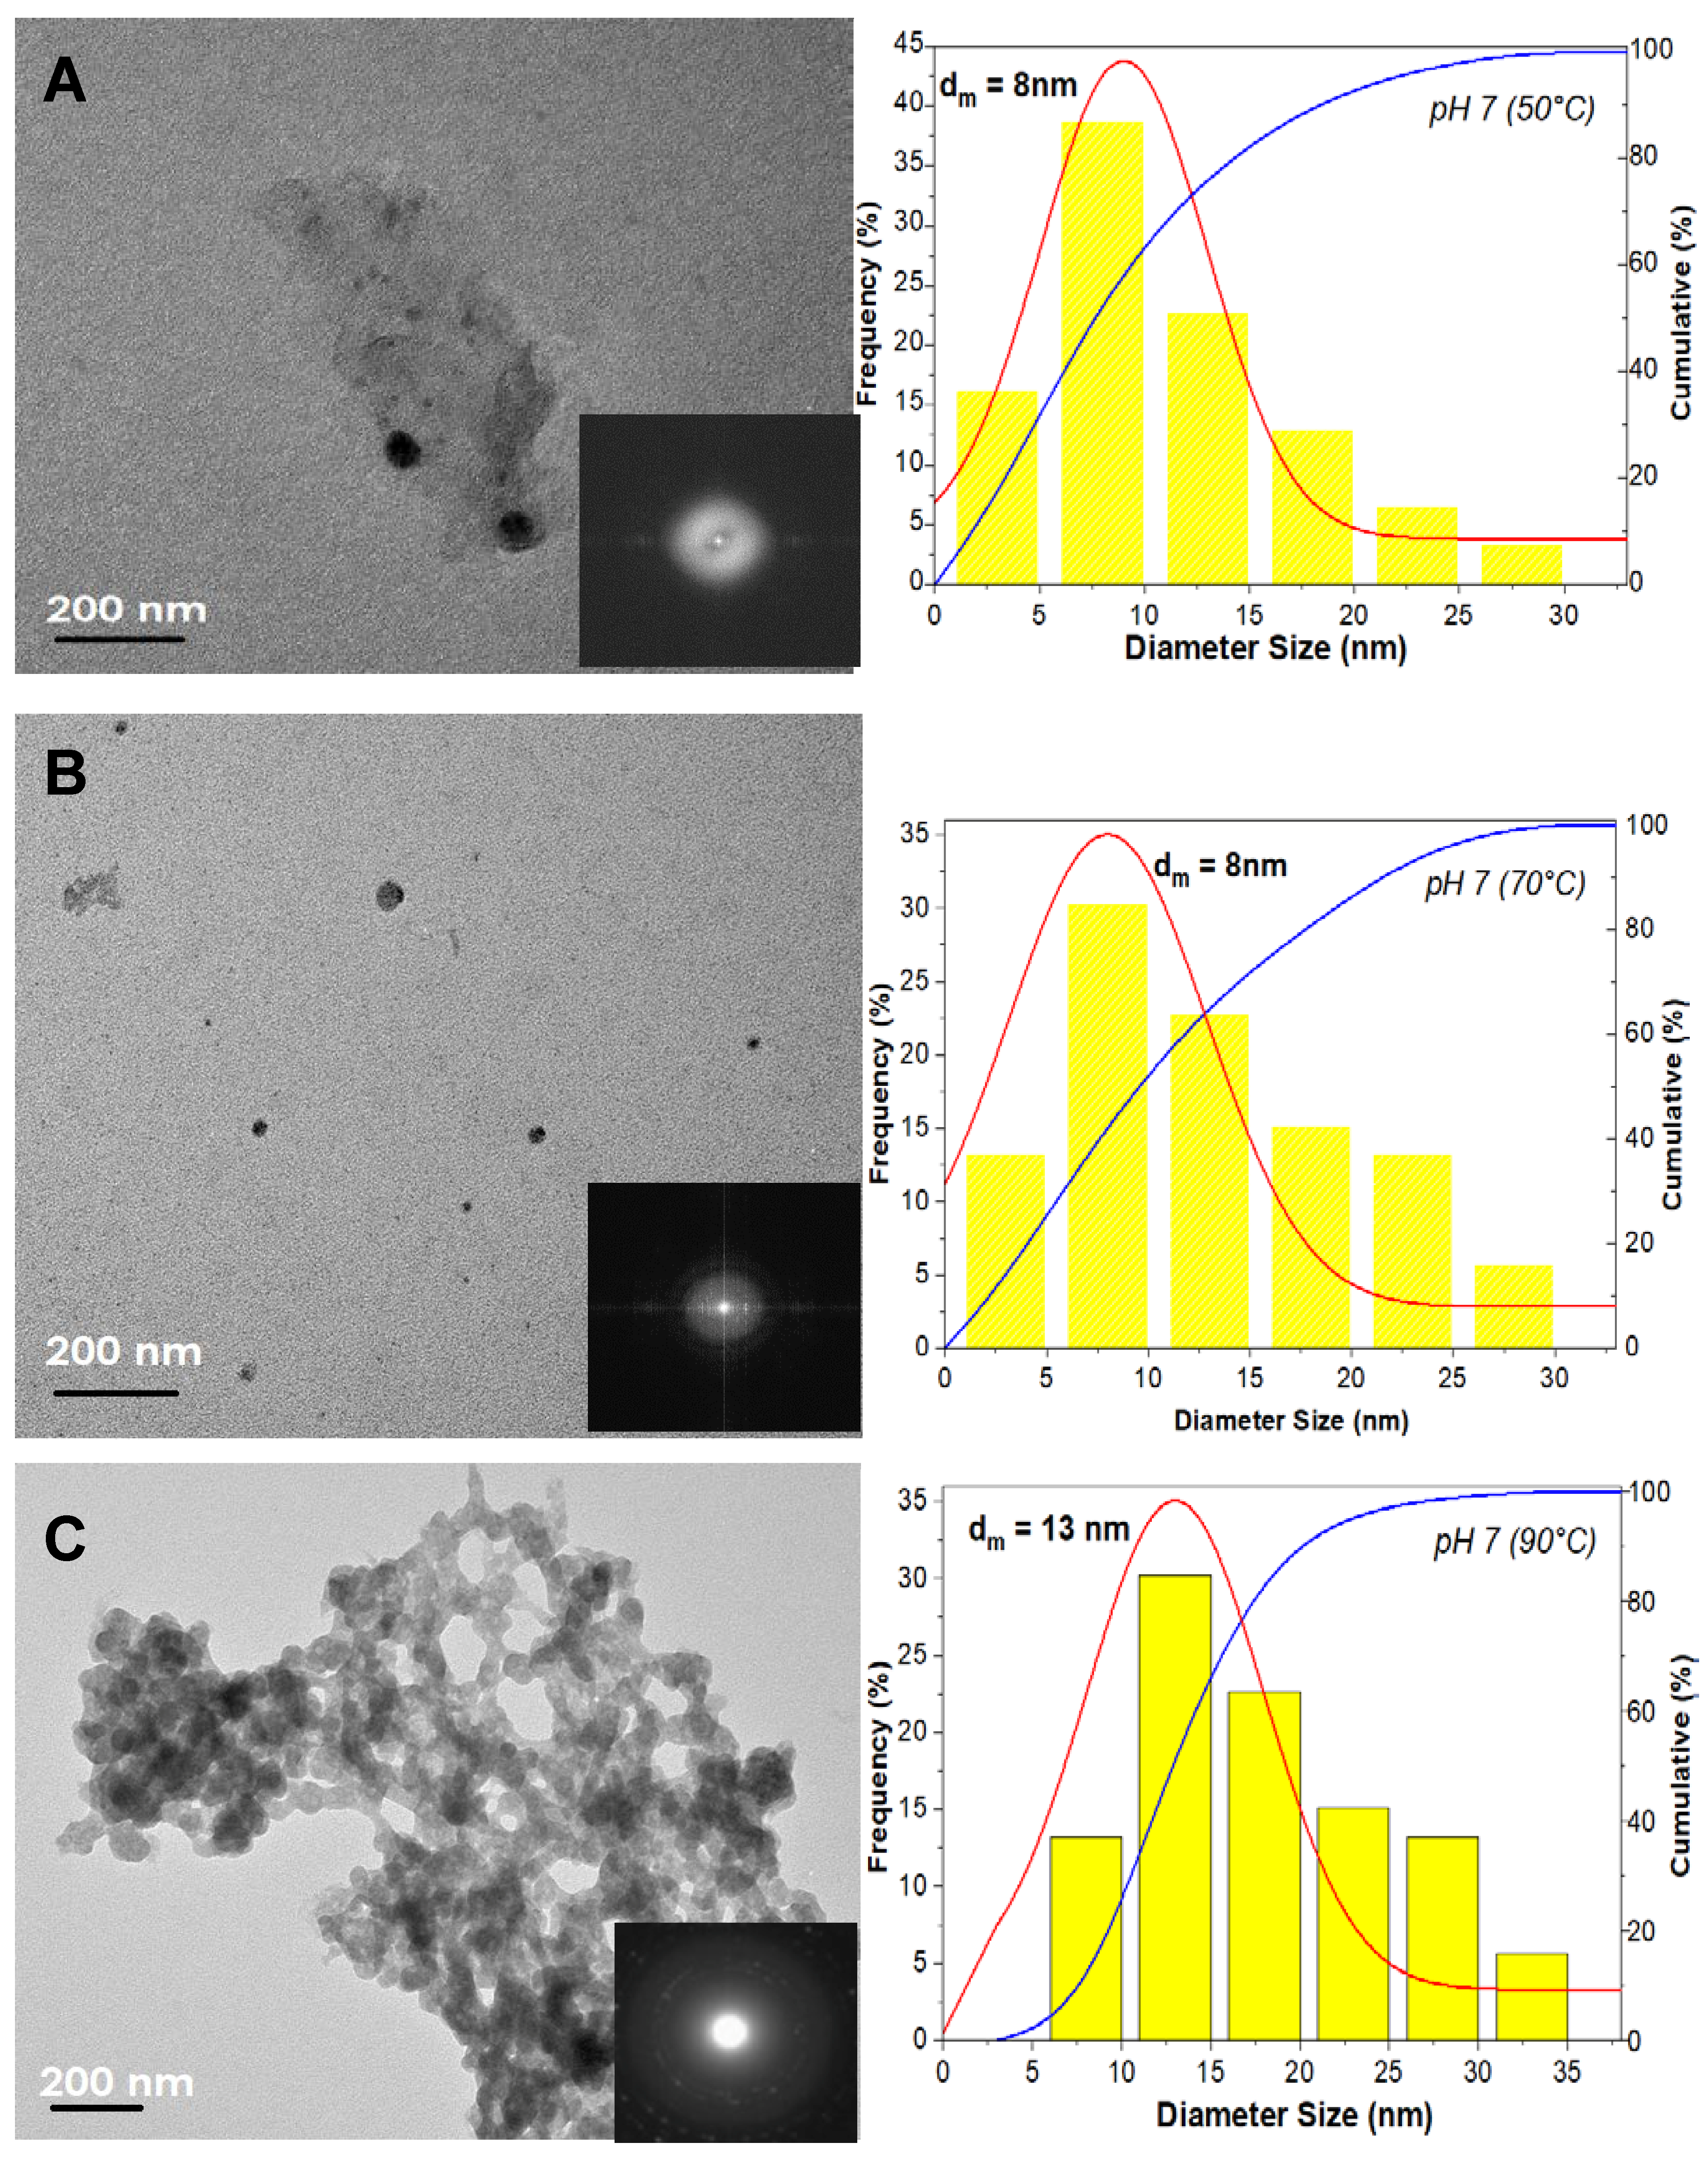
The morphology and particle size distribution of the pure ZnO and ZnO-TA nanostructures where the zero-dimensional structures are visible after a short time of hydrothermal processing is shown in
Figure 1. For pure ZnO nanostructures synthesized at 50, 70, and 90 °C (
Figure 1A–C), it is proved that the morphological shape of the structures is irregular and polygonal which have polygonal modal mean particle size diameters,
of about 8 ± 0.2, 8 ± 0.4, and 13 ± 0.5 nm, respectively. During the synthesis of pure ZnO under short processing times and low target temperatures (50 and 70 °C), the particles are not fully evolved. For most of the captured spots, particles are individually assembled and undergo much slower rates of agglomeration, despite their proximity. As small as 5 nm particle diameters have been observed in this study. The formation of this critical size is affected by a range of critical factors including the initial degree of supersaturation, reaction temperature, and pH of the surrounding medium, which are described by classical nucleation theory. The metastable state between the nucleation stage and OR growth stage in a colloidal system is controlled by the thermodynamical growth of OA [
16,
17]. Initially, these small ZnO nanostructures with negatively charged SC (C
6H
5O
73− ions) surface surfactants would repel the particles from each other, thus hindering the OR growth from promoting self-orientation of OA growth exclusively. It is believed that the SC monolayer adsorbed on the surface of ZnO nanostructure is composed of dangling di-hydrogen anions (H
2 Citrate-), and their central carboxylate ions set out to functionalize the surface atoms of Zn. As the synthesis reaction temperature is changed to 90 °C, the coalescence events of small particles are observed producing larger
of ZnO nanostructures and the particles are more firmly attached. This attachment, reminiscent of twinning, occur at their strong assembly appearance yielding in compacting the bundles of attached polygonal nanostructures. It is noted that the particles undergo a process known as crystal facet matching that creates a twin interface of crystal facets via a transient jump to contact behavior which established the OA process. The particles spontaneously attached to form nano polygonal chains in an oriented direction despite the presence of SC ligands. As the crystal facet produced the twin crystal facet interface, the created connective neck between the particles disappears through a rapid diffusion of surface atoms, yielding the formation of a more massive individual particle.
In the present study, SC shows a vital role in adjusting the morphology and the size of ZnO samples. The well-known process for the morphological and size changes have been reported in several publications [
13,
18,
19]. A similar process is adopted in the present study, but for ZnO particles not Zn ion, to produce the ZnO nanostructures which is affected by the SC. In the presence of SC, the citrate anions adsorb metal surface of Zn in the absence of Zn ion thus forming a relatively stable metal-citrate complex in an acidic condition that activates the generation of a smaller unit of bulk ZnO because of the reaction of Zn((OH)
2) precipitate and C
6H
5O
73− ions. It caused the further dissolution of Zn(OH)
2, and the formation of small ZnO occurred at the same time. The C
6H
5O
73− ions preferentially adsorb on the zinc (001) basal plane as a capping agent [
18] which then suppresses the crystal growth along of the (001) preferential direction to form ZnO nanostructures. Within a short period of reaction time (30 min in our study), these nanostructures aggregate and self-assembled. In my opinion it would be better is you say aggregate or self-assembled, even better just self-assembled into metastable polygonal through the OA for minimizing the total energy of the system.
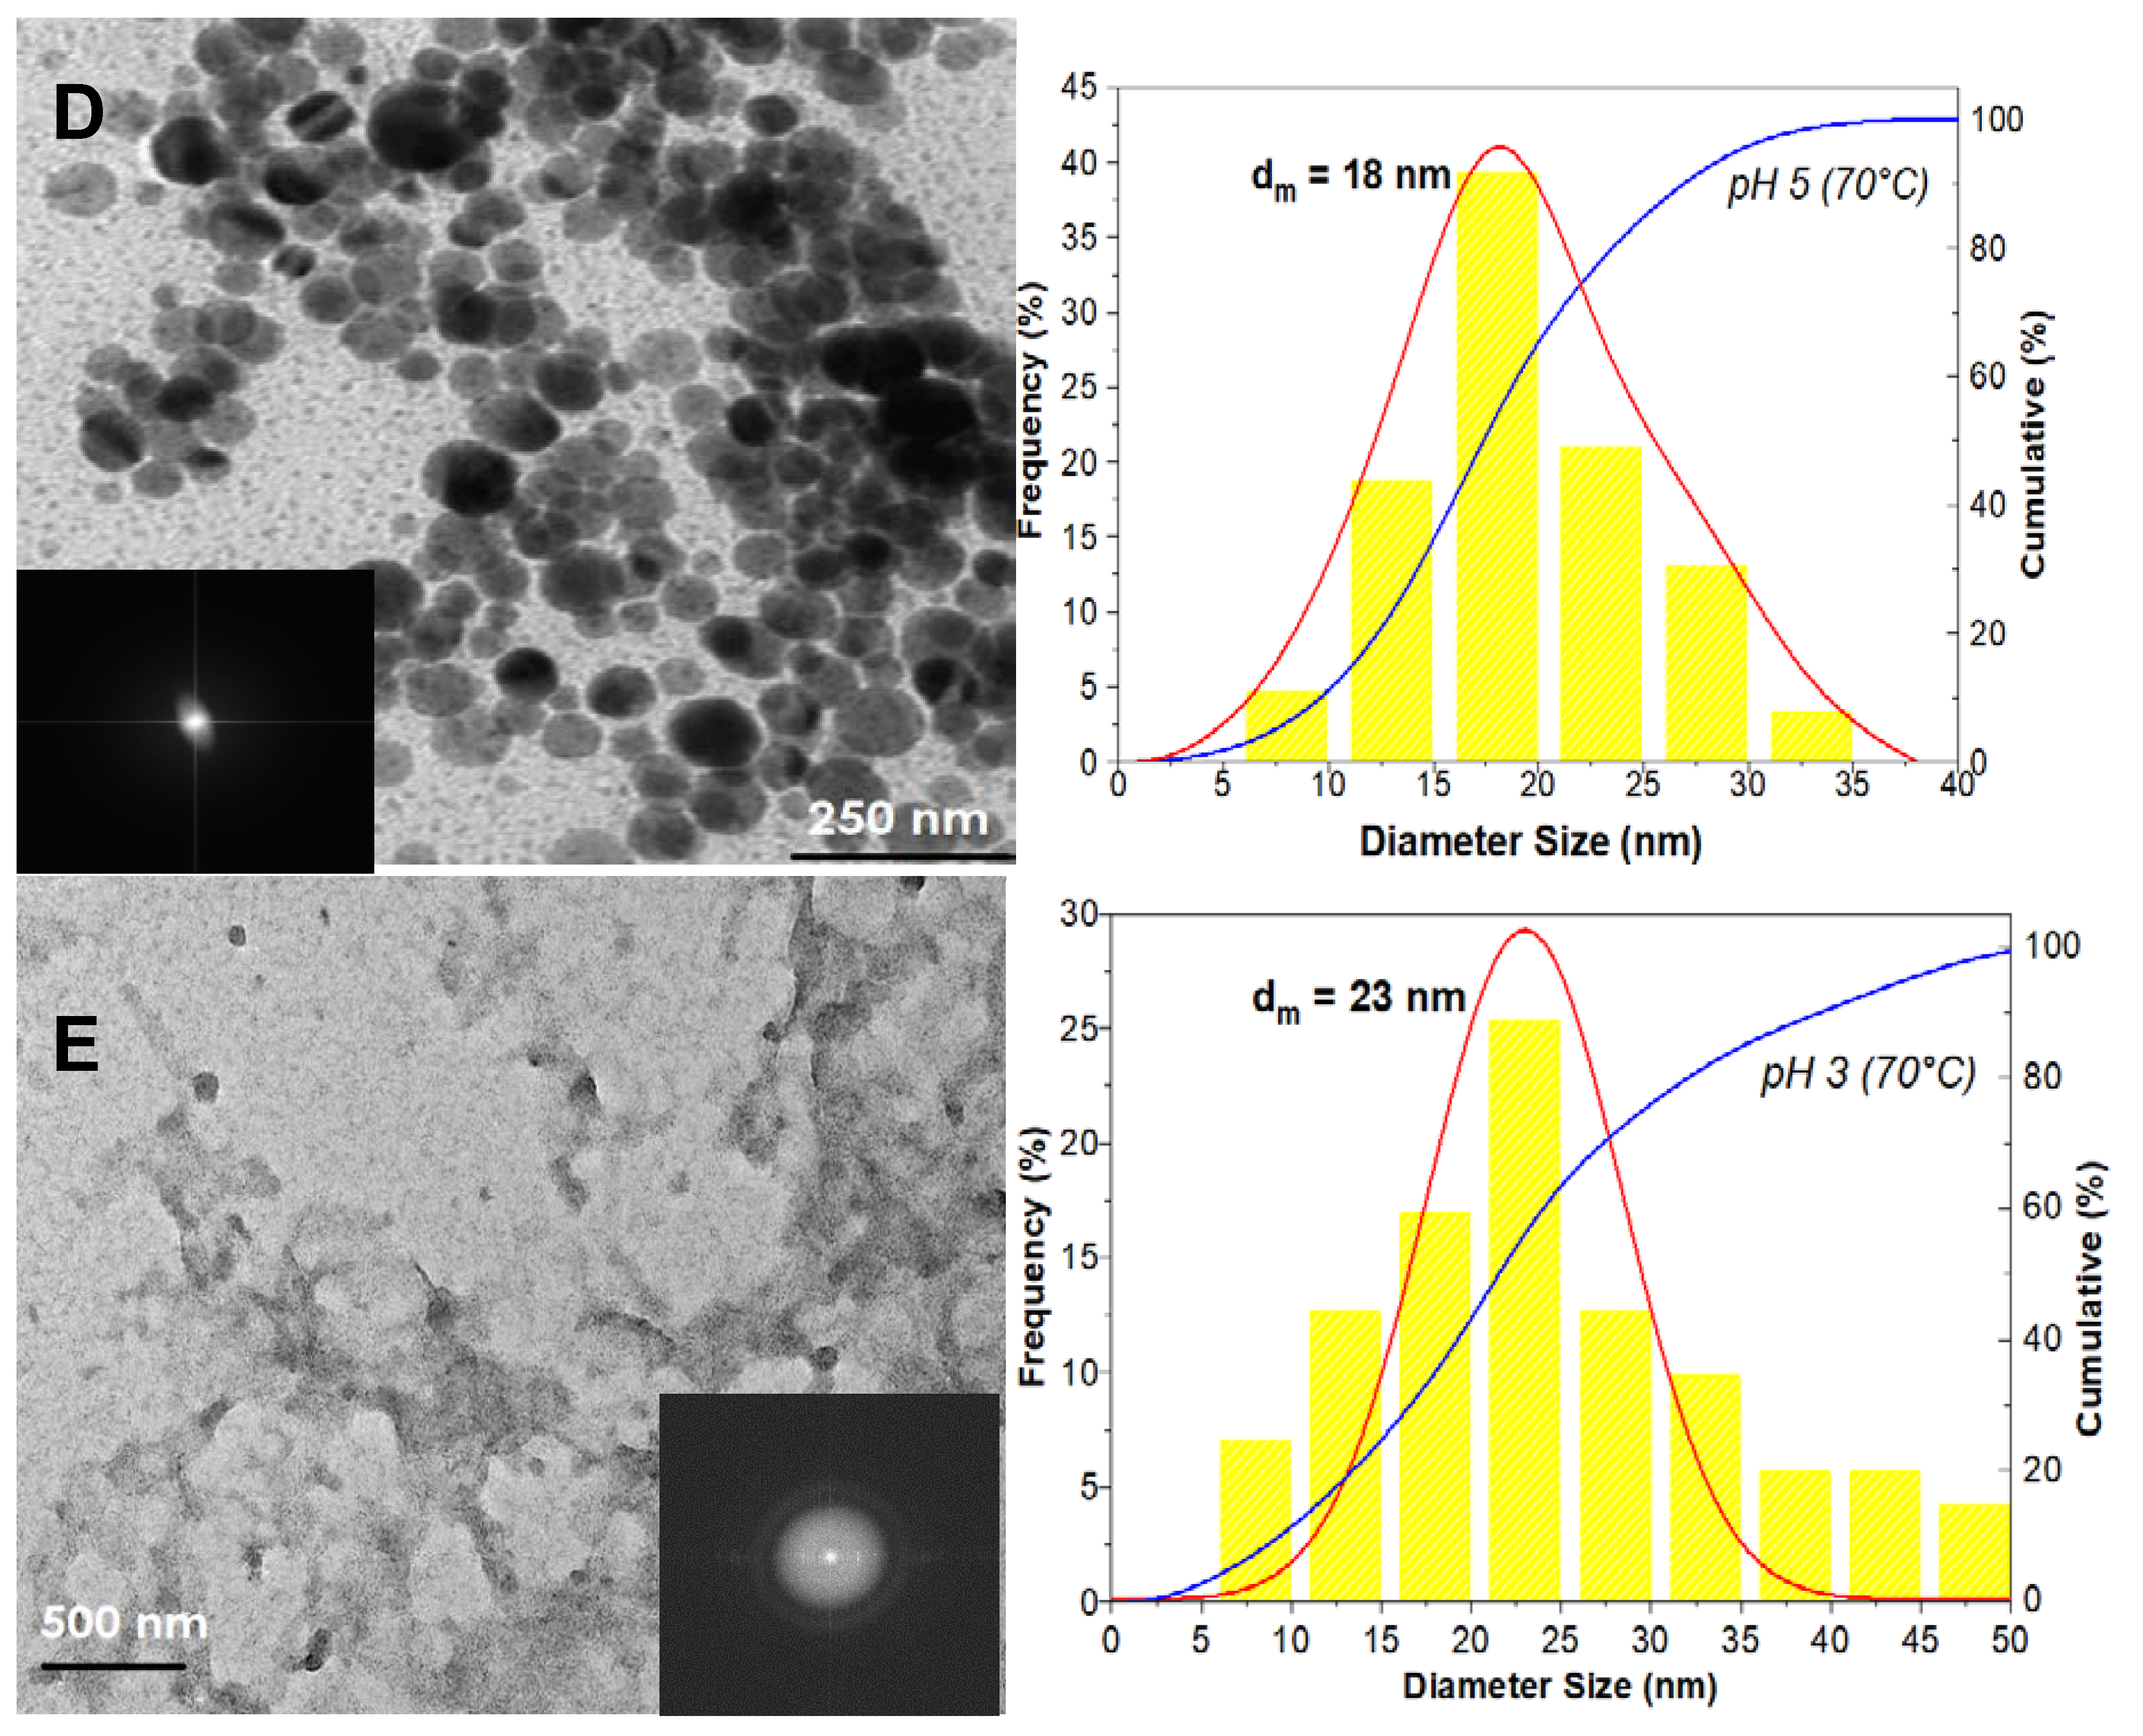
However, TEM images show that prepared ZnO nanostructures retained the polygonal clusters that are more aggregated for ZnO-TA nanostructures made at pH 5 (
Figure 1D) and pH 3 (
Figure 1E) with the
of about 18 ± 1.5 and 23 ± 1.5 nm, respectively. In our opinion the formation of a high surface-free energy created by the ultra-small size distribution (
~ 8 nm) of ZnO nanostructures expedited the coalescence of adjacent nanostructures. Furthermore, the presence of TA that creates high, medium acidity (low OH
−/H
+ ratio) in between the atomic ZnO nanostructures induced the numerous coordinative unsaturated sites on the ZnO surface facilitating particle coalescence at specific facets to create pre-alignment. This condition implies the consequence of surface ligands introduced in the system during OA, regardless of the ligand types, they bond to the surface of ZnO. Hence, desorption of ligands are appraised as to their surfaces that come into contact. The strong force binding would be one of the fundamental factors for the creation of ZnO nano chains via the OA-based growth mechanism. The selected area electron diffraction (SAED) pattern proves the availability of hexagonal wurtzite crystallites structures owned by ZnO based on the characteristic diffraction of a ring pattern (inset in
Figure 1). The brighter ring and more prominent spots showed the existence of some larger crystallites. The observed rings were relatively continuous, which denoted the presence of small nanocrystallites in a random orientation.
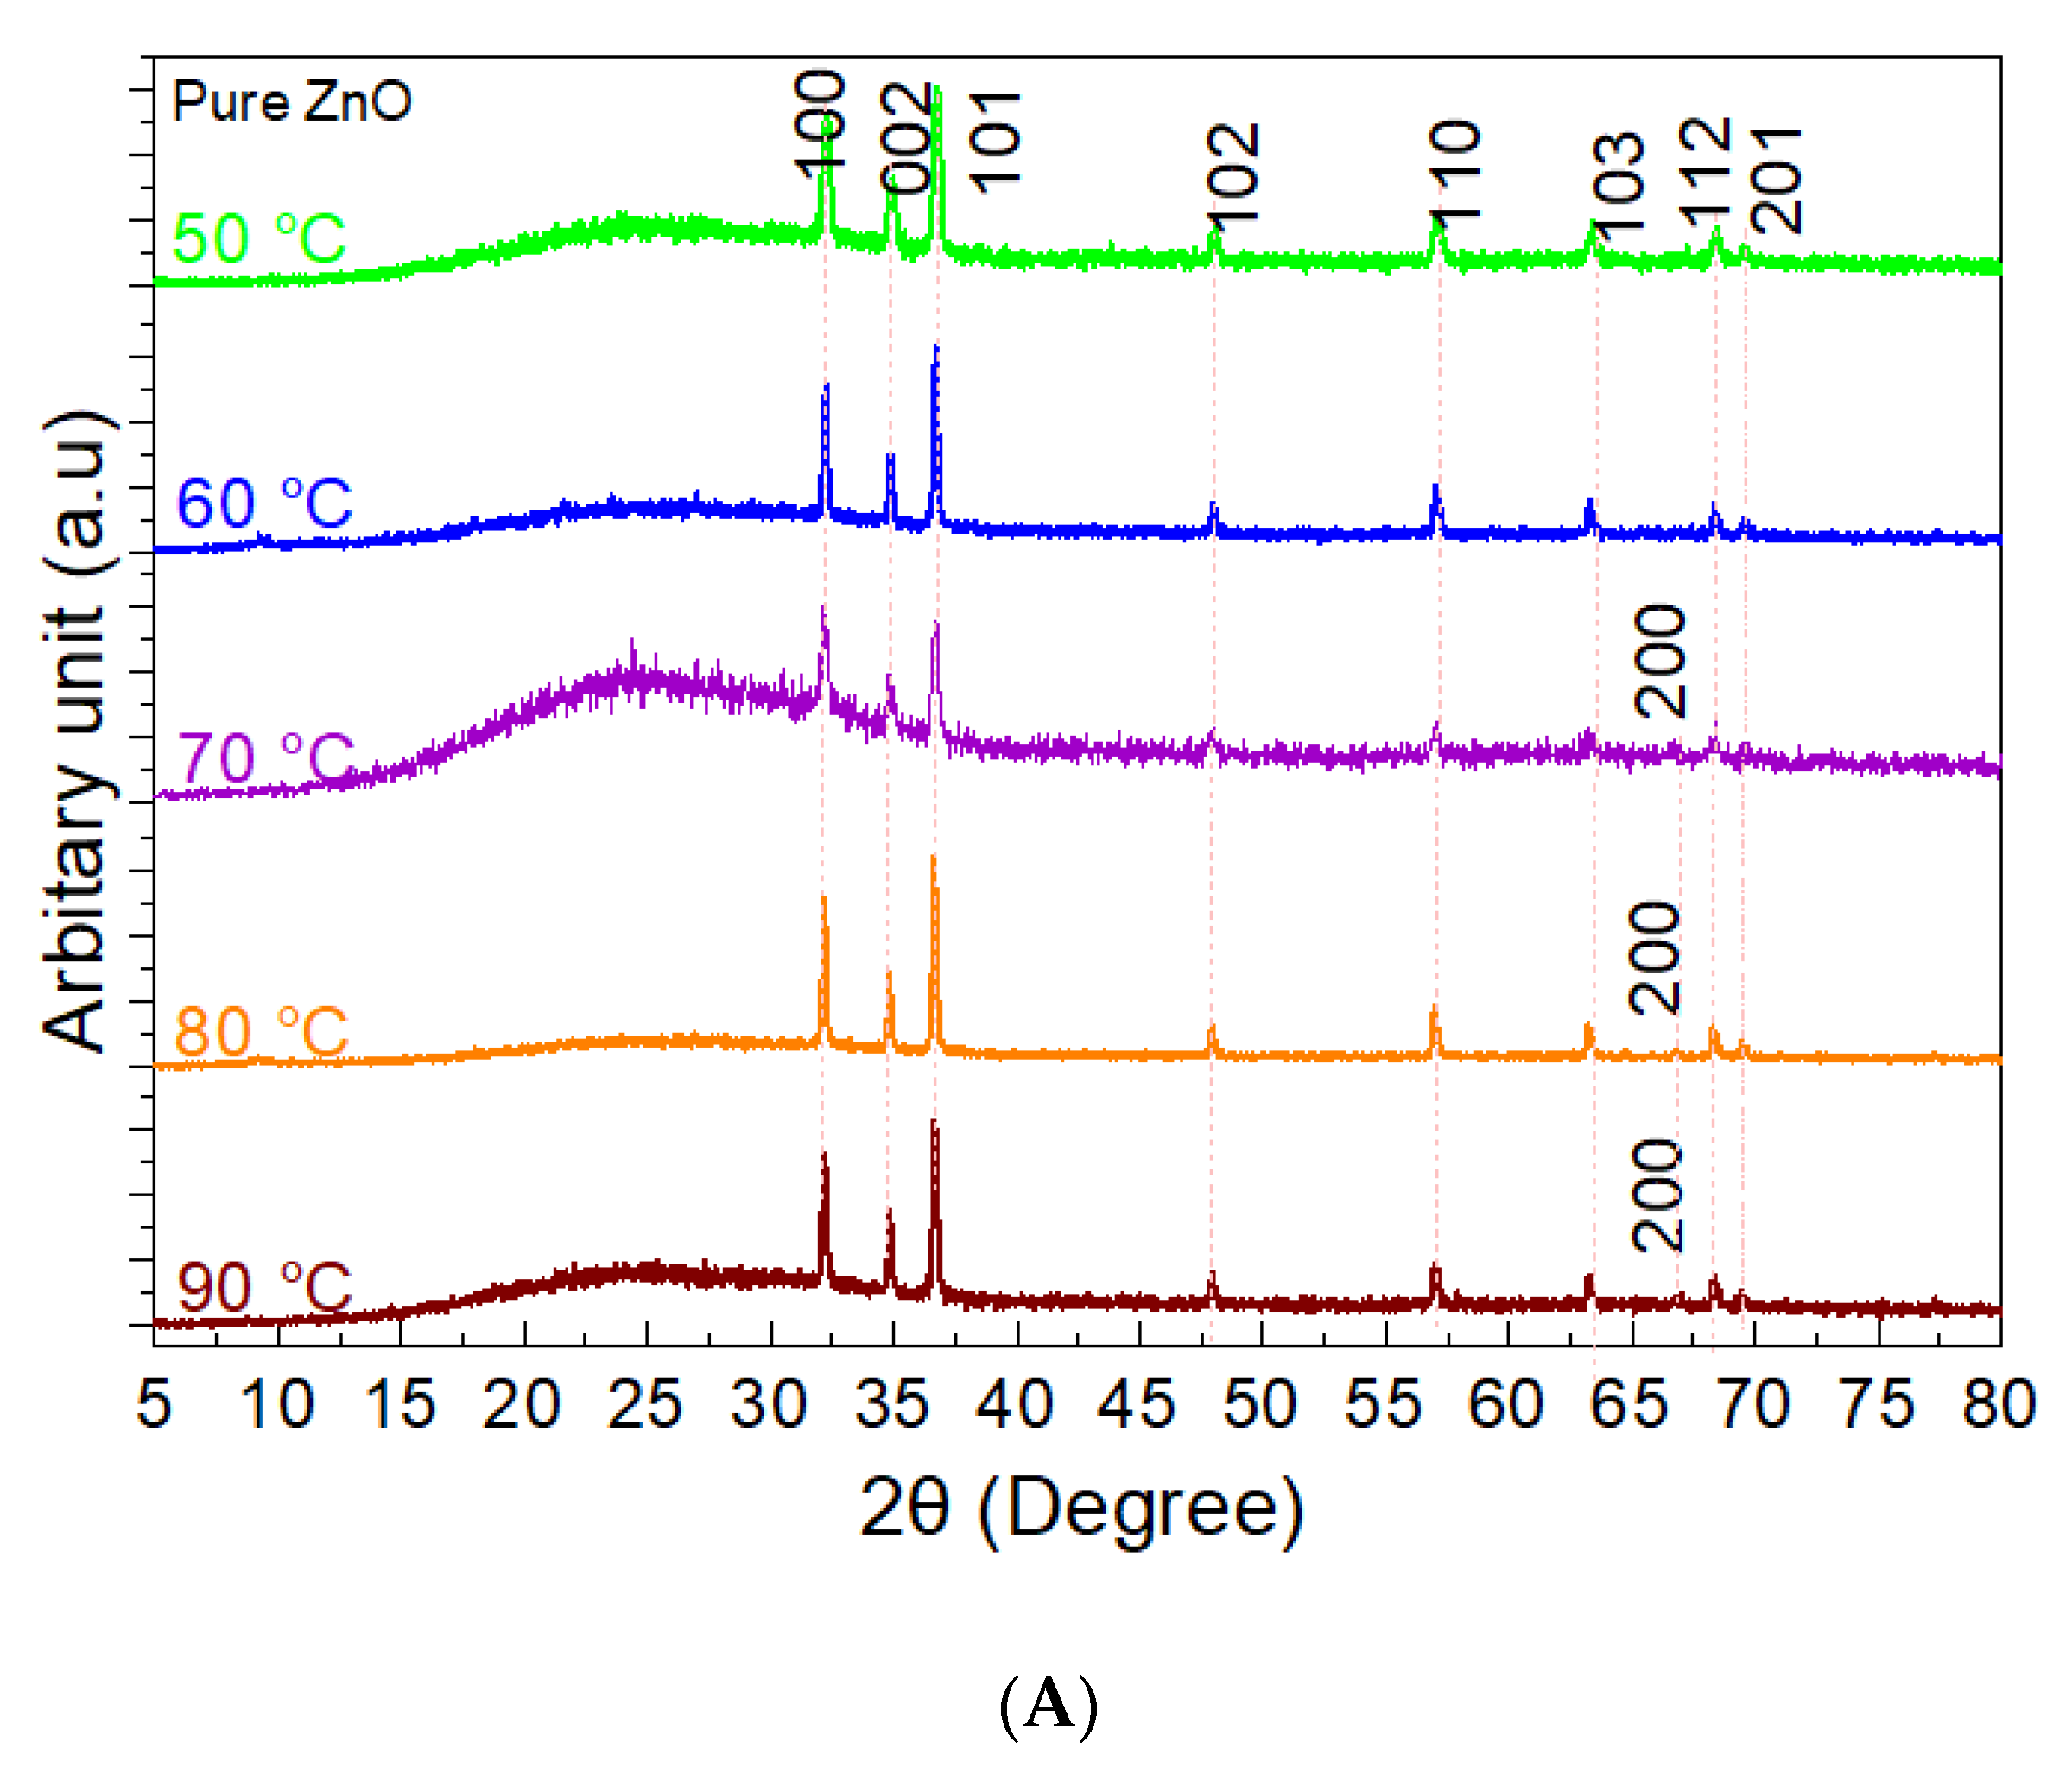
It is revealed that the polycrystalline hexagonal wurtzite structure of ZnO nanostructures with the observed peak positions in agreement with reported data in Joint Committee on Powder Diffraction Standards (JCPDS, card no: 043-0002 obtained from the library) as indicated in
Figure 2. Noted that, for diffractogram test, the amount of sample is expanded for pure ZnO nanostructures with the total of five pure samples synthesized at temperatures of 90, 80, 70, 60, and 50 °C as shown in
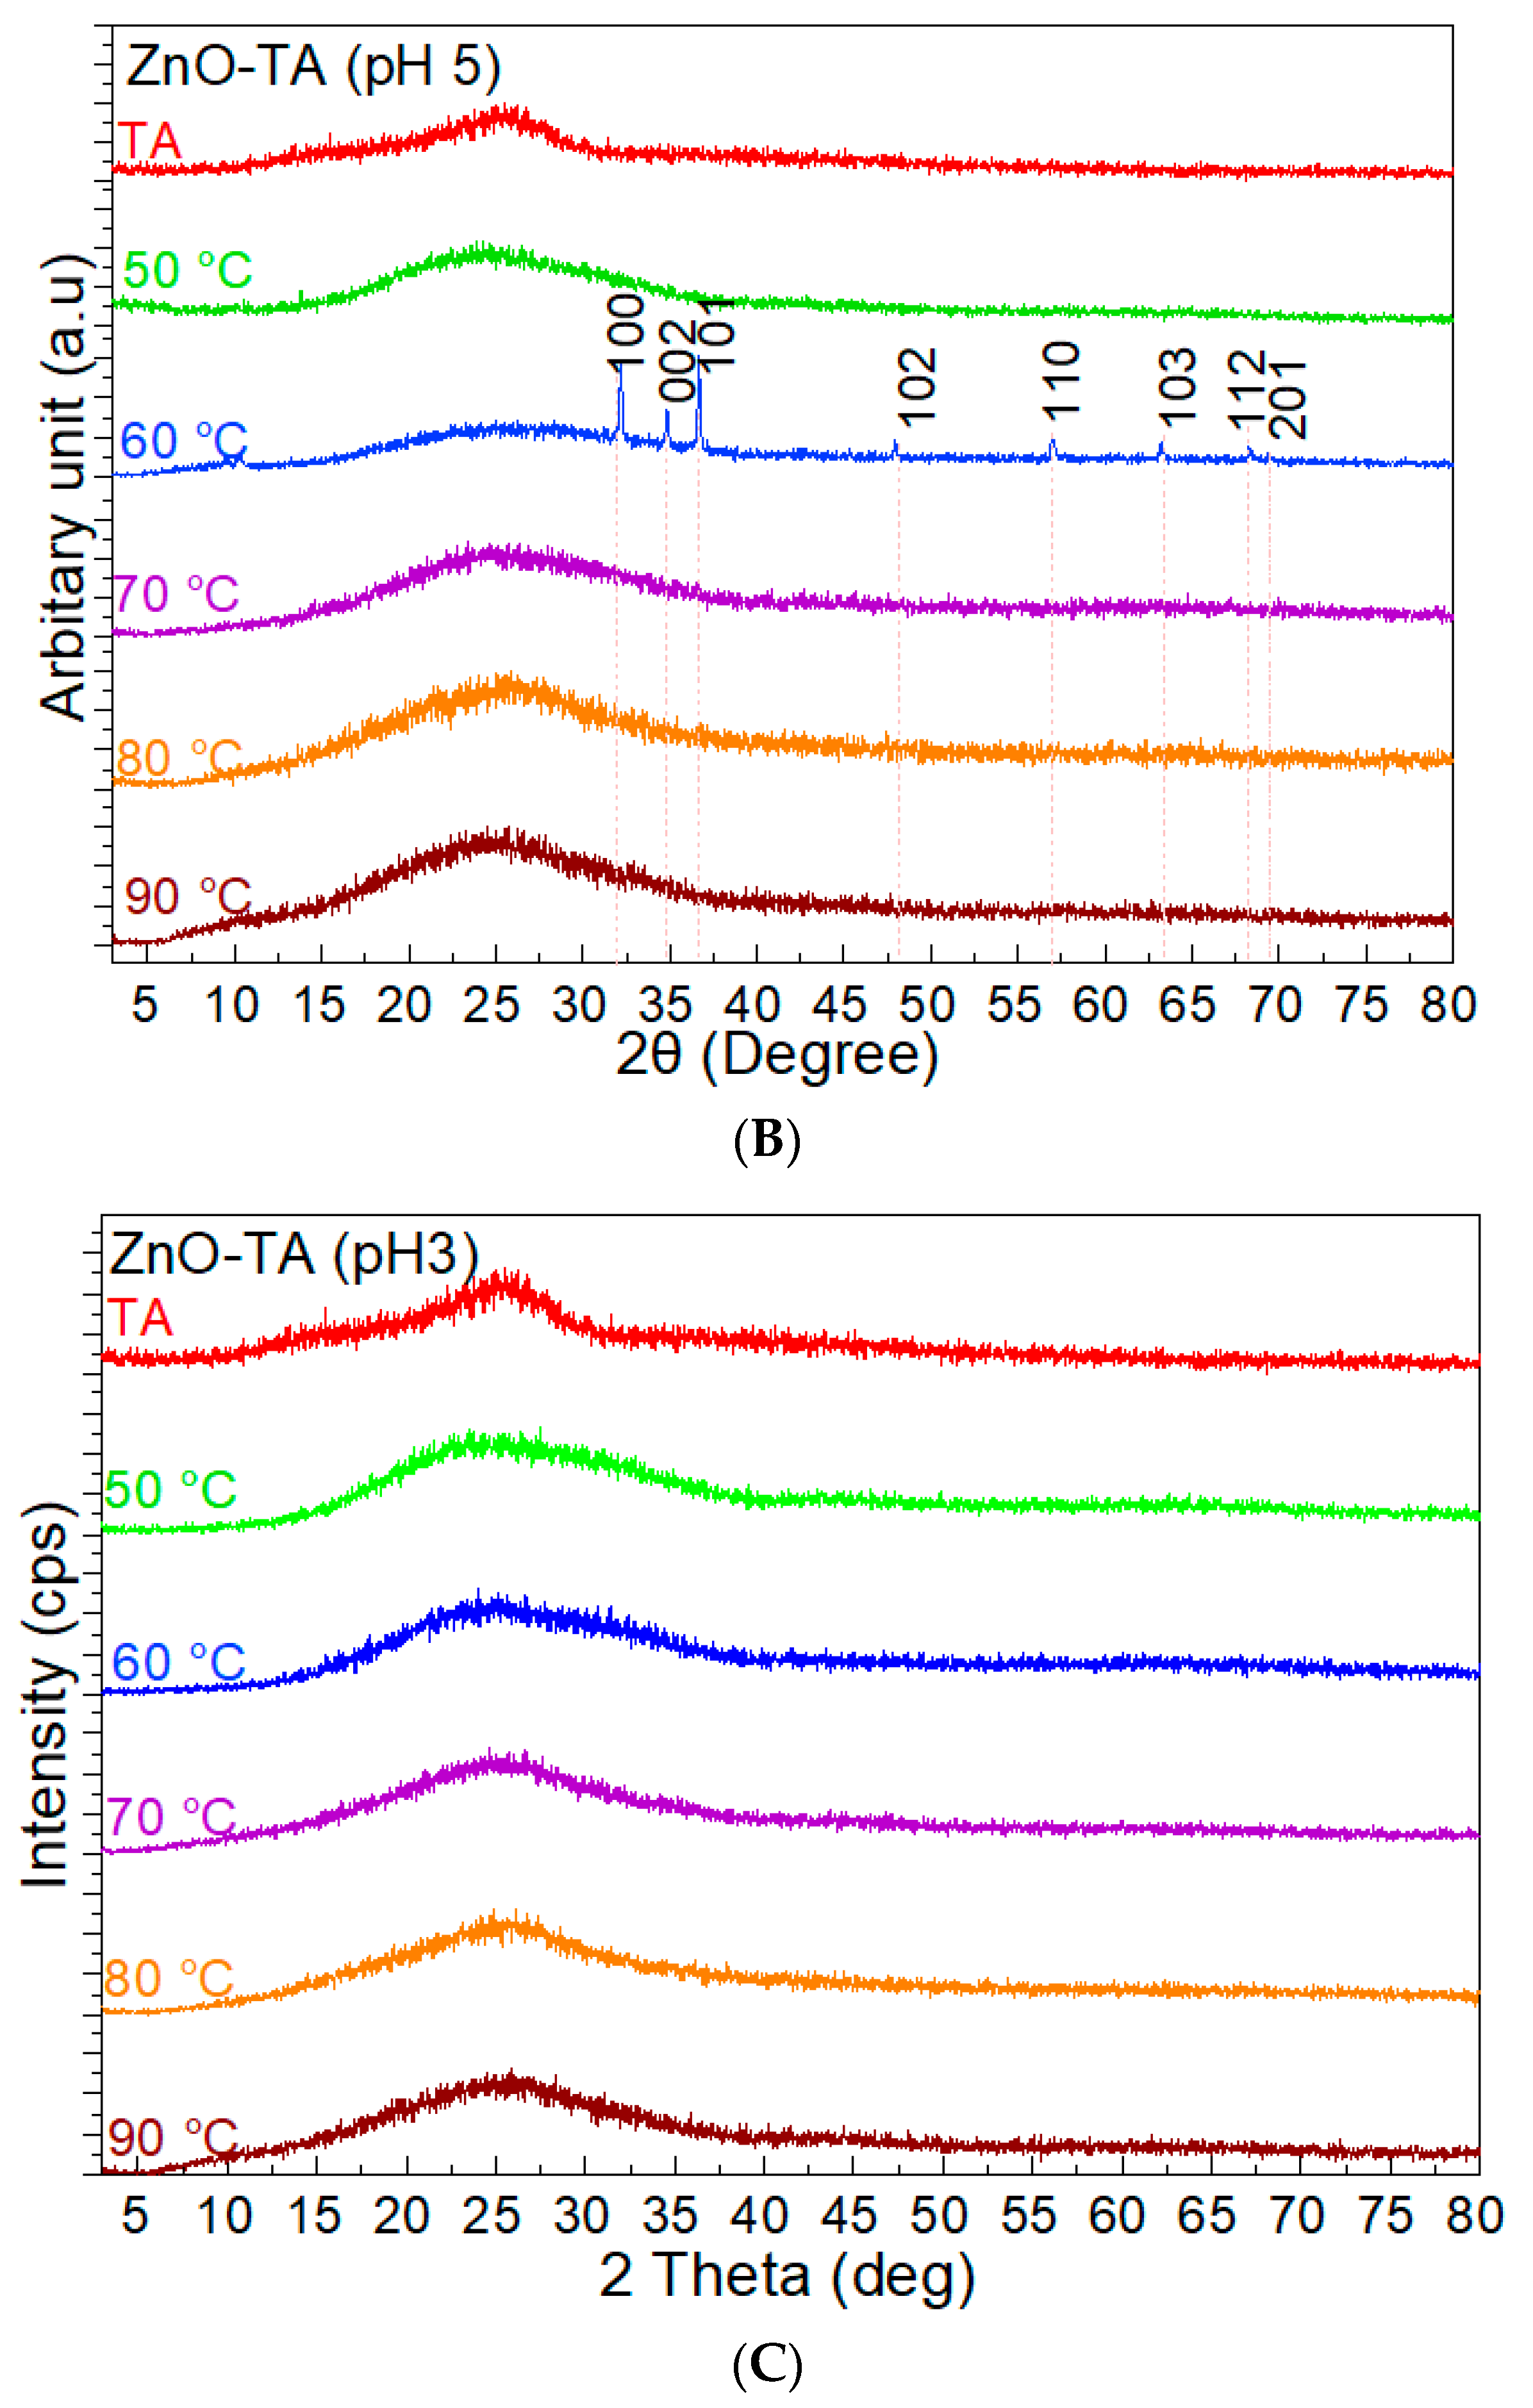
Figure 2A. Three prominent peaks correspond to reflections from (100), (002), and (101) atomic planes of ZnO phase. It shows the stability, possible directions for grain growth, and are appointed as minimum energy growth phases of ZnO crystal. The presence of other low-intensity reflections corresponds to (102), (110), (103), (200), (112), and (201) atomic planes of hexagonal ZnO lattice. In all the test samples for pure ZnO nanostructures, no peak corresponding to other phases or element/impurity emerged in the XRD analysis. Surprisingly, further added TA concentration in as-synthesized ZnO-TA nanostructures samples inhibits the dominancy of the crystalline phase by vanishing the peak intensities. It is observed that the addition of TA does dispel the diffraction peaks positions of the ZnO nanostructures as demonstrated in
Figure 2B,C for samples made at pH 5 and pH 3, respectively, which further implied the absence of any significant lattice on the ZnO wurtzite structure. Only one sample from pH 5 shows the presence of complete ZnO atomic planes. It is believed that during the deposition of the samples on the glass substrate, the amount of ZnO dropped is lower than the TA molecule. Thus, only TA molecules with amorphous spectrum structure in nature are exhibited as they imprinted over ZnO nanostructures in accordance with FESEM analysis.
3.2. Assembly of Pure ZnO and ZnO-TA Nanostructures
3.2.1. Influence of the Reaction Temperature
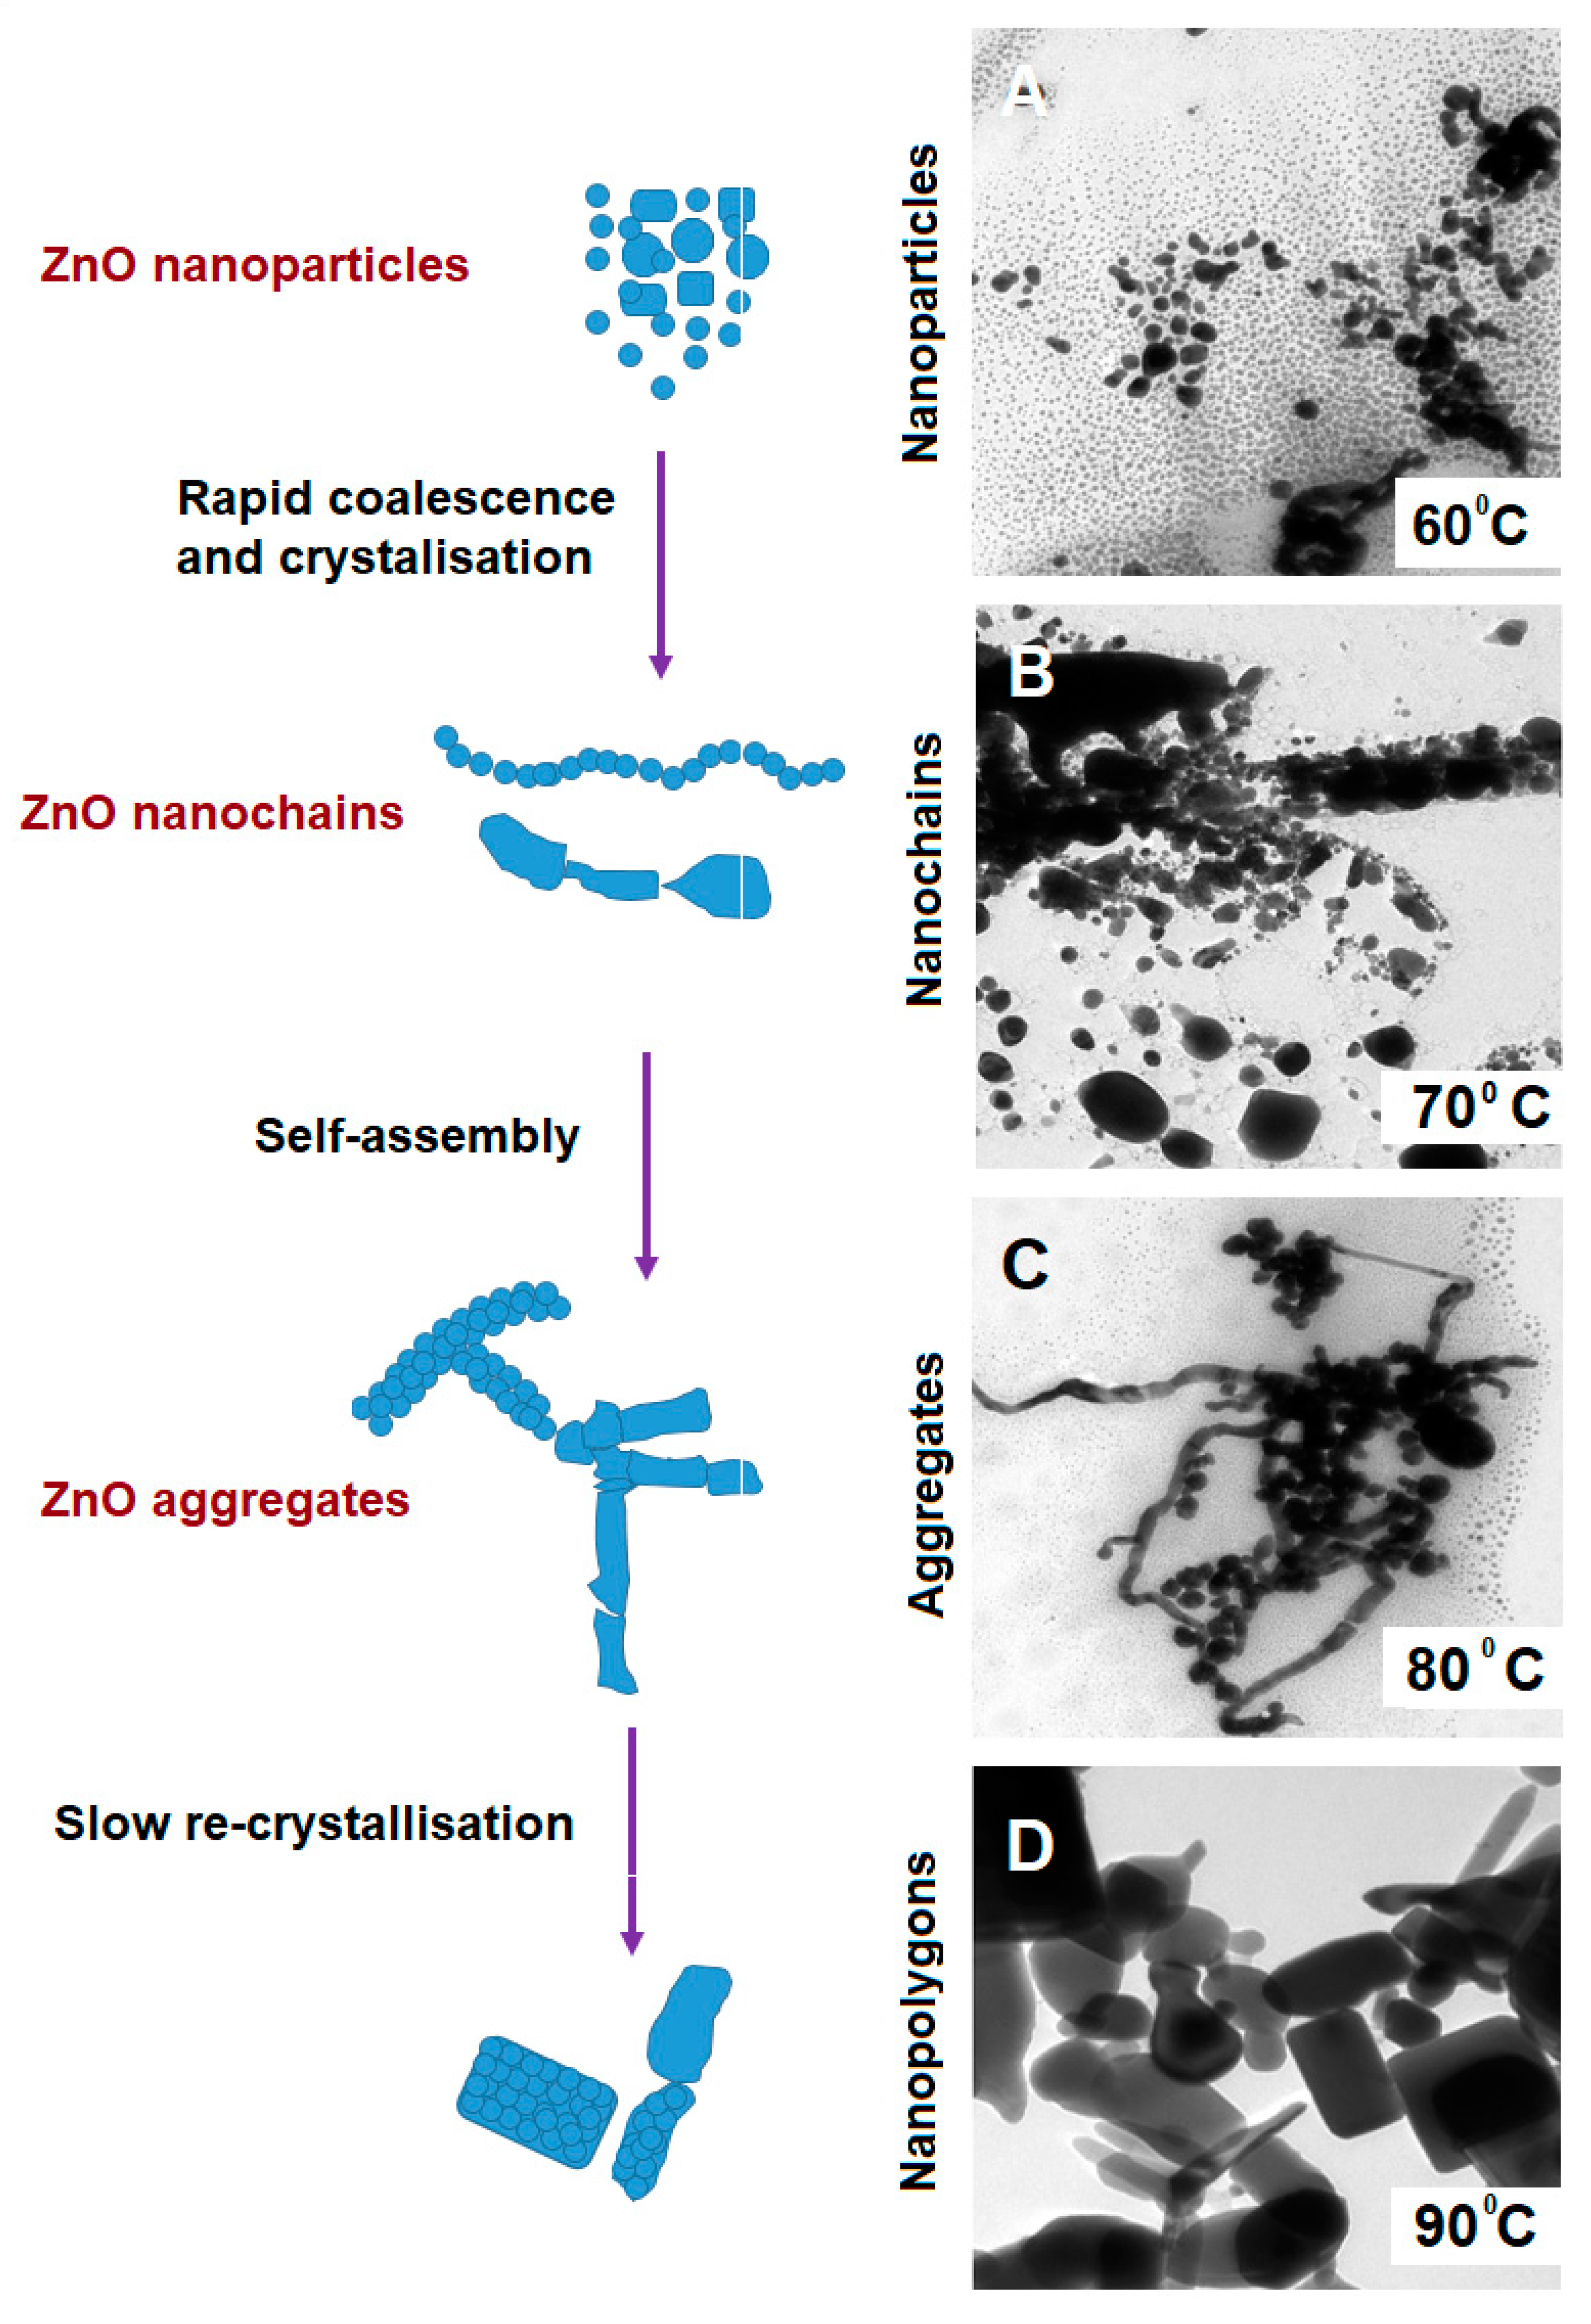
ZnO nanostructures obtained at different reactant temperatures exhibited remarkable activity caused by the active surfaces. Under the setup temperature and indirect generated pressure due to the heat, they automatically underwent similar “nanoparticle-nanochain-agglomerate-polygon array” structural evolution as represented in
Figure 3. First, the crystallization-driven self-assembly of the individual tiny ZnO nanoparticles changed into ZnO nano chains. The TEM micrographs demonstrated in
Figure 3A–D show the change of ZnO nanostructures assembly due to the influence of reactant temperatures at 60, 70, 80, and 90 °C. The ZnO nano chains that were created in H
2O, SC, and TA possess irregular curves line, not in straight lines. The ZnO nano chains consist of many small irregularly crystallized ZnO nanoparticles with d_m the range below 20 nm fused together and established a short net-like morphology (
Figure 3A). In particular, the ZnO nano chains formed that contained several straight lines that usually created from the round shape of nanoparticles (
< 10 nm) were connected with each other from different angles. The TEM micrograph in
Figure 3B,C showed that the small ZnO nanoparticles coalesced with each other and induced OA process. The typical crystallographic orientation is observed at the boundary among the nanoparticles. This aggregated process exactly represented the common growth mechanism of OA [
20]. Similar OA mechanism took place for the ZnO nanoparticles as the temperature increases (
Figure 3D). As noted beforehand, OA growth is the intermediate thermodynamically metastable state between the ripening nucleation process stage and OR growth stage in a dispersed medium nanosystem [
16,
21,
22].
At the initial phase, it is proved that the tiny individual ZnO nanoparticles possess strongly charged surface surfactants that tend to impede the OR growth (diffusion-controlled system growth) which exclusively mediate the OA mechanism. Nonetheless, our results showed that the ZnO nanoparticles are attracted to each other to construct oriented nano chains structure despite the presence of capping ligands. It is supposed that the small size nanoparticles with a narrow size distribution of ZnO nanoparticles condense the surface-free energy that activated and accelerated the coalescence between the adjacent nanoparticles. Furthermore, the bonding between the ZnO nanoparticles and the solvent molecules from the surrounding medium is facilitated by the numerous active surface sites The strong interaction forces created between the passivated surface of uncapped ZnO nanoparticles and solvent molecules are strong enough to overcome the different density of nanoparticles and to drive the agglomeration process of ZnO nano chains.
Under static liquid conditions, nanoparticles at close distances tend to agglomerate by moving toward each other, with the facets usually rotating until they achieved their preferred crystal direction alignment, and increased the plan-edge matching for OA determination. Generally, the agglomeration starts with small nanoparticles (
< 10 nm), loosely packed in a pentagonal configuration under slow rate, despite their proximity. It is noteworthy that, at the area of the high local concentration of nanoparticles, the Brownian diffusivity is decreased [
23,
24]. Thus, the OA mechanism is sometimes hindered by these nanoparticles pentagonal configuration, which restricts the orientation of the facet alignment with the neighboring particles. Also, the effect of the physical stirring during the synthesis reaction caused the misalignment. Apart from the existence of electrostatic repulsion surrounding the nanoparticles, van der Waals forces are the primary driving force to rapid agglomeration [
25,
26,
27].
The stirring rotation mainly influences the agglomeration speed during the reaction. The dissipated heat energy created by the nanoparticles enables them to overcome the electrostatic kinetic barrier to agglomeration. In static conditions, the binding on the surface limits the rotation. Only when the hydrodynamic forces overcome the binding force, nanoparticles tend to rotate and yield rapid orientation of nano alignment easily. This effect gives significant consequence for very close inter-particle distances, at the order of the particle size. This indicates that hydrodynamic forces play an important role in affecting the motion and alignment of nanoparticles during the stirring period. Thus, induced rapid OA aggregative growth with concurrent surface growth, yield from the multimodal particle size distribution [
28,
29,
30]. The agglomeration may take some time which is estimated to be slower due to the stirring-induced assembly alignment. It is speculated that the primary cause for the OA mechanism is when the combined factors such as the concentration of particles and rapid stirring during mixing, gives significant crystallization pathway. This observation suggested that the OA mechanism occurred in addition to OR, in the presence of slow dissolution and further recrystallisation process.
3.2.2. pH Influence
It has been proposed that the propensity to undergo OA is dependent upon the anisotropy of nanoparticle surface. In this study we show that suspensions with low pH values (3–5) caused those nanostructures edges to decrease through the slight dissociation of phenolic hydrogen groups in the pH range of natural water, lowering Coulombic repulsion and yielding the kinetically favored banded agglomeration around the edges [
31,
32]. This indicated that the introduction of a higher concentration of TA would lead to smaller nanostructures as the higher concentration of TA leads to the rapid formation of a greater number of nuclei.
The adsorbed TA anionic species play a significant role in the OA process mediating the interaction between the acid of the edge phenolic hydrogen group. For instance, phenols are weak acid and lower the pH of the solution., At pH 5, the TA caused an increased precipitation of ZnO nanostructures, as shown in
Figure 4. When the pH adjustment was made, the ZnO nanostructures formed with a light brown color suspension. The color of the suspension varied according to the pH value: pH 6, a light brown; pH 5, a pale dark brown; pH 3, a deep dark brown. The deep dark brown suspension formed that consists of ZnO and TA is a consequence of the action of TA. This action is a result of the effect of the colloidal association of the TA and zinc hydroxide molecules. For pH range of 5 to 3, the dark brown precipitation formed when the ZnO was oxidized equitably quickly to zinc hydroxide and the TA was mostly undissociated. It should be noted that only at pH more than 7 the formation of ZnO complexes [
33,
34] takes place as they are highly oxidized and slowly lost from the solution. As the complexes formed with the oxidized ZnO, the Zn ions are released, and black ZnO tannate is precipitated. Therefore, at pH lower than 3 where no complexes were formed, it is believed that abundance of ZnO had been adjusted to pH to 6 and 7 as explained elsewhere [
35,
36,
37] but not included in the present work.
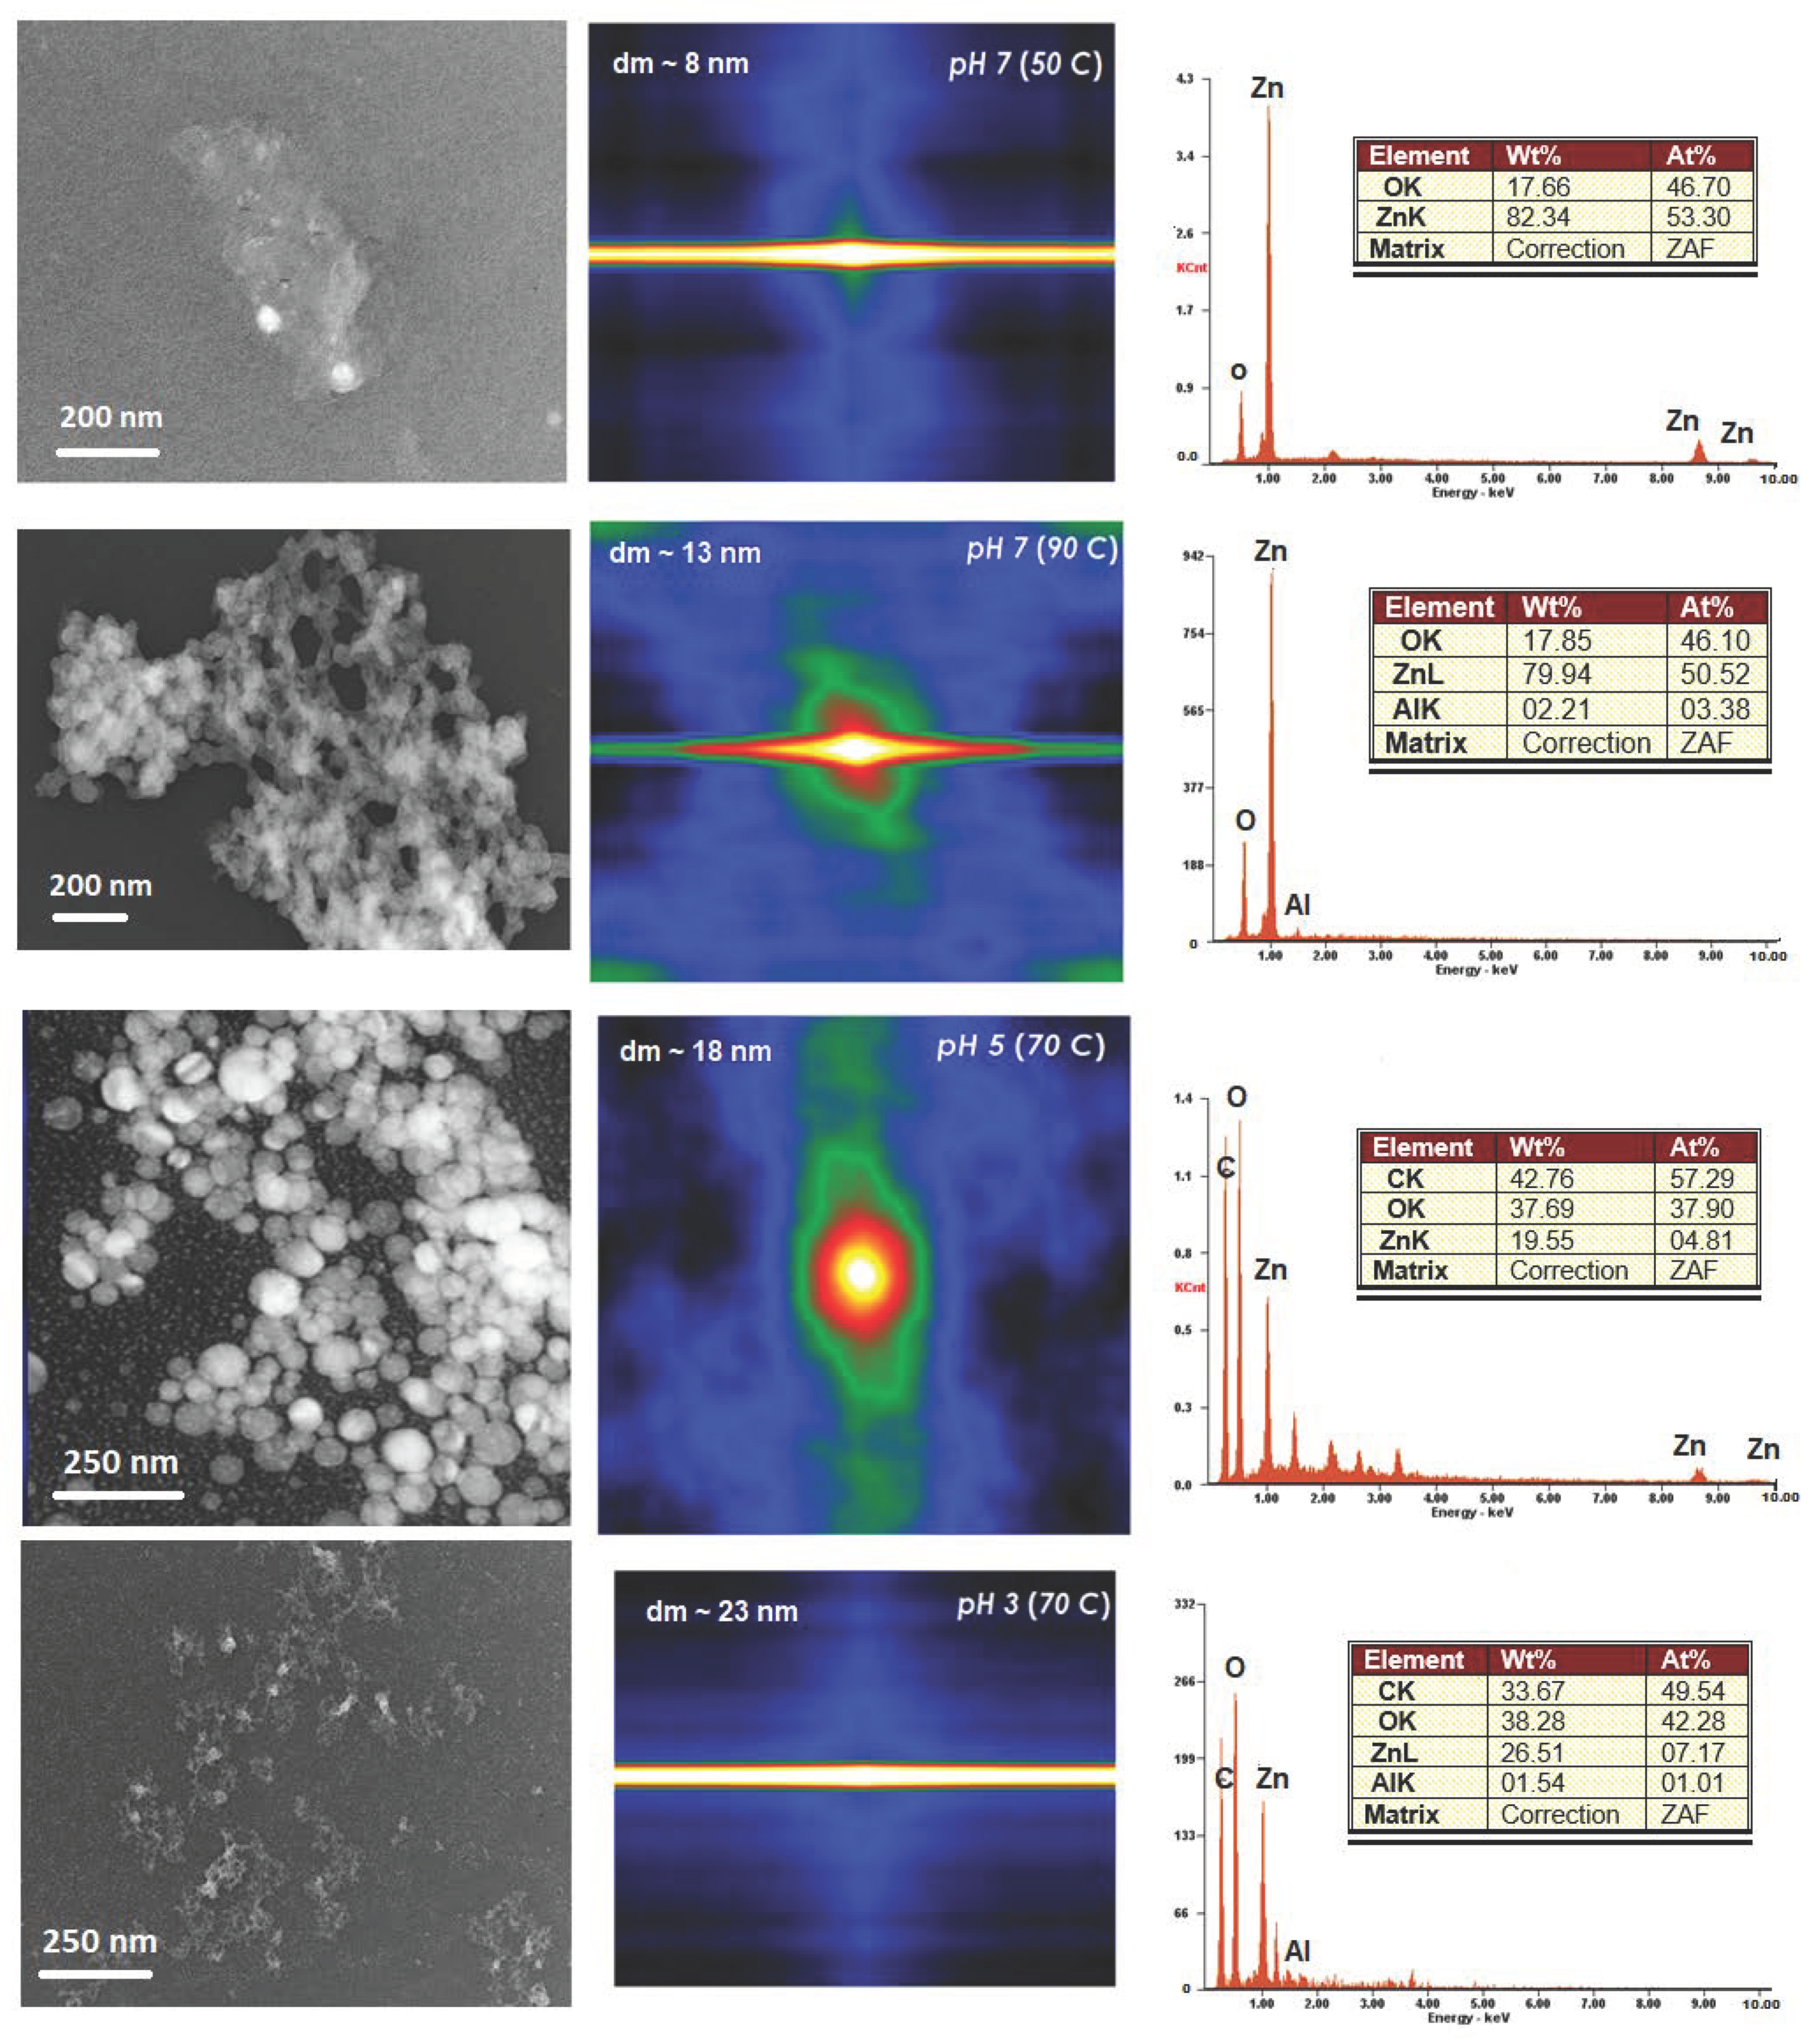
Notably, the difference between pure ZnO and ZnO-TA nanostructures is the higher rate of agglomeration in acidic medium. Hence, using polymer ligand that causes the acid interaction may induce OA and increase the ratio of basal to edge interaction. At pH 3, all the ZnO was oxidized by the time it contacted with TA. Noted that the rate of oxidation of the ZnO nanostructures upon the introduction of TA is a function of pH and the amount of TA itself. At pH 6 with not sufficient amount of TA, the oxidation rate was slowed and a minor effect was observed because of the reducing power of the TA. As the amount of TA increased, which decreased the pH number, the rate of the oxidation increased as supported by the EDX reports (right) from SEM images.
Noted that the definition of “agglomeration” and “aggregation” is different based on the International Union of Pure and Applied Chemistry (IUPAC) for nanostructures. Aggregation is defined as the joining of nanostructures through a strong interparticle bonding, causing irreversible clustering. Whereas, agglomeration is where the dispersed particles in the liquid are brought together through weak bond interaction which could also result in a phase separation known for its reversibility. Therefore, it is deduced that lowering the pH caused a decrease in the weak interactions (e.g., hydrogen bonding) between the nanostructures. Since there is a direct contact between the TA and ZnO atoms upon the reaction, the TA had a remarkable role in governing the reversible agglomeration and dispersion behavior of the prepared ZnO nanostructures.
According to the results above, it is concluded that the pH shows the pure ZnO nanostructures is dissimilar from that of the ZnO-TA nanostructures and that the TA is the leading cause for the new behavior of the ZnO-TA nanostructures. The TA attaches to the surface of ZnO nanostructures via hydrogen bond interactions due to the abundance of phenolic groups after the exposure of ZnO-TA nanostructures.
3.3. Autocorrelation
Direct fast Fourier transform (FFT) autocorrelation started with the analysis of the TEM micrograph images, as shown in
Figure 4. The direct autocorrelation function from the micrograph images was obtained from the function tab of autocorrelation using Gatan Suite Software. As the autocorrelation determines the self-similarity of an image, the result always shows a peak at the center (each image point is correlated to itself) and an additional structure that ranges from an amorphous background, for a random distribution of dots, to an ordered peak array, for an ordered lattice of dots. The autocorrelation of the micrograph region indicates a definite bright peak of correlation in the middle that is similar to the respective area from the original micrograph. The condition is always observed for autocorrelation functions as, the midpoint where the image is focused and been shifted either in
x- or
y-axis directions.
As observed from the micrographs and autocorrelation images, the sides of the mid contours are believed to represent the preferred distance to the nearest other nanostructural units in the image. Since ZnO are crystalline materials, a long-range order which defines the crystalline in the peaks is consistent with the reported work. The long contours in the x-axis line would correspond to the size of the structures visible in the image region. Nonetheless, the areas around the central contour may then indicate the existence of a second layer of nanostructure which is usually partially visible as proved by the TEM micrographs. The FFT autocorrelation method is a rapid technique with less aliasing problem. However, there is an obvious aliasing problem for samples pH 7 (50 °C) and pH 3 (70 °C) that affects the direct FFT correlation method. The effect is observed by the rise in the x-axis as a straight line due to the non-crystalline nature of the oxide caused by the discrete in-built function of the FFT method. The autocorrelation function analysis on the ZnO surface provides no evidence of dislocations nor discontinuous coverage. These data suggest that the thin surface layer consists of crystalline, not any sort of carbonaceous materials.
Noted that the irregular shape of the central contours may be correlated to different shapes of structural units exists in each region. Nonetheless, this may also cause by the different structural units for the respective region analyzed. The irregular shape of autocorrelation contour indicated that the x-axis is not representative plot of these functions.


