
Statistically Representative Metrology of Nanoparticles via Unsupervised Machine Learning of TEM Images

 , , ,
, , ,
Abstract
:1. Introduction
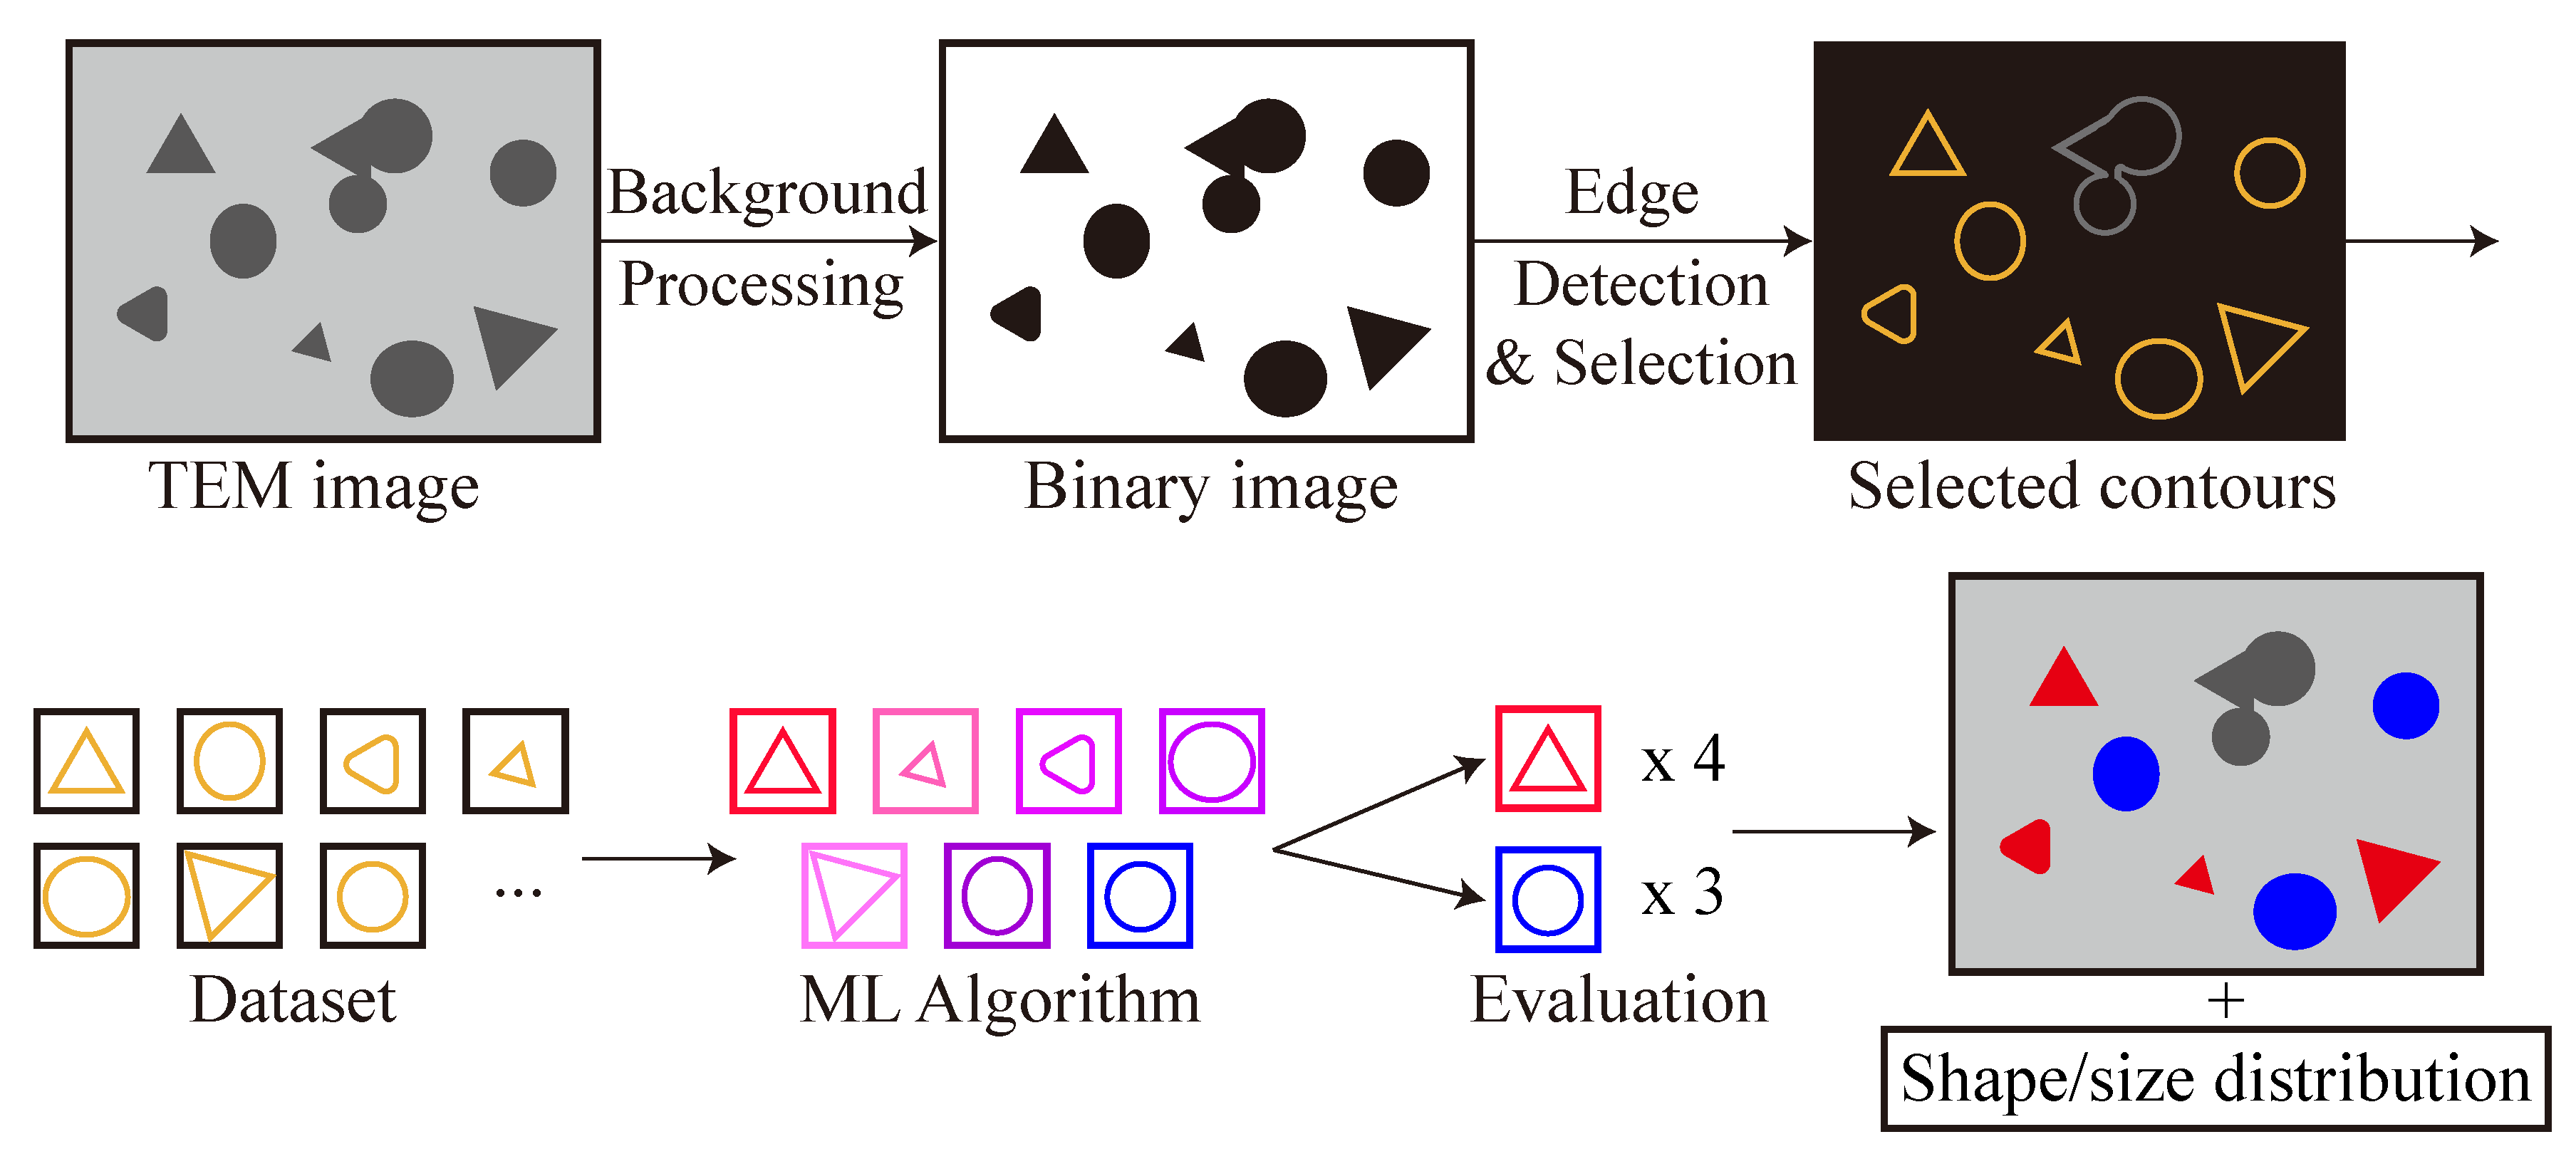
2. Methodology
2.1. Sample Preparation and TEM Imaging
2.2. Pre-Processing: Background Removal
2.3. Pre-Processing: Particle Edge Identification
2.4. Pre-Processing: Overlapping Particles Filtering
2.5. Classification
3. Results and Discussions
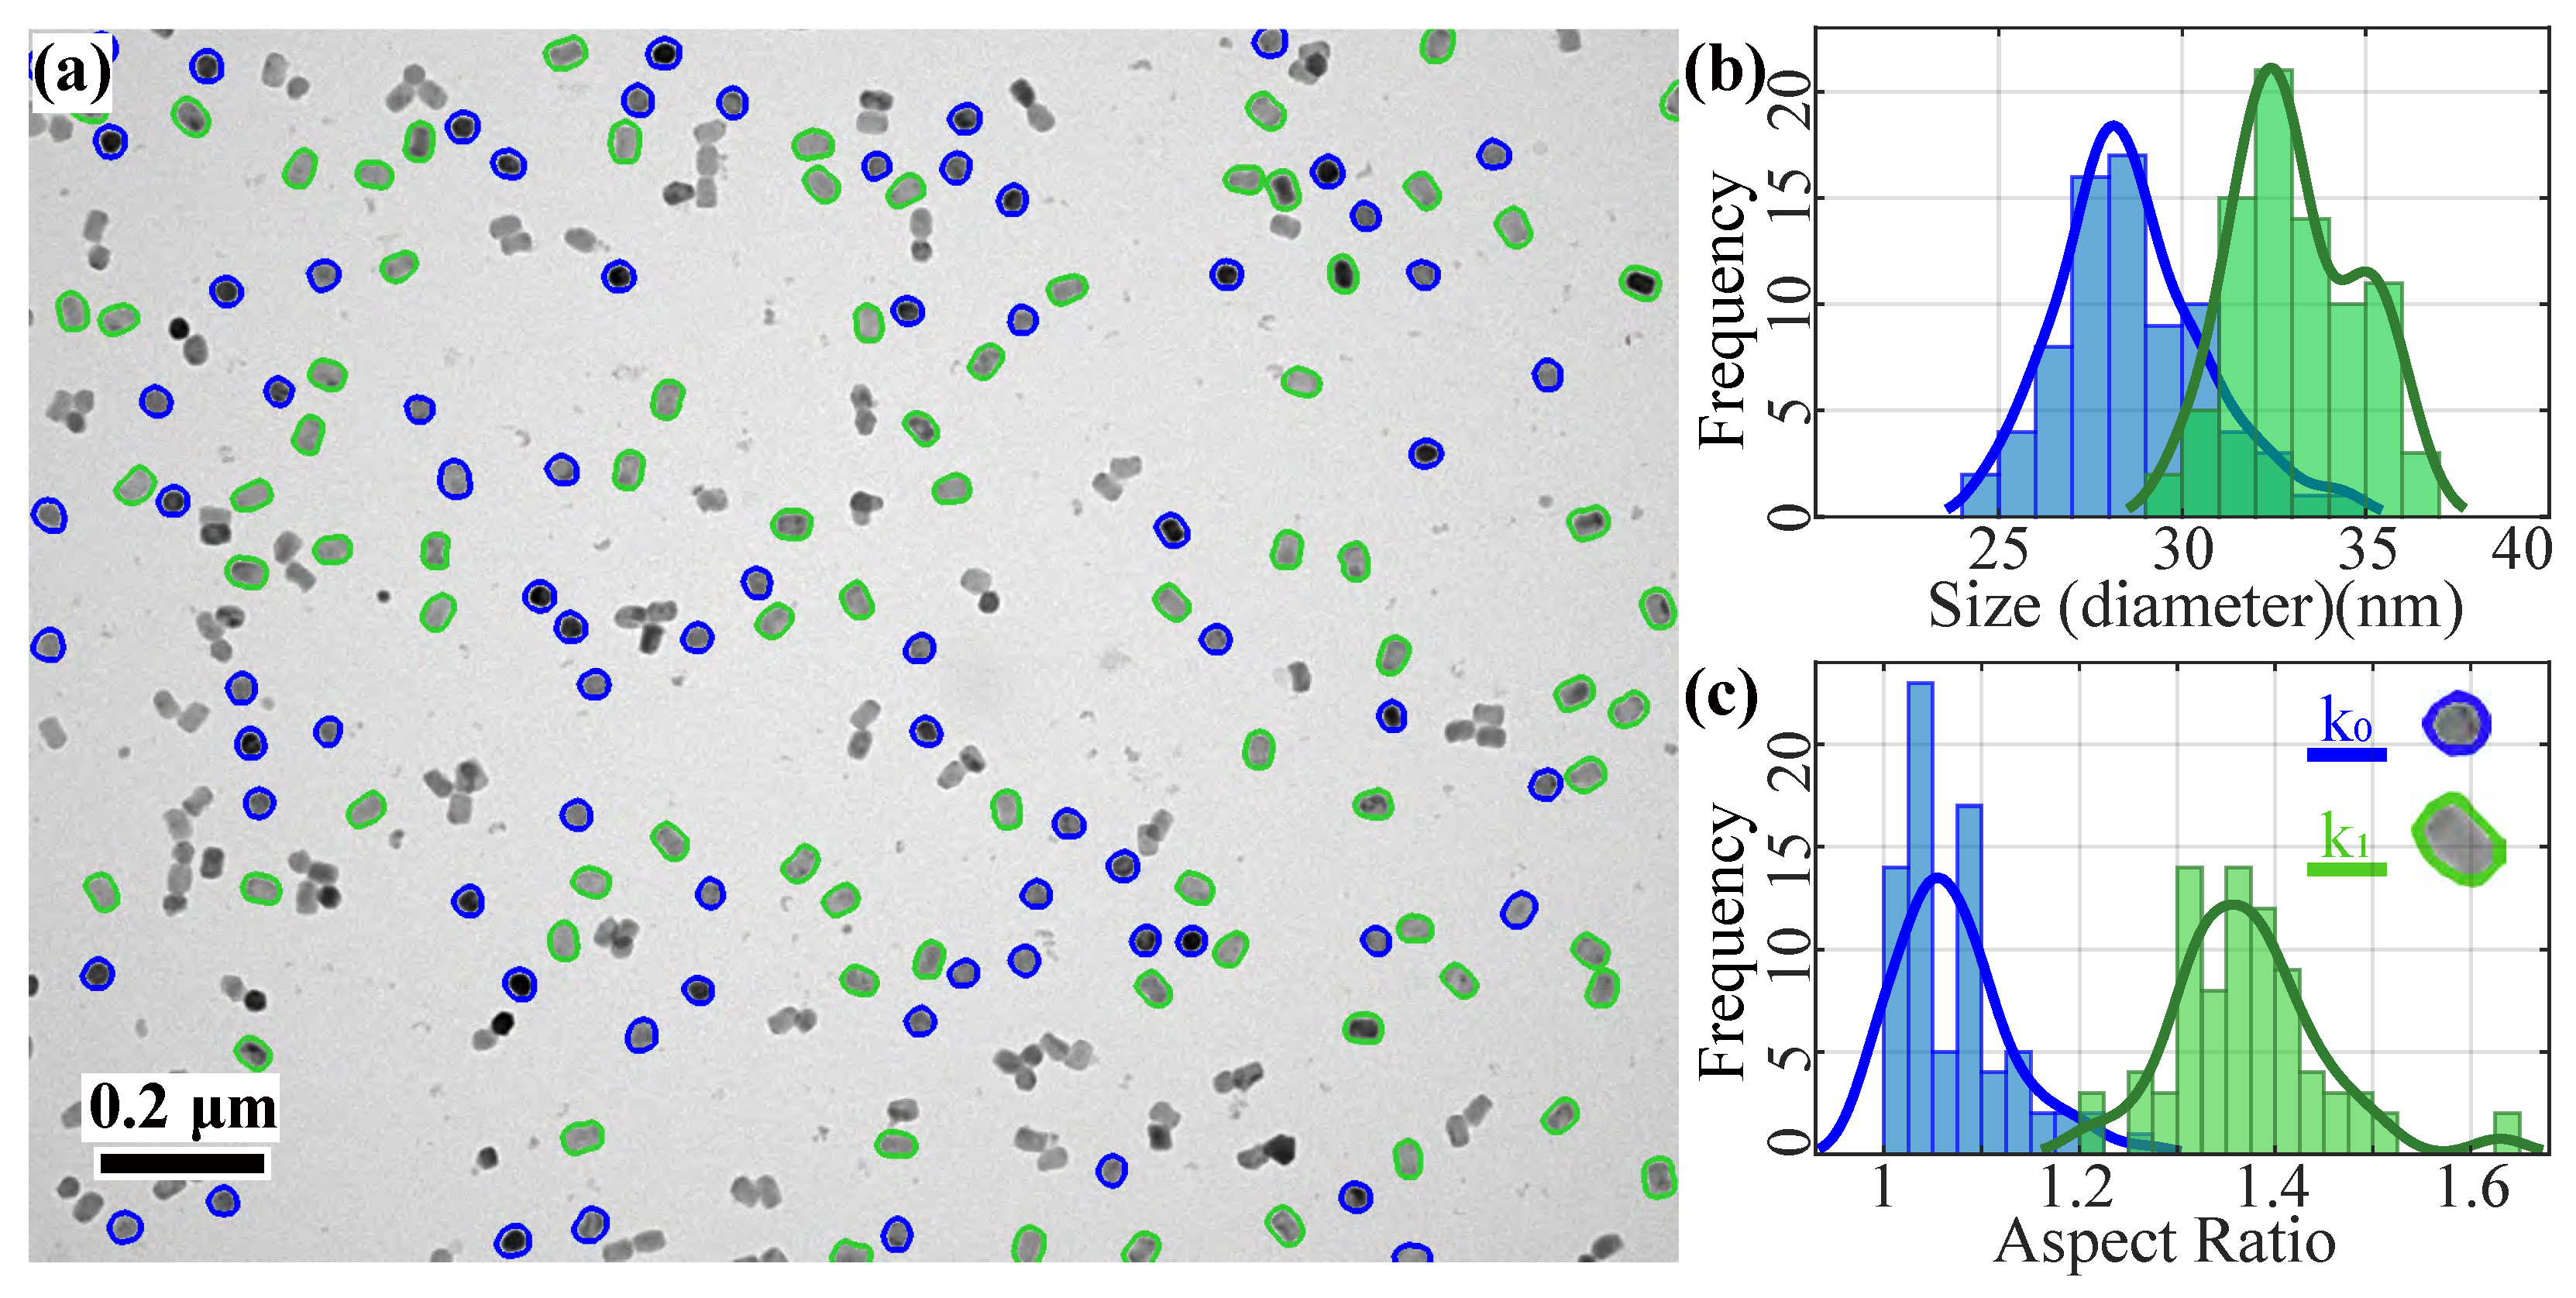
3.1. Well Dispersed, Multiple Shape Upconversion Nanoparticles
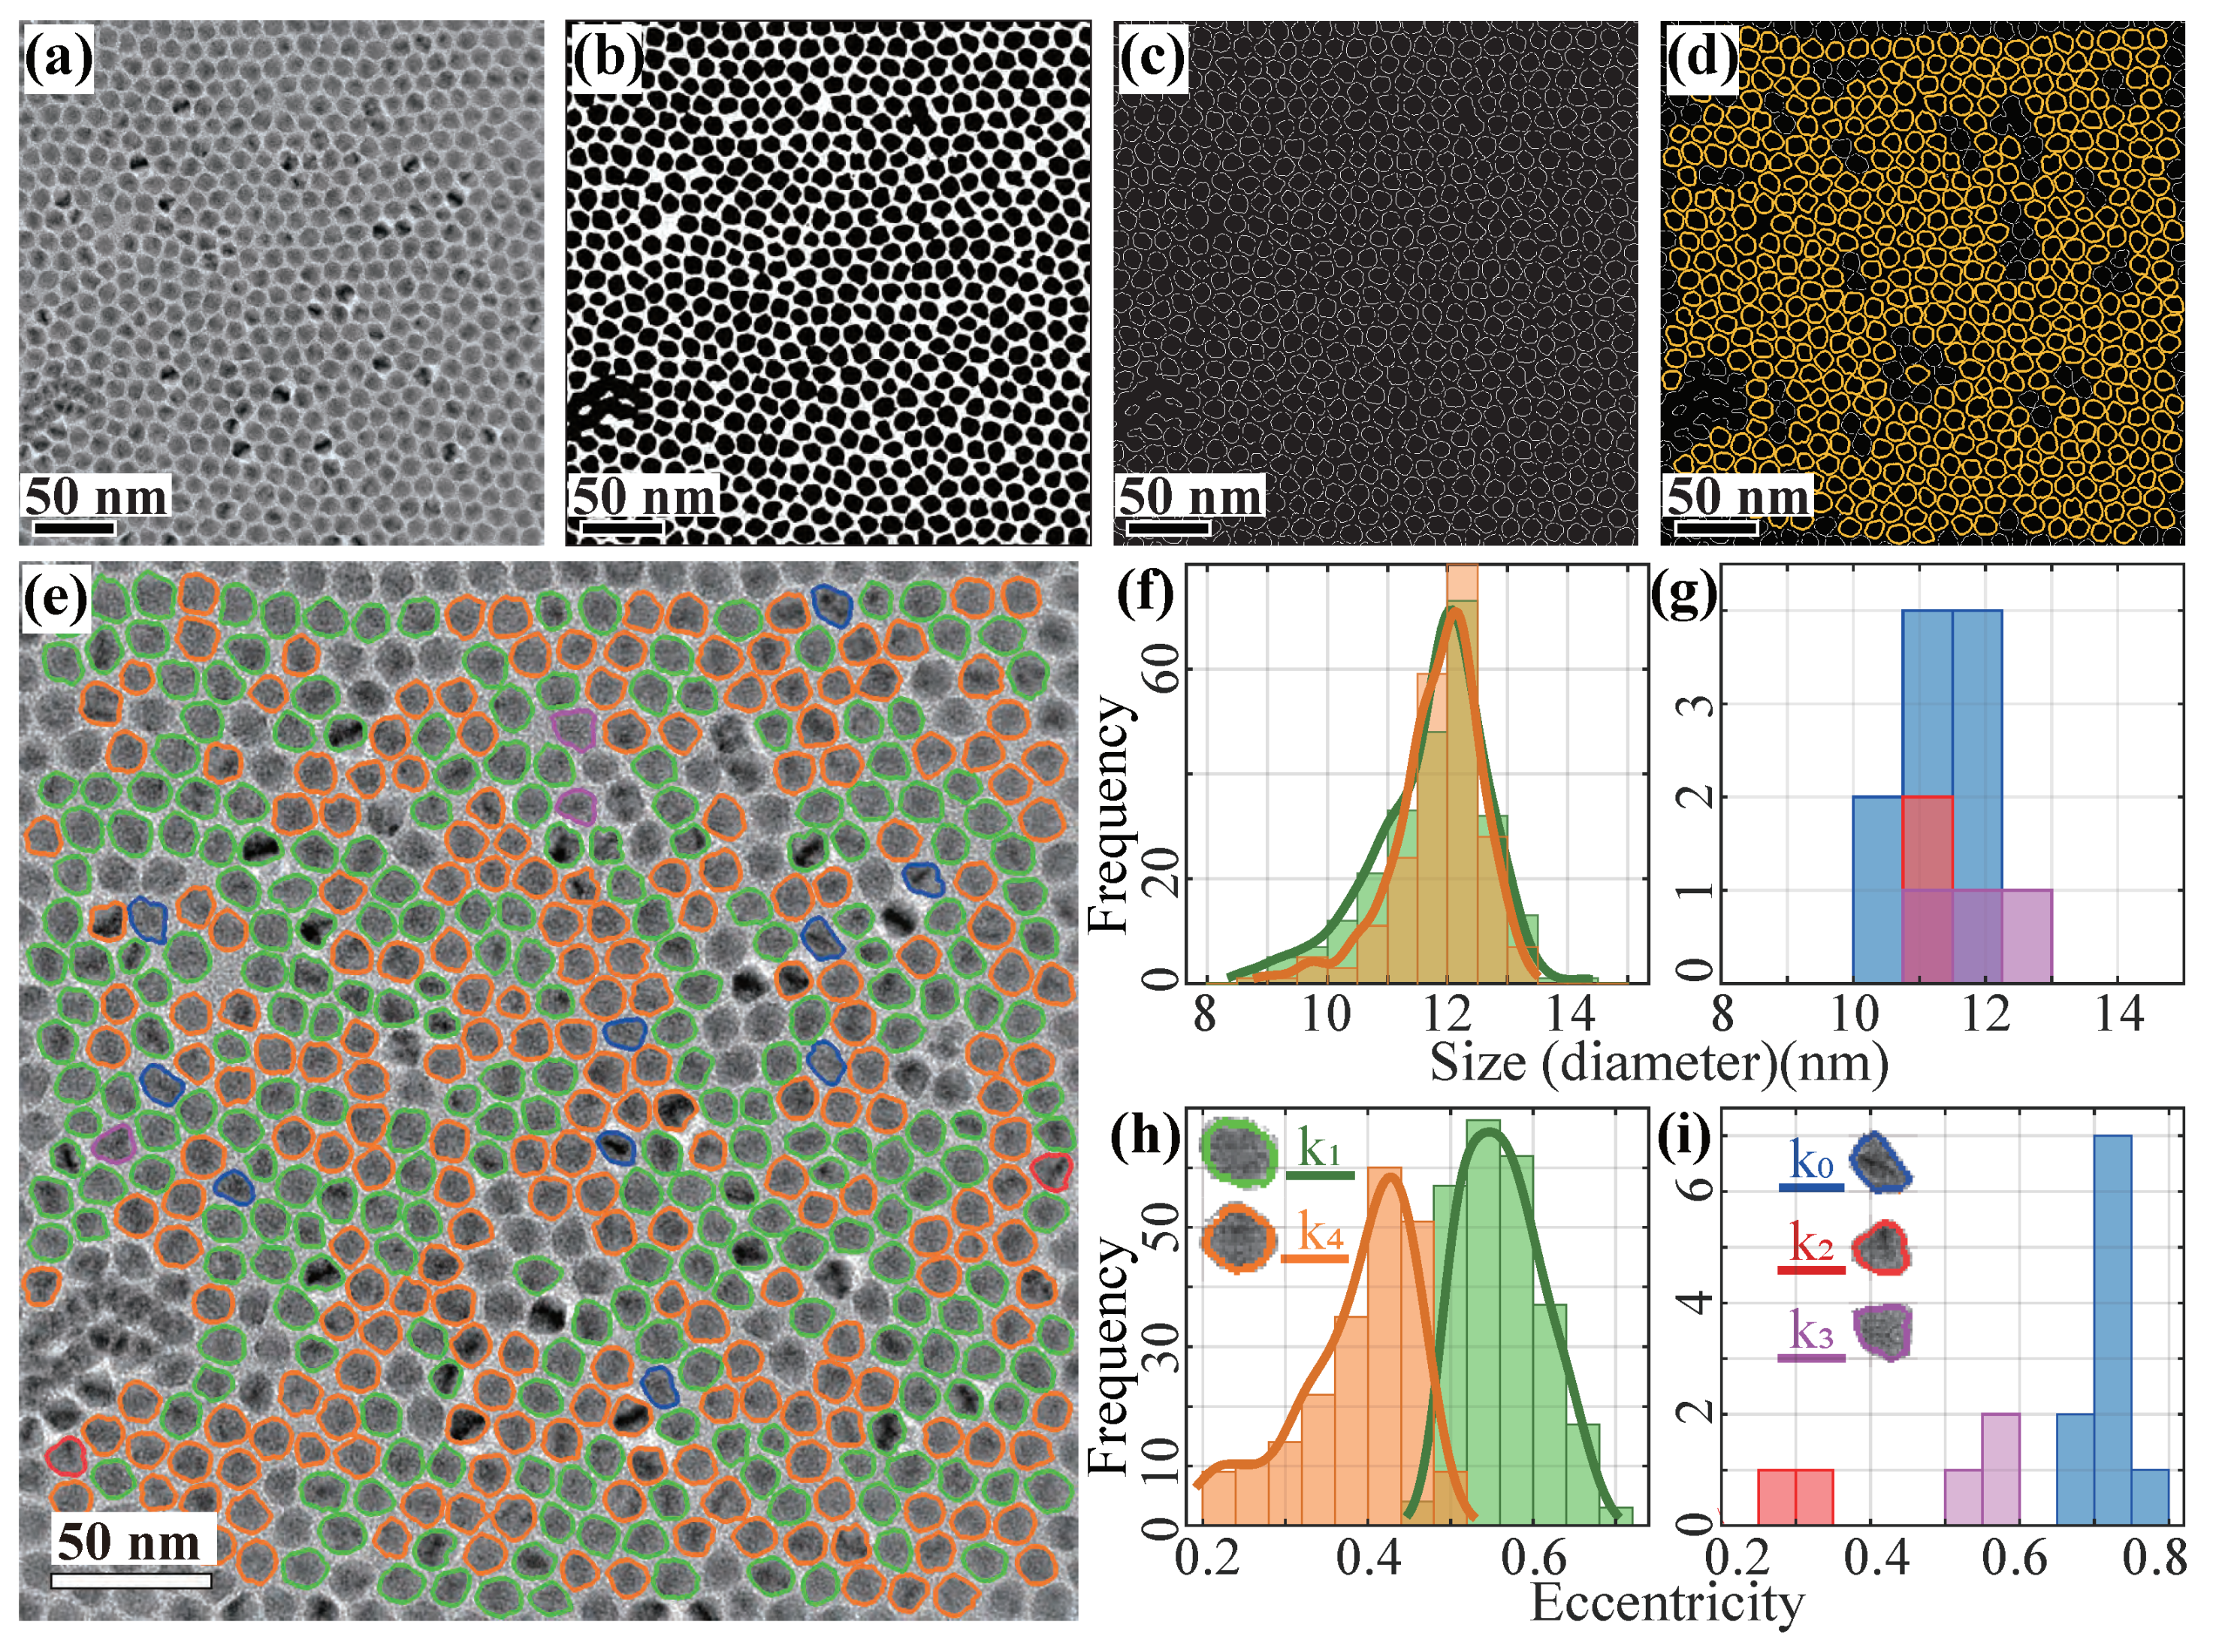
3.2. High Packing Density Semiconductor Quantum Dots
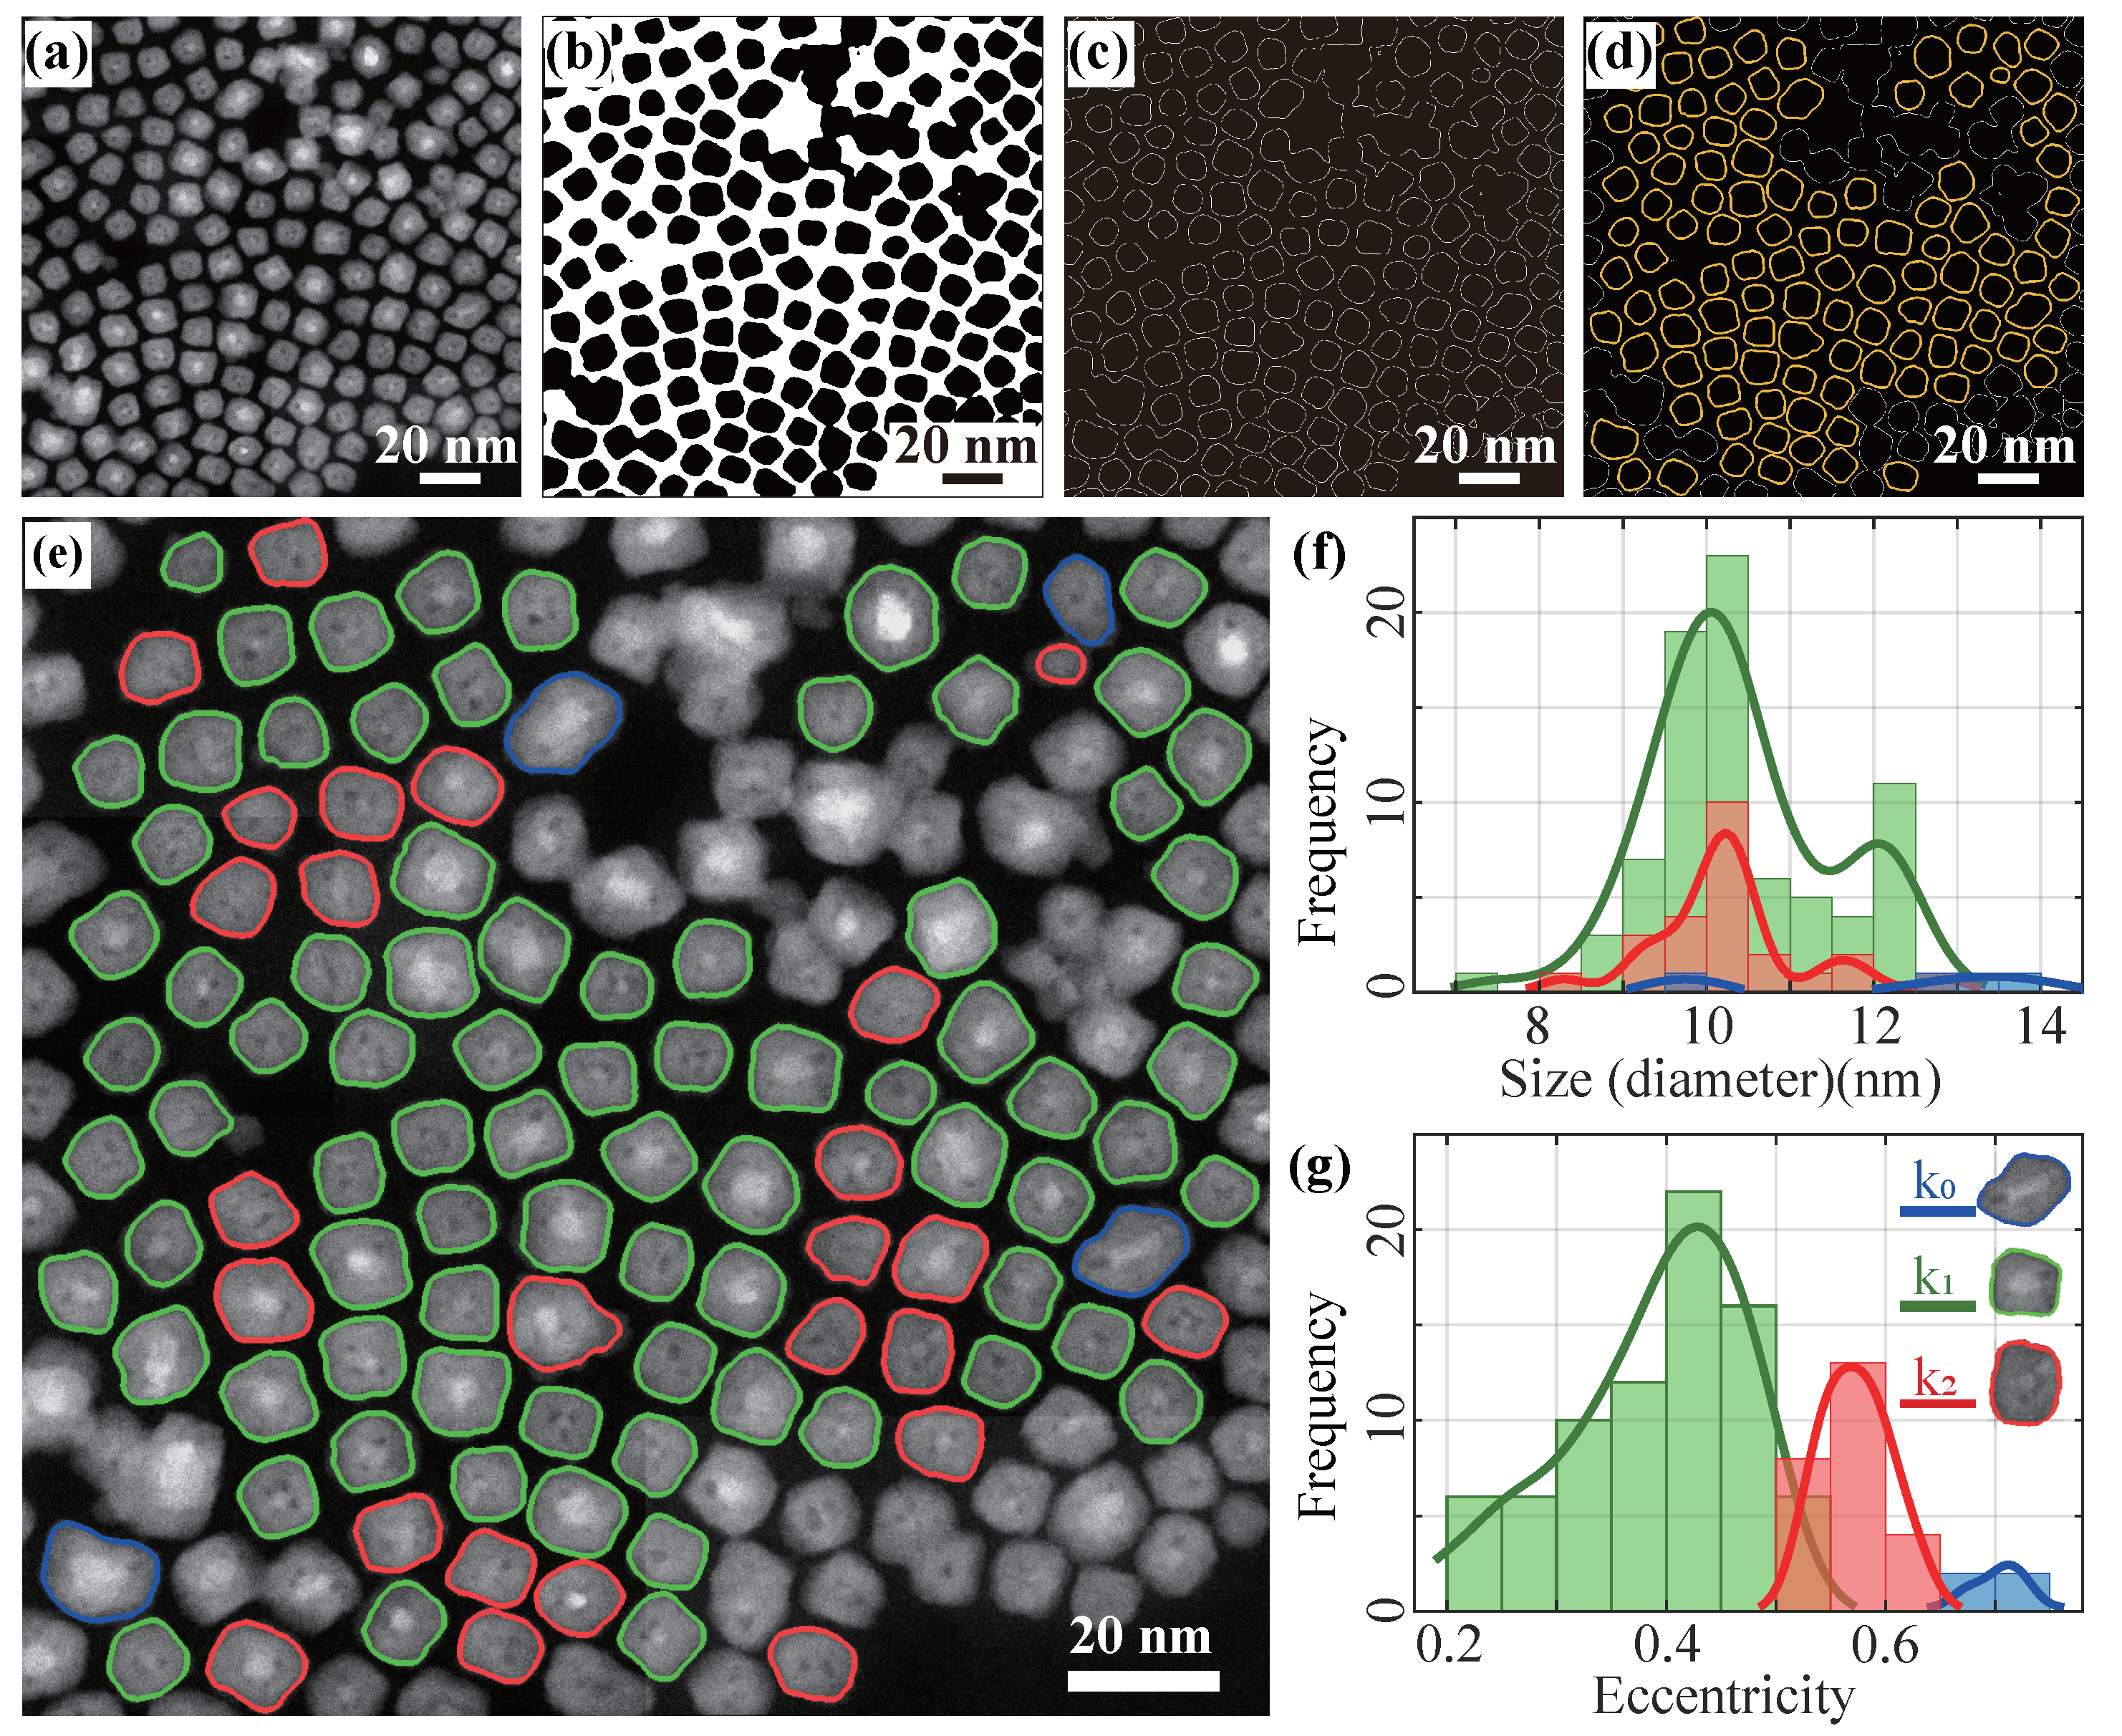
3.3. Iron Nanocubes from ADF-STEM Images
4. Conclusions
Supplementary Materials
Author Contributions
Funding
Data Availability Statement
Acknowledgments
Conflicts of Interest
References
- Wang, F.; Tan, W.B.; Zhang, Y.; Fan, X.; Wang, M. Luminescent nanomaterials for biological labelling. Nanotechnology 2005, 17, R1. [Google Scholar] [CrossRef]
- Rosenblum, L.T.; Kosaka, N.; Mitsunaga, M.; Choyke, P.L.; Kobayashi, H. In vivo molecular imaging using nanomaterials: General in vivo characteristics of nano-sized reagents and applications for cancer diagnosis. Mol. Membr. Biol. 2010, 27, 274–285. [Google Scholar] [CrossRef] [Green Version]
- Chen, Y.S.; Frey, W.; Kim, S.; Kruizinga, P.; Homan, K.; Emelianov, S. Silica-coated gold nanorods as photoacoustic signal nanoamplifiers. Nano Lett. 2011, 11, 348–354. [Google Scholar] [CrossRef]
- Hu, J.; Lawrence, M.; Dionne, J.A. High quality factor dielectric metasurfaces for ultraviolet circular dichroism spectroscopy. ACS Photonics 2019, 7, 36–42. [Google Scholar] [CrossRef]
- Rocha, U.; Jacinto da Silva, C.; Ferreira Silva, W.; Guedes, I.; Benayas, A.; Martinez Maestro, L.; Acosta Elias, M.; Bovero, E.; van Veggel, F.C.; Garcia Sole, J.A.; et al. Subtissue thermal sensing based on neodymium-doped LaF3 nanoparticles. ACS Nano 2013, 7, 1188–1199. [Google Scholar] [CrossRef]
- Kalytchuk, S.; Poláková, K.; Wang, Y.; Froning, J.P.; Cepe, K.; Rogach, A.L.; Zbořil, R. Carbon dot nanothermometry: Intracellular photoluminescence lifetime thermal sensing. ACS Nano 2017, 11, 1432–1442. [Google Scholar] [CrossRef]
- Gandolfi, M.; Crut, A.; Medeghini, F.; Stoll, T.; Maioli, P.; Vallée, F.; Banfi, F.; Del Fatti, N. Ultrafast thermo-optical dynamics of plasmonic nanoparticles. J. Phys. Chem. C 2018, 122, 8655–8666. [Google Scholar] [CrossRef]
- Sun, X.; Zhang, Y.; Chen, G.; Gai, Z. Application of nanoparticles in enhanced oil recovery: A critical review of recent progress. Energies 2017, 10, 345. [Google Scholar] [CrossRef] [Green Version]
- Savage, N.; Diallo, M.S. Nanomaterials and water purification: Opportunities and challenges. J. Nanoparticle Res. 2005, 7, 331–342. [Google Scholar] [CrossRef]
- Chen, W.T.; Zhu, A.Y.; Sanjeev, V.; Khorasaninejad, M.; Shi, Z.; Lee, E.; Capasso, F. A broadband achromatic metalens for focusing and imaging in the visible. Nat. Nanotechnol. 2018, 13, 220–226. [Google Scholar] [CrossRef] [PubMed] [Green Version]
- Celebrano, M.; Rocco, D.; Gandolfi, M.; Zilli, A.; Rusconi, F.; Tognazzi, A.; Mazzanti, A.; Ghirardini, L.; Pogna, E.A.; Carletti, L.; et al. Optical tuning of dielectric nanoantennas for thermo-optically reconfigurable nonlinear metasurfaces. Opt. Lett. 2021, 46, 2453–2456. [Google Scholar] [CrossRef]
- Liu, S.; Vabishchevich, P.P.; Vaskin, A.; Reno, J.L.; Keeler, G.A.; Sinclair, M.B.; Staude, I.; Brener, I. An all-dielectric metasurface as a broadband optical frequency mixer. Nat. Commun. 2018, 9, 1–6. [Google Scholar] [CrossRef] [Green Version]
- Ronchi, A.; Sterzi, A.; Gandolfi, M.; Belarouci, A.; Giannetti, C.; Del Fatti, N.; Banfi, F.; Ferrini, G. Discrimination of nano-objects via cluster analysis techniques applied to time-resolved thermo-acoustic microscopy. Ultrasonics 2021, 114, 106403. [Google Scholar] [CrossRef]
- Chuang, P.H.; Lin, C.C.; Liu, R.S. Emission-tunable CuInS2/ZnS quantum dots: Structure, optical properties, and application in white light-emitting diodes with high color rendering index. ACS Appl. Mater. Interfaces 2014, 6, 15379–15387. [Google Scholar] [CrossRef]
- Nayak, L.; Mohanty, S.; Nayak, S.K.; Ramadoss, A. A review on inkjet printing of nanoparticle inks for flexible electronics. J. Mater. Chem. C 2019, 7, 8771–8795. [Google Scholar] [CrossRef]
- Xie, C.; Niu, Z.; Kim, D.; Li, M.; Yang, P. Surface and interface control in nanoparticle catalysis. Chem. Rev. 2019, 120, 1184–1249. [Google Scholar] [CrossRef] [PubMed] [Green Version]
- Köhler, J.; Abahmane, L.; Wagner, J.; Albert, J.; Mayer, G. Preparation of metal nanoparticles with varied composition for catalytical applications in microreactors. Chem. Eng. Sci. 2008, 63, 5048–5055. [Google Scholar] [CrossRef]
- Gaumet, M.; Vargas, A.; Gurny, R.; Delie, F. Nanoparticles for drug delivery: The need for precision in reporting particle size parameters. Eur. J. Pharm. Biopharm. 2008, 69, 1–9. [Google Scholar] [CrossRef] [PubMed]
- Banerjee, A.; Chattopadhyay, K. Size-dependent optical properties of sputter-deposited nanocrystalline p-type transparent Cu Al O 2 thin films. J. Appl. Phys. 2005, 97, 084308. [Google Scholar] [CrossRef]
- Huang, M.H. Facet-Dependent Optical Properties of Semiconductor Nanocrystals. Small 2019, 15, 1804726. [Google Scholar] [CrossRef]
- Pang, G.A.; Laufer, J.; Niessner, R.; Haisch, C. Photoacoustic signal generation in gold nanospheres in aqueous solution: Signal generation enhancement and particle diameter effects. J. Phys. Chem. C 2016, 120, 27646–27656. [Google Scholar] [CrossRef]
- Gandolfi, M.; Banfi, F.; Glorieux, C. Optical wavelength dependence of photoacoustic signal of gold nanofluid. Photoacoustics 2020, 20, 100199. [Google Scholar] [CrossRef] [PubMed]
- Pang, G.A.; Poisson, F.; Laufer, J.; Haisch, C.; Bossy, E. Theoretical and experimental study of photoacoustic excitation of silica-coated gold nanospheres in water. J. Phys. Chem. C 2019, 124, 1088–1098. [Google Scholar] [CrossRef] [Green Version]
- Reineck, P.; Trindade, L.F.; Havlik, J.; Stursa, J.; Heffernan, A.; Elbourne, A.; Orth, A.; Capelli, M.; Cigler, P.; Simpson, D.A.; et al. Not all fluorescent nanodiamonds are created equal: A comparative study. Part. Part. Syst. Charact. 2019, 36, 1900009. [Google Scholar] [CrossRef]
- Cui, J.; Beyler, A.P.; Marshall, L.F.; Chen, O.; Harris, D.K.; Wanger, D.D.; Brokmann, X.; Bawendi, M.G. Direct probe of spectral inhomogeneity reveals synthetic tunability of single-nanocrystal spectral linewidths. Nat. Chem. 2013, 5, 602–606. [Google Scholar] [CrossRef]
- Lavorato, G.; Alzamora, M.; Contreras, C.; Burlandy, G.; Litterst, F.J.; Baggio-Saitovitch, E. Internal structure and magnetic properties in cobalt ferrite nanoparticles: Influence of the synthesis method. Part. Part. Syst. Charact. 2019, 36, 1900061. [Google Scholar] [CrossRef]
- Gontard, L.C.; Chang, L.Y.; Hetherington, C.J.; Kirkland, A.I.; Ozkaya, D.; Dunin-Borkowski, R.E. Aberration-corrected imaging of active sites on industrial catalyst nanoparticles. Angew. Chem. 2007, 119, 3757–3759. [Google Scholar] [CrossRef]
- Shery, L. Size dependent surface reconstruction in detonation nanodiamonds. Nanoscale Horizons 2018, 3, 213–217. [Google Scholar]
- Chang, L.Y.; Barnard, A.S.; Gontard, L.C.; Dunin-Borkowski, R.E. Resolving the structure of active sites on platinum catalytic nanoparticles. Nano Lett. 2010, 10, 3073–3076. [Google Scholar] [CrossRef]
- Evans, J.E.; Jungjohann, K.L.; Browning, N.D.; Arslan, I. Controlled growth of nanoparticles from solution with in situ liquid transmission electron microscopy. Nano Lett. 2011, 11, 2809–2813. [Google Scholar] [CrossRef] [PubMed] [Green Version]
- Abràmoff, M.D.; Magalhães, P.J.; Ram, S.J. Image processing with ImageJ. Biophotonics Int. 2004, 11, 36–42. [Google Scholar]
- Woehrle, G.H.; Hutchison, J.E.; Özkar, S.; Finke, R.G. Analysis of nanoparticle transmission electron microscopy data using a public-domain image-processing program, image. Turk. J. Chem. 2006, 30, 1–13. [Google Scholar]
- Tarca, A.L.; Carey, V.J.; Chen, X.W.; Romero, R.; Drăghici, S. Machine learning and its applications to biology. PLoS Comput. Biol. 2007, 3, e116. [Google Scholar] [CrossRef] [PubMed]
- Khan, A.; Baharudin, B.; Lee, L.H.; Khan, K. A review of machine learning algorithms for text-documents classification. J. Adv. Inf. Technol. 2010, 1, 4–20. [Google Scholar]
- Cid-Mejías, A.; Alonso-Calvo, R.; Gavilán, H.; Crespo, J.; Maojo, V. A deep learning approach using synthetic images for segmenting and estimating 3D orientation of nanoparticles in EM images. Comput. Methods Programs Biomed. 2021, 202, 105958. [Google Scholar] [CrossRef]
- Asari, Y.; Terada, S.; Tanigaki, T.; Takahashi, Y.; Shinada, H.; Nakajima, H.; Kanie, K.; Murakami, Y. Deep convolutional neural network image processing method providing improved signal-to-noise ratios in electron holography. Microscopy 2021. [Google Scholar] [CrossRef] [PubMed]
- Hughes, A.; Liu, Z.; Raftari, M.; Reeves, M.E. A Workflow for Characterizing Nanoparticle Monolayers for Biosensors: Machine Learning on Real and Artificial SEM Images; Technical Report; PeerJ PrePrints: London, UK, 2014. [Google Scholar]
- Pellegrino, F.; Isopescu, R.; Pellutiè, L.; Sordello, F.; Rossi, A.M.; Ortel, E.; Martra, G.; Hodoroaba, V.D.; Maurino, V. Machine learning approach for elucidating and predicting the role of synthesis parameters on the shape and size of TiO 2 nanoparticles. Sci. Rep. 2020, 10, 1–11. [Google Scholar] [CrossRef] [PubMed]
- Lee, B.; Yoon, S.; Lee, J.W.; Kim, Y.; Chang, J.; Yun, J.; Ro, J.C.; Lee, J.S.; Lee, J.H. Statistical Characterization of the Morphologies of Nanoparticles through Machine Learning Based Electron Microscopy Image Analysis. ACS Nano 2020, 14, 17125–17133. [Google Scholar] [CrossRef]
- Wang, X.; Li, J.; Ha, H.D.; Dahl, J.C.; Ondry, J.C.; Moreno-Hernandez, I.; Head-Gordon, T.; Alivisatos, A.P. AutoDetect-mNP: An unsupervised machine learning algorithm for automated analysis of transmission electron microscope images of metal nanoparticles. JACS AU 2021, 1, 316–327. [Google Scholar] [CrossRef]
- Kapur, J.N.; Sahoo, P.K.; Wong, A.K. A new method for gray-level picture thresholding using the entropy of the histogram. Comput. Vision, Graph. Image Process. 1985, 29, 273–285. [Google Scholar] [CrossRef]
- Davies, E. Machine Vision: Theory. Algorithms Pract. 1990, 2, 105–129. [Google Scholar]
- Canny, J. A computational approach to edge detection. IEEE Trans. Pattern Anal. Mach. Intell. 1986, 8, 679–698. [Google Scholar] [CrossRef]
- Sharifi, M.; Fathy, M.; Mahmoudi, M.T. A classified and comparative study of edge detection algorithms. In Proceedings of the International Conference on Information Technology: Coding and Computing, Las Vegas, NV, USA, 8–10 April 2002; pp. 117–120. [Google Scholar]
- Kalbasi, M.; Nikmehr, H. Noise-Robust, Reconfigurable Canny Edge Detection and its Hardware Realization. IEEE Access 2020, 8, 39934–39945. [Google Scholar] [CrossRef]
- Liang, Z.; Nie, Z.; An, A.; Gong, J.; Wang, X. A particle shape extraction and evaluation method using a deep convolutional neural network and digital image processing. Powder Technol. 2019, 353, 156–170. [Google Scholar] [CrossRef]
- Masubuchi, S.; Watanabe, E.; Seo, Y.; Okazaki, S.; Sasagawa, T.; Watanabe, K.; Taniguchi, T.; Machida, T. Deep-learning-based image segmentation integrated with optical microscopy for automatically searching for two-dimensional materials. NPJ 2D Mater. Appl. 2020, 4, 1–9. [Google Scholar] [CrossRef]
- Park, C.; Huang, J.Z.; Ji, J.X.; Ding, Y. Segmentation, inference and classification of partially overlapping nanoparticles. IEEE Trans. Pattern Anal. Mach. Intell. 2012, 35, 1. [Google Scholar] [CrossRef] [PubMed]
- Kwizera, E.A.; Chaffin, E.; Shen, X.; Chen, J.; Zou, Q.; Wu, Z.; Gai, Z.; Bhana, S.; O’Connor, R.; Wang, L.; et al. Size-and shape-controlled synthesis and properties of magnetic–plasmonic core–shell nanoparticles. J. Phys. Chem. C 2016, 120, 10530–10546. [Google Scholar] [CrossRef] [Green Version]
- Murphy, K.P. Machine Learning: A Probabilistic Perspective; MIT Press: Cambridge, MA, USA, 2012. [Google Scholar]
- Bishop, C. Pattern Recognition and Machine Learning; Springer: Berlin/Heidelberg, Germany, 2006. [Google Scholar]
- Hu, M.K. Visual pattern recognition by moment invariants. IRE Trans. Inf. Theory 1962, 8, 179–187. [Google Scholar]
- Jain, A.K. Data clustering: 50 years beyond K-means. Pattern Recognit. Lett. 2010, 31, 651–666. [Google Scholar] [CrossRef]
- Murtagh, F.; Contreras, P. Algorithms for hierarchical clustering: An overview. Wiley Interdiscip. Rev. Data Min. Knowl. Discov. 2012, 2, 86–97. [Google Scholar] [CrossRef]
- Luna-Romera, J.M.; Núñez-Hernández, F.; Martínez-Ballesteros, M.; Riquelme, J.C.; Ibáñez, C.U. Analysis of the evolution of the Spanish labour market through unsupervised learning. IEEE Access 2019, 7, 121695–121708. [Google Scholar] [CrossRef]
- Albert, W.; Tullis, T. Measuring the User Experience: Collecting, Analyzing, and Presenting Usability Metrics; Newnes: Boston, MA, USA, 2013. [Google Scholar]
- Lee, S.; Crawford, M.M. Unsupervised multistage image classification using hierarchical clustering with a Bayesian similarity measure. IEEE Trans. Image Process. 2005, 14, 312–320. [Google Scholar]
- Kodinariya, T.M.; Makwana, P.R. Review on determining number of Cluster in K-Means Clustering. Int. J. 2013, 1, 90–95. [Google Scholar]
- Rousseeuw, P.J. Silhouettes: A graphical aid to the interpretation and validation of cluster analysis. J. Comput. Appl. Math. 1987, 20, 53–65. [Google Scholar] [CrossRef] [Green Version]
- Davies, D.L.; Bouldin, D.W. A cluster separation measure. IEEE Trans. Pattern Anal. Mach. Intell. 1979, 1, 224–227. [Google Scholar] [CrossRef]
- Caliński, T.; Harabasz, J. A dendrite method for cluster analysis. Commun. Stat. Theory Methods 1974, 3, 1–27. [Google Scholar] [CrossRef]
- Wen, S.; Zhou, J.; Zheng, K.; Bednarkiewicz, A.; Liu, X.; Jin, D. Advances in highly doped upconversion nanoparticles. Nat. Commun. 2018, 9, 1–12. [Google Scholar] [CrossRef]
- DaCosta, M.V.; Doughan, S.; Han, Y.; Krull, U.J. Lanthanide upconversion nanoparticles and applications in bioassays and bioimaging: A review. Anal. Chim. Acta 2014, 832, 1–33. [Google Scholar] [CrossRef] [PubMed]
- Chen, G.; Qiu, H.; Prasad, P.N.; Chen, X. Upconversion nanoparticles: Design, nanochemistry, and applications in theranostics. Chem. Rev. 2014, 114, 5161–5214. [Google Scholar] [CrossRef] [PubMed]
- Xu, J.; Xu, L.; Wang, C.; Yang, R.; Zhuang, Q.; Han, X.; Dong, Z.; Zhu, W.; Peng, R.; Liu, Z. Near-infrared-triggered photodynamic therapy with multitasking upconversion nanoparticles in combination with checkpoint blockade for immunotherapy of colorectal cancer. ACS Nano 2017, 11, 4463–4474. [Google Scholar] [CrossRef] [PubMed]
- You, M.; Zhong, J.; Hong, Y.; Duan, Z.; Lin, M.; Xu, F. Inkjet printing of upconversion nanoparticles for anti-counterfeit applications. Nanoscale 2015, 7, 4423–4431. [Google Scholar] [CrossRef]
- Boyer, J.C.; Cuccia, L.A.; Capobianco, J.A. Synthesis of colloidal upconverting NaYF4: Er3+/Yb3+ and Tm3+/Yb3+ monodisperse nanocrystals. Nano Lett. 2007, 7, 847–852. [Google Scholar] [CrossRef] [PubMed]
- Lin, M.; Zhao, Y.; Wang, S.; Liu, M.; Duan, Z.; Chen, Y.; Li, F.; Xu, F.; Lu, T. Recent advances in synthesis and surface modification of lanthanide-doped upconversion nanoparticles for biomedical applications. Biotechnol. Adv. 2012, 30, 1551–1561. [Google Scholar] [CrossRef]
- Wang, G.; Peng, Q.; Li, Y. Lanthanide-doped nanocrystals: Synthesis, optical-magnetic properties, and applications. Accounts Chem. Res. 2011, 44, 322–332. [Google Scholar] [CrossRef] [PubMed]
- Vasudevan, D.; Gaddam, R.R.; Trinchi, A.; Cole, I. Core–shell quantum dots: Properties and applications. J. Alloys Compd. 2015, 636, 395–404. [Google Scholar] [CrossRef]
- Zhou, J.; Yang, Y.; Zhang, C.Y. Toward biocompatible semiconductor quantum dots: From biosynthesis and bioconjugation to biomedical application. Chem. Rev. 2015, 115, 11669–11717. [Google Scholar] [CrossRef]
- Park, N.M.; Kim, T.S.; Park, S.J. Band gap engineering of amorphous silicon quantum dots for light-emitting diodes. Appl. Phys. Lett. 2001, 78, 2575–2577. [Google Scholar] [CrossRef] [Green Version]
- Adegoke, O.; Nyokong, T.; Forbes, P.B. Deposition of CdS, CdS/ZnSe and CdS/ZnSe/ZnS shells around CdSeTe alloyed core quantum dots: Effects on optical properties. Luminescence 2016, 31, 694–703. [Google Scholar] [CrossRef] [Green Version]
- Ganguli, N.; Acharya, S.; Dasgupta, I. First-principles study of the electronic structure of CdS/ZnSe coupled quantum dots. Phys. Rev. B 2014, 89, 245423. [Google Scholar] [CrossRef] [Green Version]
- Gloag, L.; Mehdipour, M.; Ulanova, M.; Mariandry, K.; Nichol, M.A.; Hernández-Castillo, D.J.; Gaudet, J.; Qiao, R.; Zhang, J.; Nelson, M.; et al. Zero valent iron core–iron oxide shell nanoparticles as small magnetic particle imaging tracers. Chem. Commun. 2020, 56, 3504–3507. [Google Scholar] [CrossRef] [PubMed]
- Gloag, L.; Mehdipour, M.; Chen, D.; Tilley, R.D.; Gooding, J.J. Advances in the application of magnetic nanoparticles for sensing. Adv. Mater. 2019, 31, 1904385. [Google Scholar] [CrossRef] [PubMed]
- Dhavale, V.M.; Singh, S.K.; Nadeema, A.; Gaikwad, S.S.; Kurungot, S. Nanocrystalline Fe–Fe2O3 particle-deposited N-doped graphene as an activity-modulated Pt-free electrocatalyst for oxygen reduction reaction. Nanoscale 2015, 7, 20117–20125. [Google Scholar] [CrossRef] [PubMed]


| k | ∑ | Rate | Size (nm) | Aspect Ratio |
|---|---|---|---|---|
| k | 75 | 48.1% | 33.6 ± 2.0 | 1.07 ± 0.06 |
| k | 81 | 51.9% | 38.1 ± 1.7 | 1.37 ± 0.08 |
| k | ∑ | Rate | Size (nm) | Aspect Ratio | Eccentricity |
|---|---|---|---|---|---|
| k | 10 | 2.1% | 11.2 ± 0.6 | 1.34 ± 0.11 | 0.71 ± 0.02 |
| k | 248 | 51.5% | 11.8 ± 0.9 | 1.14 ± 0.08 | 0.56 ± 0.05 |
| k | 2 | 0.4% | 11.5 ± 0.0 | 1.05 ± 0.03 | 0.29 ± 0.04 |
| k | 3 | 0.6% | 11.7 ± 0.7 | 1.20 ± 0.11 | 0.57 ± 0.03 |
| k | 219 | 45.4% | 11.9 ± 0.7 | 1.06 ± 0.04 | 0.38 ± 0.08 |
| k | ∑ | Rate | Size (nm) | Aspect Ratio | Eccentricity |
|---|---|---|---|---|---|
| k | 4 | 3.6% | 12.3 ± 1.6 | 1.33 ± 0.07 | 0.70 ± 0.02 |
| k | 81 | 73.6% | 10.4 ± 1.1 | 1.06 ± 0.04 | 0.39 ± 0.09 |
| k | 25 | 22.7% | 10.1 ± 1.3 | 1.15 ± 0.08 | 0.57 ± 0.03 |
Publisher’s Note: MDPI stays neutral with regard to jurisdictional claims in published maps and institutional affiliations. |
© 2021 by the authors. Licensee MDPI, Basel, Switzerland. This article is an open access article distributed under the terms and conditions of the Creative Commons Attribution (CC BY) license (https://creativecommons.org/licenses/by/4.0/).
Share and Cite
Wen, H.; Luna-Romera, J.M.; Riquelme, J.C.; Dwyer, C.; Chang, S.L.Y. Statistically Representative Metrology of Nanoparticles via Unsupervised Machine Learning of TEM Images. Nanomaterials 2021, 11, 2706. https://doi.org/10.3390/nano11102706
Wen H, Luna-Romera JM, Riquelme JC, Dwyer C, Chang SLY. Statistically Representative Metrology of Nanoparticles via Unsupervised Machine Learning of TEM Images. Nanomaterials. 2021; 11(10):2706. https://doi.org/10.3390/nano11102706
Chicago/Turabian StyleWen, Haotian, José María Luna-Romera, José C. Riquelme, Christian Dwyer, and Shery L. Y. Chang. 2021. "Statistically Representative Metrology of Nanoparticles via Unsupervised Machine Learning of TEM Images" Nanomaterials 11, no. 10: 2706. https://doi.org/10.3390/nano11102706