
Use of Carbon Nanoparticles to Improve Soil Fertility, Crop Growth and Nutrient Uptake by Corn (Zea mays L.)

 ,
, 


Abstract
:1. Introduction
2. Materials and Methods
2.1. CNPs and Corn Seeds
2.2. Tested Soils
2.3. Greenhouse Experiments
2.4. Plant Measurements and Nutrient Analysis
2.5. Soil Nutrient Analysis
2.6. Soil Enzyme Activity
2.7. Statistical Analysis
3. Results
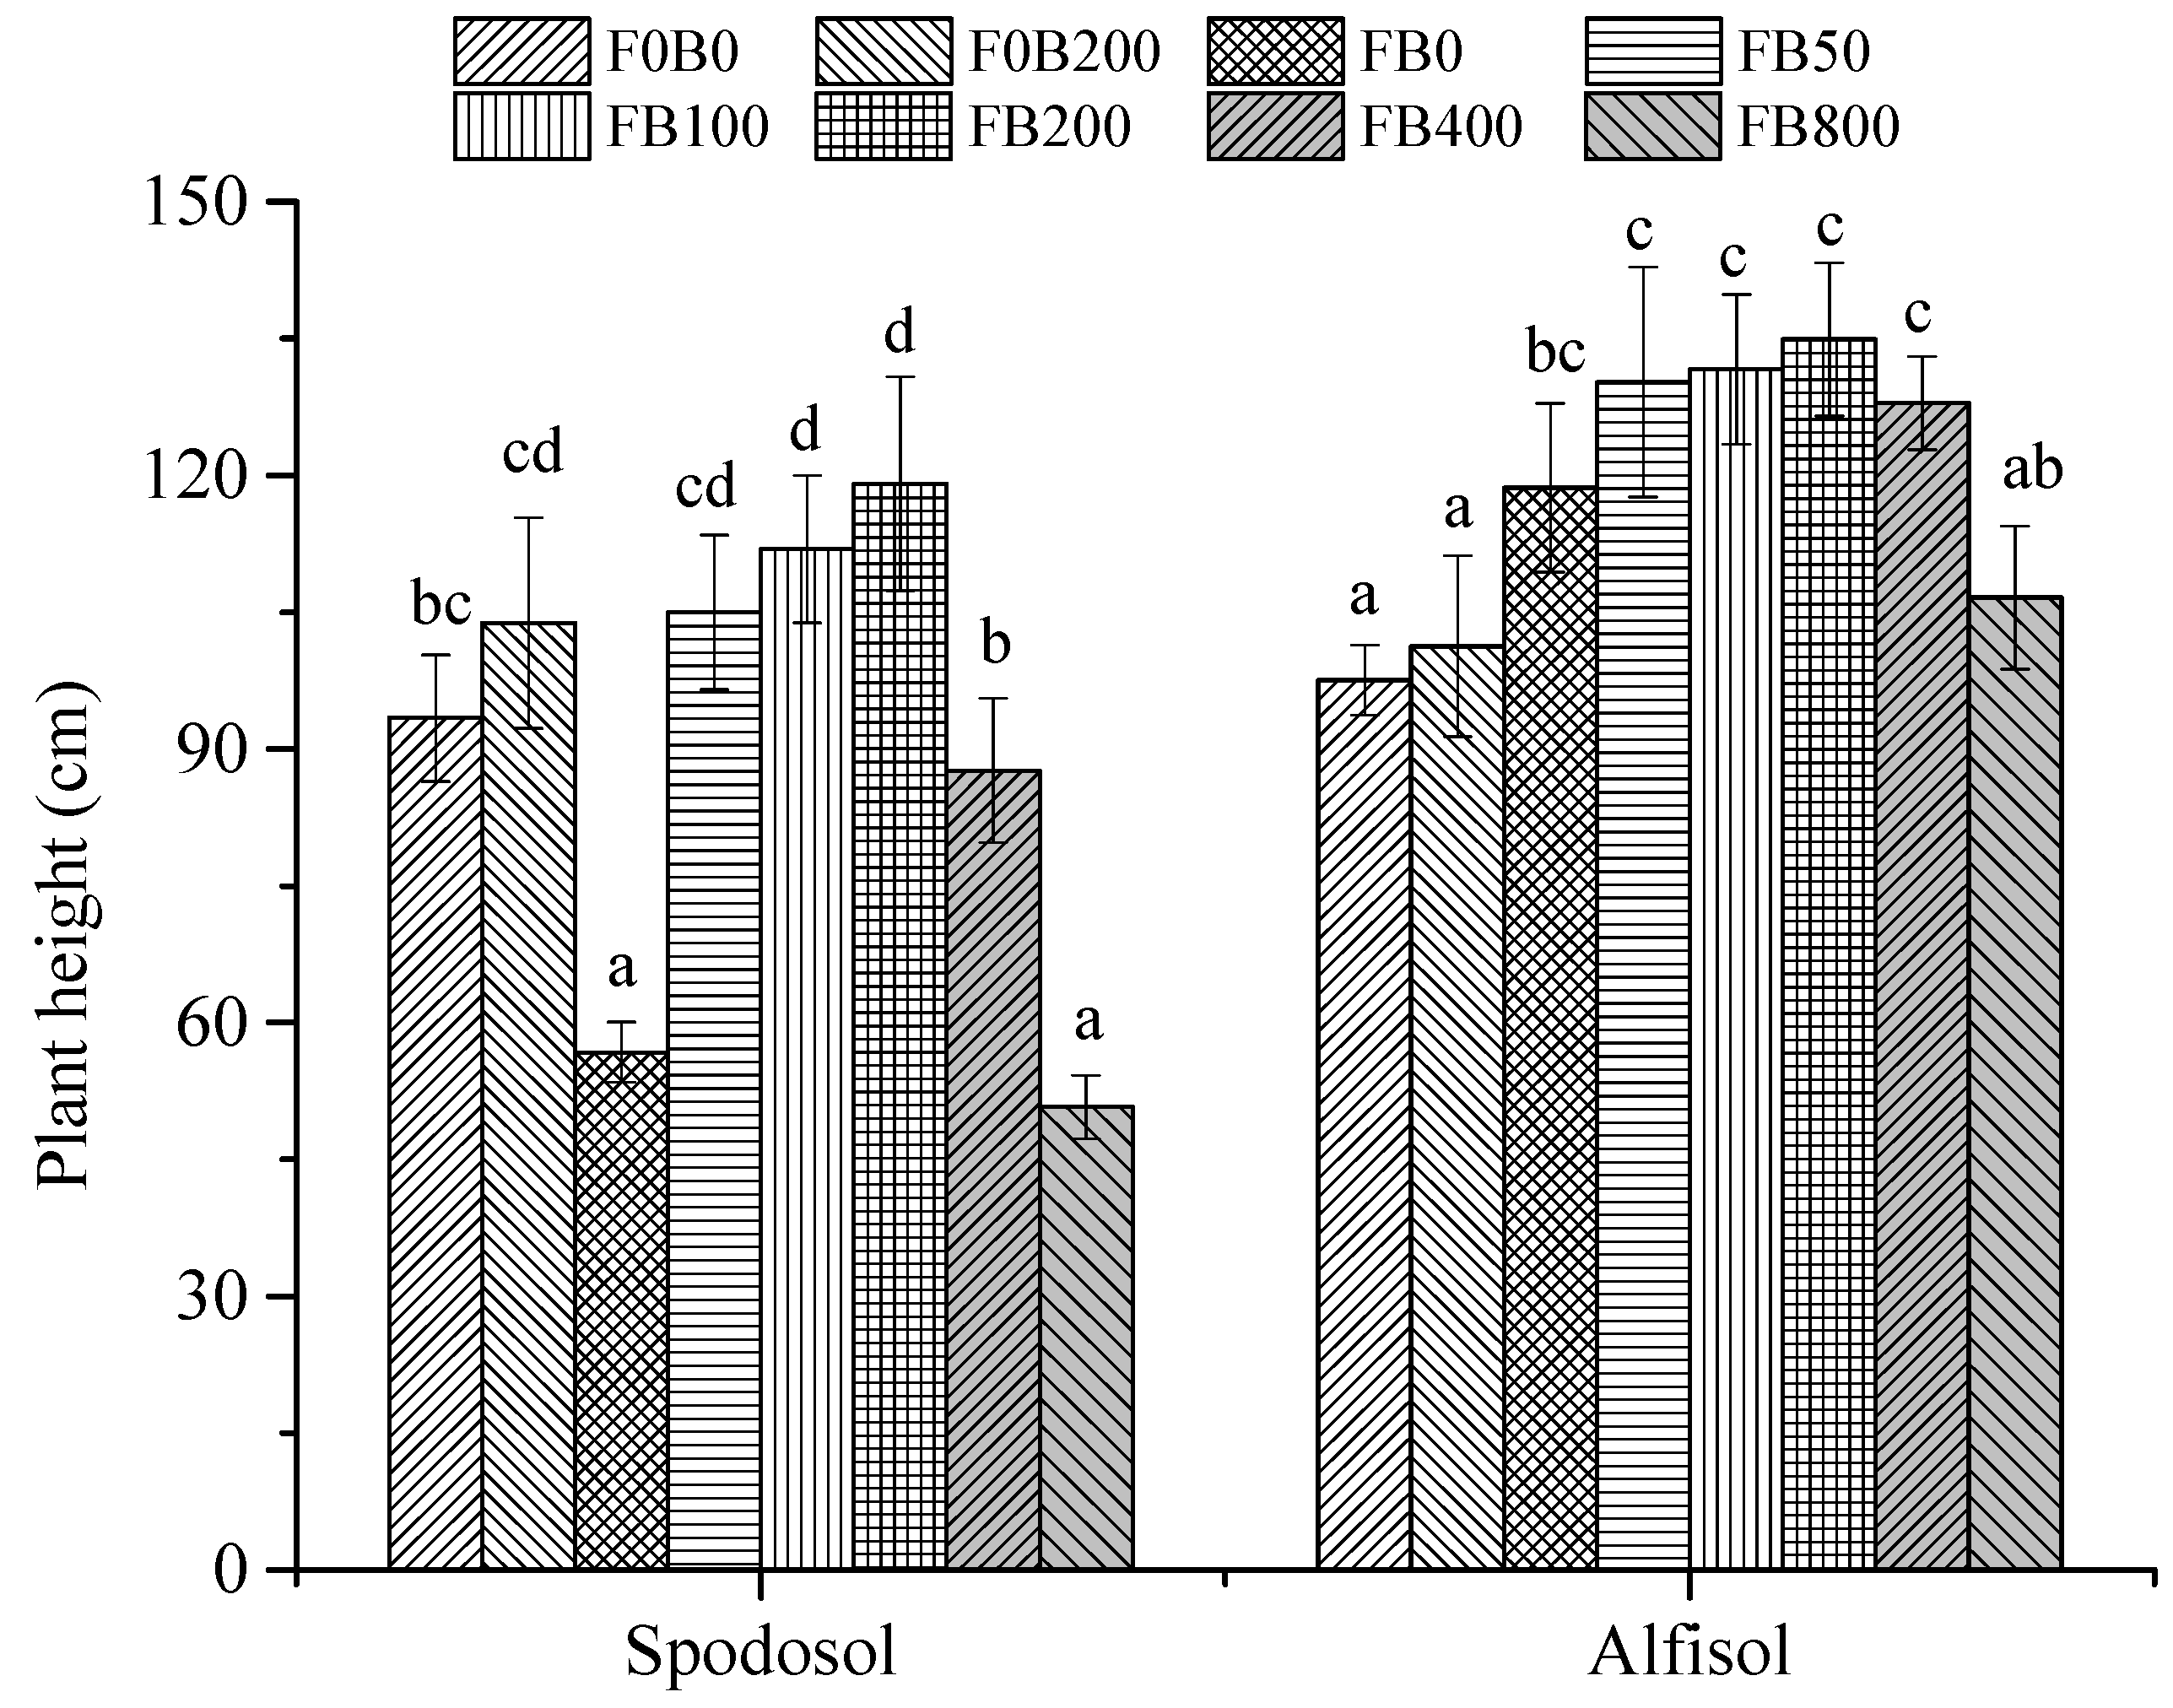
3.1. Plant Height
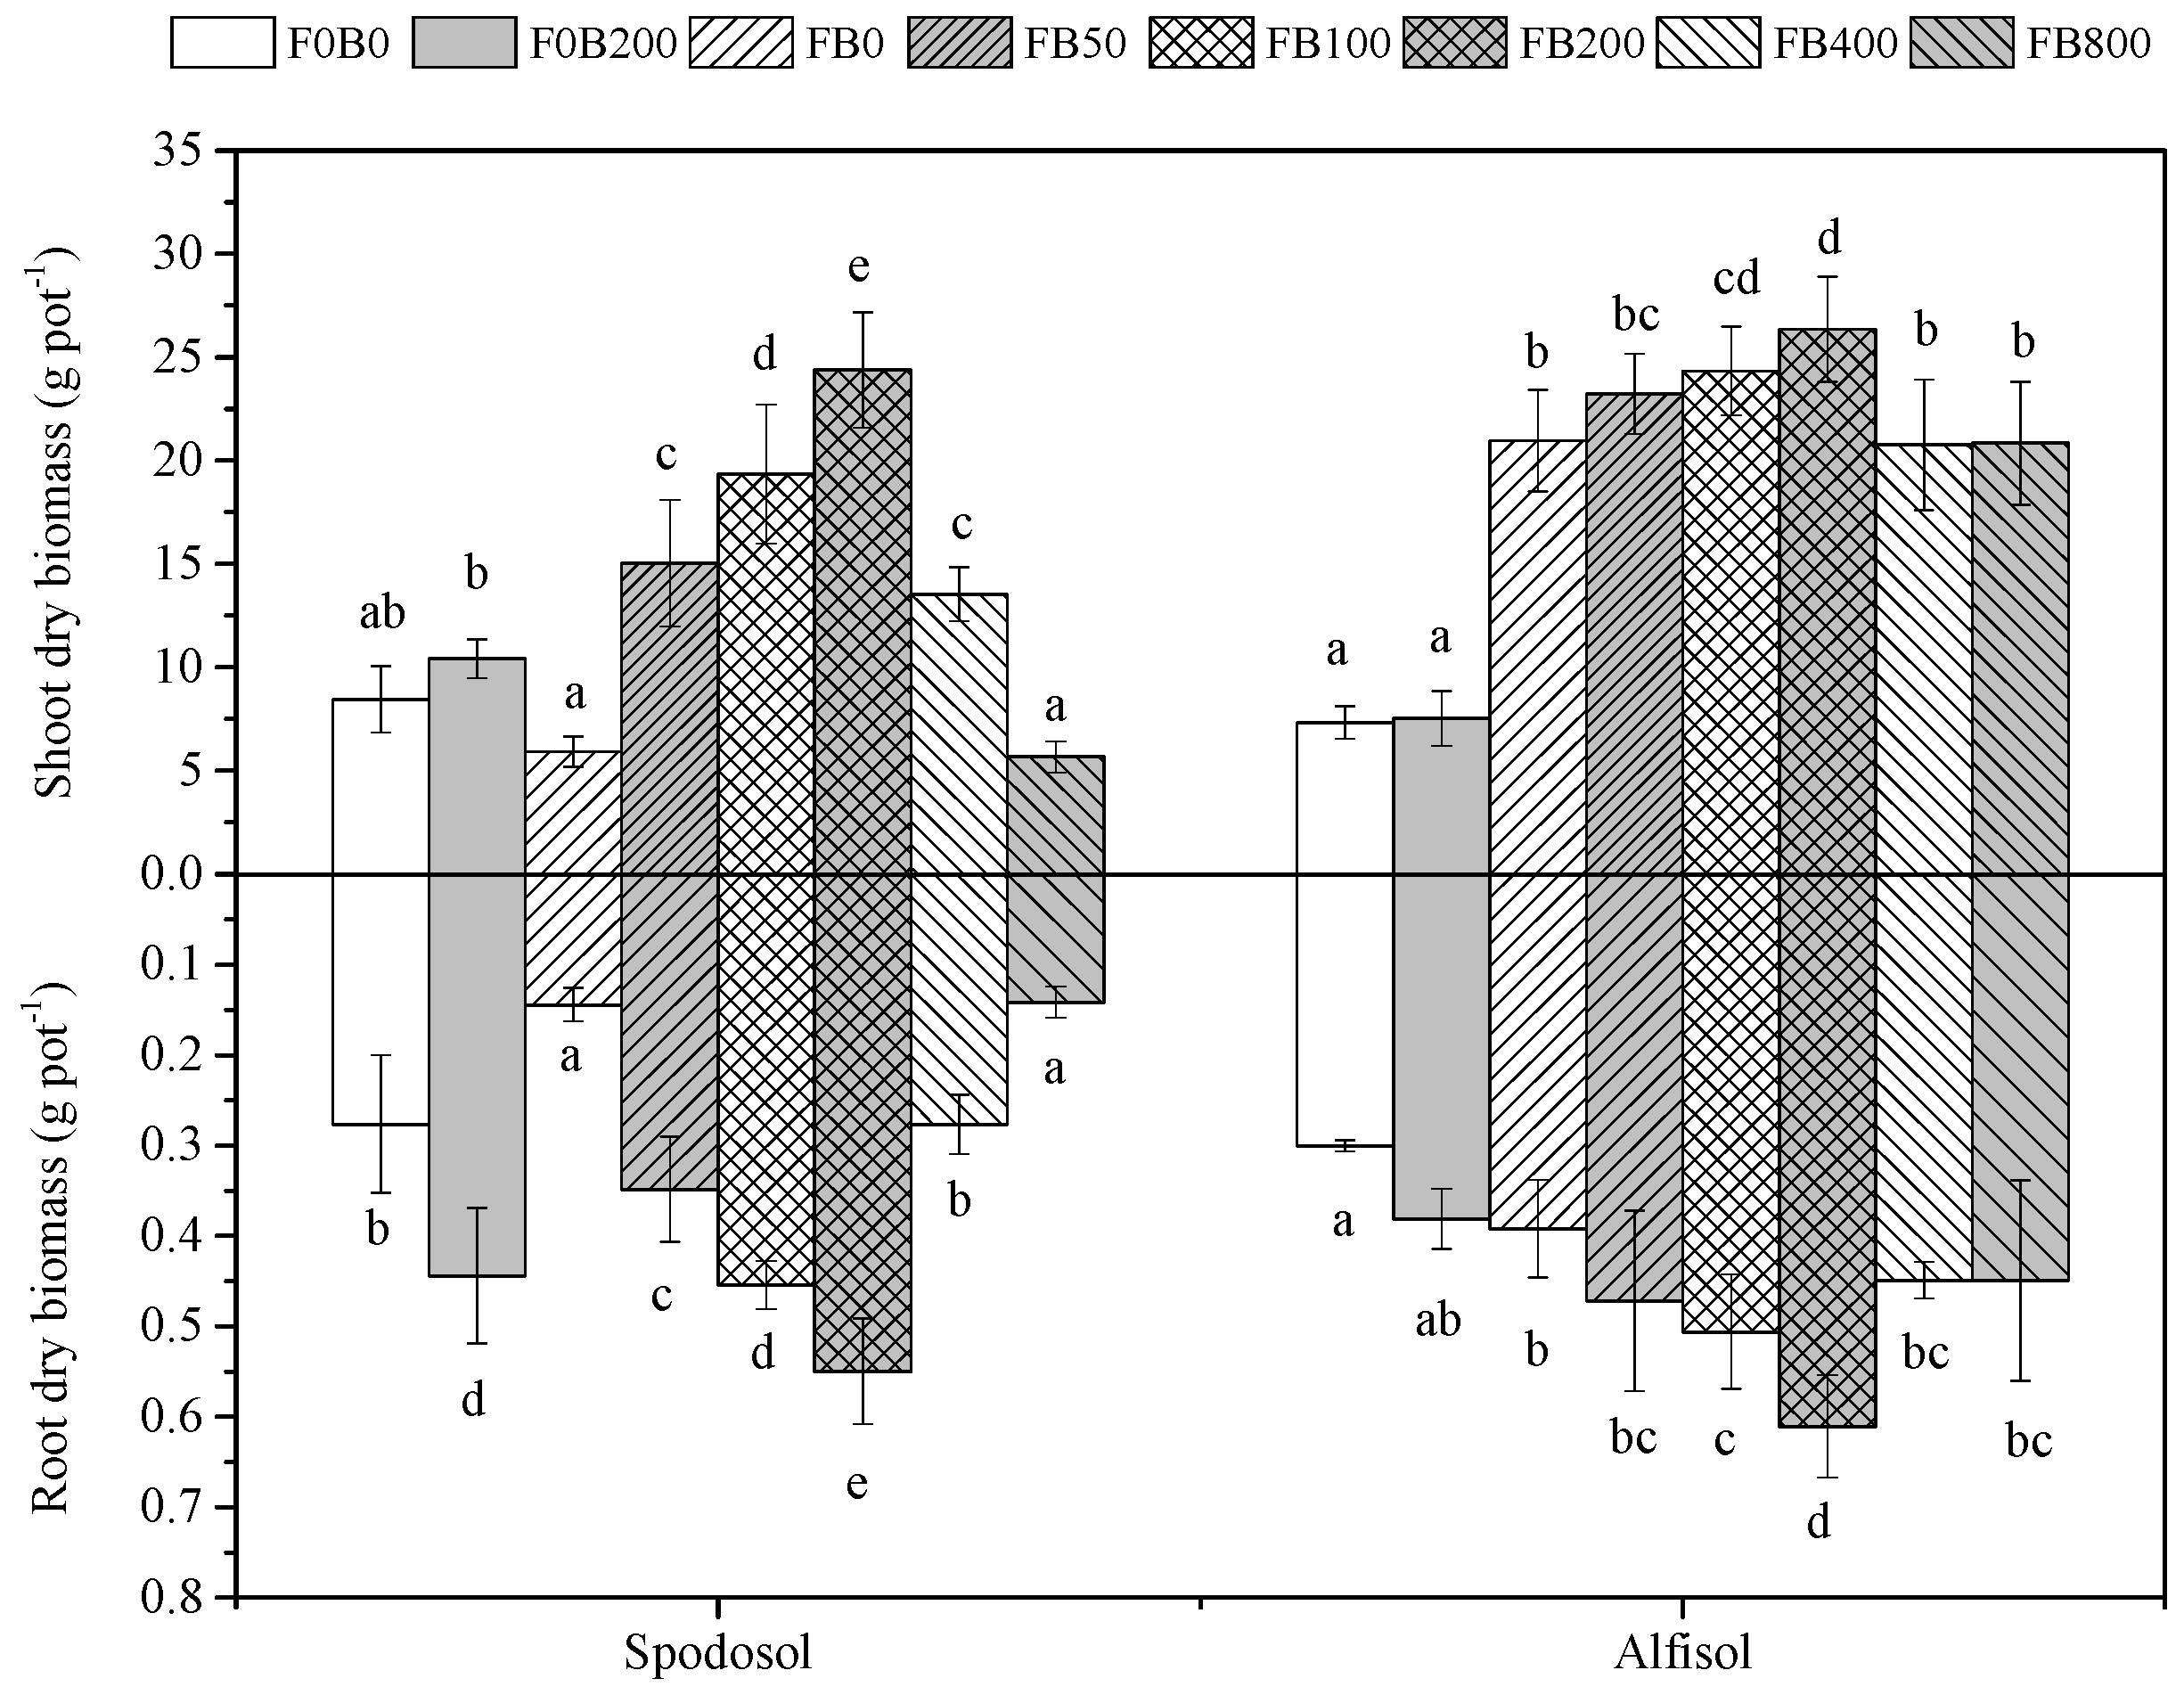
3.2. Shoot and Root Biomass
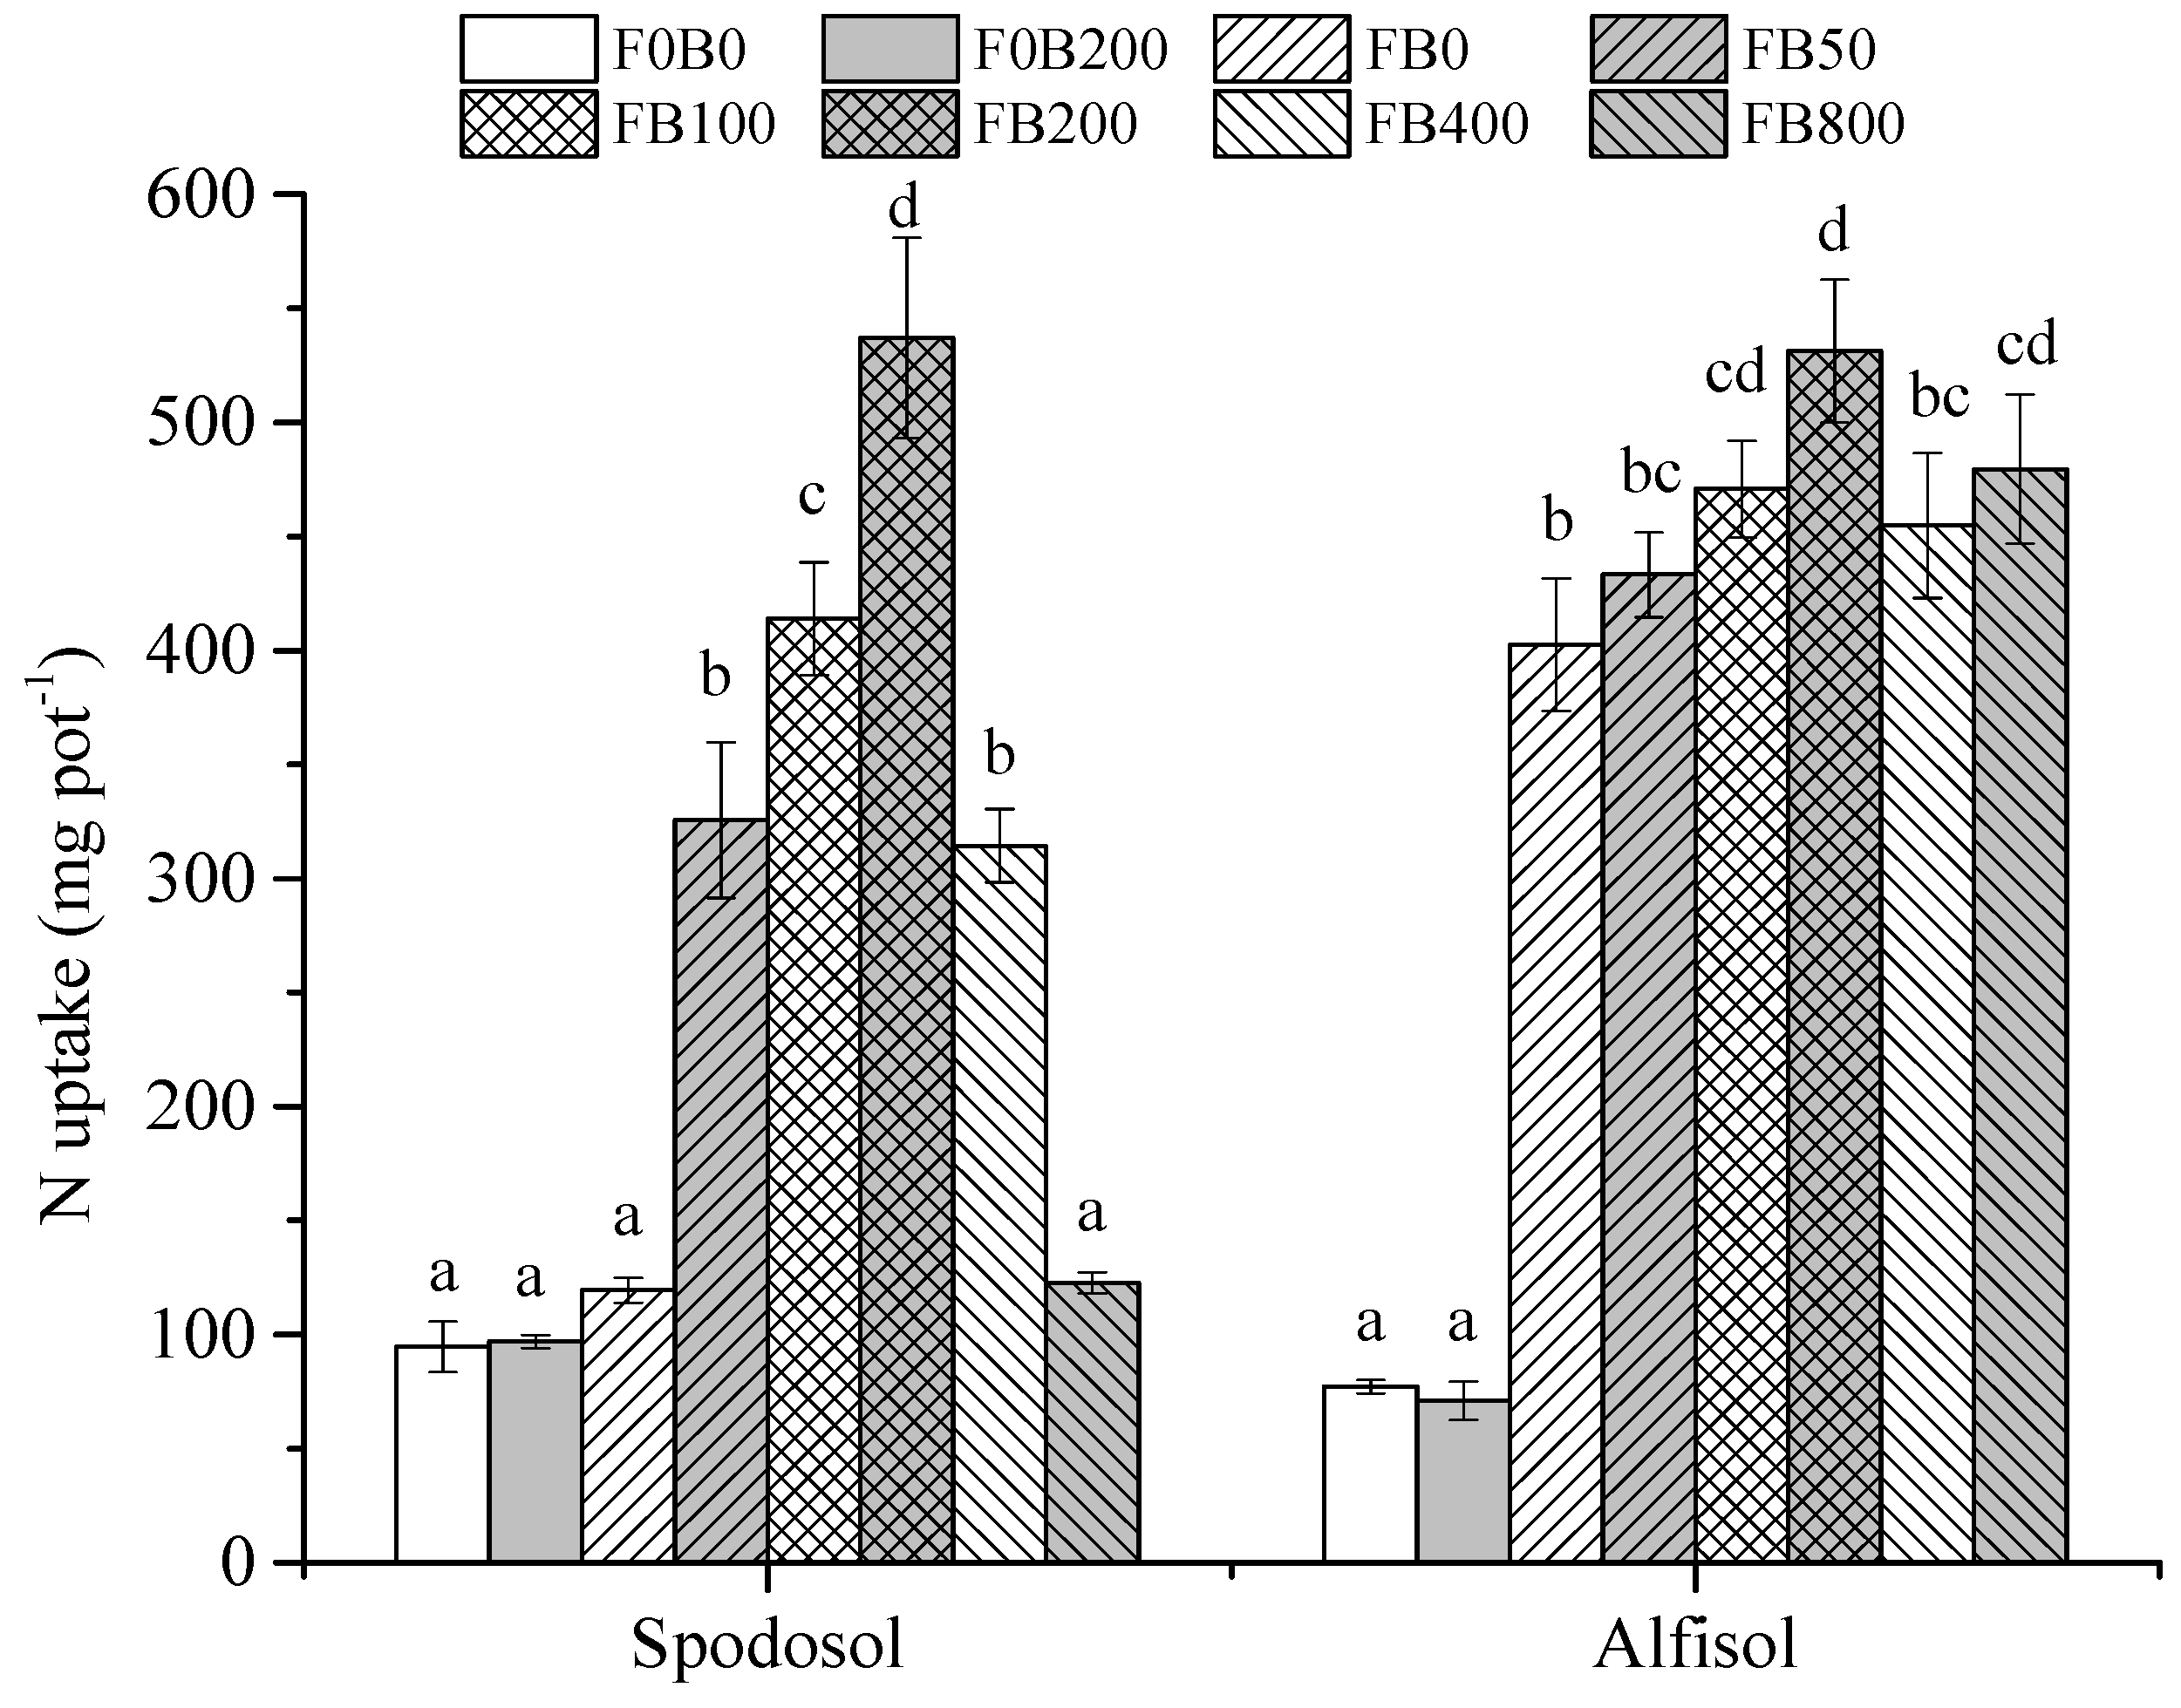
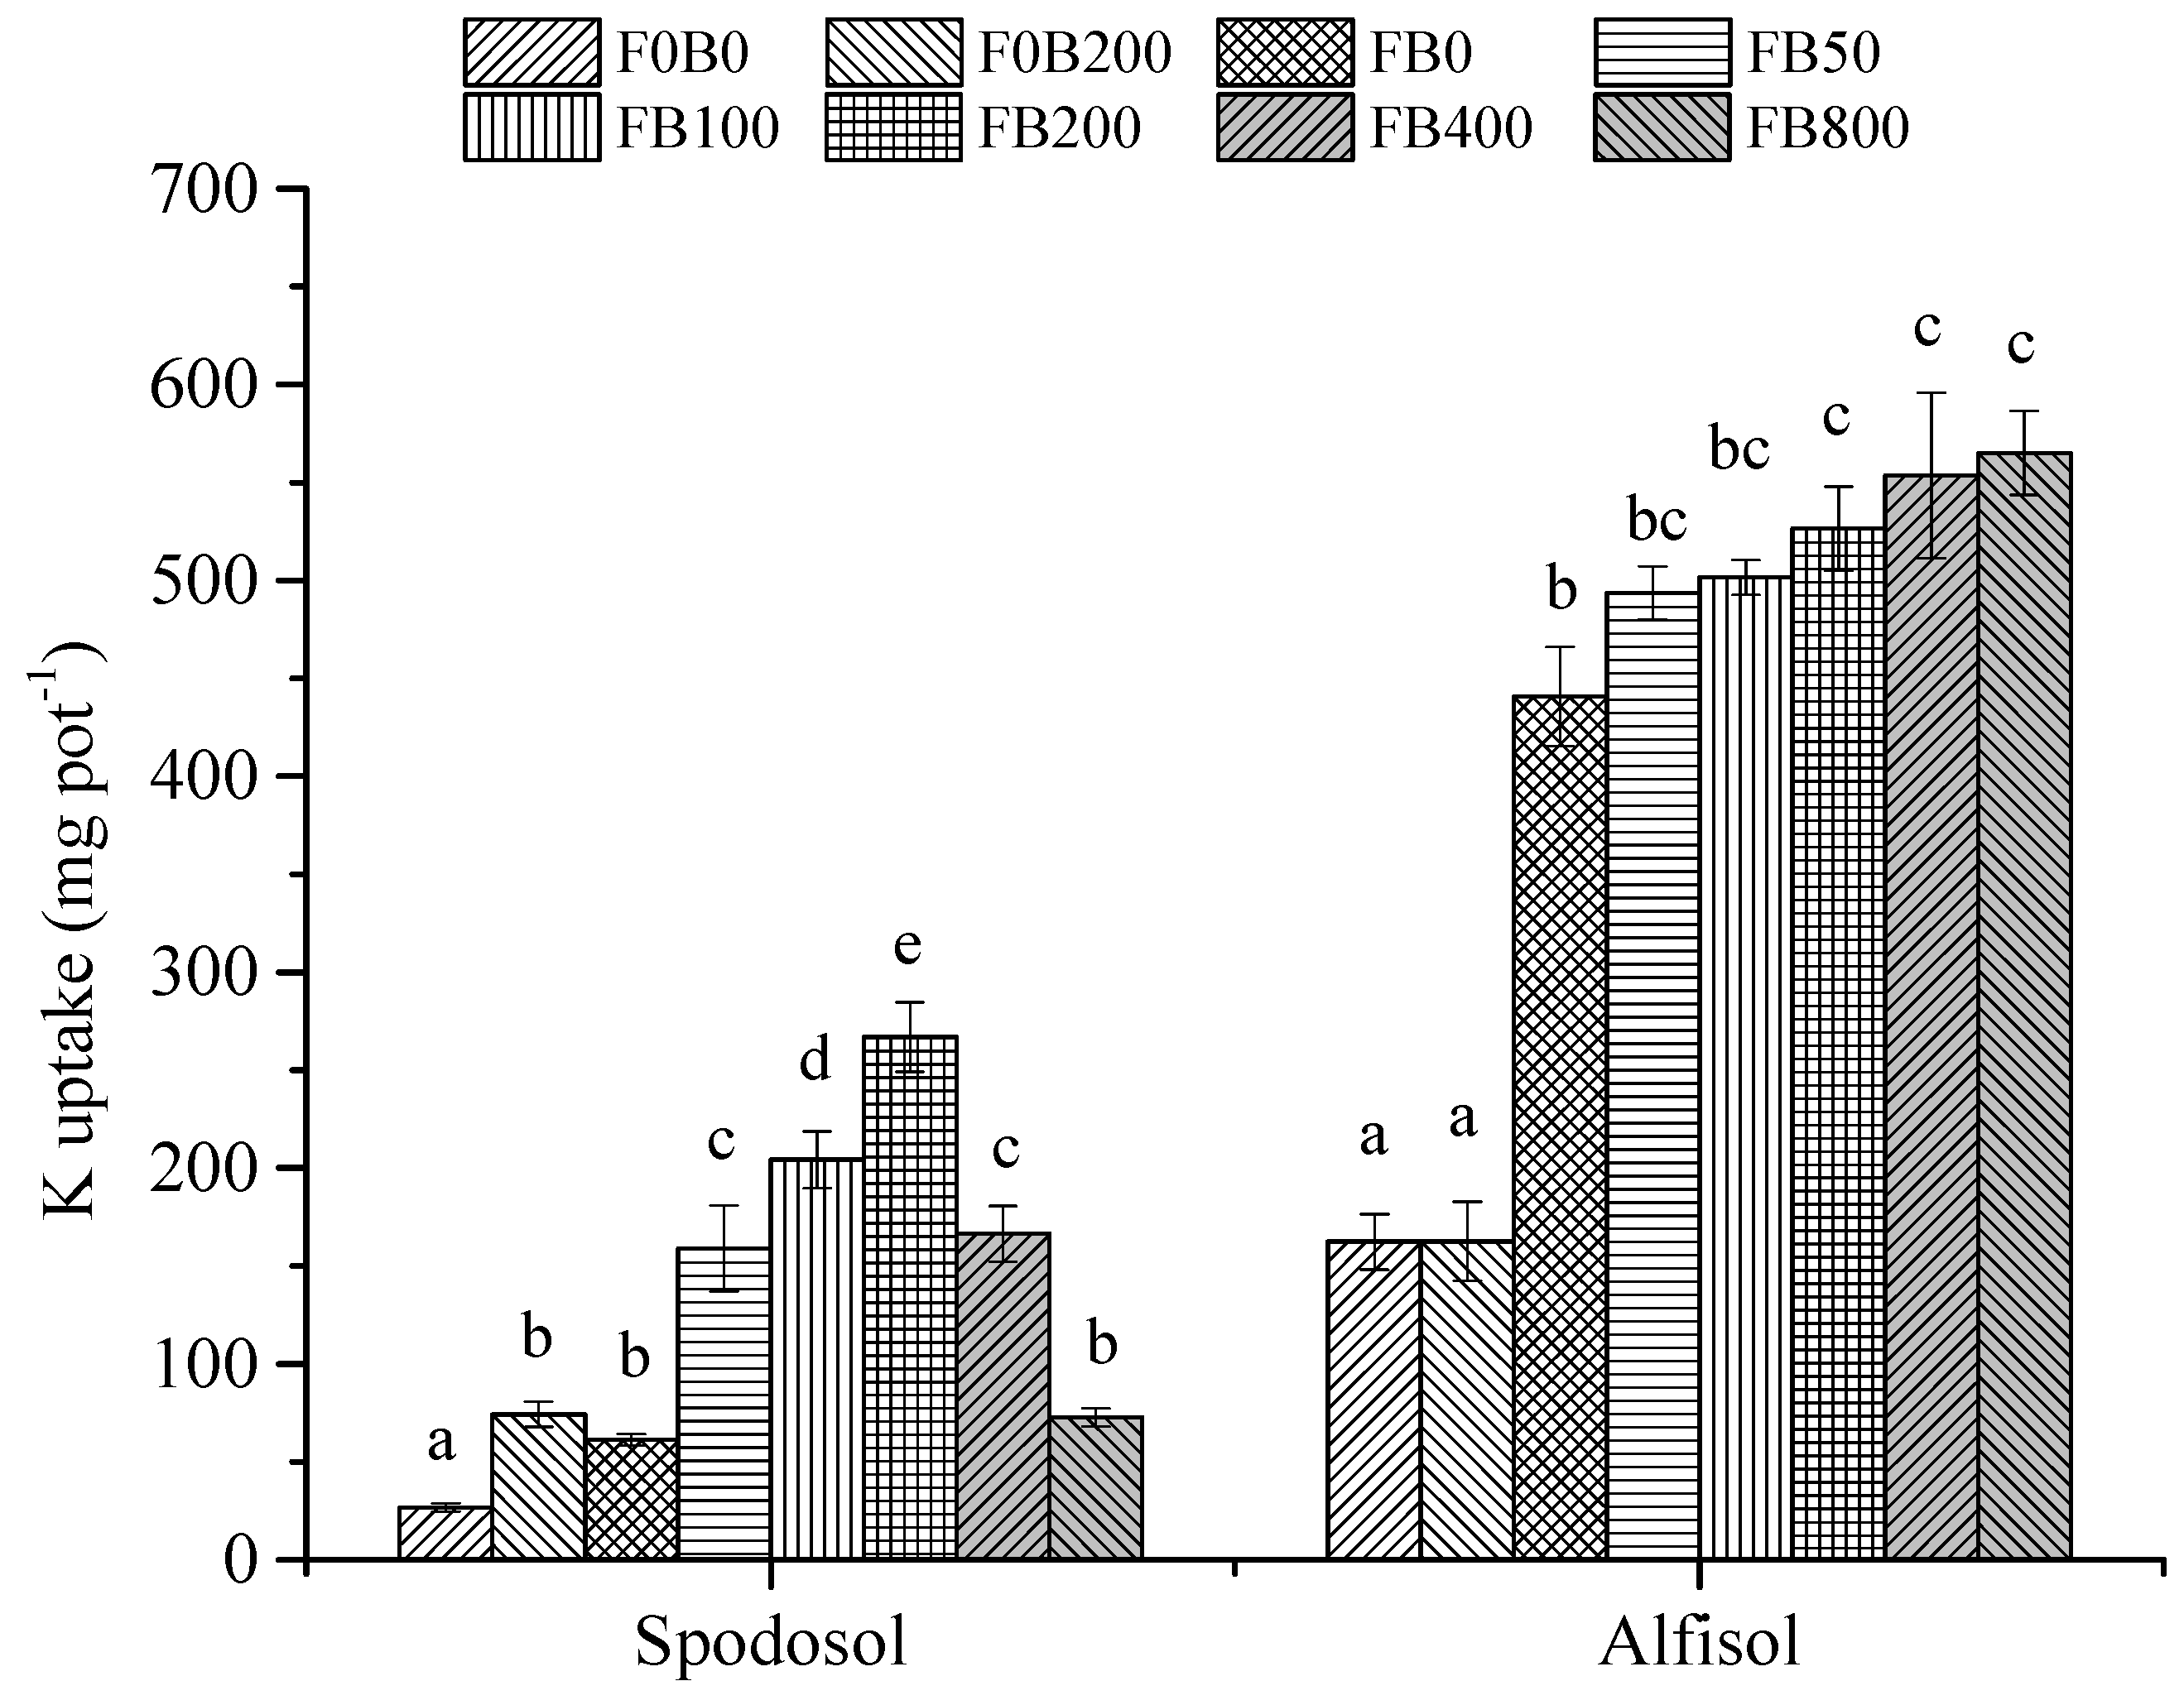
3.3. Nutrient Uptake and Fertilizer Use Efficiency
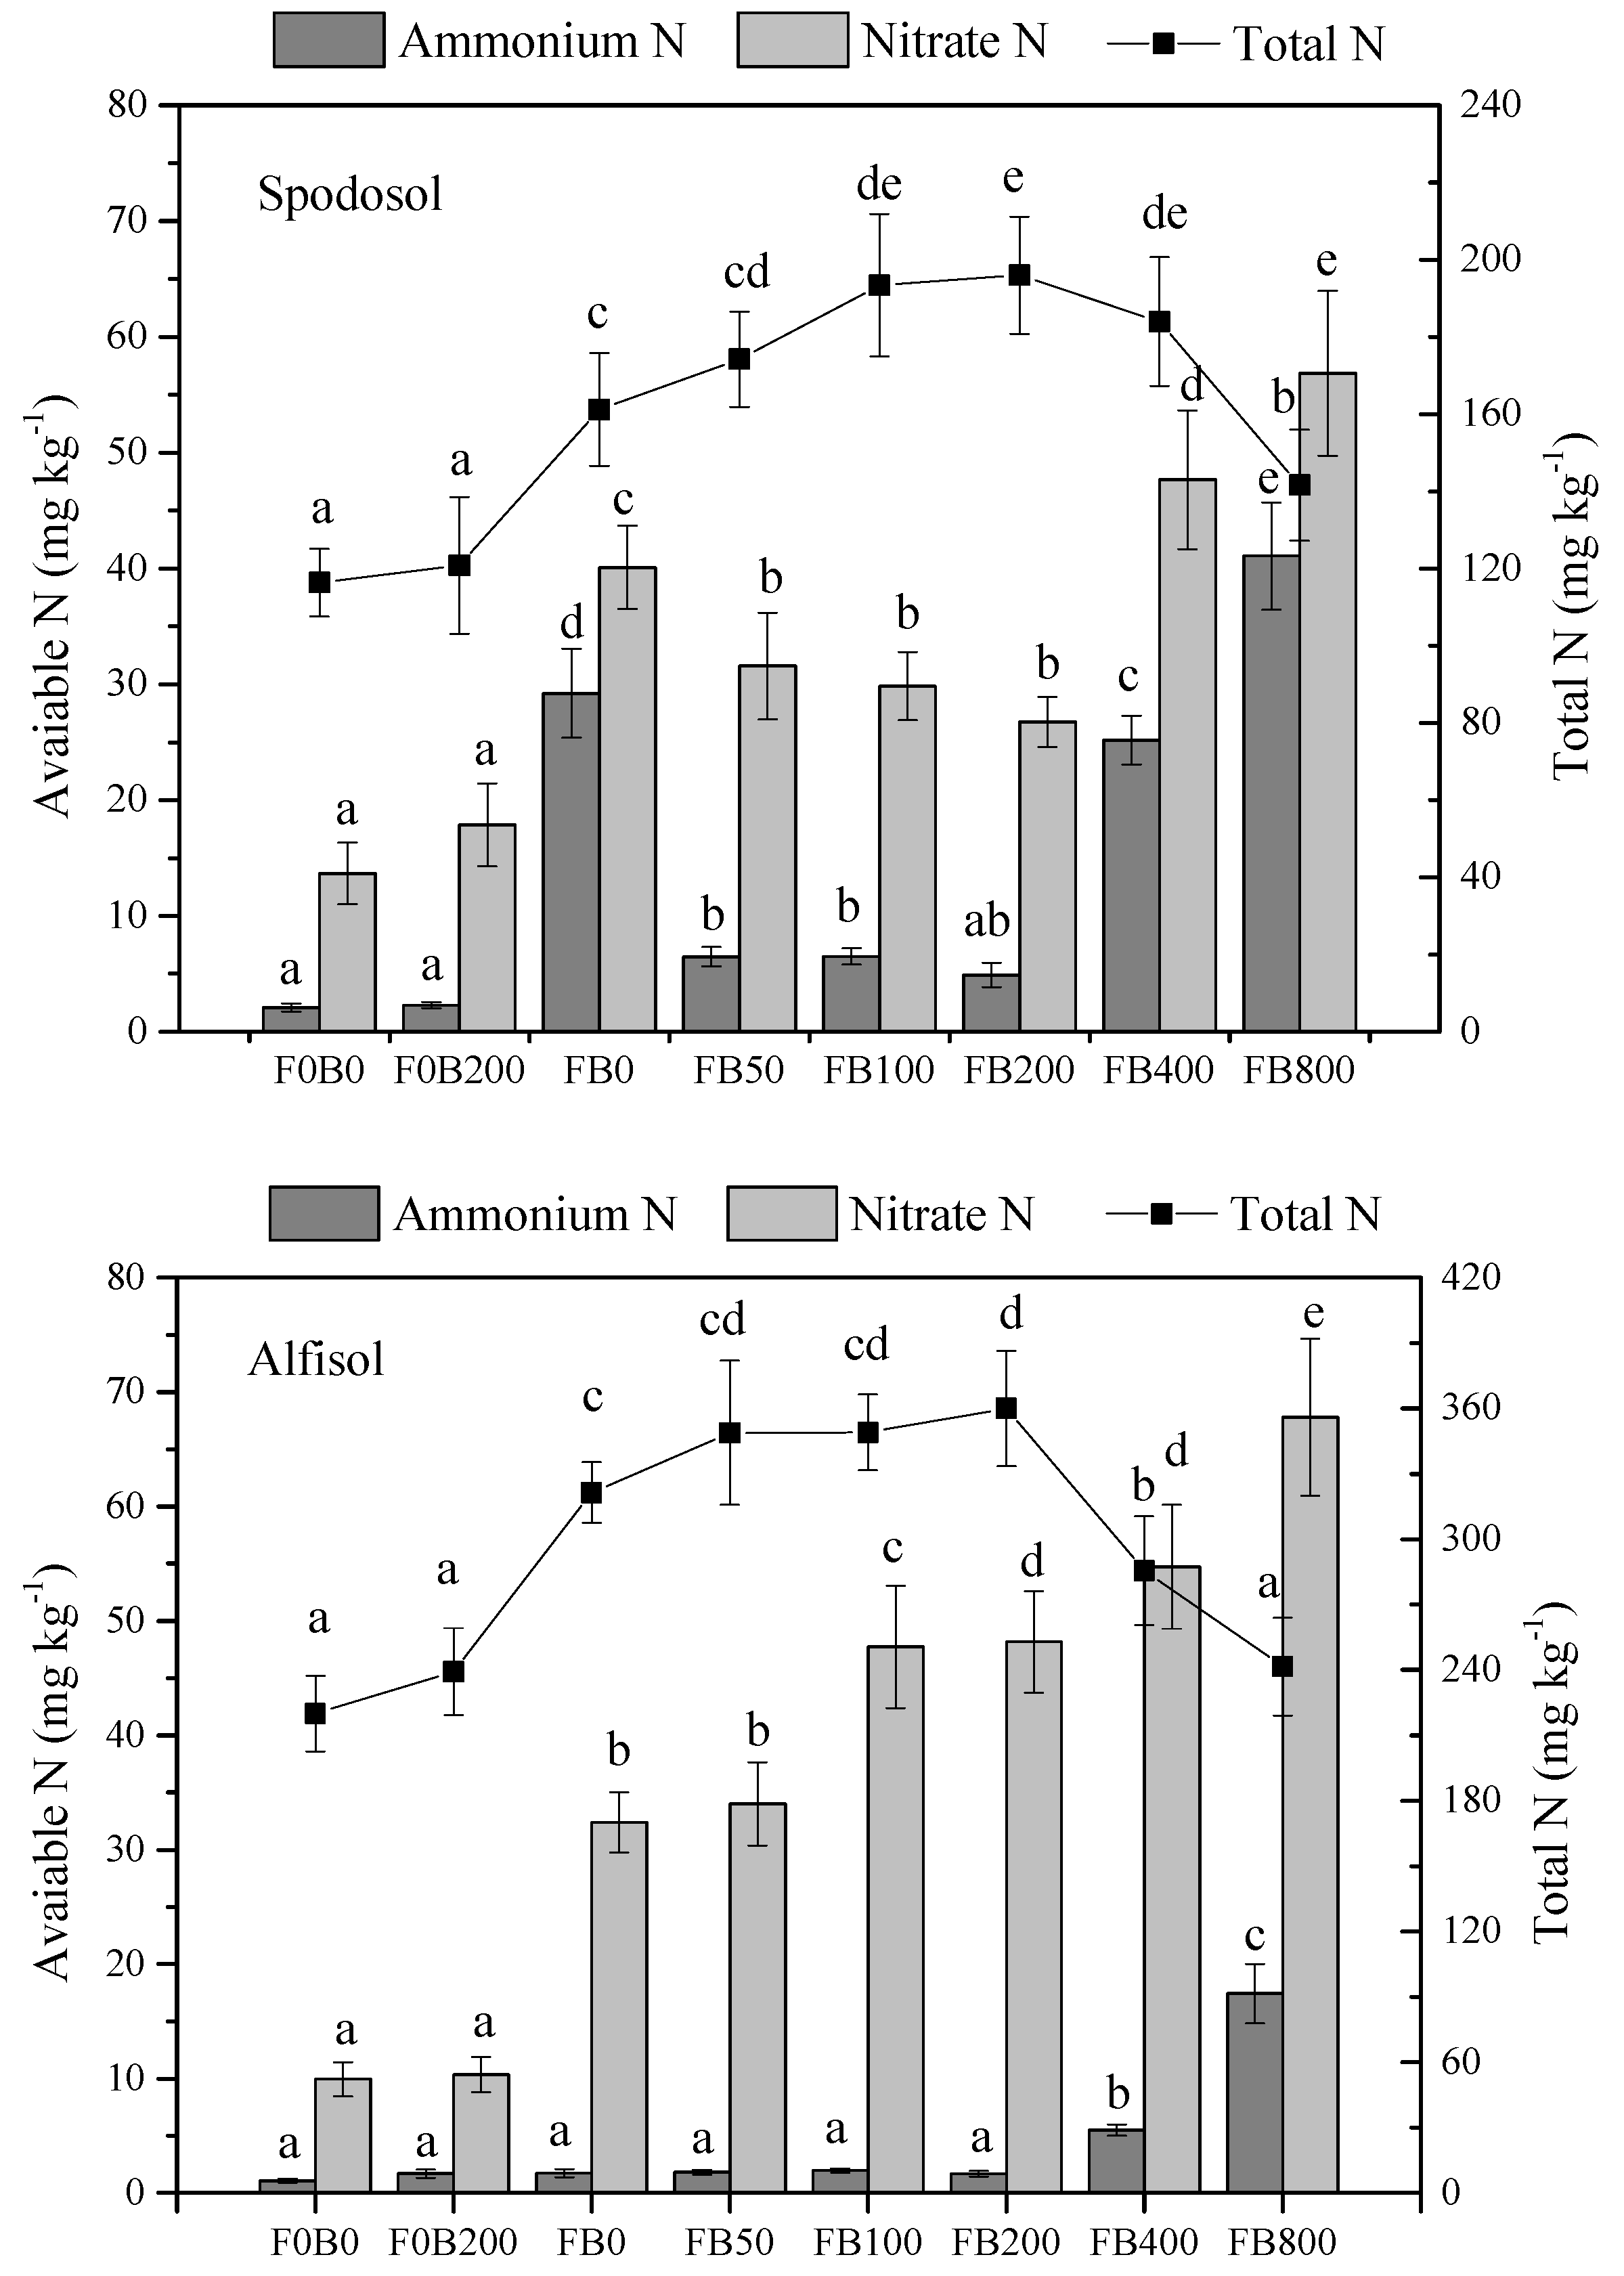
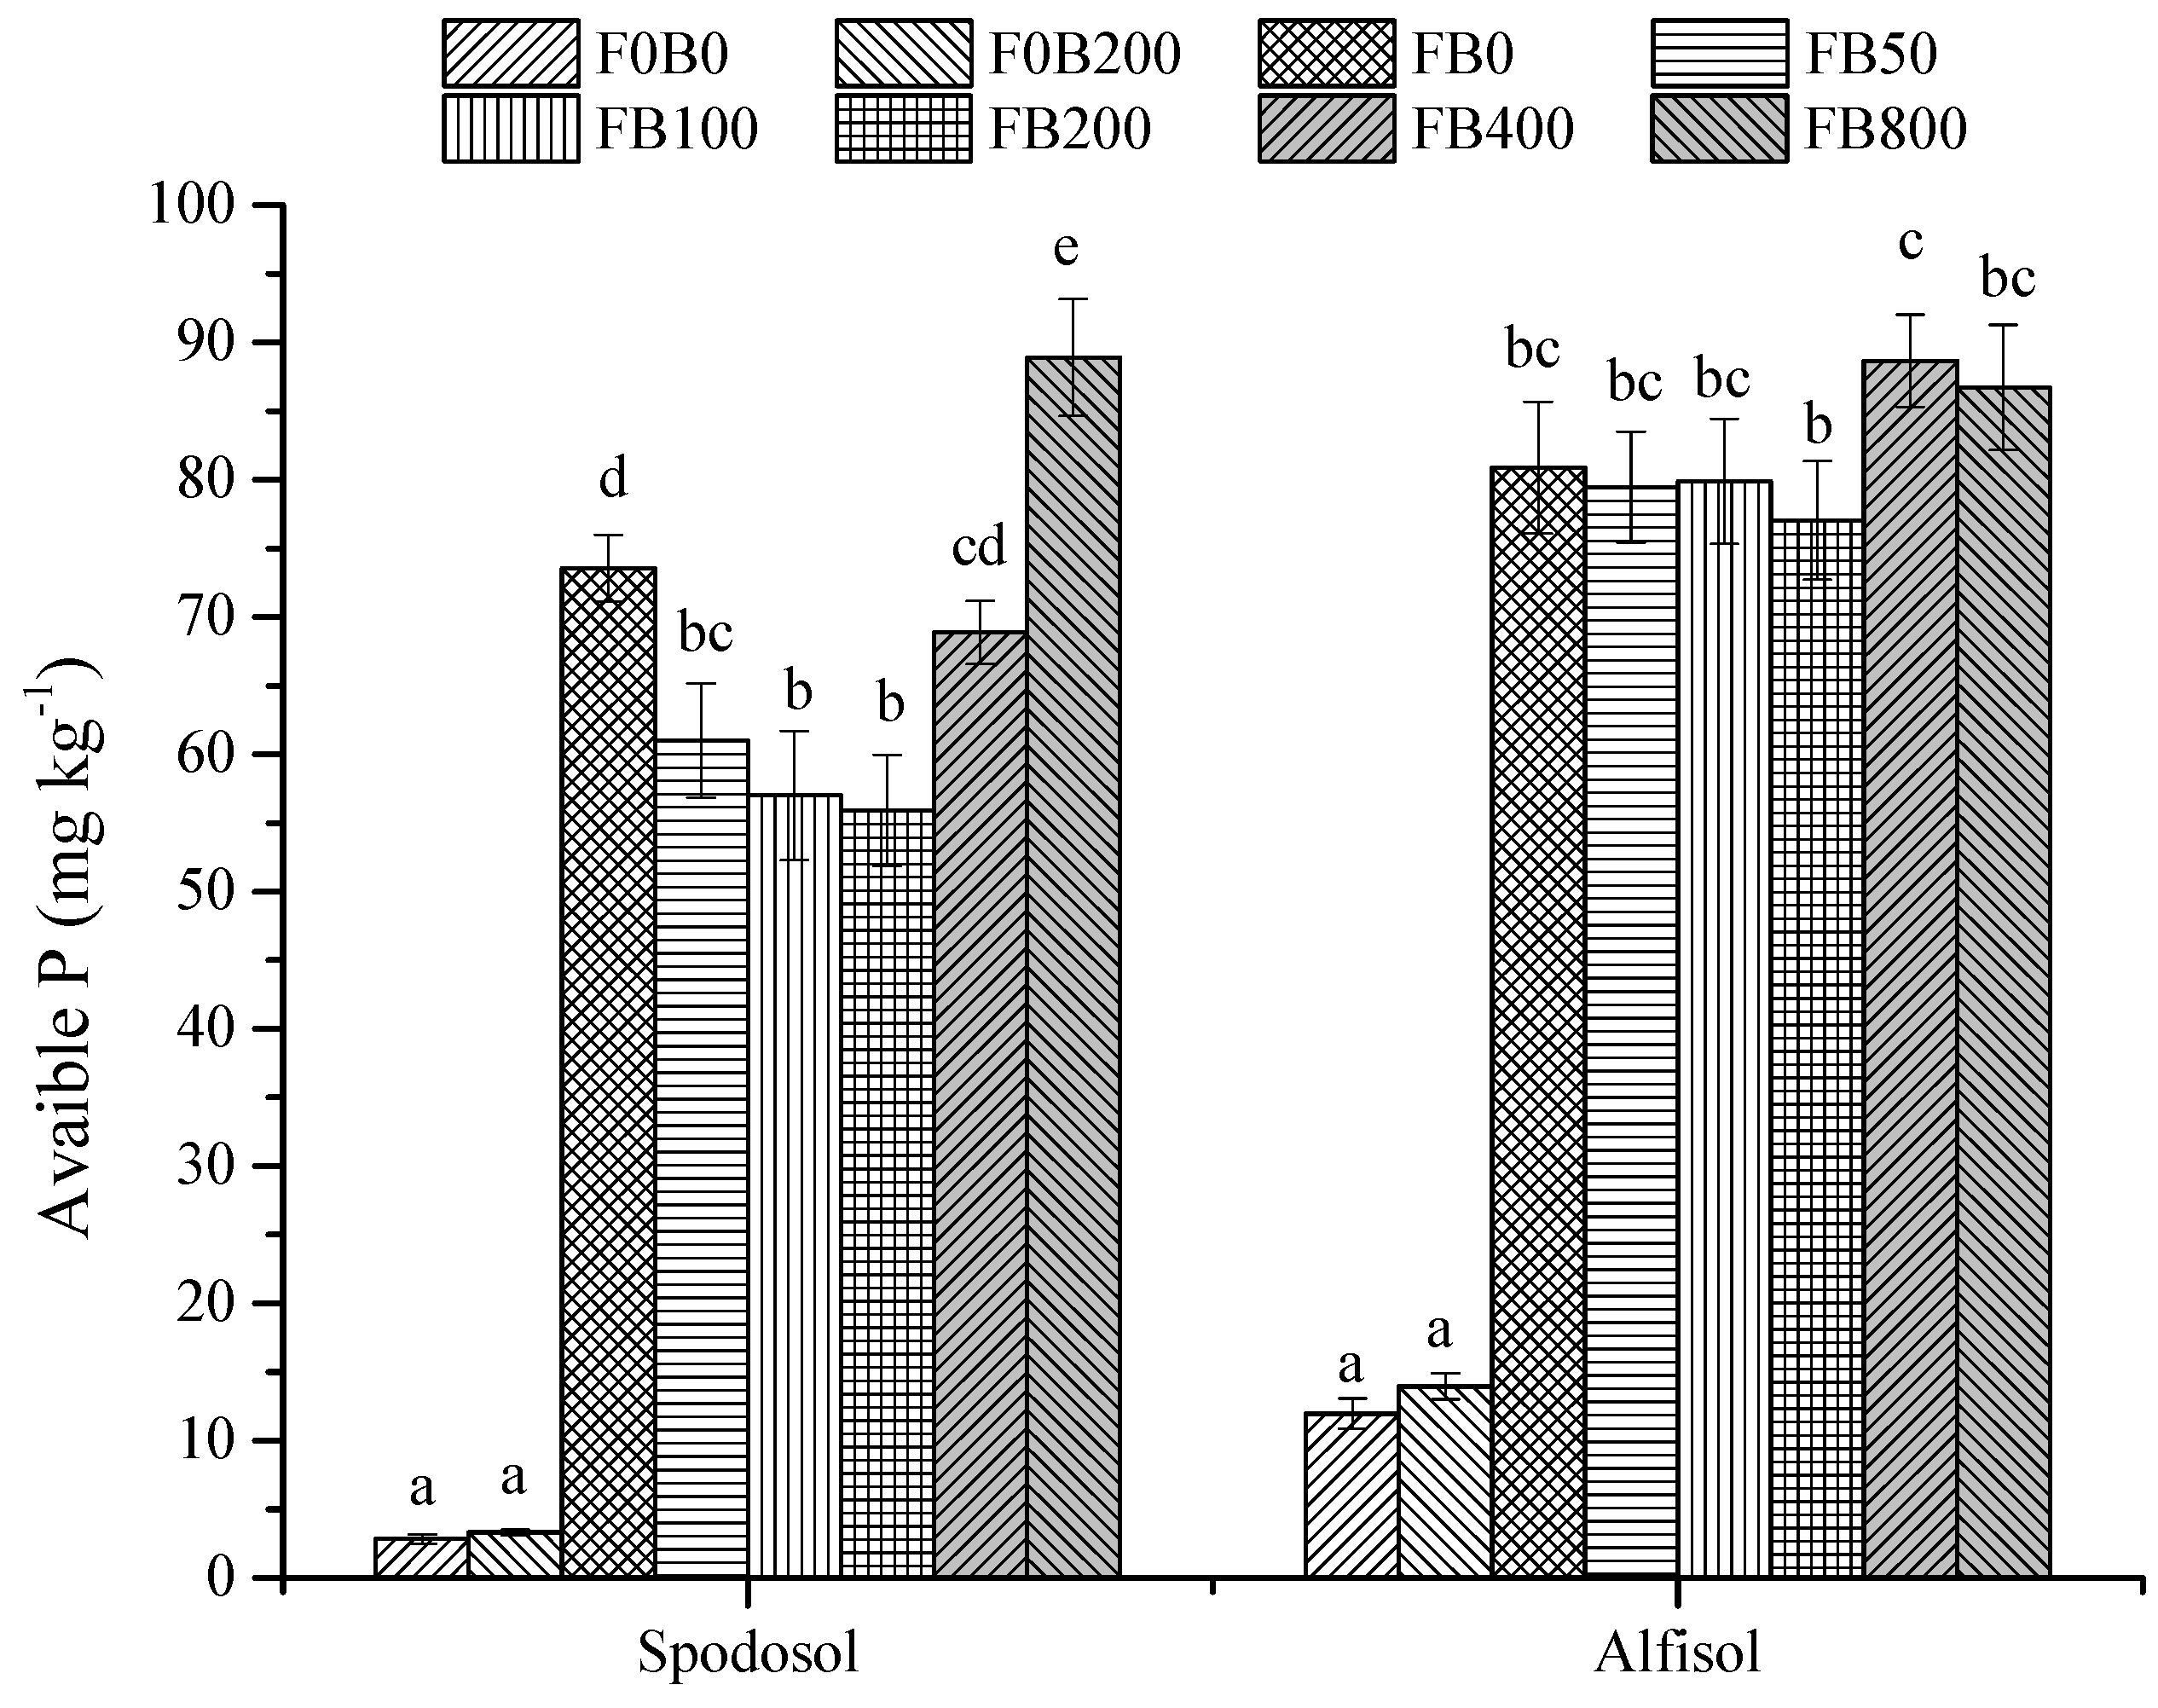
3.4. Soil Available N and P
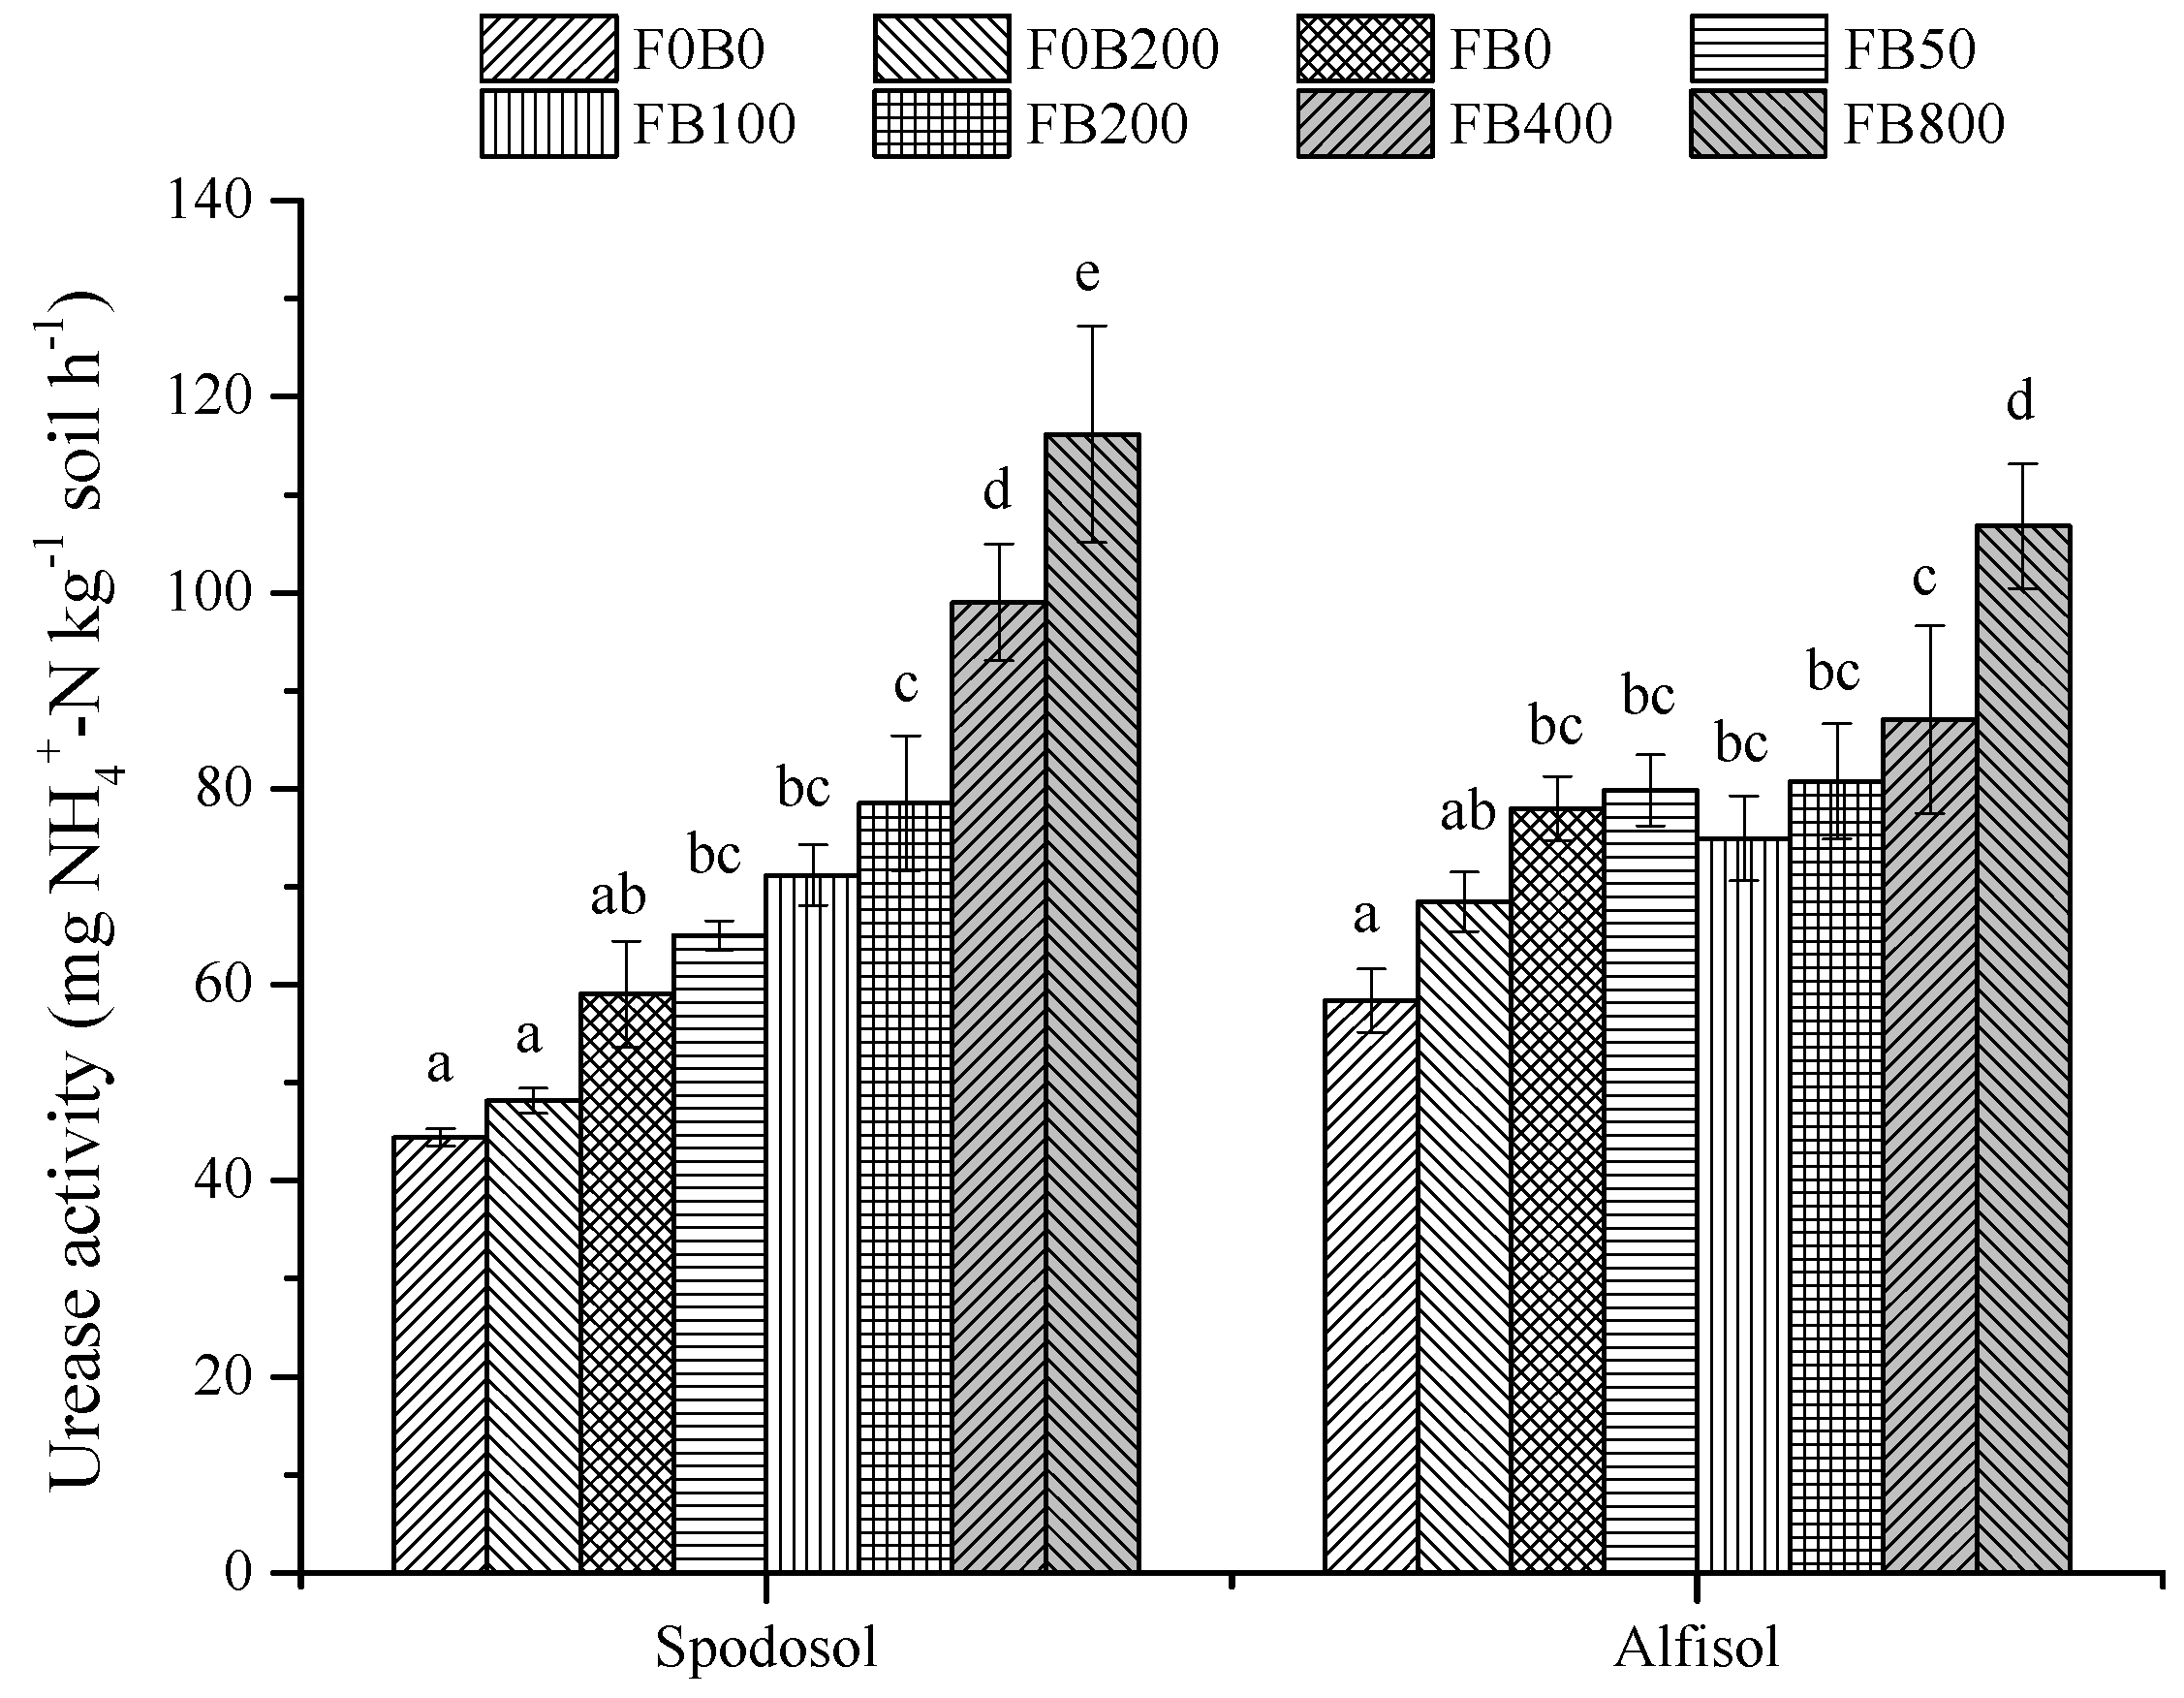
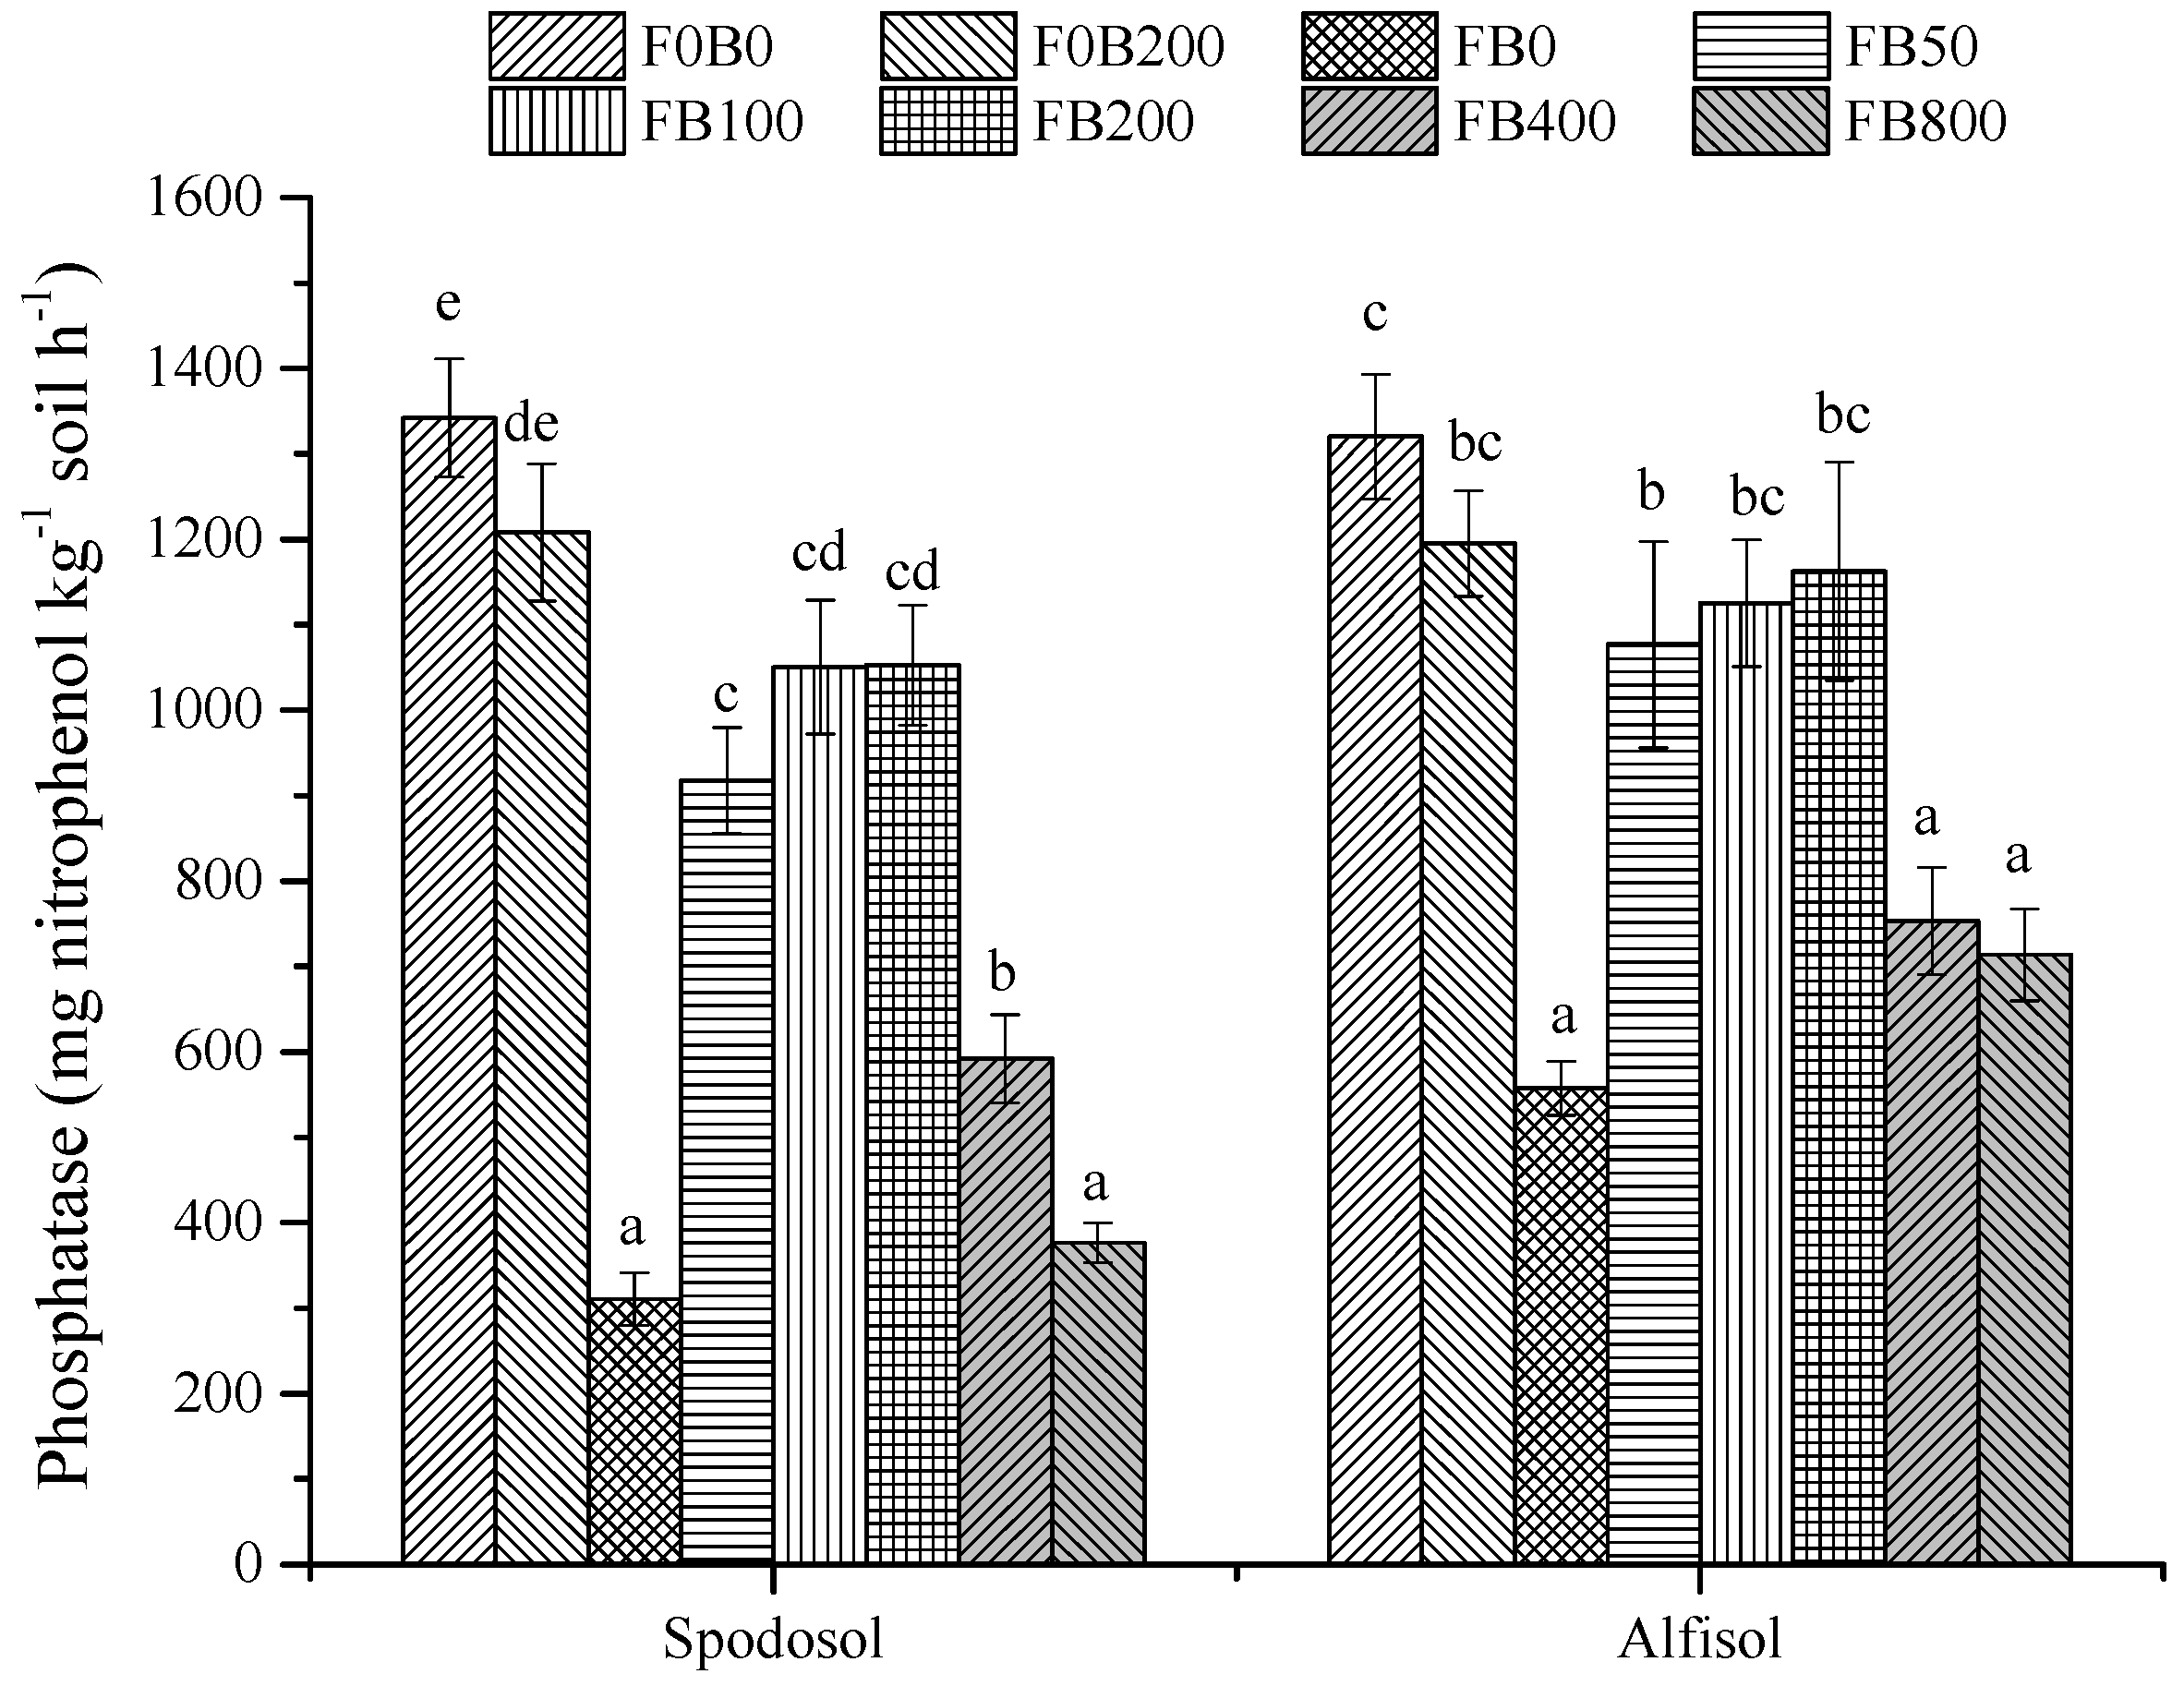
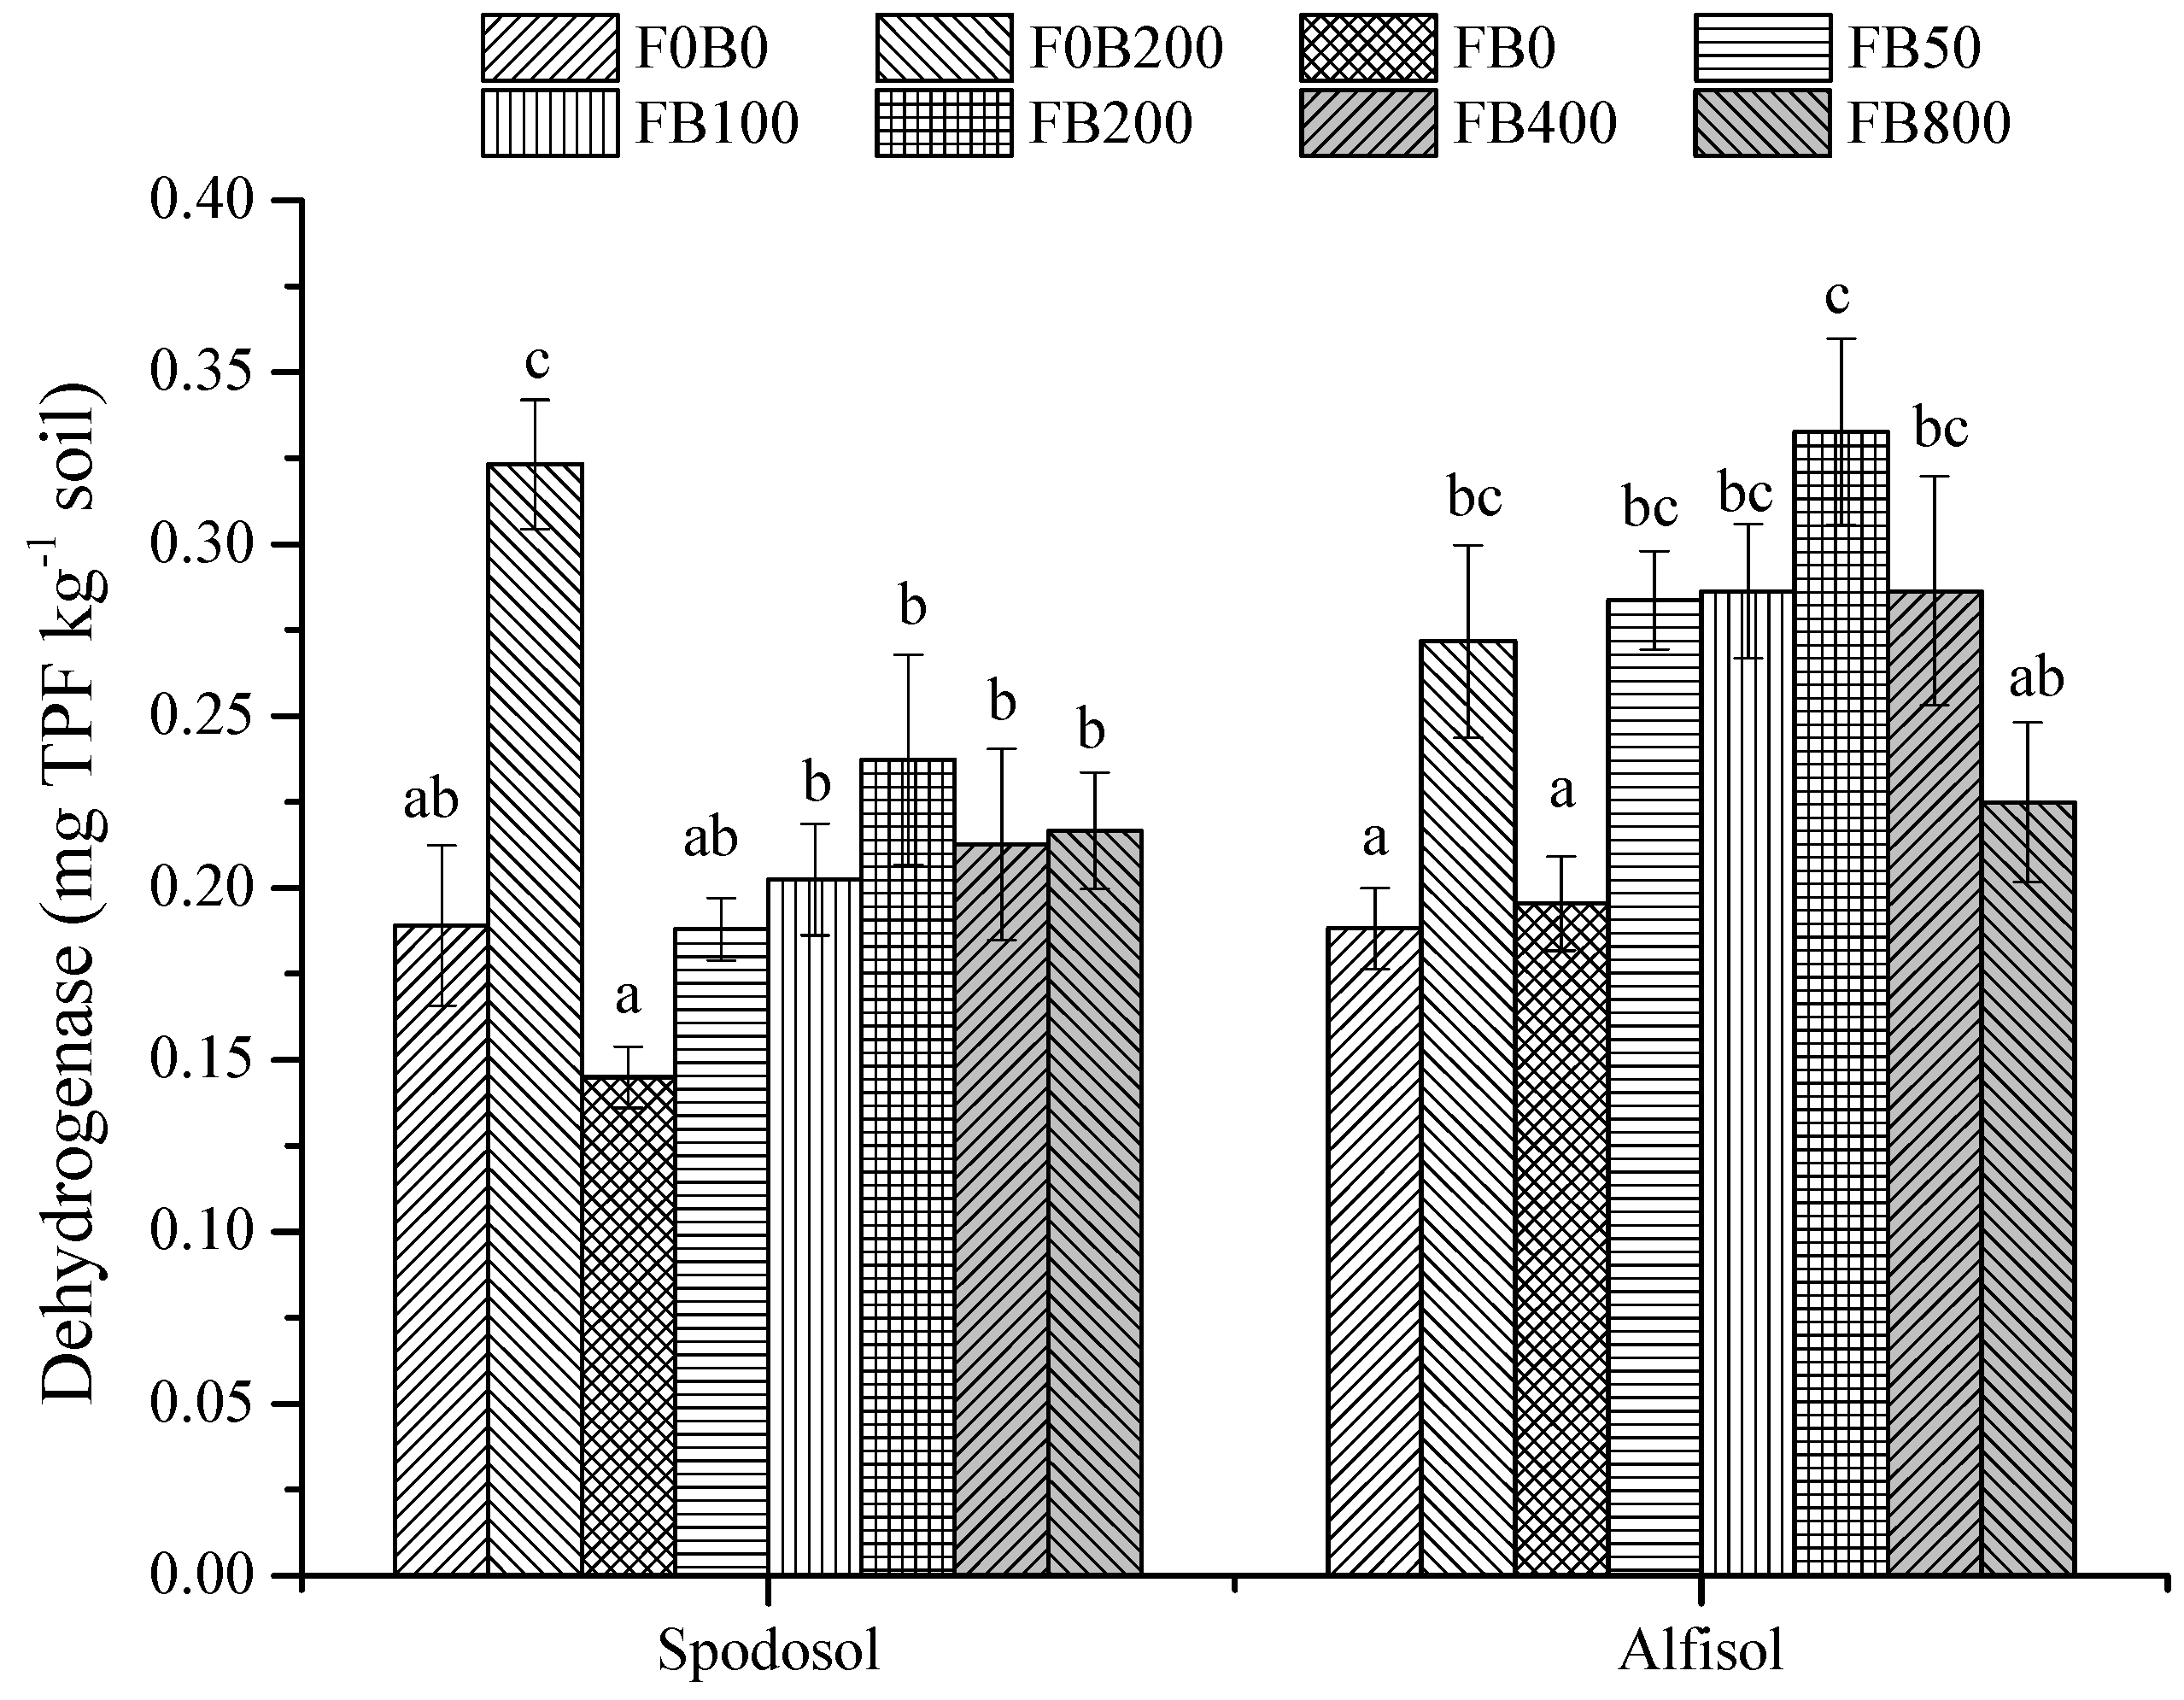
3.5. Soil Enzyme Activities
4. Discussion
4.1. Dose-Dependent Effect of CNP on Plant Growth
4.2. Effects of CNPs on Plant Uptake and Use Efficiency of Nutrients
4.3. Effects of CNPs on Soil Available Nutrient and Enzyme Activities
5. Conclusions
Author Contributions
Funding
Data Availability Statement
Conflicts of Interest
References
- Bindraban, P.S.; Dimkpa, C.O.; Angle, S.; Rabbinge, R. Unlocking the multiple public good services from balanced fertilizers. Food Secur. 2018, 10, 273–285. [Google Scholar] [CrossRef]
- Guha, T.; Gopal, G.; Kundu, R.; Mukherjee, A. Nanocomposites for delivering agrochemicals: A comprehensive review. J. Agric. Food Chem. 2020, 68, 3691–3702. [Google Scholar] [CrossRef] [PubMed]
- Qian, Y.; Qin, C.; Chen, M.; Lin, S. Nanotechnology in soil remediation−applications vs. implications. Ecotoxicol. Environ. Saf. 2020, 201, 110815. [Google Scholar] [CrossRef]
- Usman, M.; Farooq, M.; Wakeel, A.; Nawaz, A.; Cheema, S.A.; Rehman ur, H.; Ashraf, I.; Sanaullah, M. Nanotechnology in agriculture: Current status, challenges and future opportunities. Sci. Total Environ. 2020, 721, 137778. [Google Scholar] [CrossRef] [PubMed]
- Liu, R.; Lal, R. Potentials of engineered nanoparticles as fertilizers for increasing agronomic productions. Sci. Total Environ. 2015, 514, 131–139. [Google Scholar] [CrossRef] [PubMed]
- Mukherjee, A.; Majumdar, S.; Servin, A.D.; Pagano, L.; Dhankher, O.P.; White, J.C. Carbon nanomaterials in agriculture: A critical review. Front. Plant Sci. 2016, 7, 172. [Google Scholar] [CrossRef] [Green Version]
- Khodakovskaya, M.V.; Kim, B.S.; Kim, J.N.; Alimohammadi, M.; Dervishi, E.; Mustafa, T.; Cernigla, C.E. Carbon nanotubes as plant growth regulators: Effects on tomato growth, reproductive system, and soil microbial community. Small 2013, 9, 115–123. [Google Scholar] [CrossRef]
- López-Vargas, E.R.; González-García, Y.; Pérez-Álvarez, M.; Cadenas-Pliego, G.; González-Morales, S.; Benavides-Mendoza, A.; Cabrera, R.I.; Juárez-Maldonado, A. Seed Priming with Carbon Nanomaterials to Modify the Germination, Growth, and Antioxidant Status of Tomato Seedlings. Agronomy 2020, 10, 639. [Google Scholar] [CrossRef]
- Khodakovskaya, M.V.; De Silva, K.; Biris, A.S.; Dervishi, E.; Villagarcia, H. Carbon nanotubes induce growth enhancement of tobacco cells. ACS Nano 2012, 6, 2128–2135. [Google Scholar] [CrossRef]
- Villagarcia, H.; Dervishi, E.; de Silva, K.; Biris, A.S.; Khodakovskaya, M.V. Surface chemistry of carbon nanotubes impacts the growth and expression of water channel protein in tomato plants. Small 2012, 8, 2328–2334. [Google Scholar] [CrossRef] [PubMed]
- Xin, X.; Zhao, F.; Zhao, H.; Goodrich, S.L.; Hill, M.R.; Sumerlin, B.S.; Stoffella, P.J.; Wright, A.L.; He, Z. Comparative assessment of polymeric and other nanoparticles impacts on soil microbial and biochemical properties. Geoderma 2020, 367, 114278. [Google Scholar] [CrossRef]
- Giraldo, J.P.; Landry, M.P.; Faltermeier, S.M.; McNicholas, T.P.; Iverson, N.M.; Boghossian, A.A.; Reuel, N.F.; Hilmer, A.J.; Sen, F.; Brew, J.A. Plant nanobionics approach to augment photosynthesis and biochemical sensing. Nat. Mater. 2014, 13, 400. [Google Scholar] [CrossRef] [PubMed] [Green Version]
- Yan, Q.; Gozin, M.; Zhao, F.; Cohen, A.; Pang, S. Highly energetic compositions based on functionalized carbon nanomaterials. Nanoscale 2016, 8, 4799–4851. [Google Scholar] [CrossRef] [PubMed] [Green Version]
- Verma, S.K.; Das, A.K.; Gantait, S.; Kumar, V.; Gurel, E. Applications of carbon nanomaterials in the plant system: A perspective view on the pros and cons. Sci. Total Environ. 2019, 667, 485–499. [Google Scholar] [CrossRef] [PubMed]
- Hoogeweg, C.; Hornsby, A. Simulated effects of irrigation practices on leaching of citrus herbicides in Flatwoods and Ridge-type soils. J. Soil Crop Sci. Soc. Fla. 1997, 56, 98–108. [Google Scholar]
- Yang, J.; He, Z.; Yang, Y.; Stoffella, P.; Yang, X.; Banks, D.; Mishra, S. Use of amendments to reduce leaching loss of phosphorus and other nutrients from a sandy soil in Florida. Environ. Sci. Pollut. Res. 2007, 14, 266–269. [Google Scholar] [CrossRef] [PubMed]
- Gregorich, E.G.; Carter, M.R. Soil Sampling and Methods of Analysis; CRC Press: Boca Raton, FL, USA, 2007. [Google Scholar]
- Hochmuth, G.; Hanlon, E.; O’Hair, S.; Carranza, J.; Lamberts, M. On-farm evaluations of University of Florida N, P, and K recommendations for sweet corn on rockdale and marl soils. Fla. State Hortic. Soc. 1995, 108, 184–192. [Google Scholar]
- Kuo, S. Phosphorus. In Methods of Soil Analysis, Part 3. SSSA; Bridgham, J.M., Ed.; Wiley: Madison, WI, USA, 1996; pp. 896–919. [Google Scholar]
- McGarity, J.; Myers, M.G. A survey of urease activity in soils of northern New South Wales. Plant Soil 1967, 27, 217–238. [Google Scholar] [CrossRef]
- Tabatabai, M.; Bremner, J. Use of p-nitrophenyl phosphate for assay of soil phosphatase activity. Soil Biol. Biochem. 1969, 1, 301–307. [Google Scholar] [CrossRef]
- Casida, L. Microbial metabolic activity in soil as measured by dehydrogenase determinations. Appl. Environ. Microbiol. 1977, 34, 630–636. [Google Scholar] [CrossRef] [Green Version]
- Bhati, A.; Tripathi, K.M.; Singh, A.; Sarkar, S.; Sonkar, S.K. Exploration of nano carbons in relevance to plant systems. New J. Chem. 2018, 42, 16411–16427. [Google Scholar] [CrossRef]
- Tiwari, D.; Dasgupta-Schubert, N.; Cendejas, L.V.; Villegas, J.; Montoya, L.C.; García, S.B. Interfacing carbon nanotubes (CNT) with plants: Enhancement of growth, water and ionic nutrient uptake in maize (Zea mays) and implications for nanoagriculture. Appl. NanoSci. 2014, 4, 577–591. [Google Scholar] [CrossRef] [Green Version]
- Saxena, M.; Maity, S.; Sarkar, S. Carbon nanoparticles in ‘biochar’ boost wheat (Triticum aestivum) plant growth. Rsc Adv. 2014, 4, 39948–39954. [Google Scholar] [CrossRef]
- Servin, A.; Elmer, W.; Mukherjee, A.; De la Torre-Roche, R.; Hamdi, H.; White, J.C.; Bindraban, P.; Dimkpa, C. A review of the use of engineered nanomaterials to suppress plant disease and enhance crop yield. J. Nanopart. Res. 2015, 17, 92. [Google Scholar] [CrossRef]
- Fincheira, P.; Tortella, G.; Duran, N.; Seabra, A.B.; Rubilar, O. Current applications of nanotechnology to develop plant growth inducer agents as an innovation strategy. Crit. Rev. Biotechnol. 2020, 40, 15–30. [Google Scholar] [CrossRef] [PubMed]
- Achari, G.A.; Kowshik, M. Recent developments on nanotechnology in agriculture: Plant mineral nutrition, health, and interactions with soil microflora. J. Agric. Food Chem. 2018, 66, 8647–8661. [Google Scholar] [CrossRef]
- Rahmani, N.; Radjabian, T.; Soltani, B.M. Impacts of foliar exposure to multi-walled carbon nanotubes on physiological and molecular traits of Salvia verticillata L., as a medicinal plant. Plant Physiol. Biochem. 2020, 150, 27–38. [Google Scholar] [CrossRef]
- Mohamed, M.A.; Hashim, A.F.; Alghuthaymi, M.A.; Abd-Elsalam, K.A. Nano-carbon: Plant Growth Promotion and Protection. In Nanobiotechnology Applications in Plant Protection; Abd-Elsalam, K., Prasad, R., Eds.; Springer: Cham, Switzerland, 2018; pp. 155–188. [Google Scholar]
- Liang, T.; Yin, Q.; Zhang, Y.; Wang, B.; Guo, W.; Wang, J.; Xie, J. Effects of carbon nanoparticles application on the growth, physiological characteristics and nutrient accumulation in tobacco plants. J. Agric. Food Chem. 2013, 11, 954–958. [Google Scholar]
- Chung, H.; Son, Y.; Yoon, T.K.; Kim, S.; Kim, W. The effect of multi-walled carbon nanotubes on soil microbial activity. Ecotoxicol. Environ. Saf. 2011, 74, 569–575. [Google Scholar] [CrossRef]
- Nyberg, L.; Turco, R.F.; Nies, L. Assessing the impact of nanomaterials on anaerobic microbial communities. Environ. Sci. Technol. 2008, 42, 1938–1943. [Google Scholar] [CrossRef]
- Tong, Z.; Bischoff, M.; Nies, L.; Applegate, B.; Turco, R.F. Impact of fullerene (C60) on a soil microbial community. Environ. Sci. Technol. 2007, 41, 2985–2991. [Google Scholar] [CrossRef] [PubMed]
- Schlich, K.; Hund-Rinke, K.J.E.P. Influence of soil properties on the effect of silver nanomaterials on microbial activity in five soils. Environ. Pollut. 2015, 196, 321–330. [Google Scholar] [CrossRef] [PubMed]


| Items | N Use Efficiency (%) | P Use Efficiency (%) | K Use Efficiency (%) | |||
|---|---|---|---|---|---|---|
| Spodosol | Alfisol | Spodosol | Alfisol | Spodosol | Alfisol | |
| FB0 | 2.45 ± 0.56 a | 36.1 ± 3.24 a | 1.67 ± 0.37 a | 16.7 ± 2.12 ab | 3.83 ± 0.32 a | 30.9 ± 2.81 a |
| FB50 | 25.3 ± 3.79 b | 39.6 ± 2.06 a | 7.04 ± 1.33 ab | 16.5 ± 1.20 a | 14.7 ± 2.43 b | 36.8 ± 1.50 ab |
| FB100 | 35.1 ± 2.75 c | 43.7 ± 2.34 ab | 9.93 ± 2.15 bc | 16.9 ± 1.26 ab | 19.7 ± 1.60 c | 38.1 ± 4.03 ab |
| FB200 | 48.8 ± 4.89 d | 50.5 ± 3.47 b | 11.8 ± 0.77 c | 19.0 ± 1.53 ab | 26.7 ± 1.97 d | 40.4 ± 2.38 b |
| FB400 | 24.0 ± 1.79 b | 41.9 ± 3.53 ab | 10.7 ± 1.51 c | 16.3 ± 1.94 a | 15.5 ± 1.58 b | 43.5 ± 4.71 b |
| FB800 | 2.72 ± 0.53 a | 44.7 ± 3.62 ab | 3.72 ± 0.64 a | 22.4 ± 2.81 b | 5.11 ± 0.51 a | 44.7 ± 2.38 b |
Publisher’s Note: MDPI stays neutral with regard to jurisdictional claims in published maps and institutional affiliations. |
© 2021 by the authors. Licensee MDPI, Basel, Switzerland. This article is an open access article distributed under the terms and conditions of the Creative Commons Attribution (CC BY) license (https://creativecommons.org/licenses/by/4.0/).
Share and Cite
Zhao, F.; Xin, X.; Cao, Y.; Su, D.; Ji, P.; Zhu, Z.; He, Z. Use of Carbon Nanoparticles to Improve Soil Fertility, Crop Growth and Nutrient Uptake by Corn (Zea mays L.). Nanomaterials 2021, 11, 2717. https://doi.org/10.3390/nano11102717
Zhao F, Xin X, Cao Y, Su D, Ji P, Zhu Z, He Z. Use of Carbon Nanoparticles to Improve Soil Fertility, Crop Growth and Nutrient Uptake by Corn (Zea mays L.). Nanomaterials. 2021; 11(10):2717. https://doi.org/10.3390/nano11102717
Chicago/Turabian StyleZhao, Fengliang, Xiaoping Xin, Yune Cao, Dan Su, Puhui Ji, Zhiqiang Zhu, and Zhenli He. 2021. "Use of Carbon Nanoparticles to Improve Soil Fertility, Crop Growth and Nutrient Uptake by Corn (Zea mays L.)" Nanomaterials 11, no. 10: 2717. https://doi.org/10.3390/nano11102717
APA StyleZhao, F., Xin, X., Cao, Y., Su, D., Ji, P., Zhu, Z., & He, Z. (2021). Use of Carbon Nanoparticles to Improve Soil Fertility, Crop Growth and Nutrient Uptake by Corn (Zea mays L.). Nanomaterials, 11(10), 2717. https://doi.org/10.3390/nano11102717