
Graded Morphologies and the Performance of PffBT4T-2OD:PC71BM Devices Using Additive Choice

 , , , , and
Abstract
:1. Introduction
2. Experimental Section
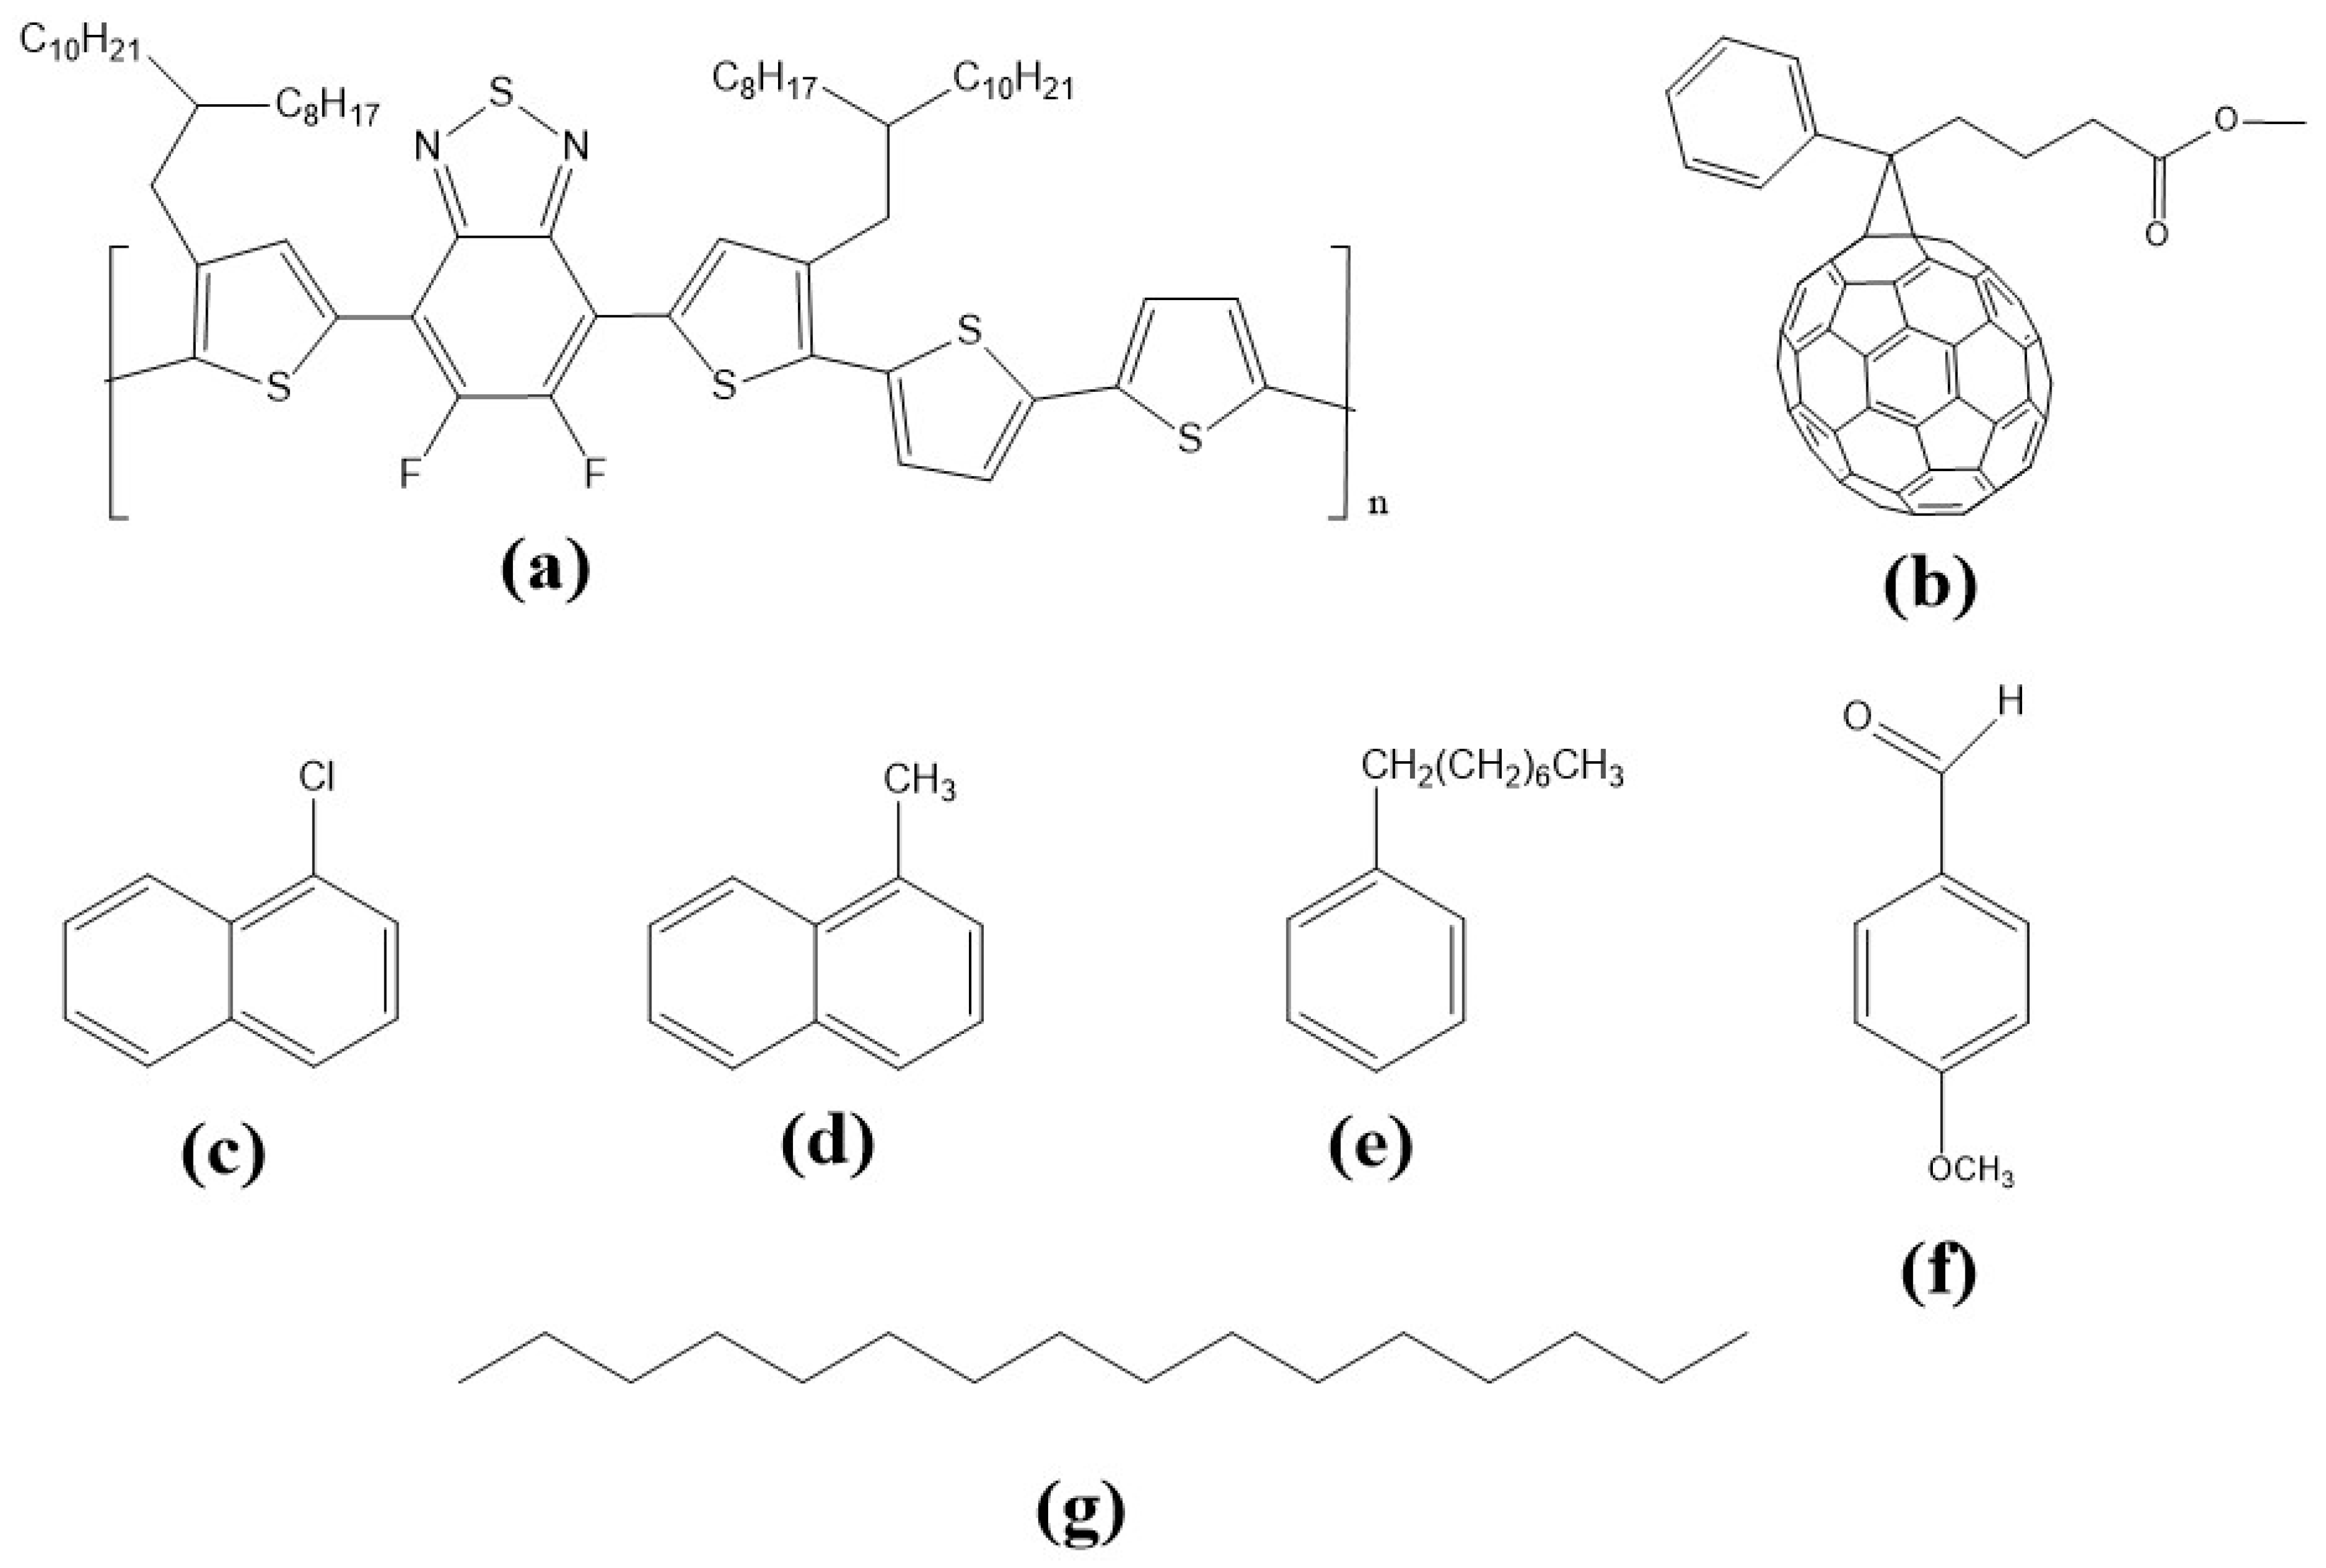
2.1. Materials
2.2. Device Fabrication
2.3. Morphological Characterization
2.4. Electrical Characterization
3. Results and Discussion
4. Conclusions
Supplementary Materials
Author Contributions
Funding
Data Availability Statement
Acknowledgments
Conflicts of Interest
References
- Best Research-Cell Efficiency Chart—NREL. Available online: https://www.nrel.gov/pv/cell-efficiency.html (accessed on 25 March 2021).
- Bernardo, G.; Lopes, T.; Lidzey, D.G.; Mendes, A. Progress in Upscaling Organic Photovoltaic Devices. Adv. Energy Mater. 2021, 11, 2100342. [Google Scholar] [CrossRef]
- Gertsen, A.S.; Castro, M.F.; Søndergaard, R.R.; Andreasen, J.W. Scalable fabrication of organic solar cells based on non-fullerene acceptors. Flex. Print. Electron. 2020, 5, 014004. [Google Scholar] [CrossRef]
- Wang, G.; Adil, M.A.; Zhang, J.; Wei, Z. Large-Area Organic Solar Cells: Material Requirements, Modular Designs, and Printing Methods. Adv. Mater. 2019, 31, 1805089. [Google Scholar] [CrossRef]
- Liu, Y.; Zhao, J.; Li, Z.; Mu, C.; Ma, W.; Hu, H.; Jiang, K.; Lin, H.; Ade, H.; Yan, H. Aggregation and morphology control enables multiple cases of high-efficiency polymer solar cells. Nat. Commun. 2014, 5, 5293. [Google Scholar] [CrossRef] [Green Version]
- Ma, W.; Yang, G.F.; Jiang, K.; Carpenter, J.H.; Wu, Y.; Meng, X.Y.; McAfee, T.; Zhao, J.B.; Zhu, C.H.; Wang, C.; et al. Influence of Processing Parameters and Molecular Weight on the Morphology and Properties of High-Performance PffBT4T-2OD:PC71BM Organic Solar Cells. Adv. Energy Mater. 2015, 5, 9. [Google Scholar] [CrossRef]
- Zhao, J.; Zhao, S.; Xu, Z.; Qiao, B.; Huang, D.; Li, Y.; Zhu, Y.; Wang, P. Revealing the Effect of Additives with Different Solubility on the Morphology and the Donor Crystalline Structures of Organic Solar Cells. ACS Appl. Mater. Interfaces 2016, 8, 18231–18237. [Google Scholar] [CrossRef] [PubMed]
- Zhang, X.; Zheng, D.; Xing, S.; Wang, H.; Huang, J.; Yu, J. Precisely control the morphology and crystallization of temperature-dependent aggregation bulk heterojunction by using co-solvent system for optimized light intensity distribution and its effect on thick active layer polymer solar cells. Sol. Energy 2017, 147, 106–112. [Google Scholar] [CrossRef]
- Zhang, Y.; Parnell, A.J.; Pontecchiani, F.; Cooper, J.F.K.; Thompson, R.; Jones, R.; King, S.M.; Lidzey, D.G.; Bernardo, G. Understanding and controlling morphology evolution via DIO plasticization in PffBT4T-2OD/PC71BM devices. Sci. Rep. 2017, 7, 44269. [Google Scholar] [CrossRef] [PubMed] [Green Version]
- Bi, Z.; Naveed, H.B.; Mao, Y.; Yan, H.; Ma, W. Importance of Nucleation during Morphology Evolution of the Blade-Cast PffBT4T-2OD-Based Organic Solar Cells. Macromolecules 2018, 51, 6682–6691. [Google Scholar] [CrossRef]
- Sharma, R.; Gupta, V.; Lee, H.; Borse, K.; Datt, R.; Sharma, C.; Kumar, M.; Yoo, S.; Gupta, D. Charge carrier dynamics in PffBT4T-2OD: PCBM organic solar cells. Org. Electron. 2018, 62, 441–447. [Google Scholar] [CrossRef]
- Weu, A.; Hopper, T.R.; Lami, V.; Kreß, J.A.; Bakulin, A.A.; Vaynzof, Y. Field-Assisted Exciton Dissociation in Highly Efficient PffBT4T-2OD:Fullerene Organic Solar Cells. Chem. Mater. 2018, 30, 2660–2667. [Google Scholar] [CrossRef]
- Gaspar, H.; Figueira, F.; Pereira, L.; Mendes, A.; Viana, J.C.; Bernardo, G. Recent Developments in the Optimization of the Bulk Heterojunction Morphology of Polymer: Fullerene Solar Cells. Materials 2018, 11, 2560. [Google Scholar] [CrossRef] [PubMed] [Green Version]
- Gaspar, H.; Figueira, F.; Strutyński, K.; Melle-Franco, M.; Ivanou, D.; Tomé, J.P.C.; Pereira, C.M.; Pereira, L.; Mendes, A.; Viana, J.C.; et al. PffBT4T-2OD Based Solar Cells with Aryl-Substituted N-Methyl-Fulleropyrrolidine Acceptors. Materials 2019, 12, 4100. [Google Scholar] [CrossRef] [PubMed] [Green Version]
- Gaspar, H.; Figueira, F.; Strutyński, K.; Melle-Franco, M.; Ivanou, D.; Tomé, J.P.C.; Pereira, C.M.; Pereira, L.; Mendes, A.; Viana, J.C.; et al. Thiophene- and Carbazole-Substituted N-Methyl-Fulleropyrrolidine Acceptors in PffBT4T-2OD Based Solar Cells. Materials 2020, 13, 1267. [Google Scholar] [CrossRef] [PubMed] [Green Version]
- Zhang, Y.; Parnell, A.J.; Blaszczyk, O.; Musser, A.J.; Samuel, I.D.W.; Lidzey, D.G.; Bernardo, G. Effect of fullerene acceptor on the performance of solar cells based on PffBT4T-2OD. Phys. Chem. Chem. Phys. 2018, 20, 19023–19029. [Google Scholar] [CrossRef] [PubMed]
- Liao, H.-H.; Ho, C.-C.; Chang, C.-Y.; Jao, M.-H.; Darling, S.B.; Su, W.-F. Additives for morphology control in high-efficiency organic solar cells. Mater. Today 2013, 16, 326–336. [Google Scholar] [CrossRef]
- McDowell, C.; Abdelsamie, M.; Toney, M.F.; Bazan, G.C. Solvent Additives: Key Morphology-Directing Agents for Solution-Processed Organic Solar Cells. Adv. Mater. 2018, 30, e1707114. [Google Scholar] [CrossRef] [PubMed]
- Machui, F.; Maisch, P.; Burgués-Ceballos, I.; Langner, S.; Krantz, J.; Ameri, T.; Brabec, C.J. Classification of Additives for Organic Photovoltaic Devices. ChemPhysChem 2015, 16, 1275–1280. [Google Scholar] [CrossRef]
- Bernardo, G.; Washington, A.L.; Zhang, Y.; King, S.; Toolan, D.; Weir, M.; Dunbar, A.; Howse, J.R.; Dattani, R.; Fairclough, J.P.A.; et al. Does 1,8-diiodooctane affect the aggregation state of PC71BM in solution? R. Soc. Open Sci. 2018, 5, 180937. [Google Scholar] [CrossRef] [Green Version]
- Hansen, C.M. Hansen Solubility Parameters—A User’s Handbook, 2nd ed.; CRC Press—Taylor & Francis Group: Boca Raton, FL, USA, 2007. [Google Scholar]
- Trindade, A.J.; Pereira, L. Bulk Heterojunction Organic Solar Cell Area-Dependent Parameter Fluctuation. Int. J. Photoenergy 2017, 2017, 1–10. [Google Scholar] [CrossRef] [Green Version]
- von Hauff, E. Impedance Spectroscopy for Emerging Photovoltaics. J. Phys. Chem. C 2019, 123, 11329–11346. [Google Scholar] [CrossRef] [Green Version]
- Basham, J.I.; Jackson, T.N.; Gundlach, D.J. Predicting the J-V Curve in Organic Photovoltaics Using Impedance Spectroscopy. Adv. Energy Mater. 2014, 4, 1400499. [Google Scholar] [CrossRef]
- Yao, E.-P.; Chen, C.-C.; Gao, J.; Liu, Y.; Chen, Q.; Cai, M.; Hsu, W.-C.; Hong, Z.; Li, G.; Yang, Y. The study of solvent additive effects in efficient polymer photovoltaics via impedance spectroscopy. Sol. Energy Mater. Sol. Cells 2014, 130, 20–26. [Google Scholar] [CrossRef]
- Garcia-Belmonte, G.; Guerrero, A.; Bisquert, J. Elucidating Operating Modes of Bulk-Heterojunction Solar Cells from Impedance Spectroscopy Analysis. J. Phys. Chem. Lett. 2013, 4, 877–886. [Google Scholar] [CrossRef] [PubMed] [Green Version]
- Gupta, S.K.; Pali, L.S.; Garg, A. Impedance spectroscopy on degradation analysis of polymer/fullerene solar cells. Sol. Energy 2018, 178, 133–141. [Google Scholar] [CrossRef]
- Garcia-Belmonte, G.; Munar, A.; Barea, E.M.; Bisquert, J.; Ugarte, I.; Pacios, R. Charge carrier mobility and lifetime of organic bulk heterojunctions analyzed by impedance spectroscopy. Org. Electron. 2008, 9, 847–851. [Google Scholar] [CrossRef]
- Bernardo, G.; Gaspar, H.; Perez, G.; Shackleford, A.S.; Parnell, A.J.; Bleuel, M.; Mendes, A.; King, S.M.; Parnell, S.R. Impact of 1,8-diiodooctane on the morphology of organic photovoltaic (OPV) devices—A Small Angle Neutron Scattering (SANS) study. Polym. Test. 2019, 82, 106305. [Google Scholar] [CrossRef]
- Zhang, C.; Langner, S.; Mumyatov, A.V.; Anokhin, D.V.; Min, J.; Perea, J.D.; Gerasimov, K.L.; Osvet, A.; Ivanov, D.A.; Troshin, P.; et al. Understanding the correlation and balance between the miscibility and optoelectronic properties of polymer–fullerene solar cells. J. Mater. Chem. A 2017, 5, 17570–17579. [Google Scholar] [CrossRef] [Green Version]
- Walker, B.; Tamayo, A.; Duong, D.T.; Dang, X.-D.; Kim, C.; Granstrom, J.; Nguyen, T.-Q. A Systematic Approach to Solvent Selection Based on Cohesive Energy Densities in a Molecular Bulk Heterojunction System. Adv. Energy Mater. 2011, 1, 221–229. [Google Scholar] [CrossRef]
- Barton, A.F.M. CRC Handbook of Solubility Parameters and Other Cohesion Parameters; CRC Press: Boca Raton, FL, USA, 2017. [Google Scholar] [CrossRef]


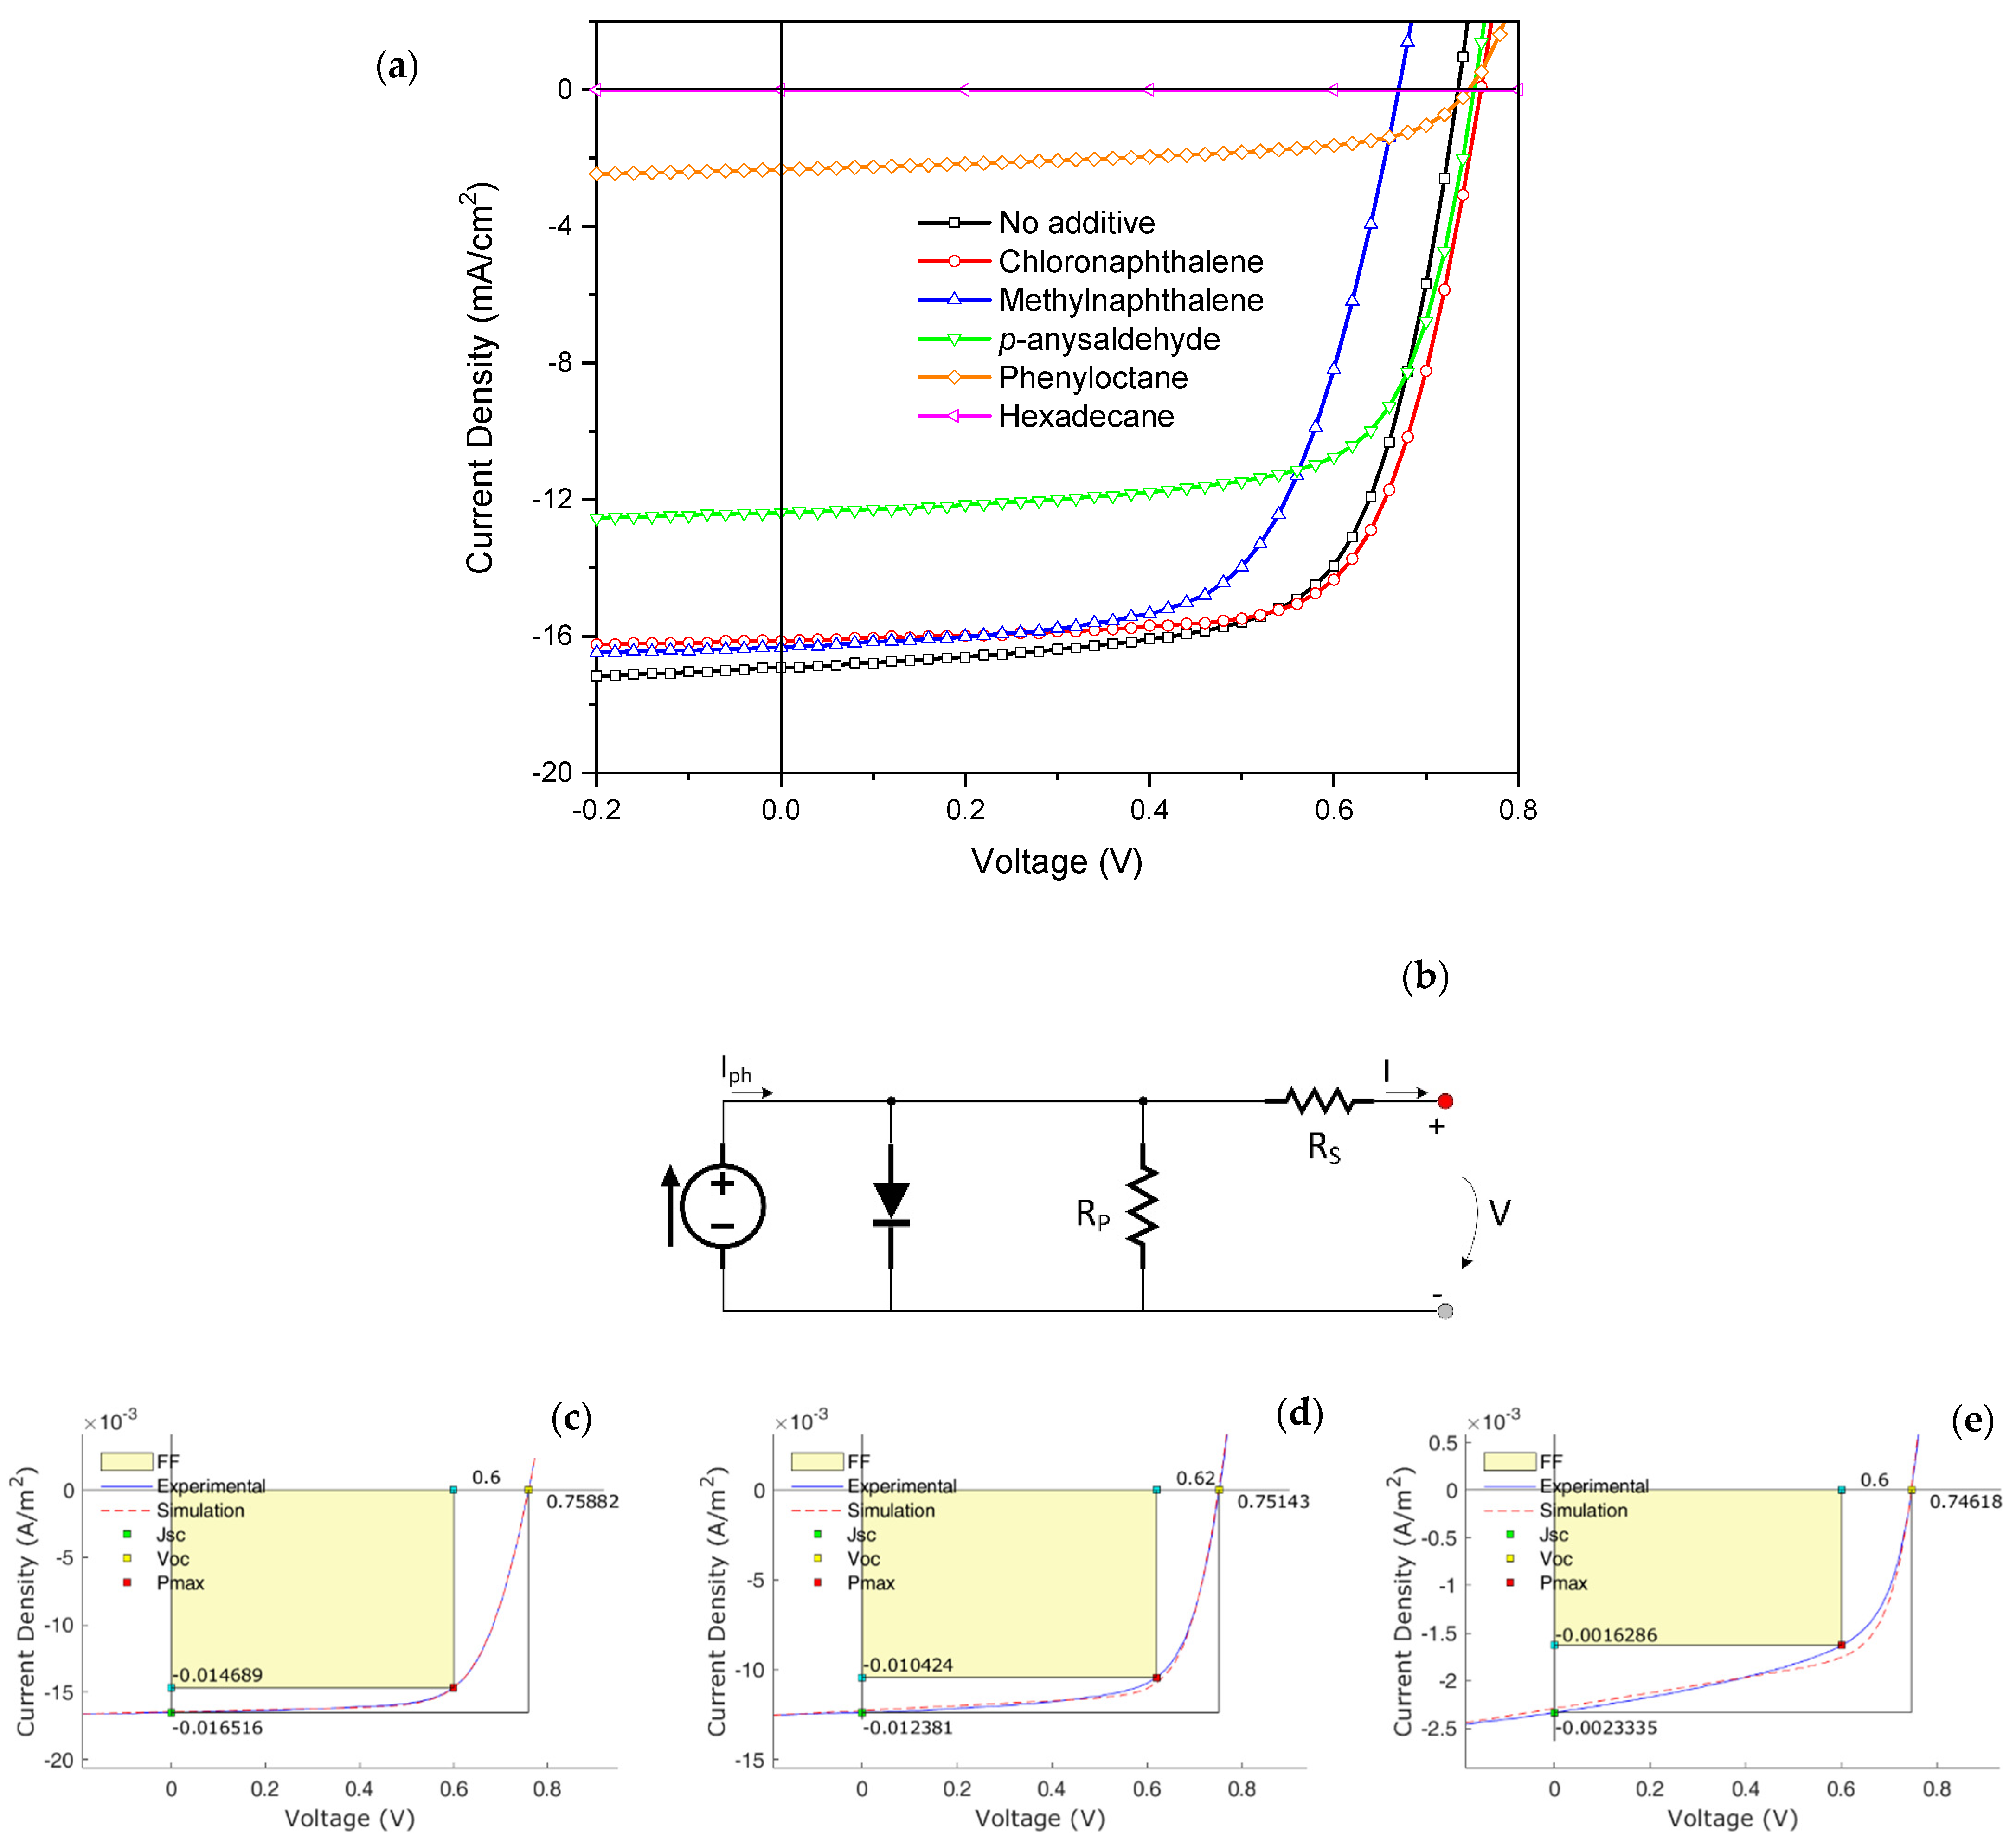
| PffBT4T-2OD/PC71BM | PCE (%) | VOC (V) | FF (%) | Jsc (mA/cm2) | Simulation | ||
|---|---|---|---|---|---|---|---|
| Jph (mA/cm2) | Rs (Ω) | Rp (Ω) | |||||
| No additive | 8.40 (7.96 ± 0.39) | 0.73 (0.73 ± 8.86 × 10⁻⁵) | 69.4 (69.0 ± 2.27) | − 14.50 (−13.71 ± 1.16) | 17.41 | 159 | 3.78 × 10⁴ |
| 1-Chloronaphthalene | 8.75 (8.44 ± 0.25) | 0.76 (0.75 ± 0.008) | 70.2 (69.0 ± 1.13) | − 15.09 (−14.15 ± 0.56) | 16.50 | 177 | 7.65 × 10⁴ |
| Methylnaphthalene | 6.98 (6.63 ± 0.19) | 0.67 (0.67 ± 0.004) | 66.7 (65.8 ± 1.11) | − 13.97 (−13.09 ± 0.50) | 16.74 | 217 | 5.00 × 10⁴ |
| p-Anisaldehyde | 6.46 (5.89 ± 0.53) | 0.77 (0.76 ± 0.007) | 69.4 (64.5 ± 4.36) | − 12.38 (−11.97 ± 0.37) | 12.31 | 146 | 4.83 × 10⁴ |
| 1-phenyloctane | 0.98 (0.55 ± 0.32) | 0.76 (0.75 ± 0.008) | 56.2 (45.2 ± 8.48) | − 1.63 (−0.98 ± 0.06) | 2.29 | 239 | 6.70 × 10⁴ |
| Hexadecane | 0 | - | - | - |
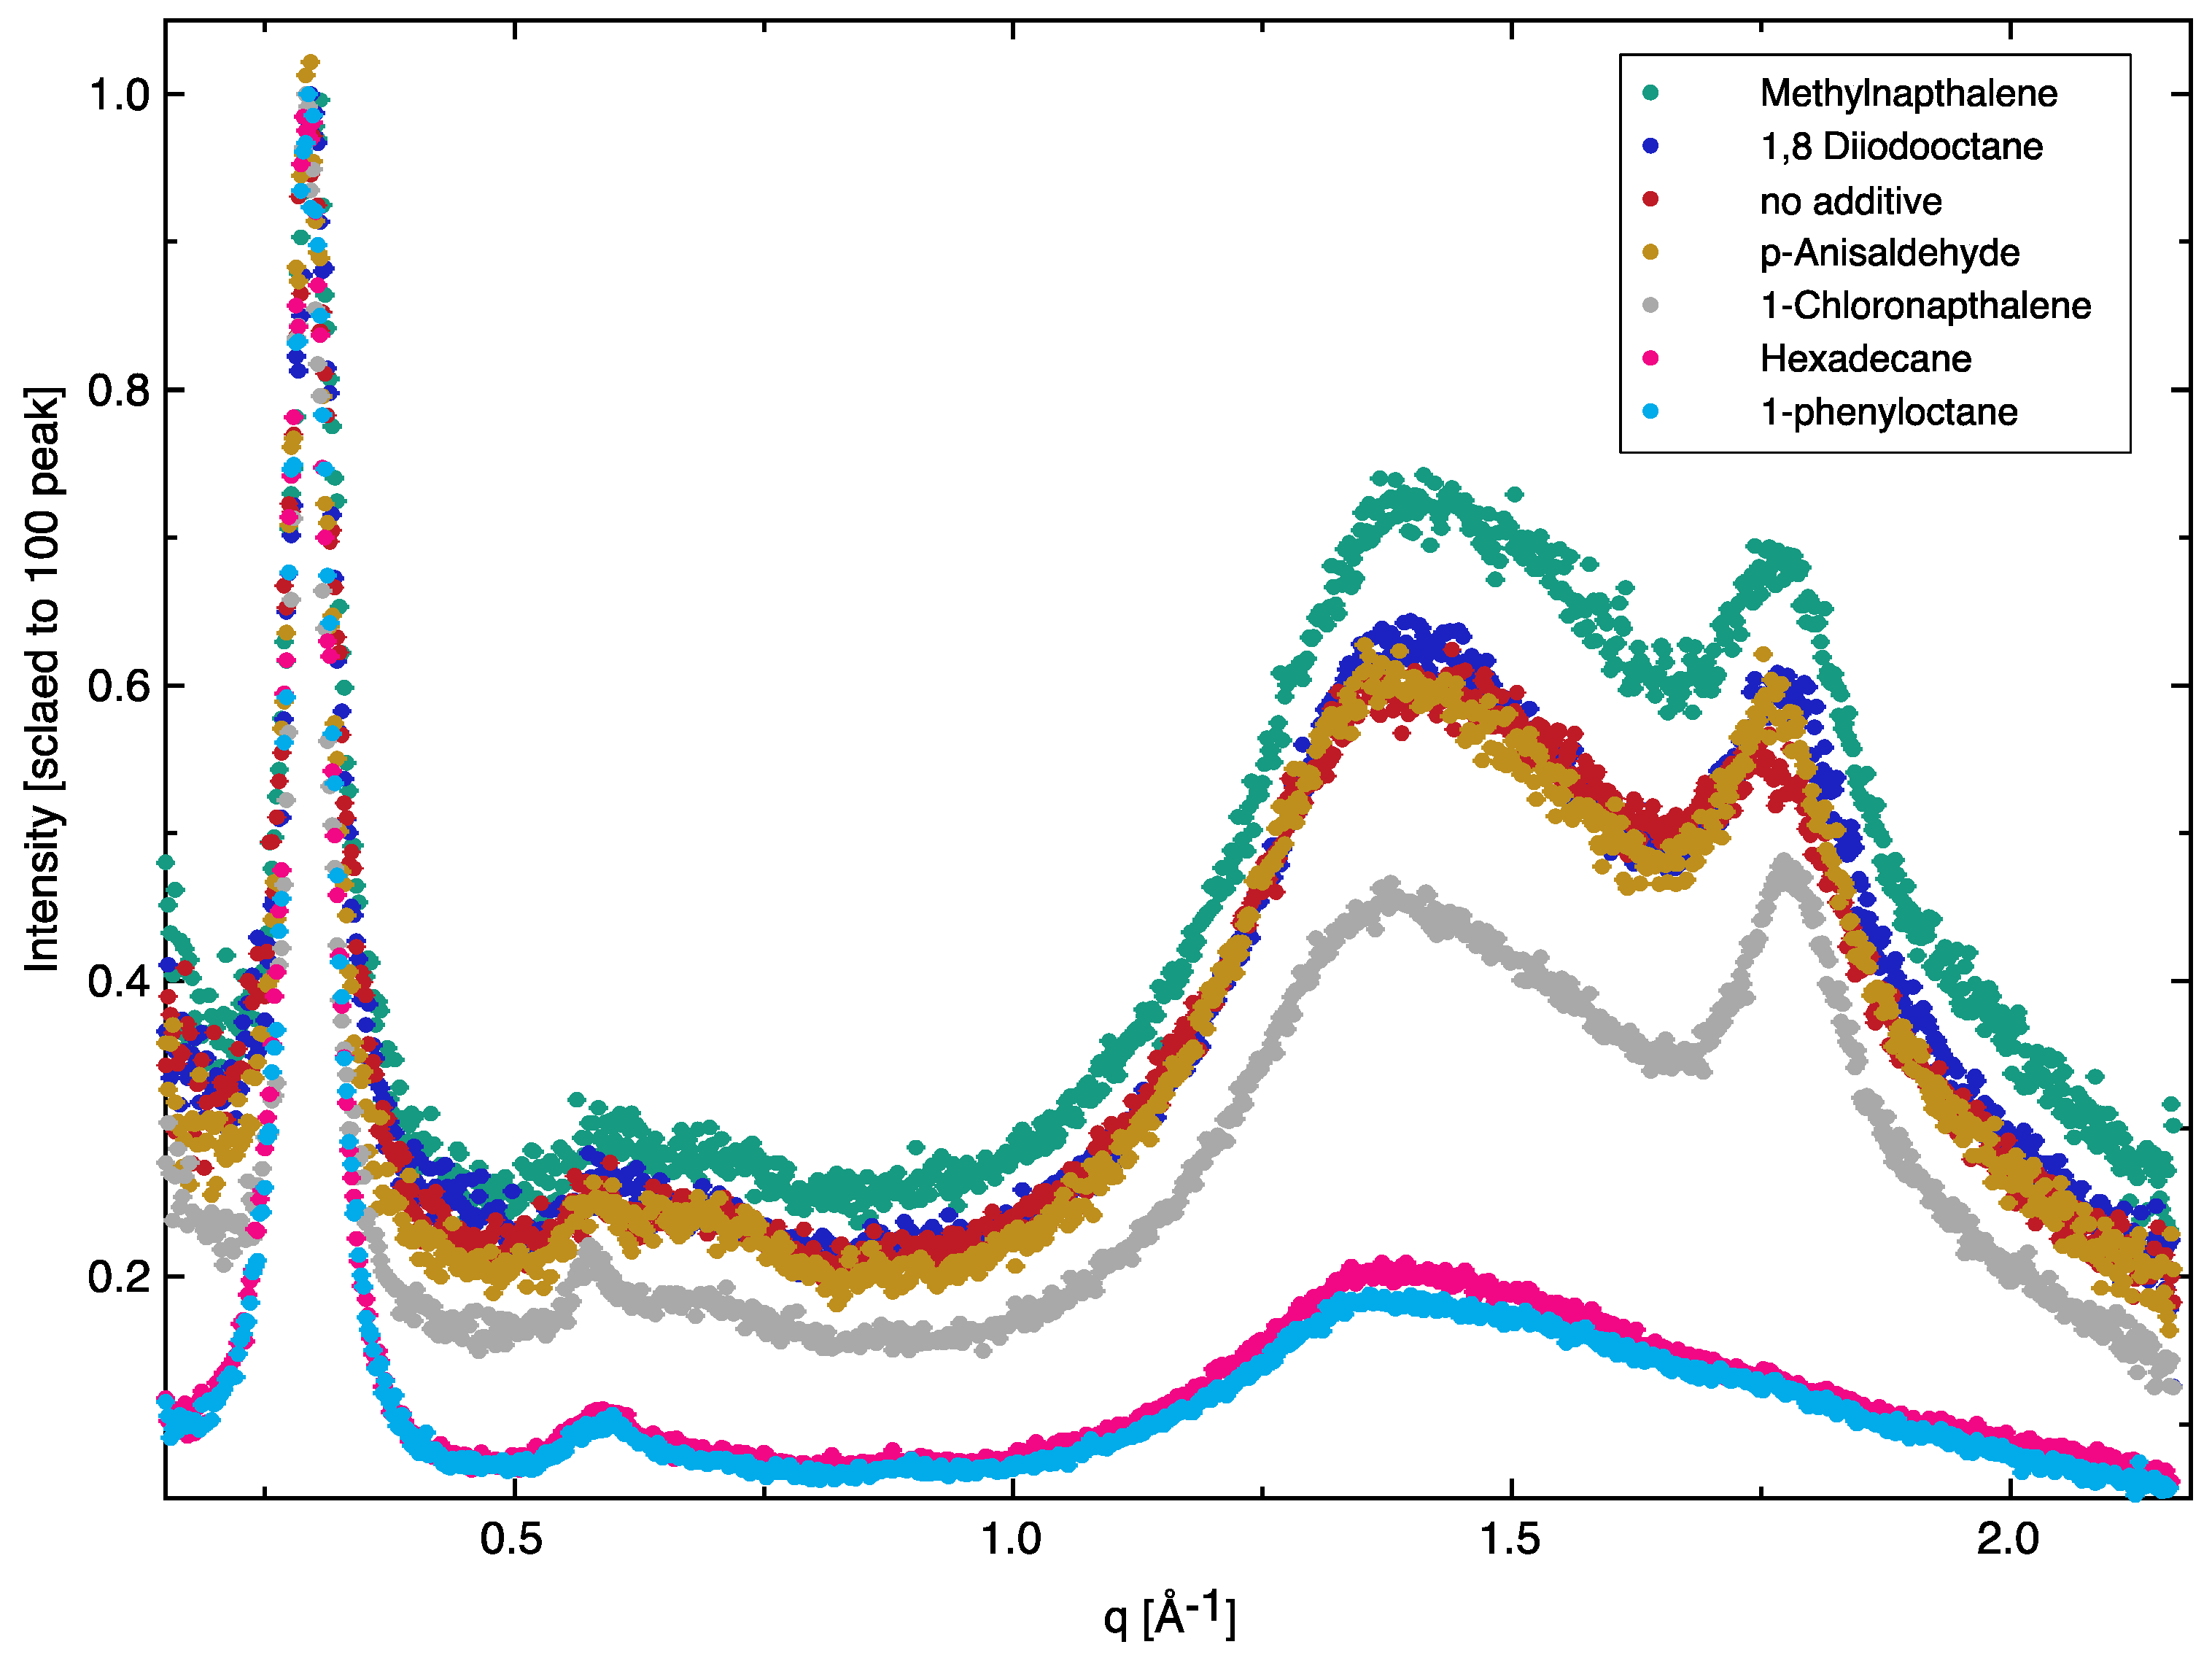
| Additive | (010) Peak Position (Å−1) | Full-Width at Half-Maximum (FWHM) | π-π Packing Distance (Å) |
|---|---|---|---|
| No additive | 1.766 ± 0.002 | 0.0870 ± 0.0079 | 3.56 |
| 1-Chloronaphthalene | 1.781 ± 0.001 | 0.0588 ± 0.0013 | 3.53 |
| Methylnaphthalene | 1.779 ± 0.001 | 0.0729 ± 0.0030 | 3.53 |
| p-Anisaldehyde | 1.768 ± 0.001 | 0.0690 ± 0.0035 | 3.56 |
| 1-phenyloctane | ― | ― | ― |
| Hexadecane | ― | ― | ― |
| Additive | Scaling Factor CDB | L (nm) | (χ2/Npts) |
|---|---|---|---|
| No additive | 1.4008 × 10⁻⁶ | 9.4 ± 0.1 | 1.94 |
| Chloronaphthalene | 1.993 × 10⁻⁶ | 11.1 ± 0.1 | 1.07 |
| Hexadecane | 0.5134 × 10⁻⁶ | 31.2 ± 2.4 | 0.67 |
Publisher’s Note: MDPI stays neutral with regard to jurisdictional claims in published maps and institutional affiliations. |
© 2021 by the authors. Licensee MDPI, Basel, Switzerland. This article is an open access article distributed under the terms and conditions of the Creative Commons Attribution (CC BY) license (https://creativecommons.org/licenses/by/4.0/).
Share and Cite
Gaspar, H.; Parnell, A.J.; Pérez, G.E.; Viana, J.C.; King, S.M.; Mendes, A.; Pereira, L.; Bernardo, G. Graded Morphologies and the Performance of PffBT4T-2OD:PC71BM Devices Using Additive Choice. Nanomaterials 2021, 11, 3367. https://doi.org/10.3390/nano11123367
Gaspar H, Parnell AJ, Pérez GE, Viana JC, King SM, Mendes A, Pereira L, Bernardo G. Graded Morphologies and the Performance of PffBT4T-2OD:PC71BM Devices Using Additive Choice. Nanomaterials. 2021; 11(12):3367. https://doi.org/10.3390/nano11123367
Chicago/Turabian StyleGaspar, Hugo, Andrew J. Parnell, Gabriel E. Pérez, Júlio C. Viana, Stephen M. King, Adélio Mendes, Luiz Pereira, and Gabriel Bernardo. 2021. "Graded Morphologies and the Performance of PffBT4T-2OD:PC71BM Devices Using Additive Choice" Nanomaterials 11, no. 12: 3367. https://doi.org/10.3390/nano11123367