Author Contributions
Conceptualization, methodology, software analysis of data, validation, formal analysis, data curation, writing—original draft preparation, writing—review and editing, U.R.; software analysis of cytotoxicity data, formal analysis of cytotoxicity, writing—original draft preparation on cytotoxicity and editing, K.B.; resources, investigation, funding acquisition, G.P.; resources, investigation, reviewing the manuscript, M.J.M.; resources, investigation, reviewing the manuscript, S.F.; resources, investigation, project administration and leaderership, rectifying the manuscript, reviewing the manuscripts, supervision, funding acquisition, M.Z.H. All authors have read and agreed to the published version of the manuscript.
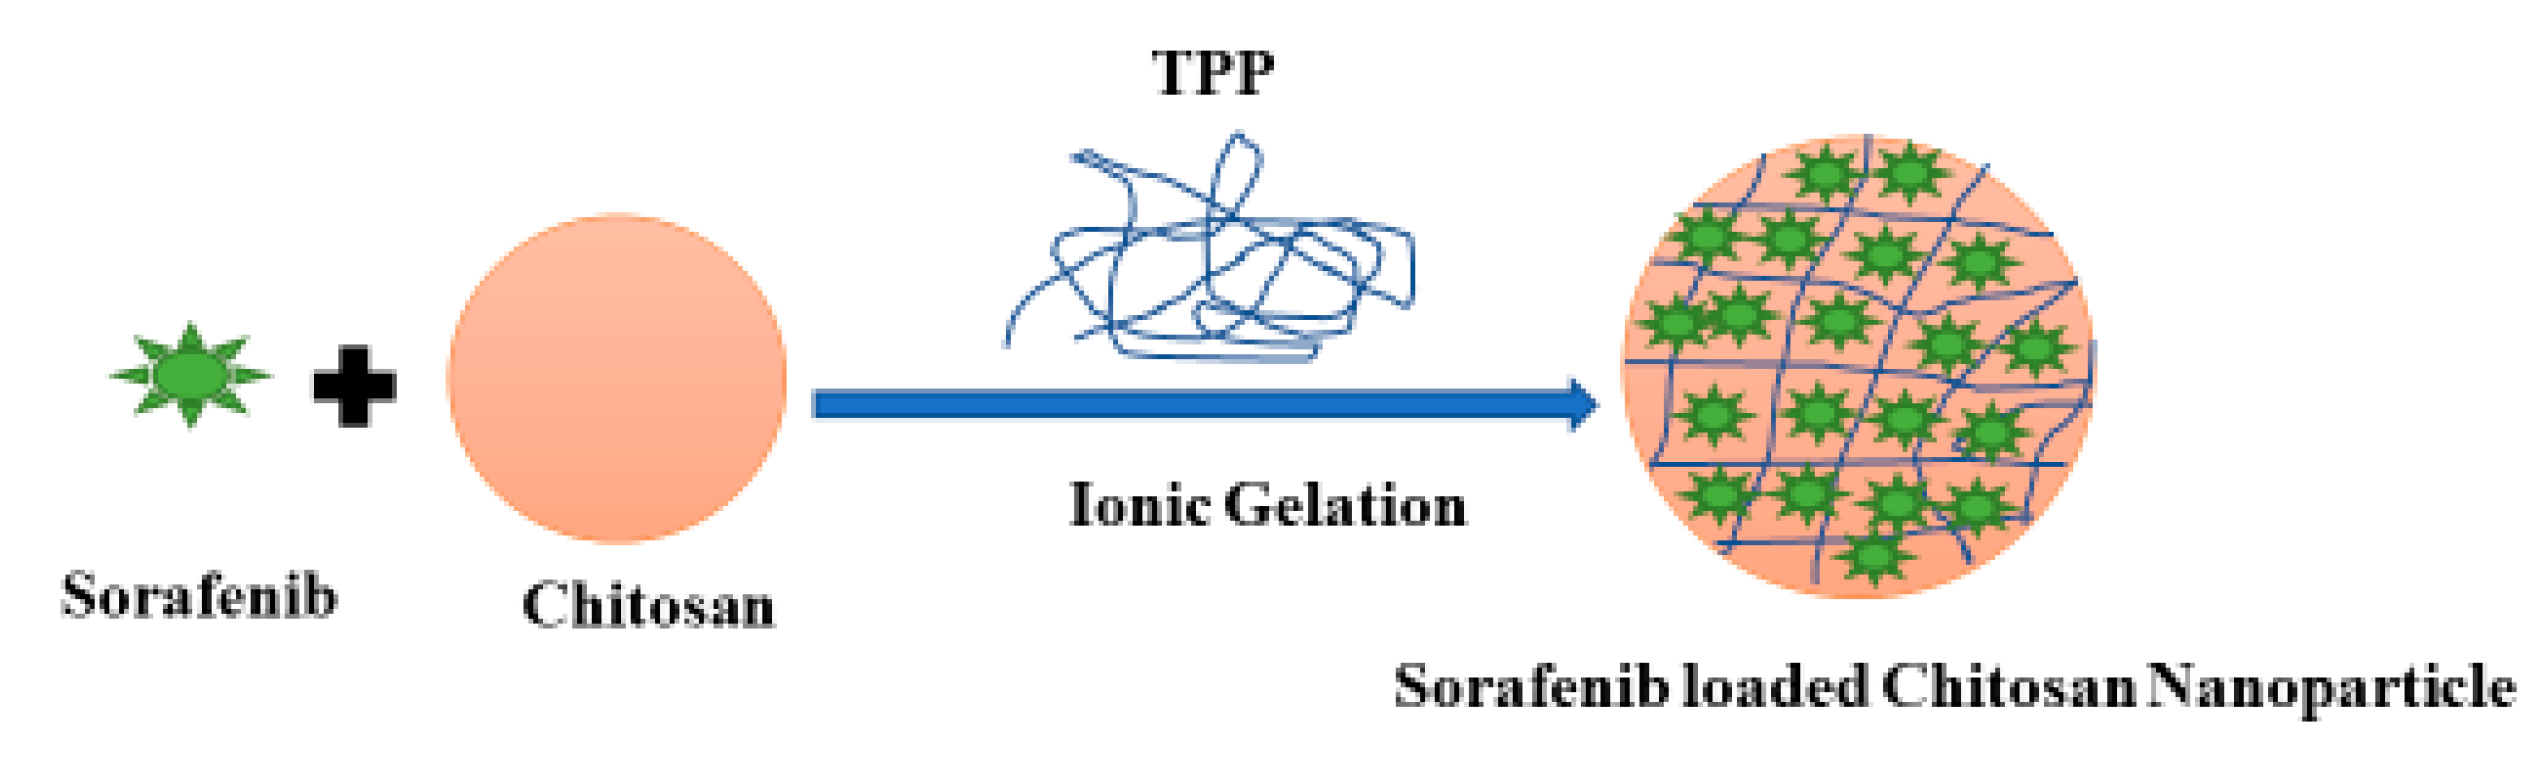
Figure 1.
Schematic diagram of the synthesis steps of Sorafenib-loaded chitosan nanoparticles.
Figure 1.
Schematic diagram of the synthesis steps of Sorafenib-loaded chitosan nanoparticles.
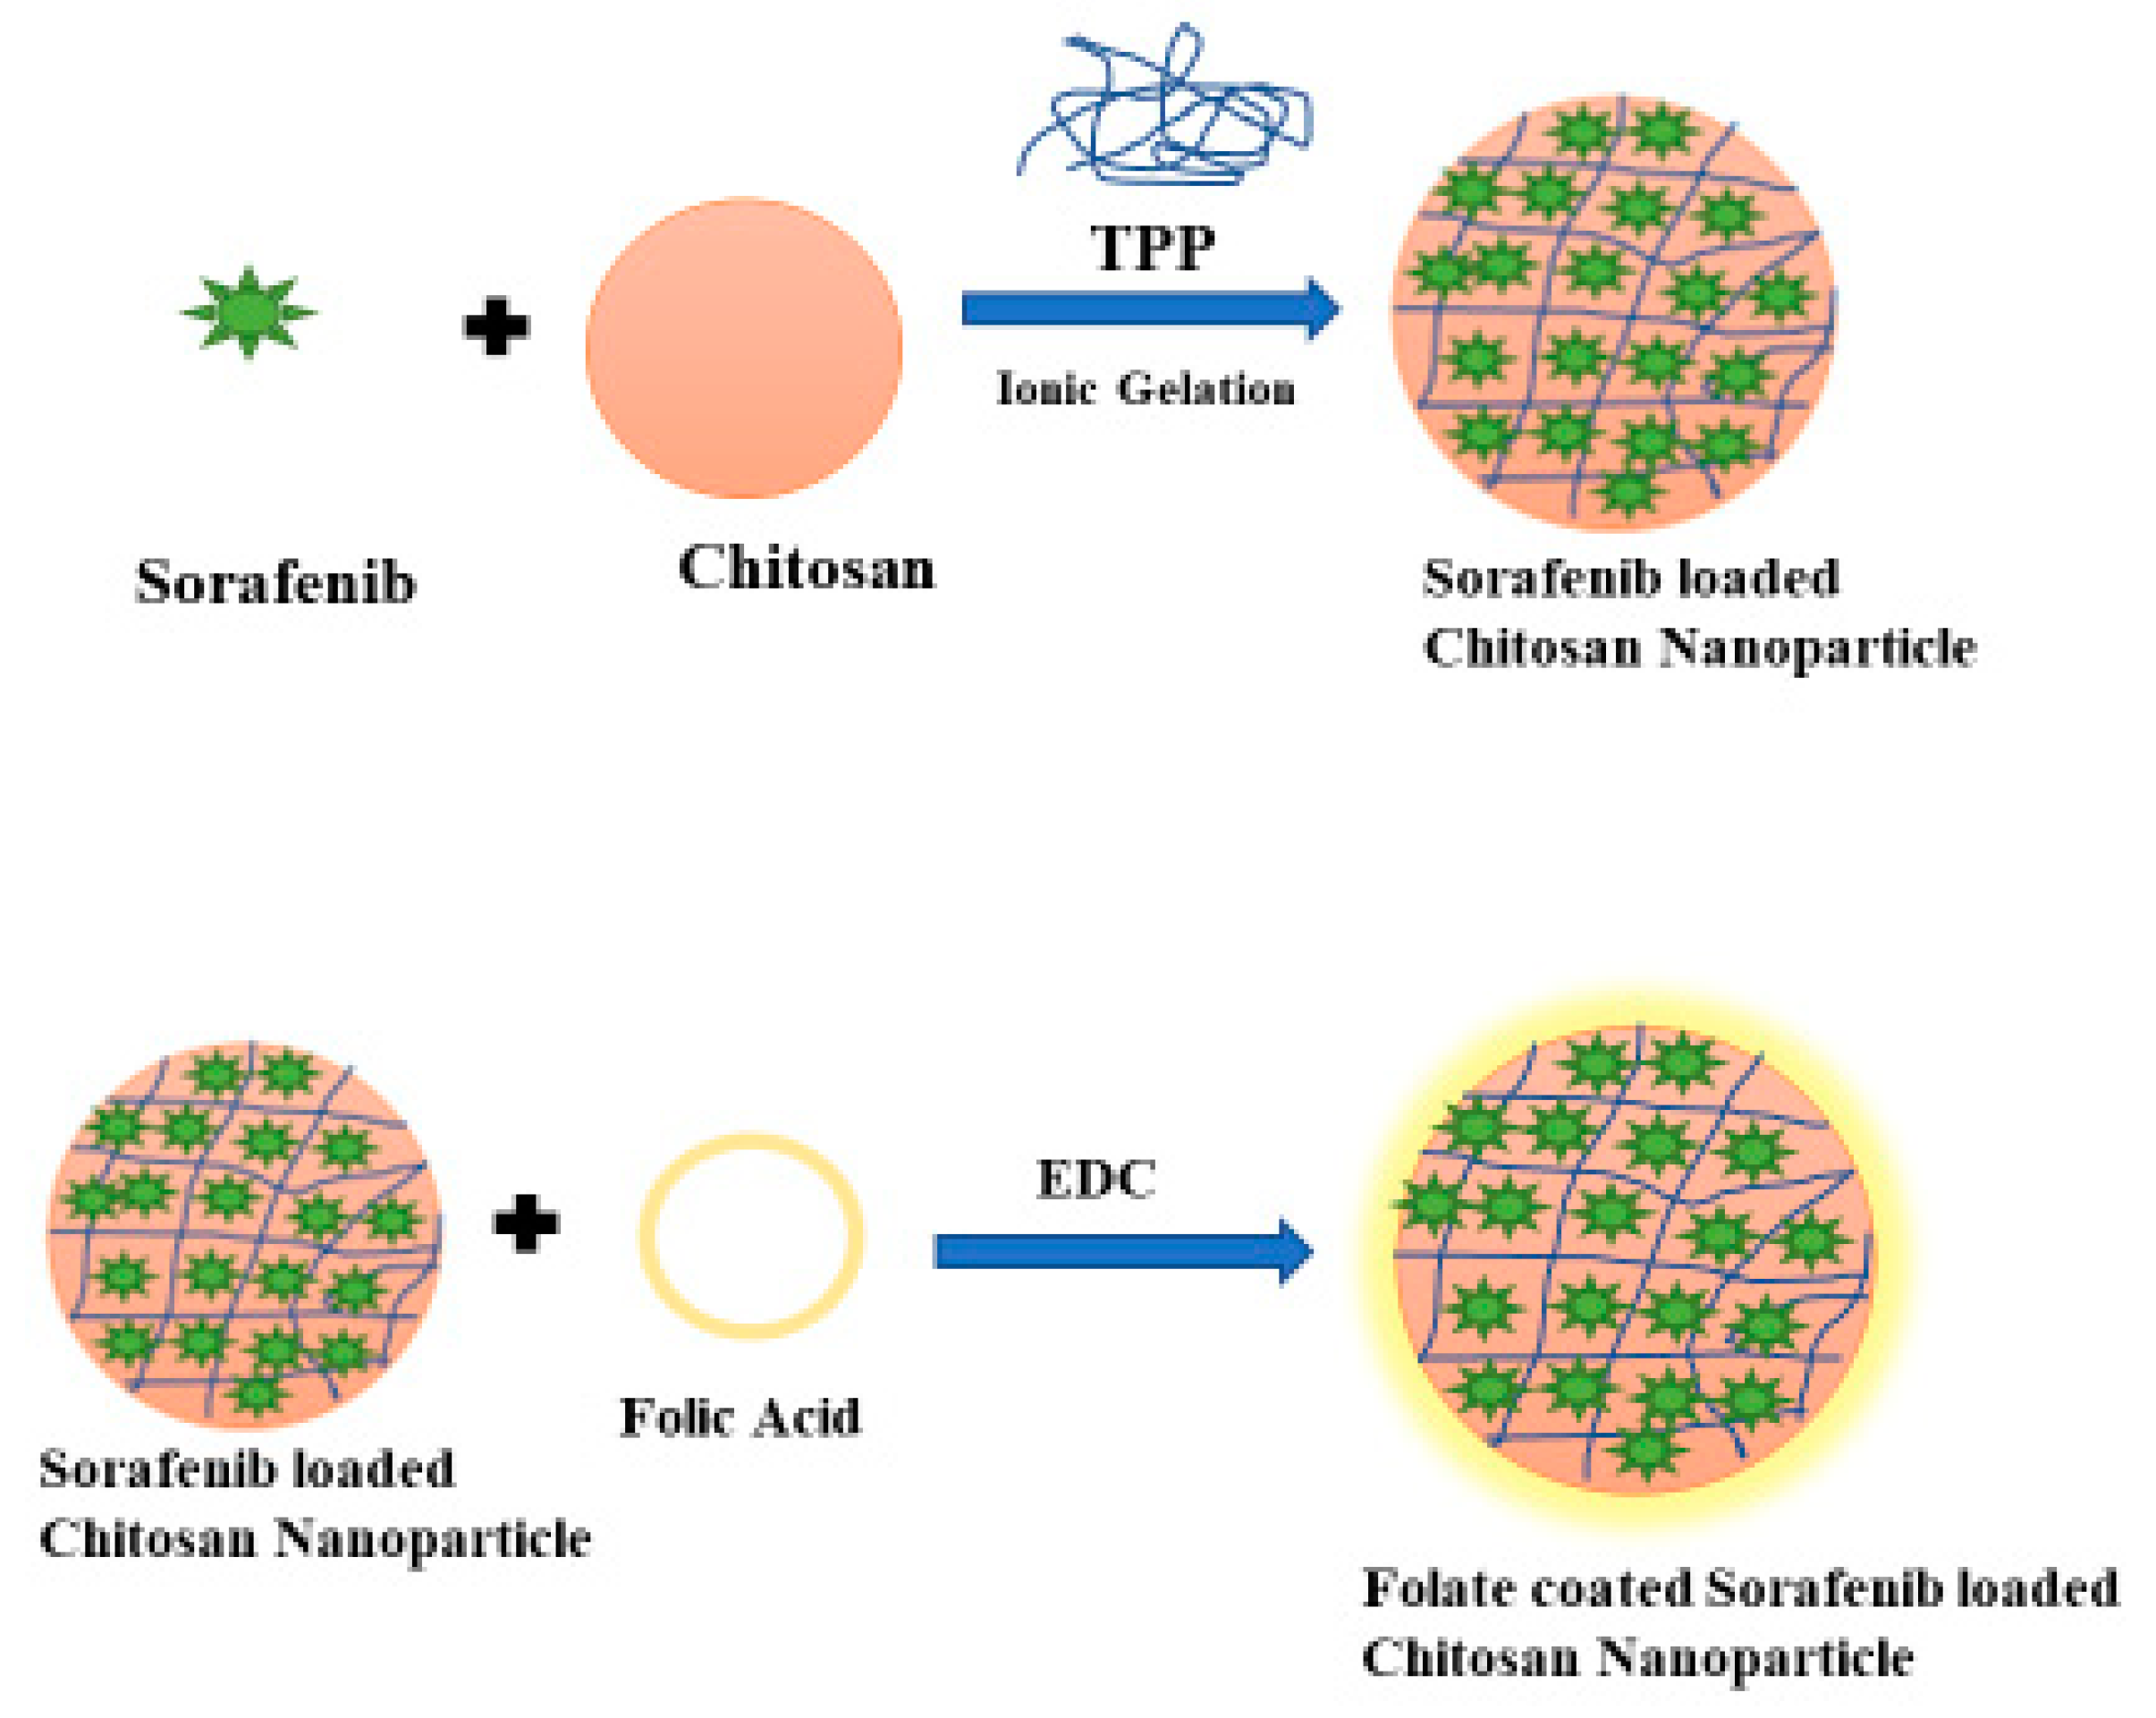
Figure 2.
Schematic diagram of the synthesis steps of folic acid-conjugated chitosan Sorafenib nanoparticles.
Figure 2.
Schematic diagram of the synthesis steps of folic acid-conjugated chitosan Sorafenib nanoparticles.
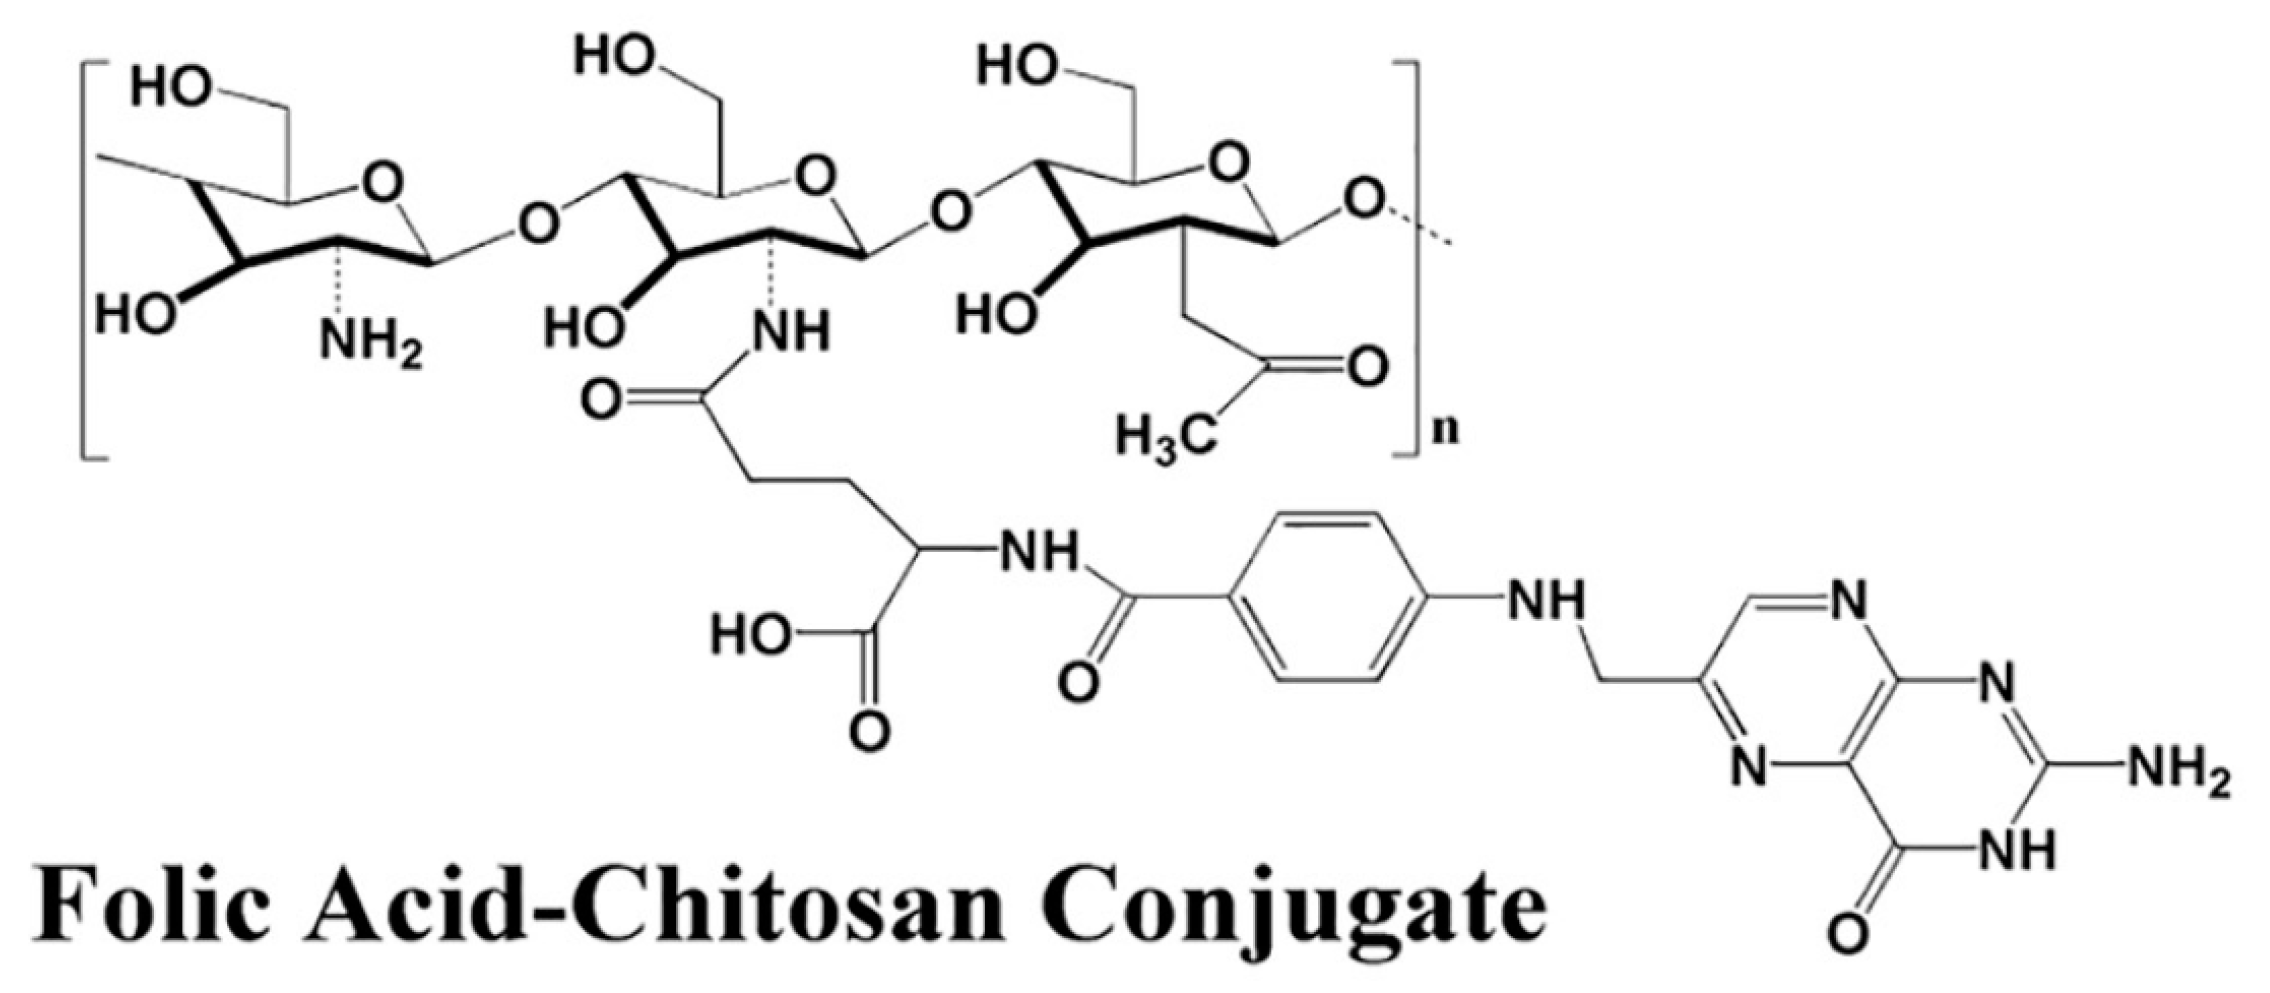
Figure 3.
Formation of chitosan-folic acid conjugation through the amine group of chitosan and OH group of FA.
Figure 3.
Formation of chitosan-folic acid conjugation through the amine group of chitosan and OH group of FA.
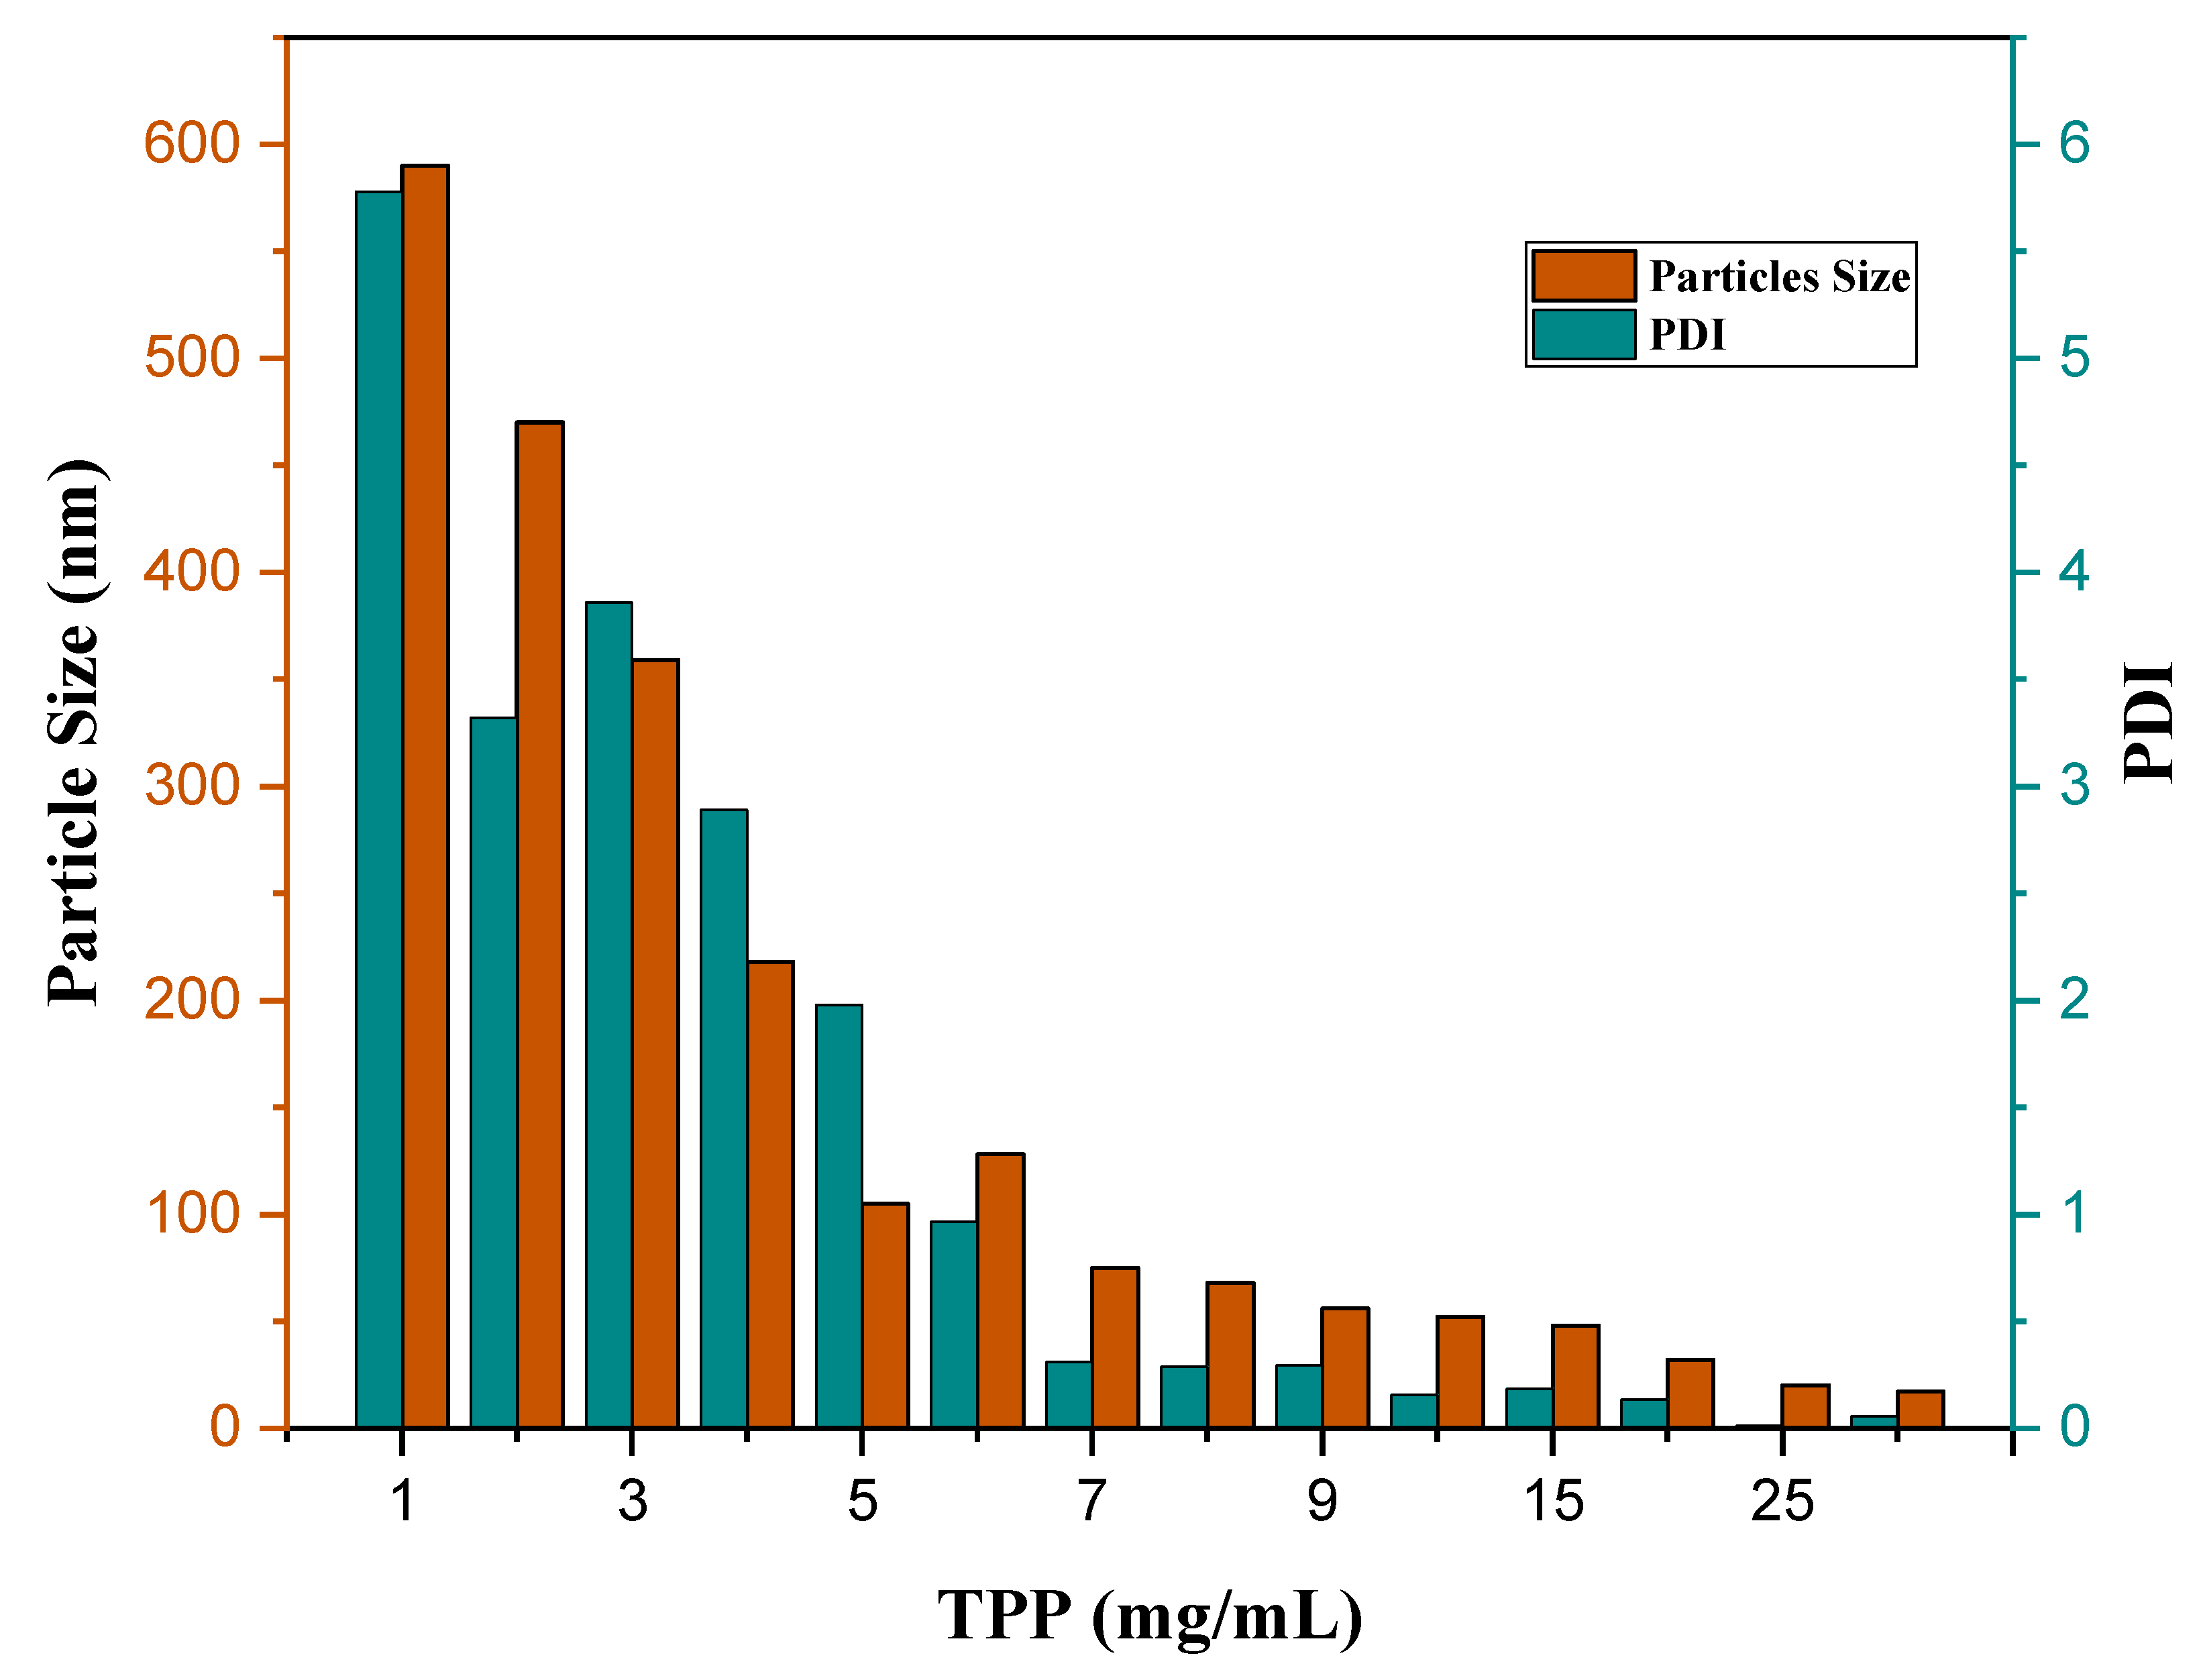
Figure 4.
The effect of TPP (mg/mL) on particle size (nm) and PDI index of SF-CS NPs.
Figure 4.
The effect of TPP (mg/mL) on particle size (nm) and PDI index of SF-CS NPs.
Figure 5.
Particles size distribution by the intensity and cumulation of (a) sorafenib-loaded chitosan nanoparticles (SF-CS) and (b) folate-conjugated sorafenib-loaded chitosan nanoparticles (SF-CS-FA).
Figure 5.
Particles size distribution by the intensity and cumulation of (a) sorafenib-loaded chitosan nanoparticles (SF-CS) and (b) folate-conjugated sorafenib-loaded chitosan nanoparticles (SF-CS-FA).
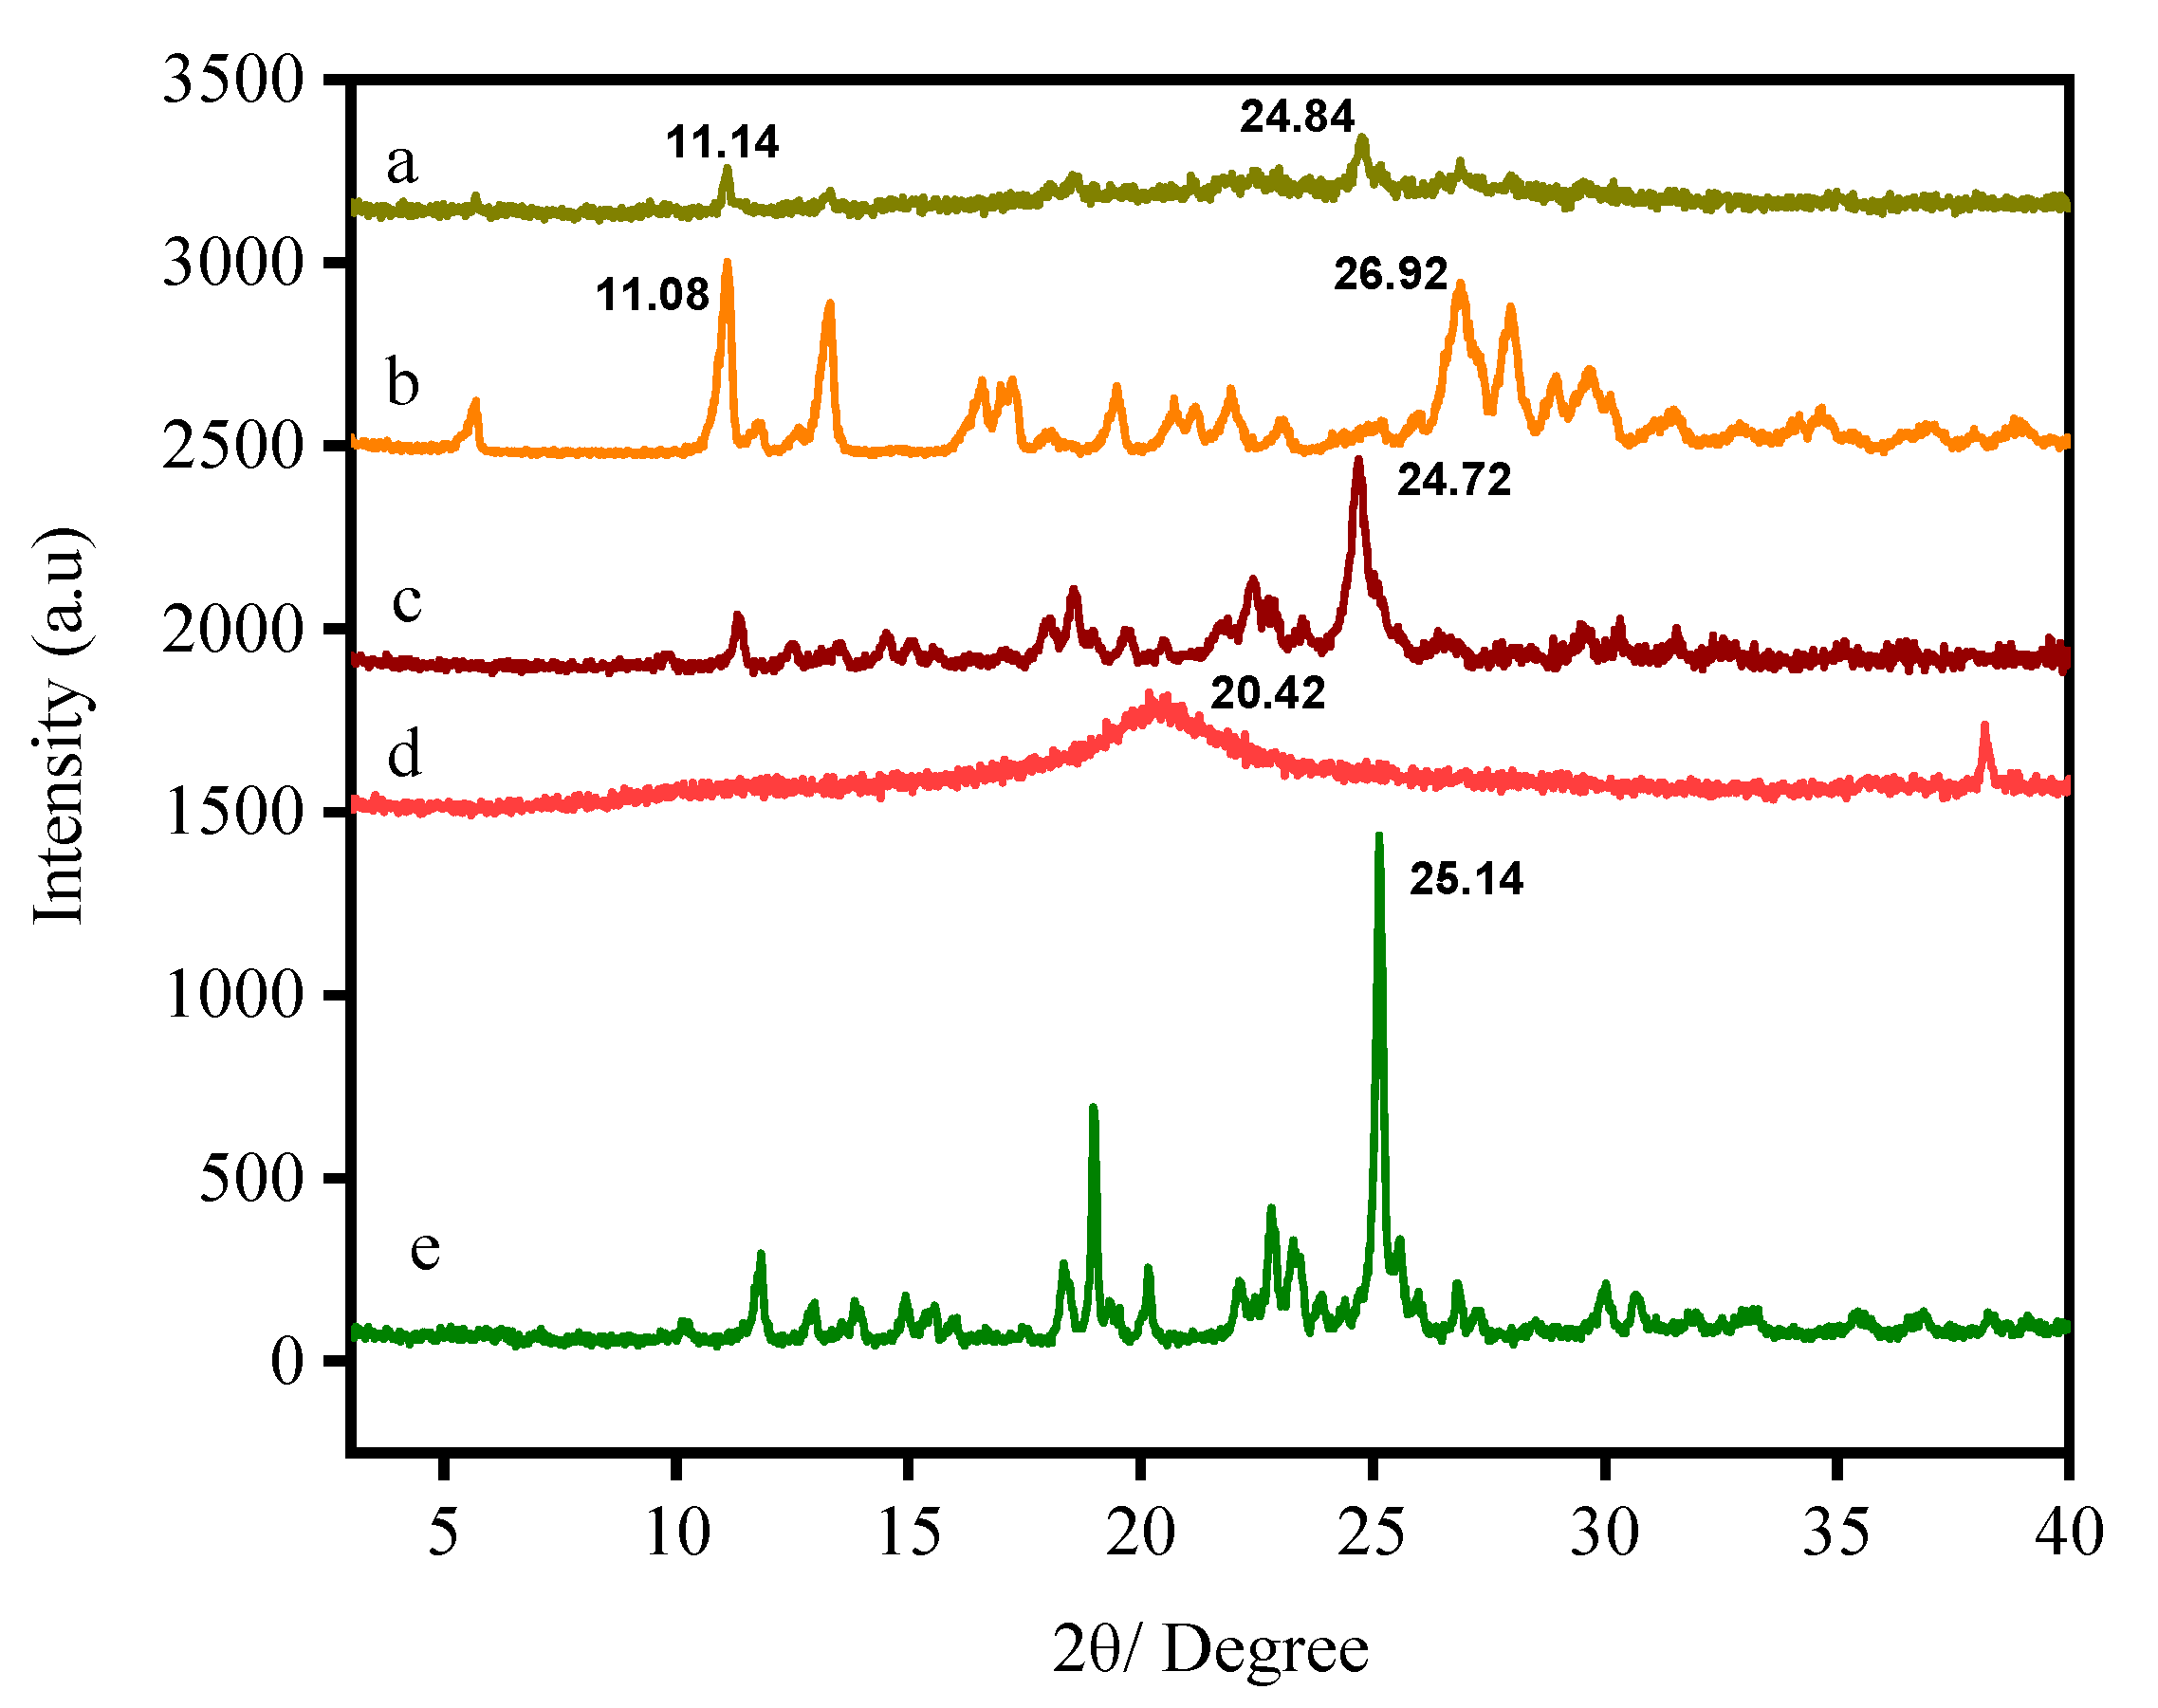
Figure 6.
XRD patterns of folic acid-coated chitosan-loaded sorafenib nanoparticles (a), folic acid (b), Sorafenib-loaded chitosan nanoparticles (c), chitosan nanoparticles (d), and the drug Sorafenib (e).
Figure 6.
XRD patterns of folic acid-coated chitosan-loaded sorafenib nanoparticles (a), folic acid (b), Sorafenib-loaded chitosan nanoparticles (c), chitosan nanoparticles (d), and the drug Sorafenib (e).
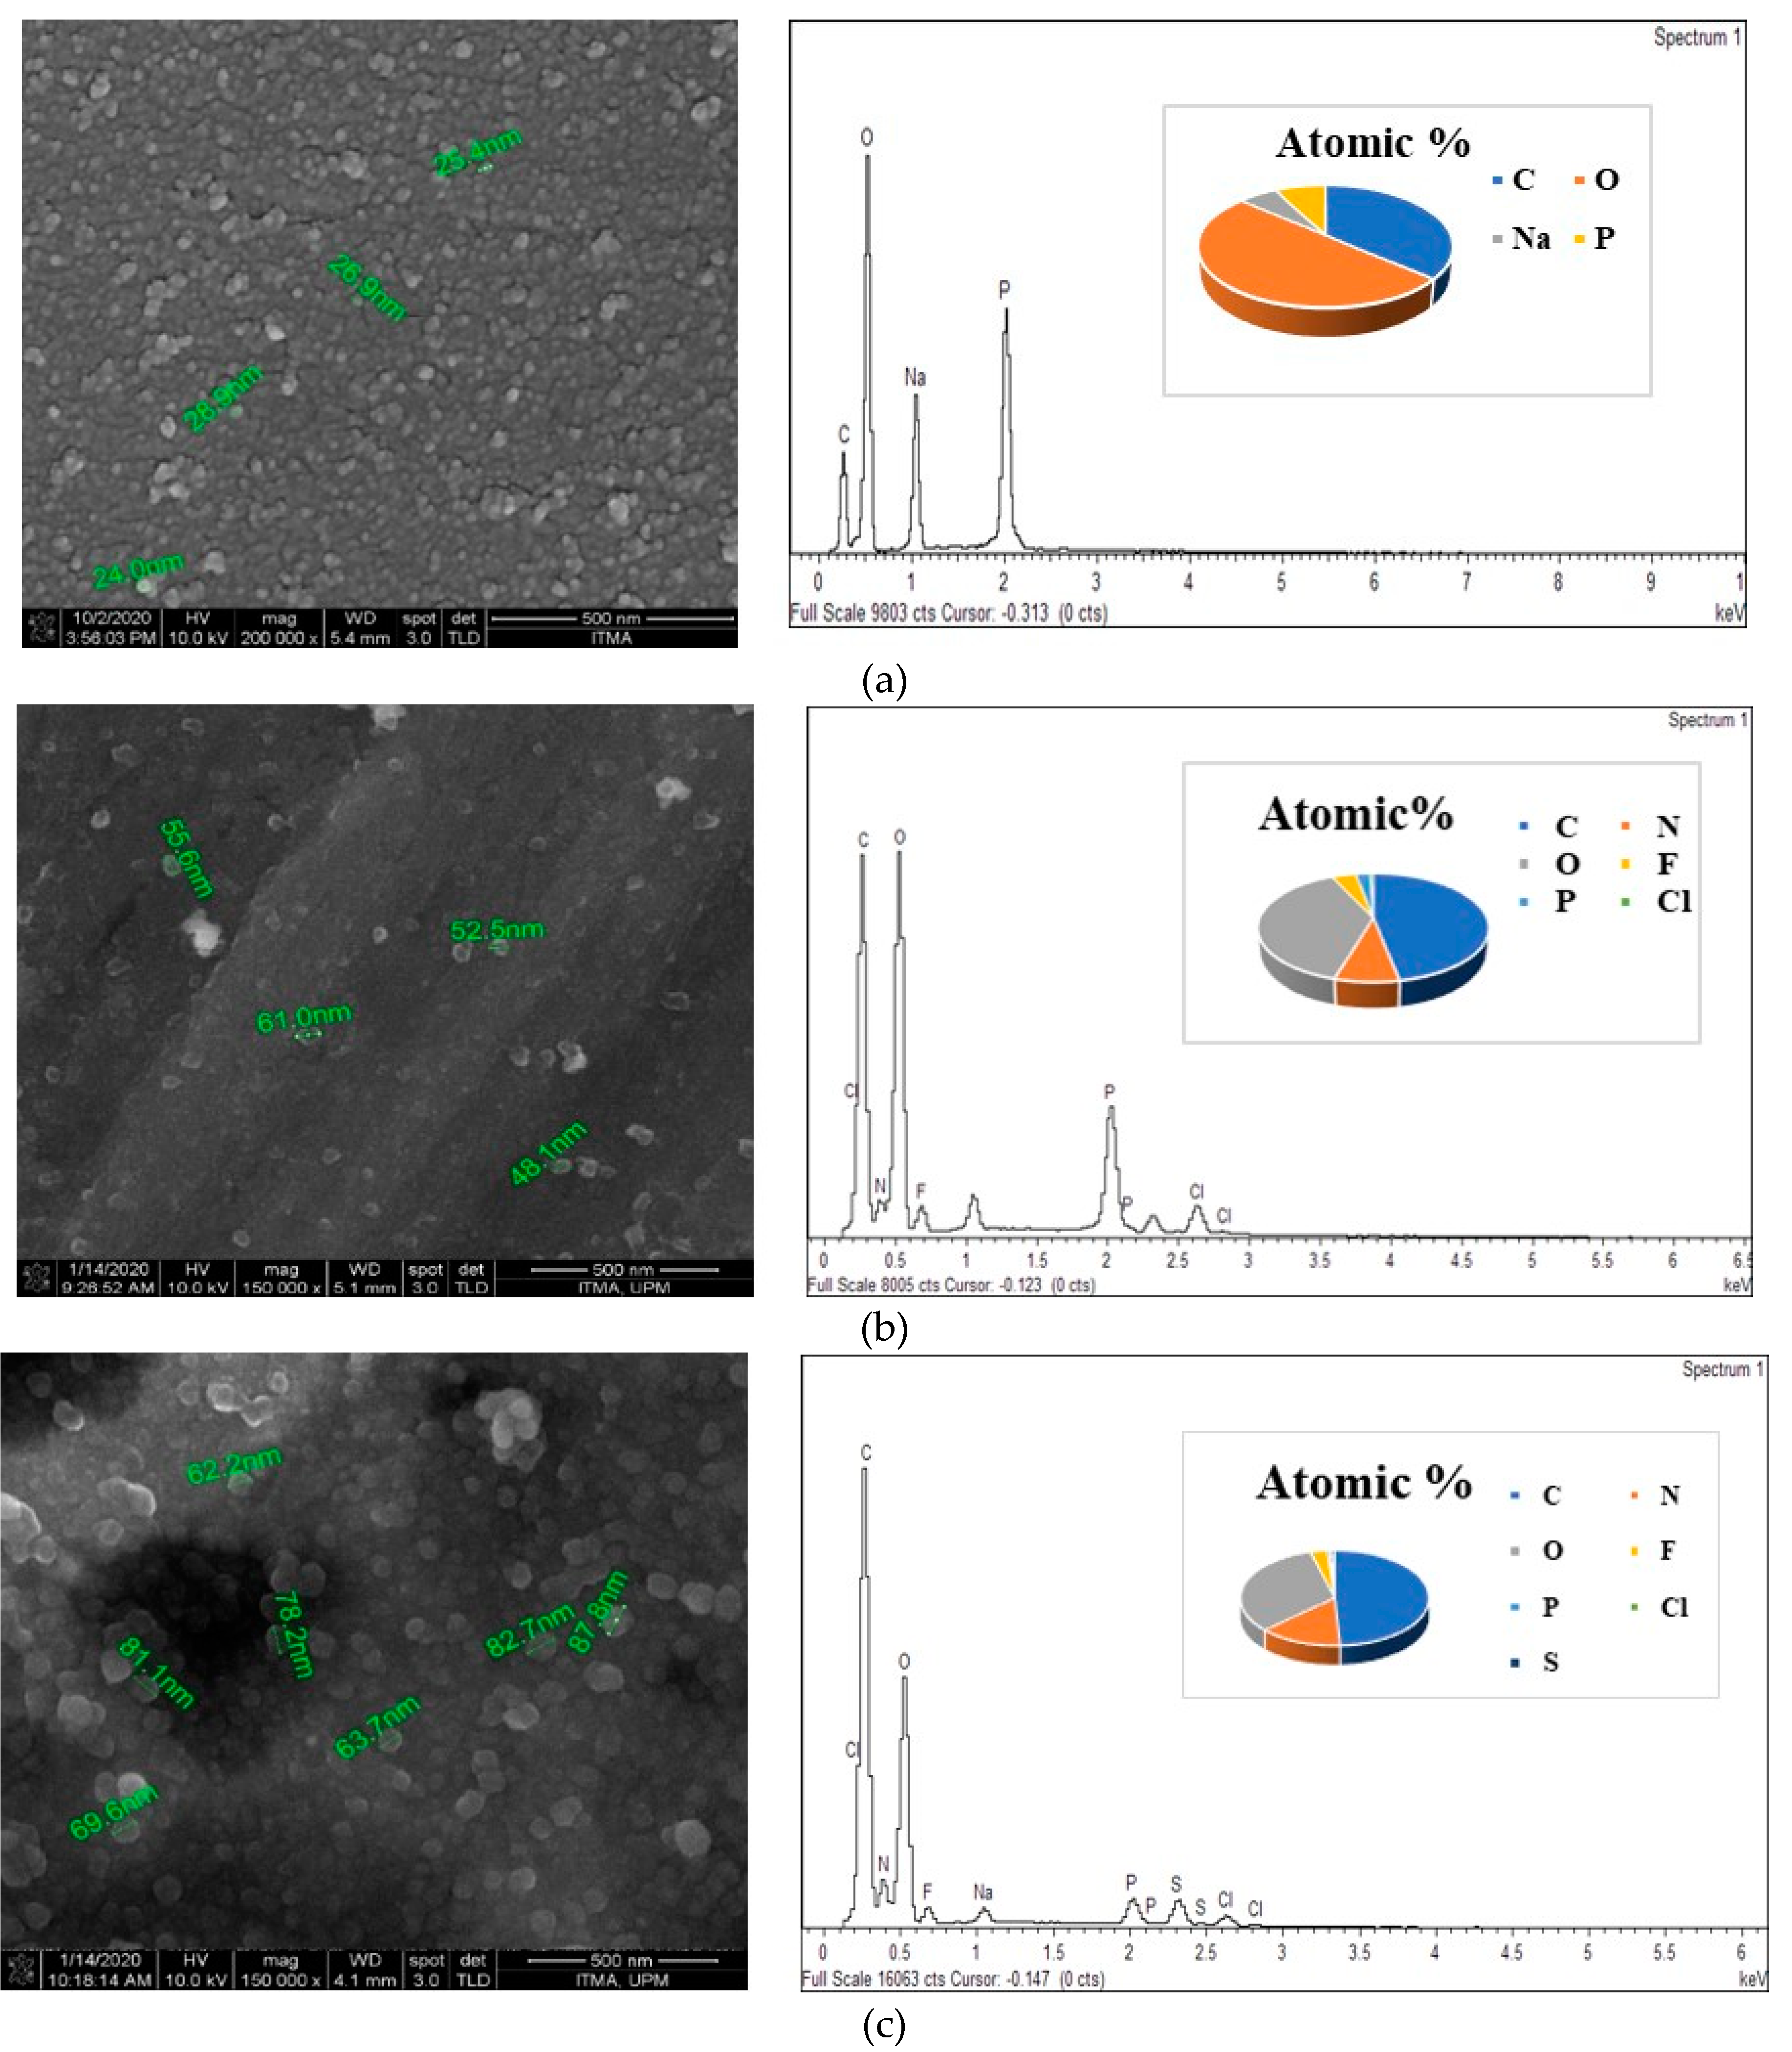
Figure 7.
FESEM images and EDX spectrum of (a) CS-NPs, (b) SF-CS nanoparticles, (c) SF-CS-FA nanoparticles.
Figure 7.
FESEM images and EDX spectrum of (a) CS-NPs, (b) SF-CS nanoparticles, (c) SF-CS-FA nanoparticles.
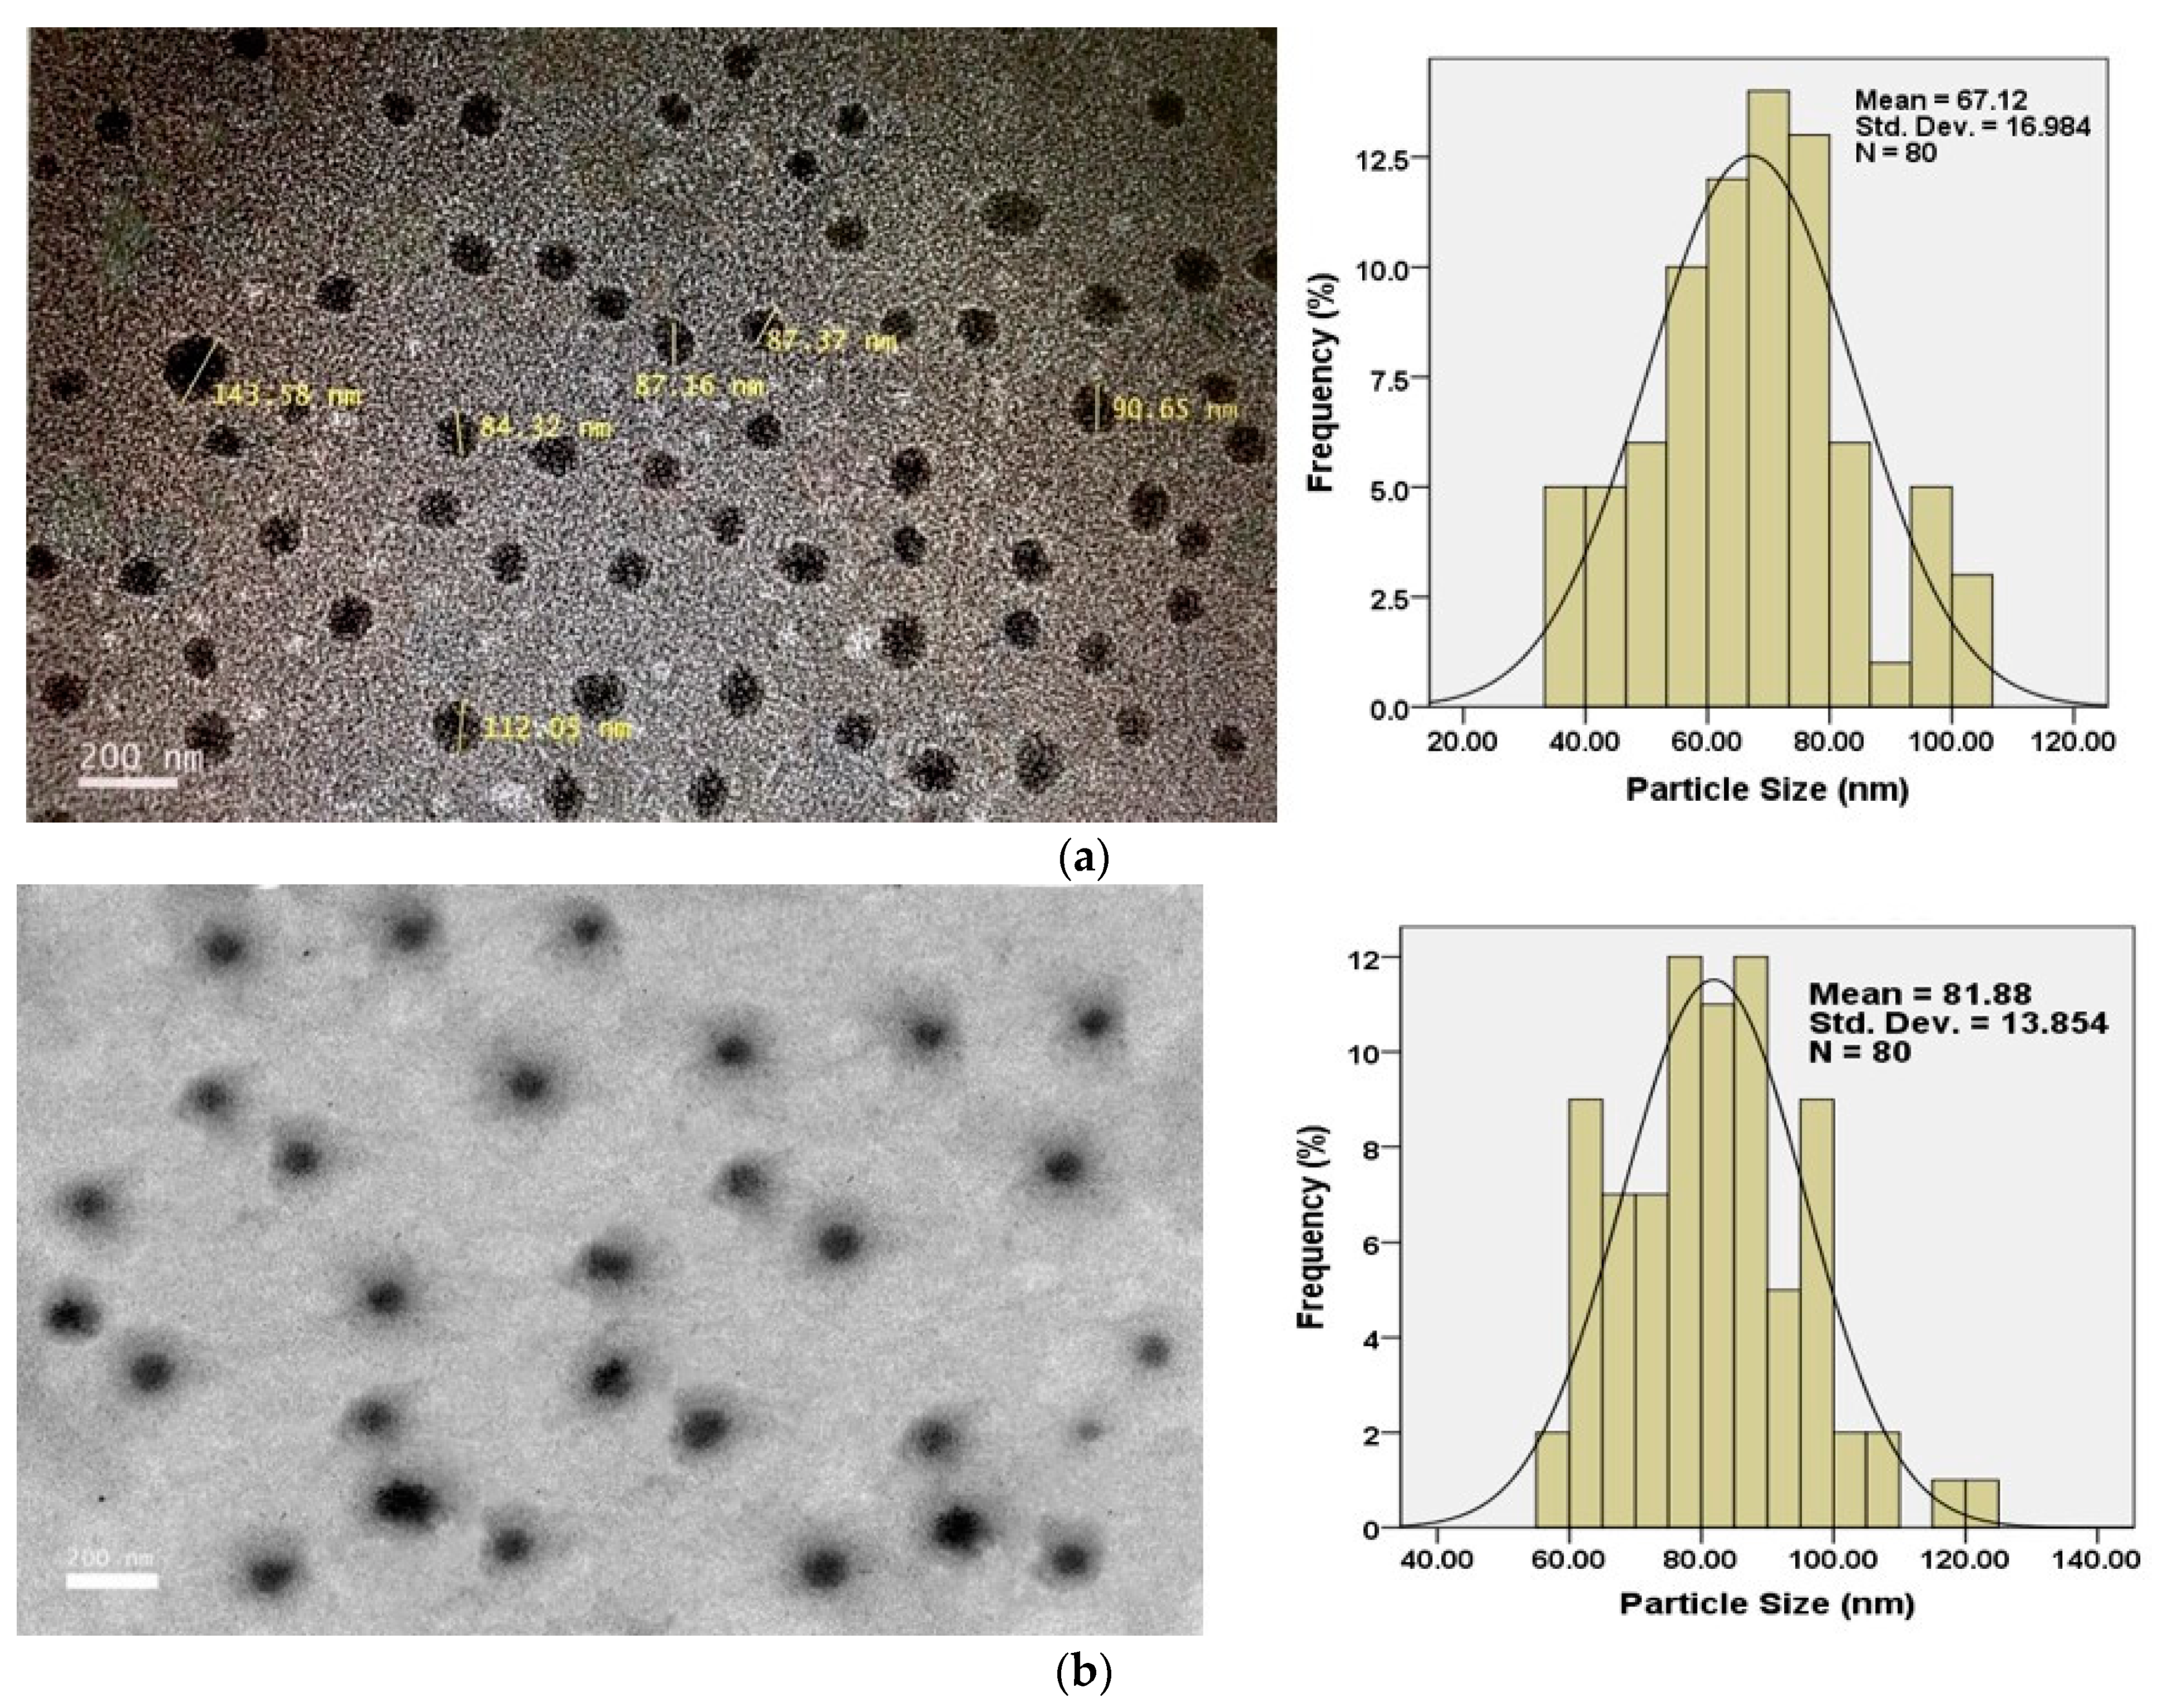
Figure 8.
HRTEM micrographs of (a) Sorafenib-loaded chitosan nanoparticles (SF-CS) and (b) folate-conjugated, Sorafenib-loaded chitosan nanoparticles (SF-CS-FA).
Figure 8.
HRTEM micrographs of (a) Sorafenib-loaded chitosan nanoparticles (SF-CS) and (b) folate-conjugated, Sorafenib-loaded chitosan nanoparticles (SF-CS-FA).
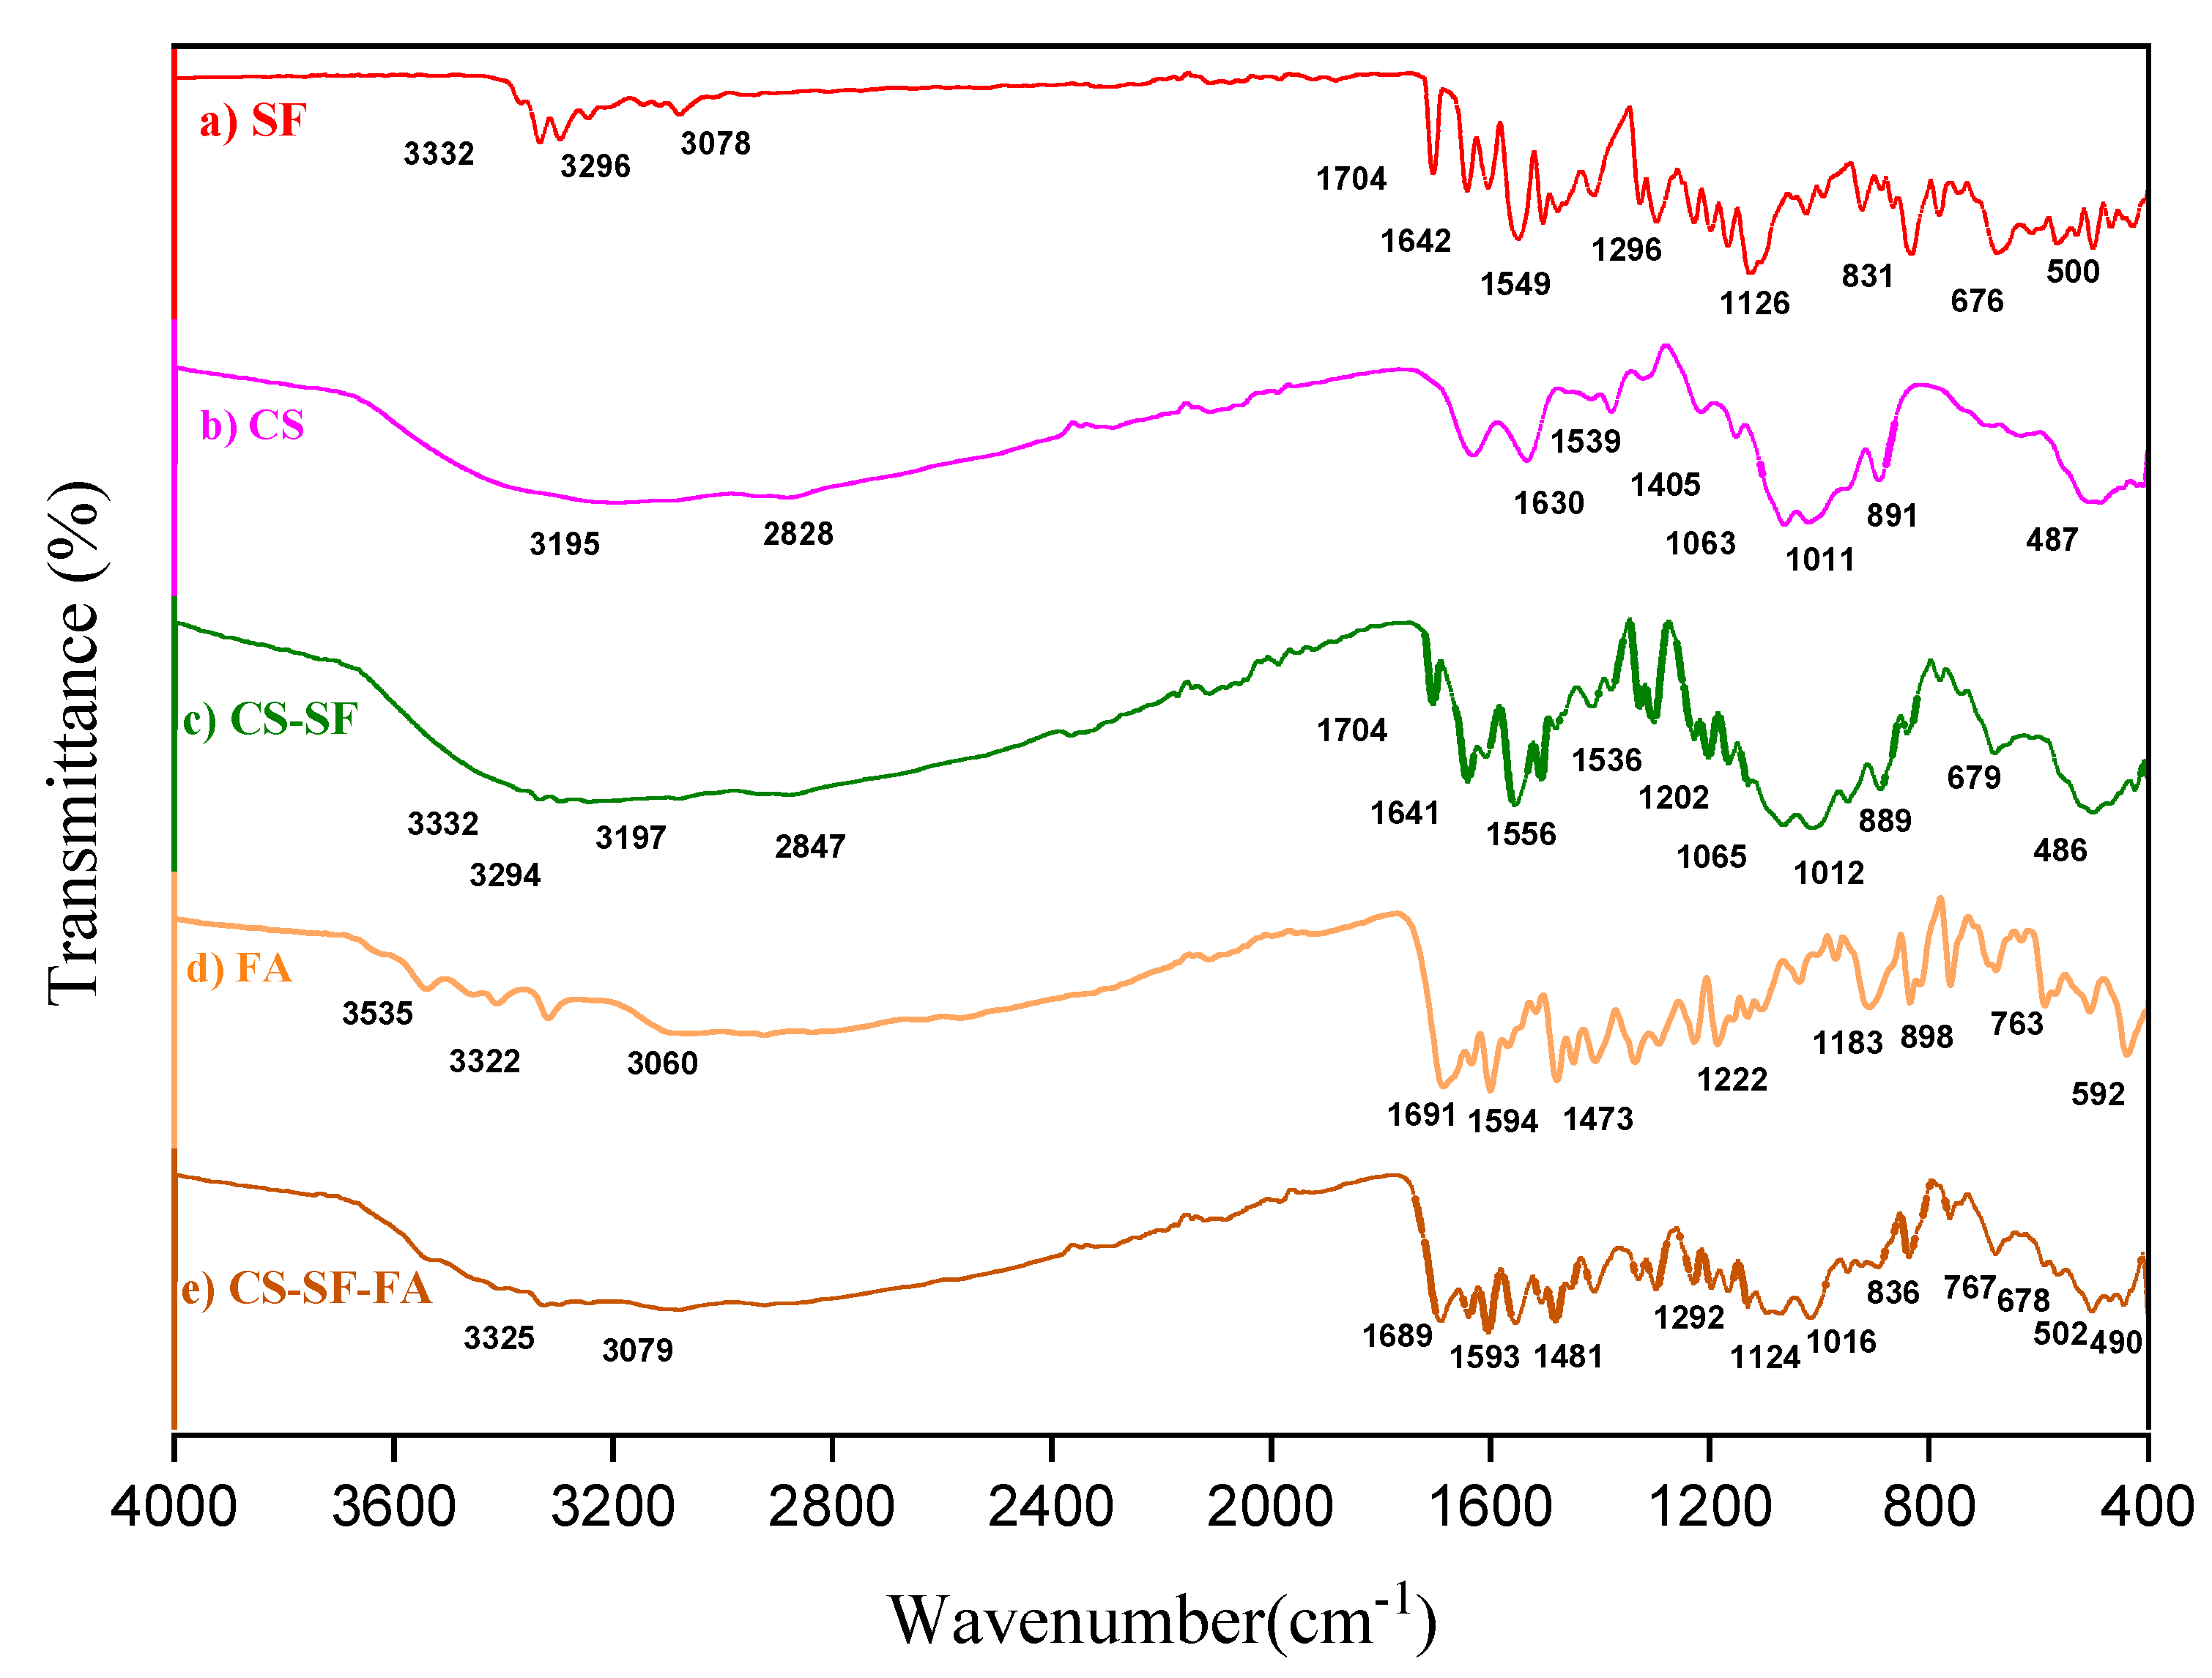
Figure 9.
FTIR spectrum of SF (a), CS-NPs (b), SF-CS NPs (c), FA (d), and SF-CS-FA NPs (e).
Figure 9.
FTIR spectrum of SF (a), CS-NPs (b), SF-CS NPs (c), FA (d), and SF-CS-FA NPs (e).
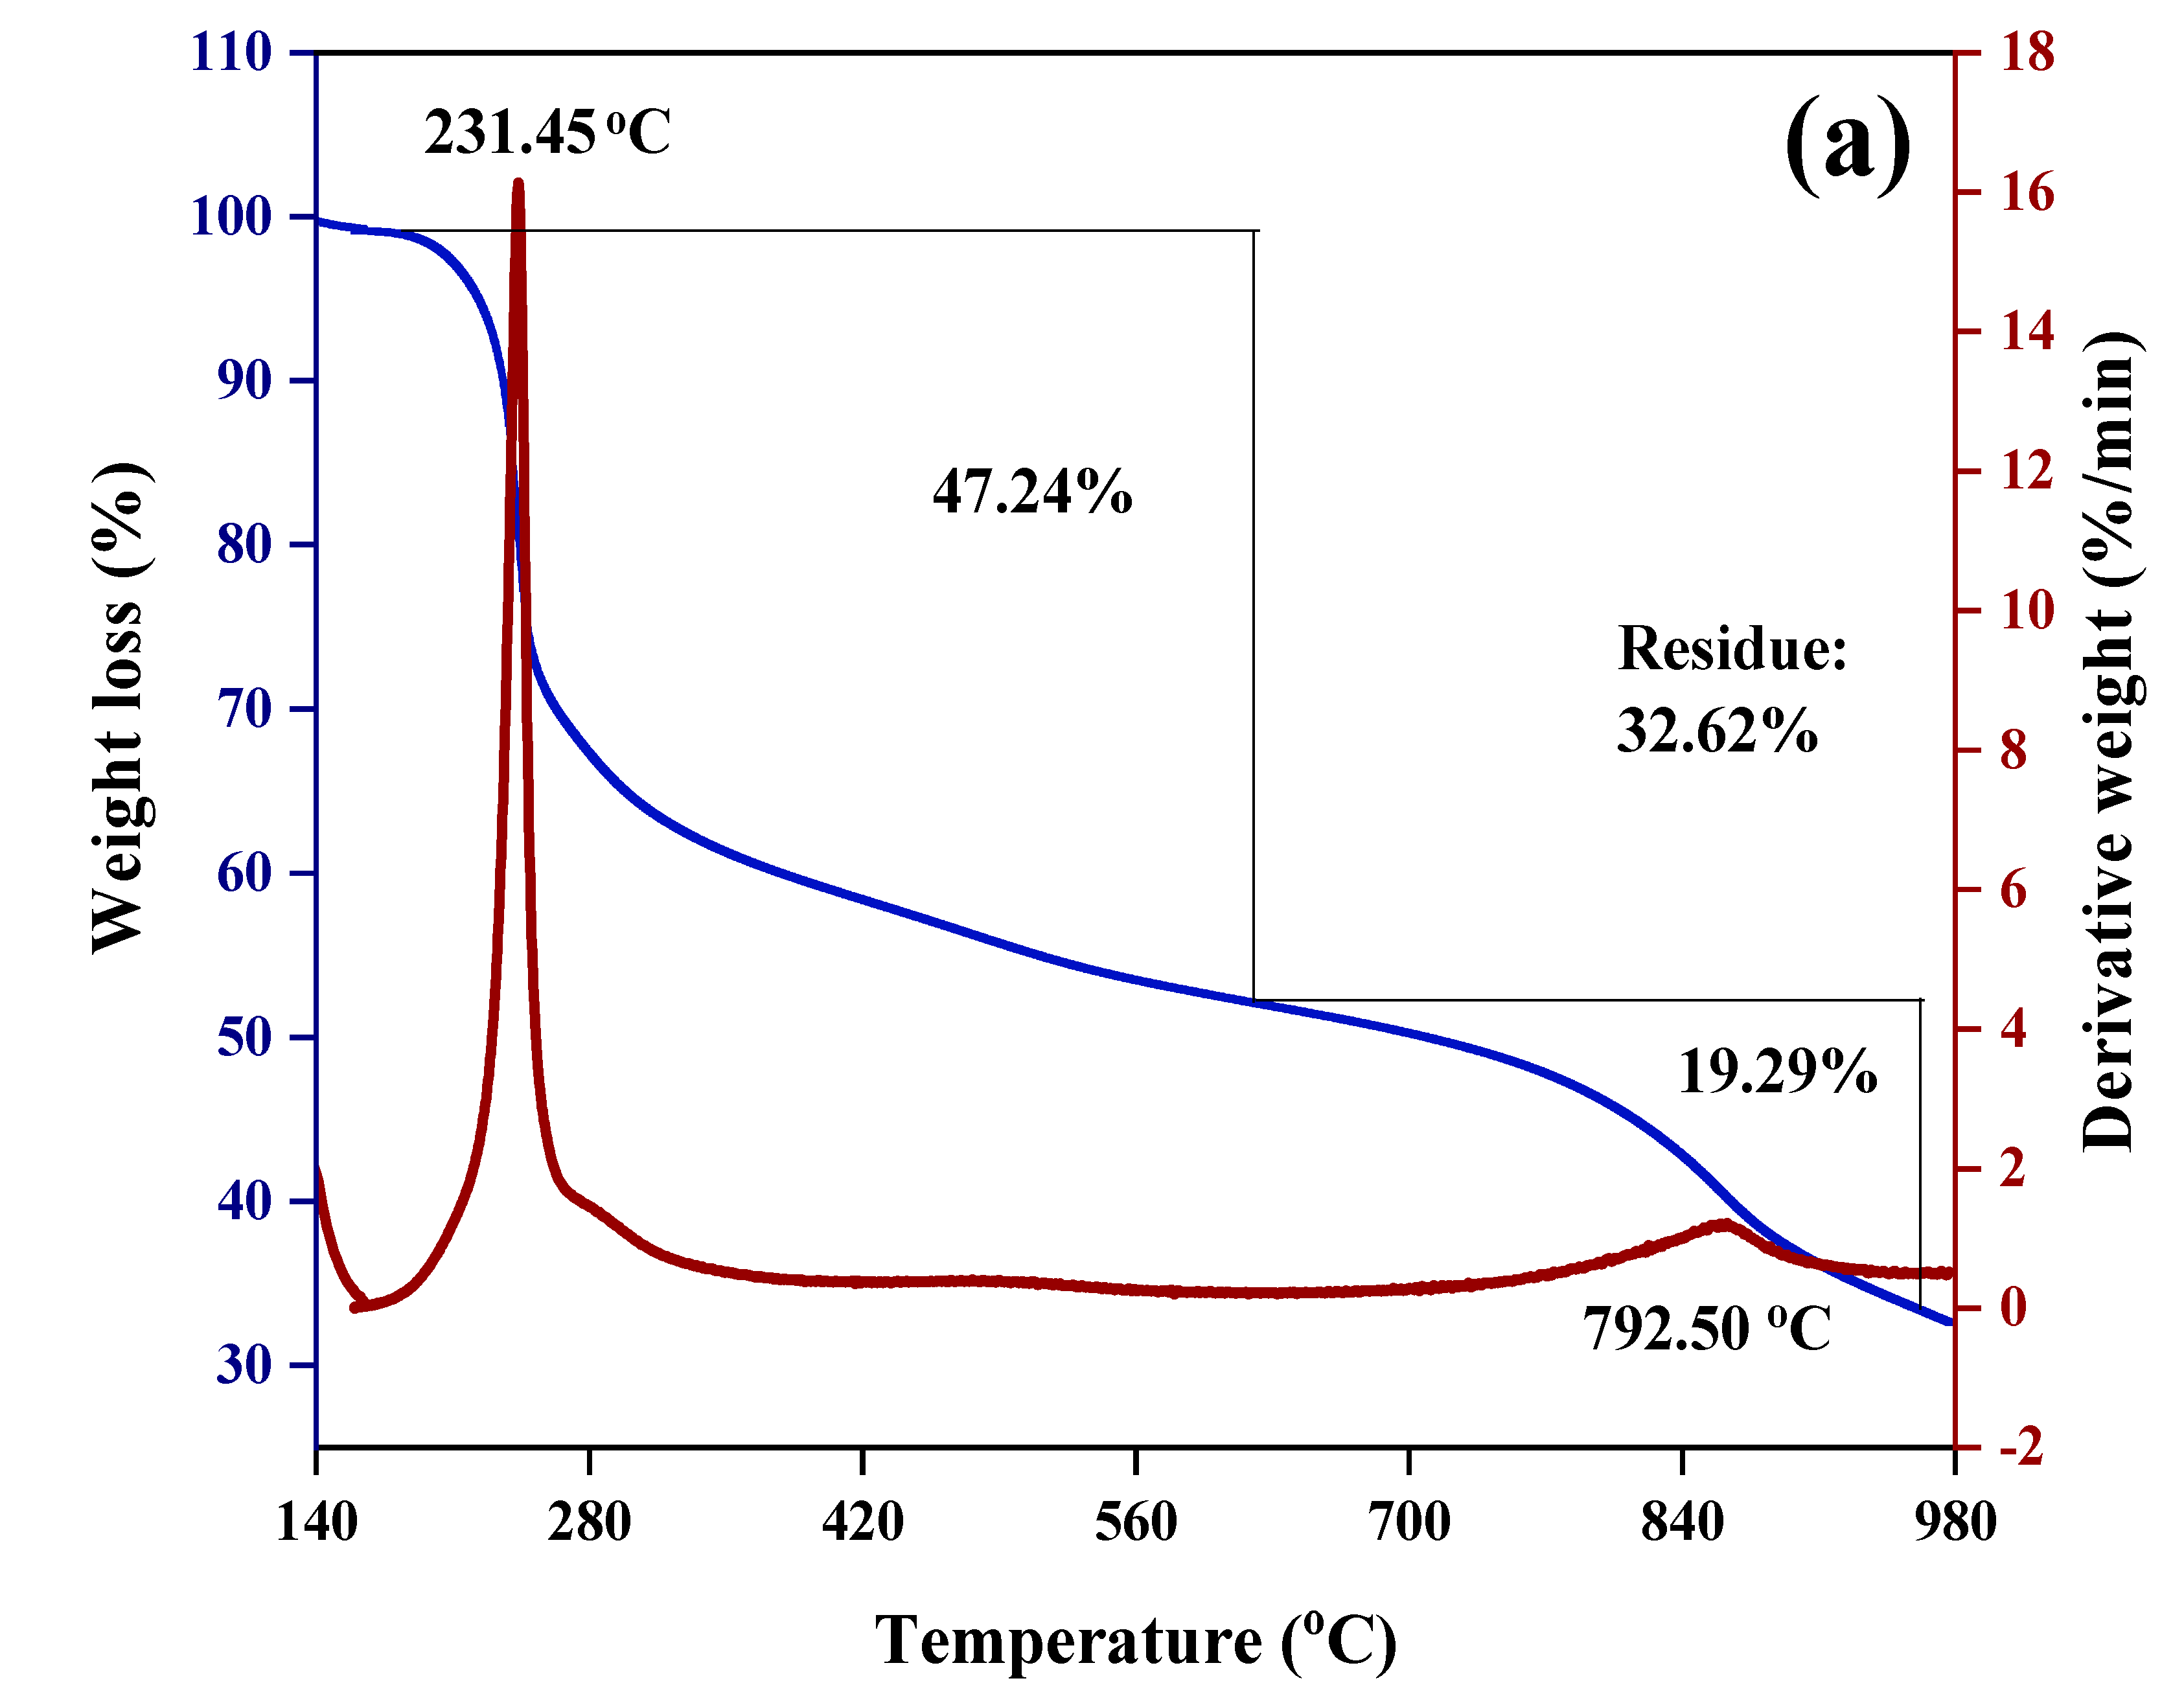
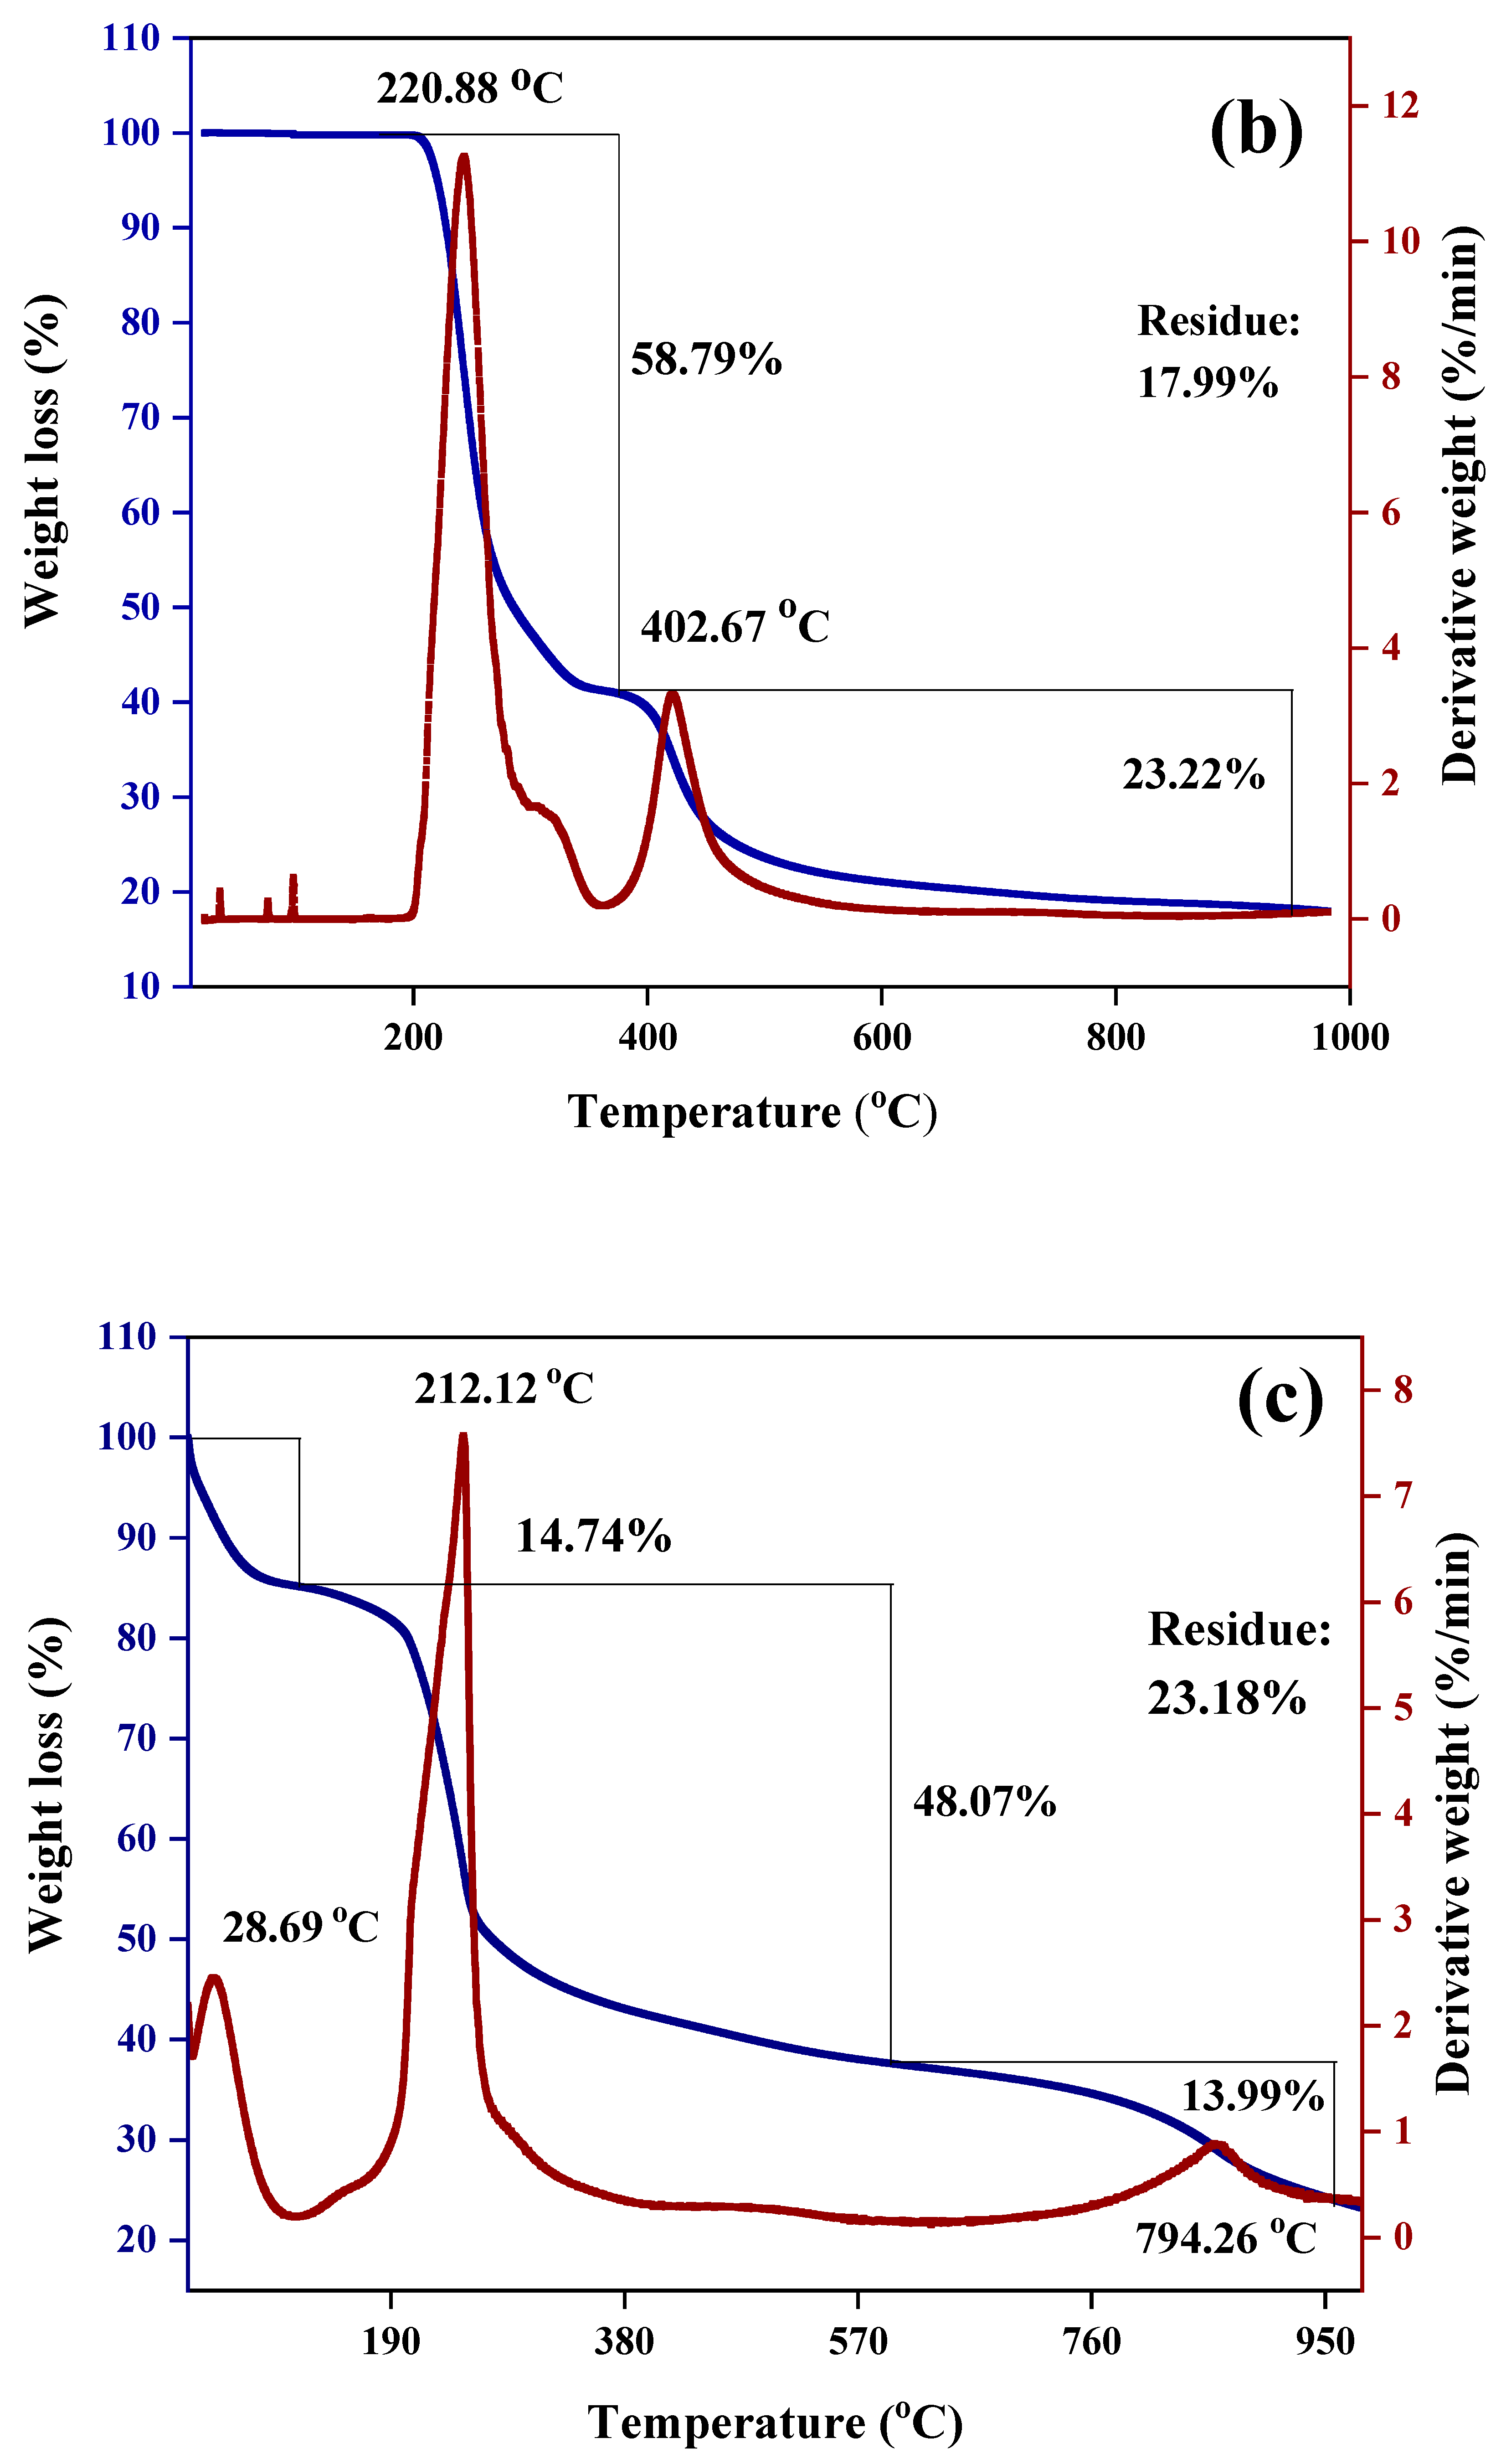
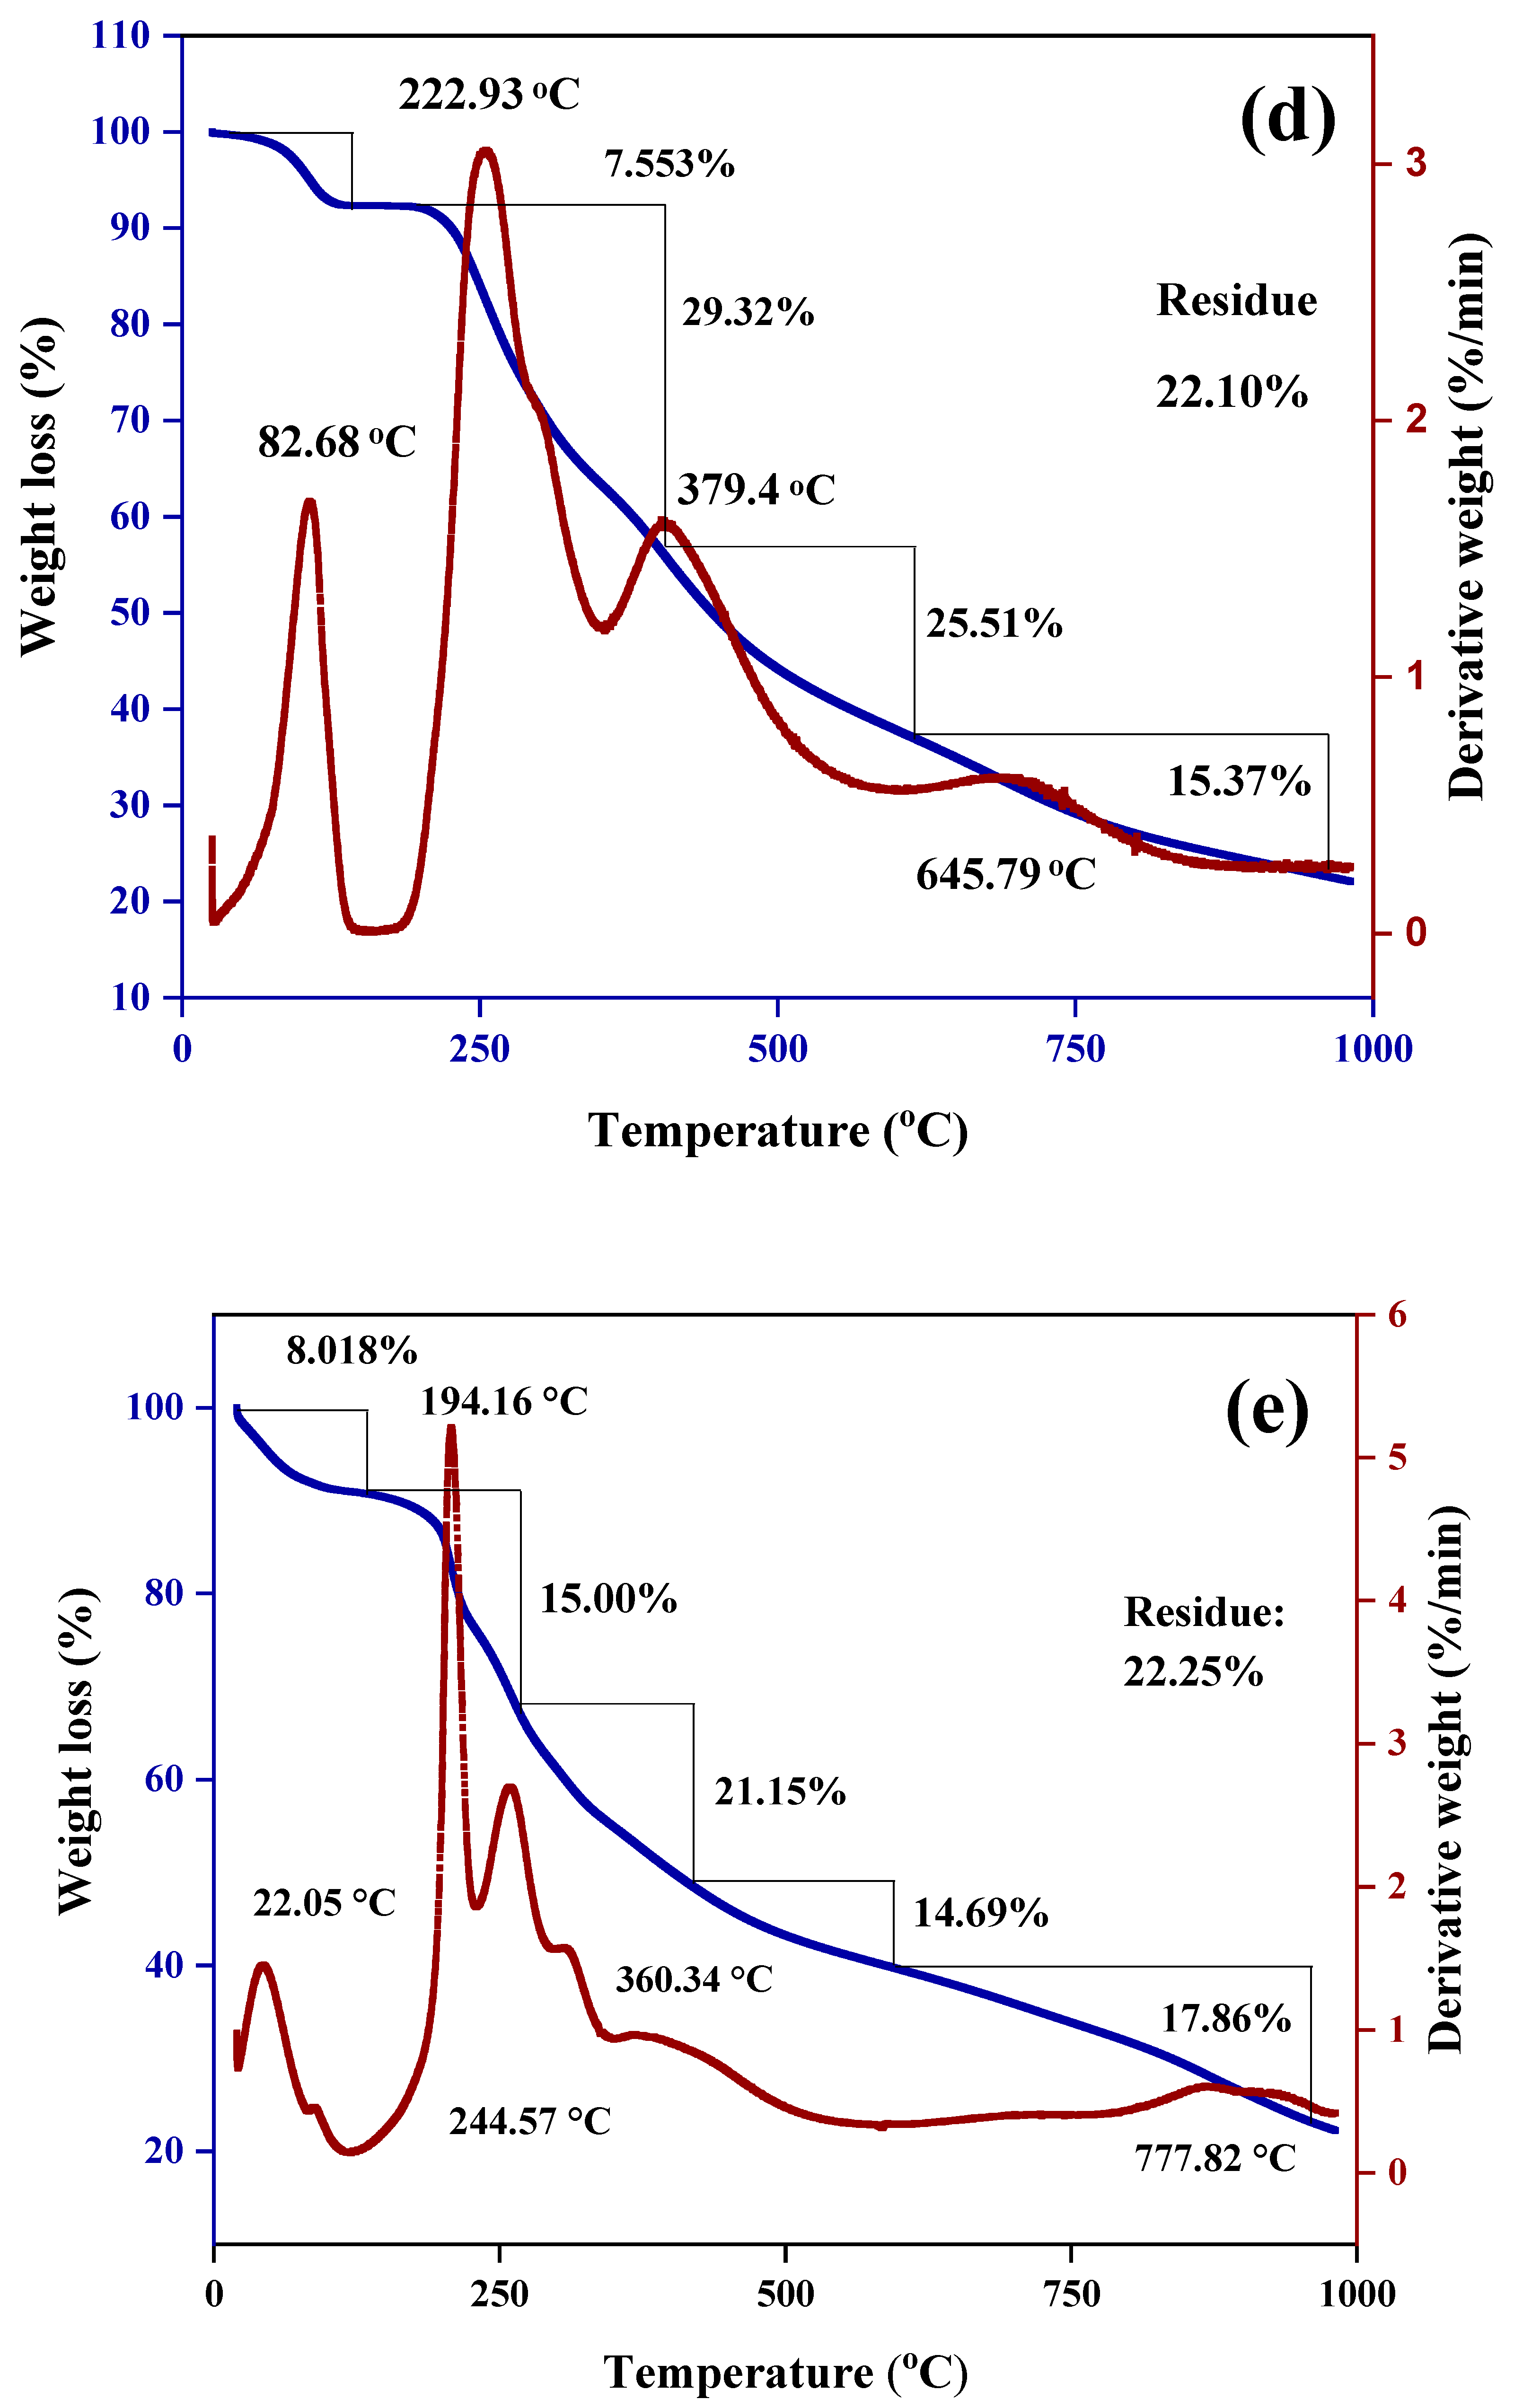
Figure 10.
TGA/DTG thermograms of (a) CS-NPs, (b) SF, (c) SF-CS, (d) FA, and (e) SF-CS-FA.
Figure 10.
TGA/DTG thermograms of (a) CS-NPs, (b) SF, (c) SF-CS, (d) FA, and (e) SF-CS-FA.
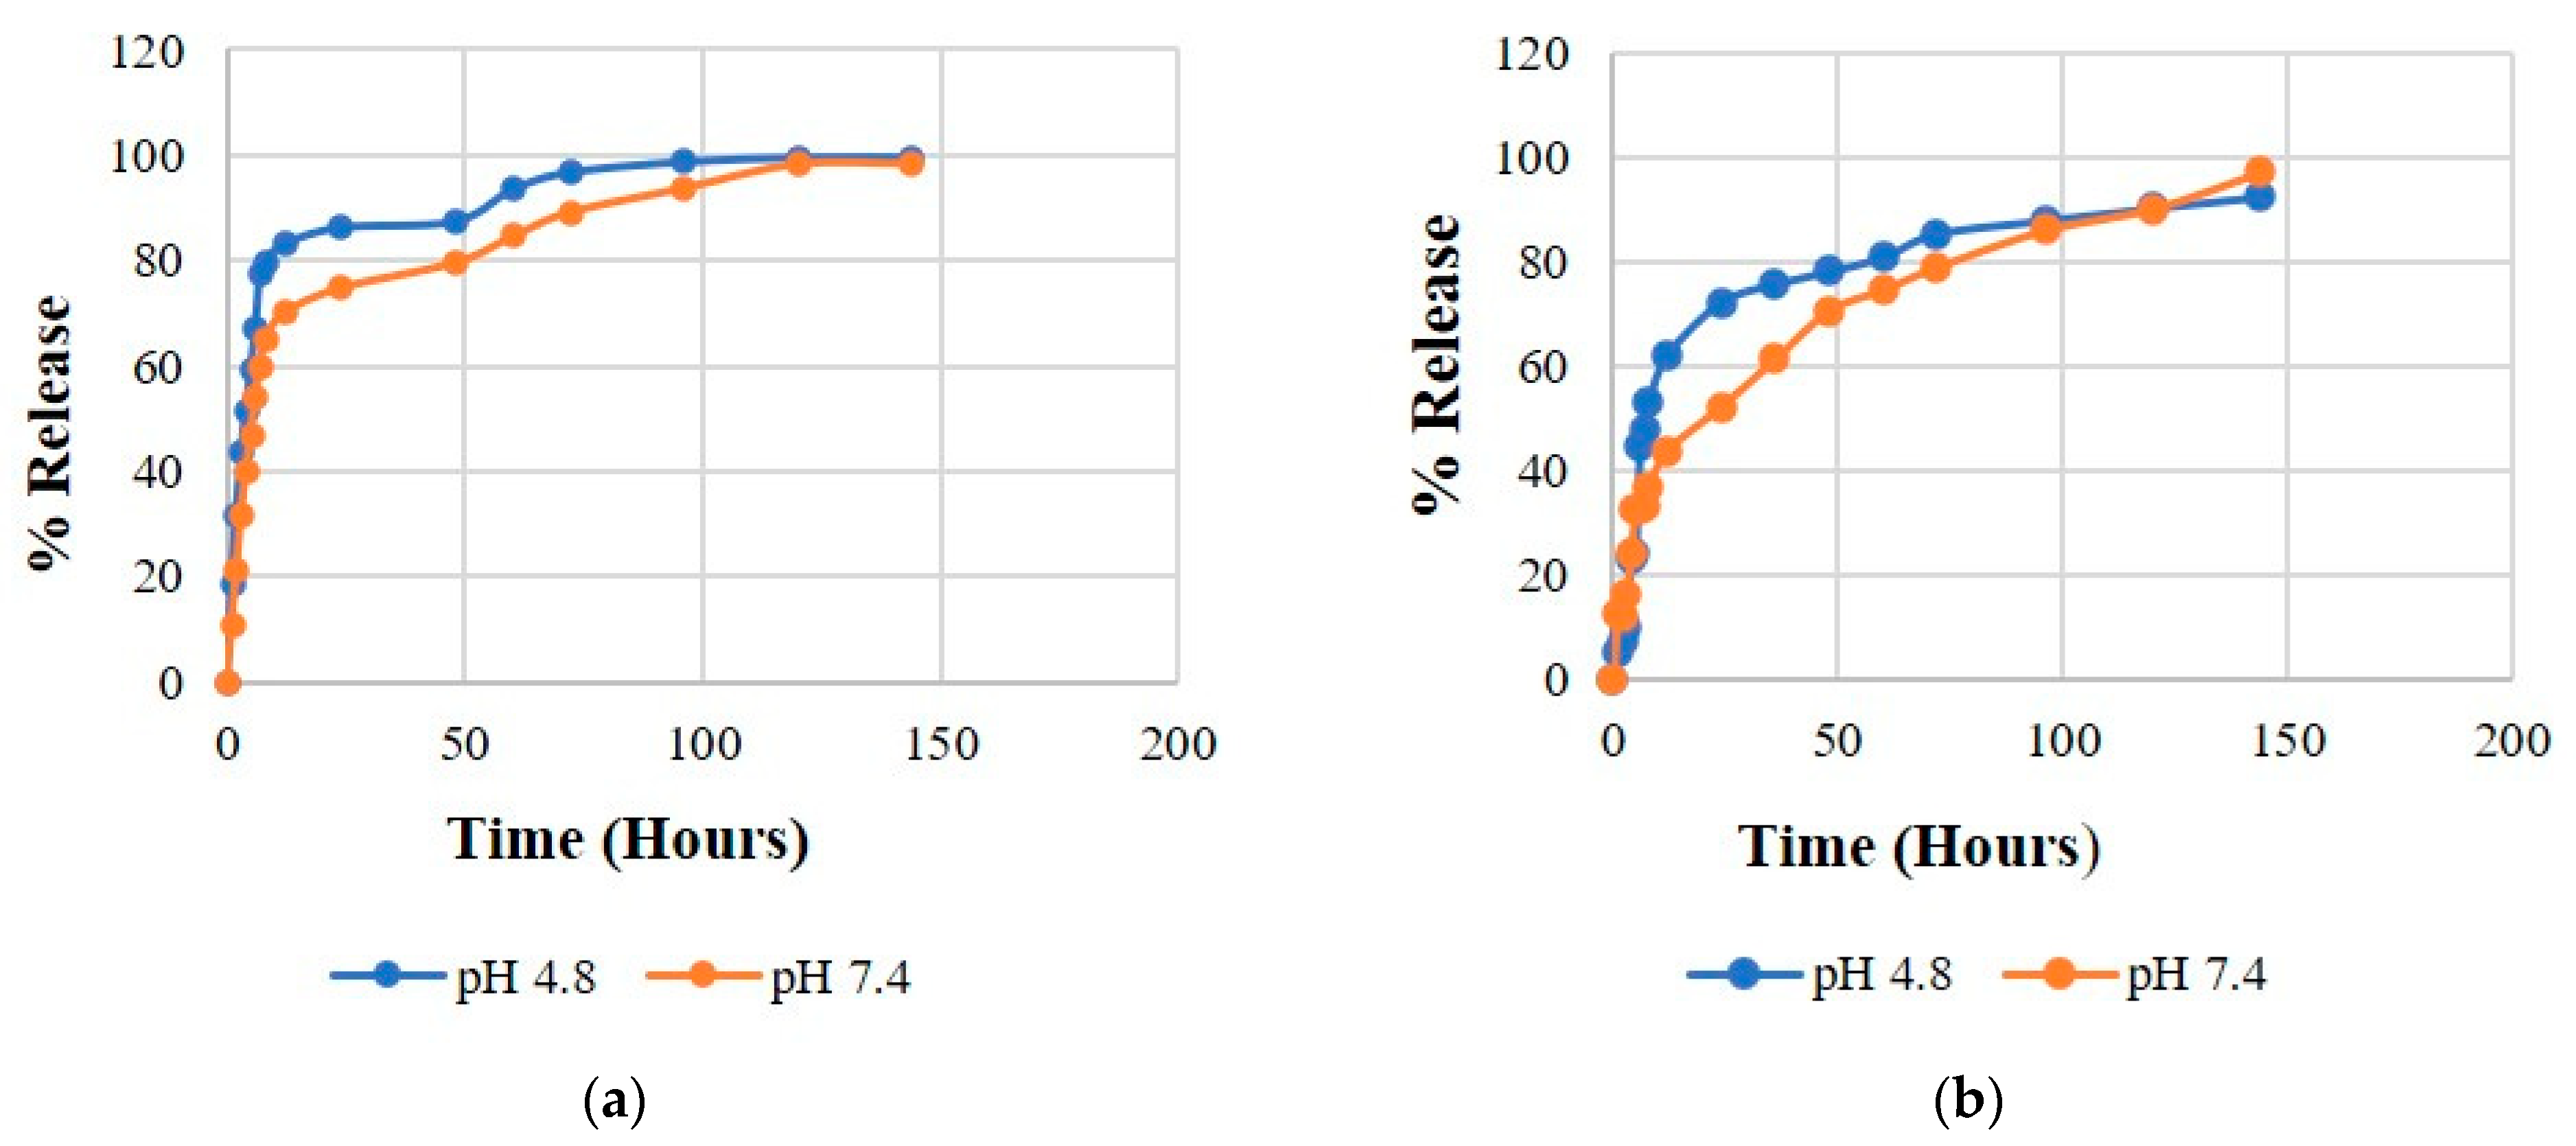
Figure 11.
Release profiles of SF from its (a) SF-CS and (b) SF-CS-FA nanoparticles at pH 7.4 and 4.8 buffer solutions.
Figure 11.
Release profiles of SF from its (a) SF-CS and (b) SF-CS-FA nanoparticles at pH 7.4 and 4.8 buffer solutions.
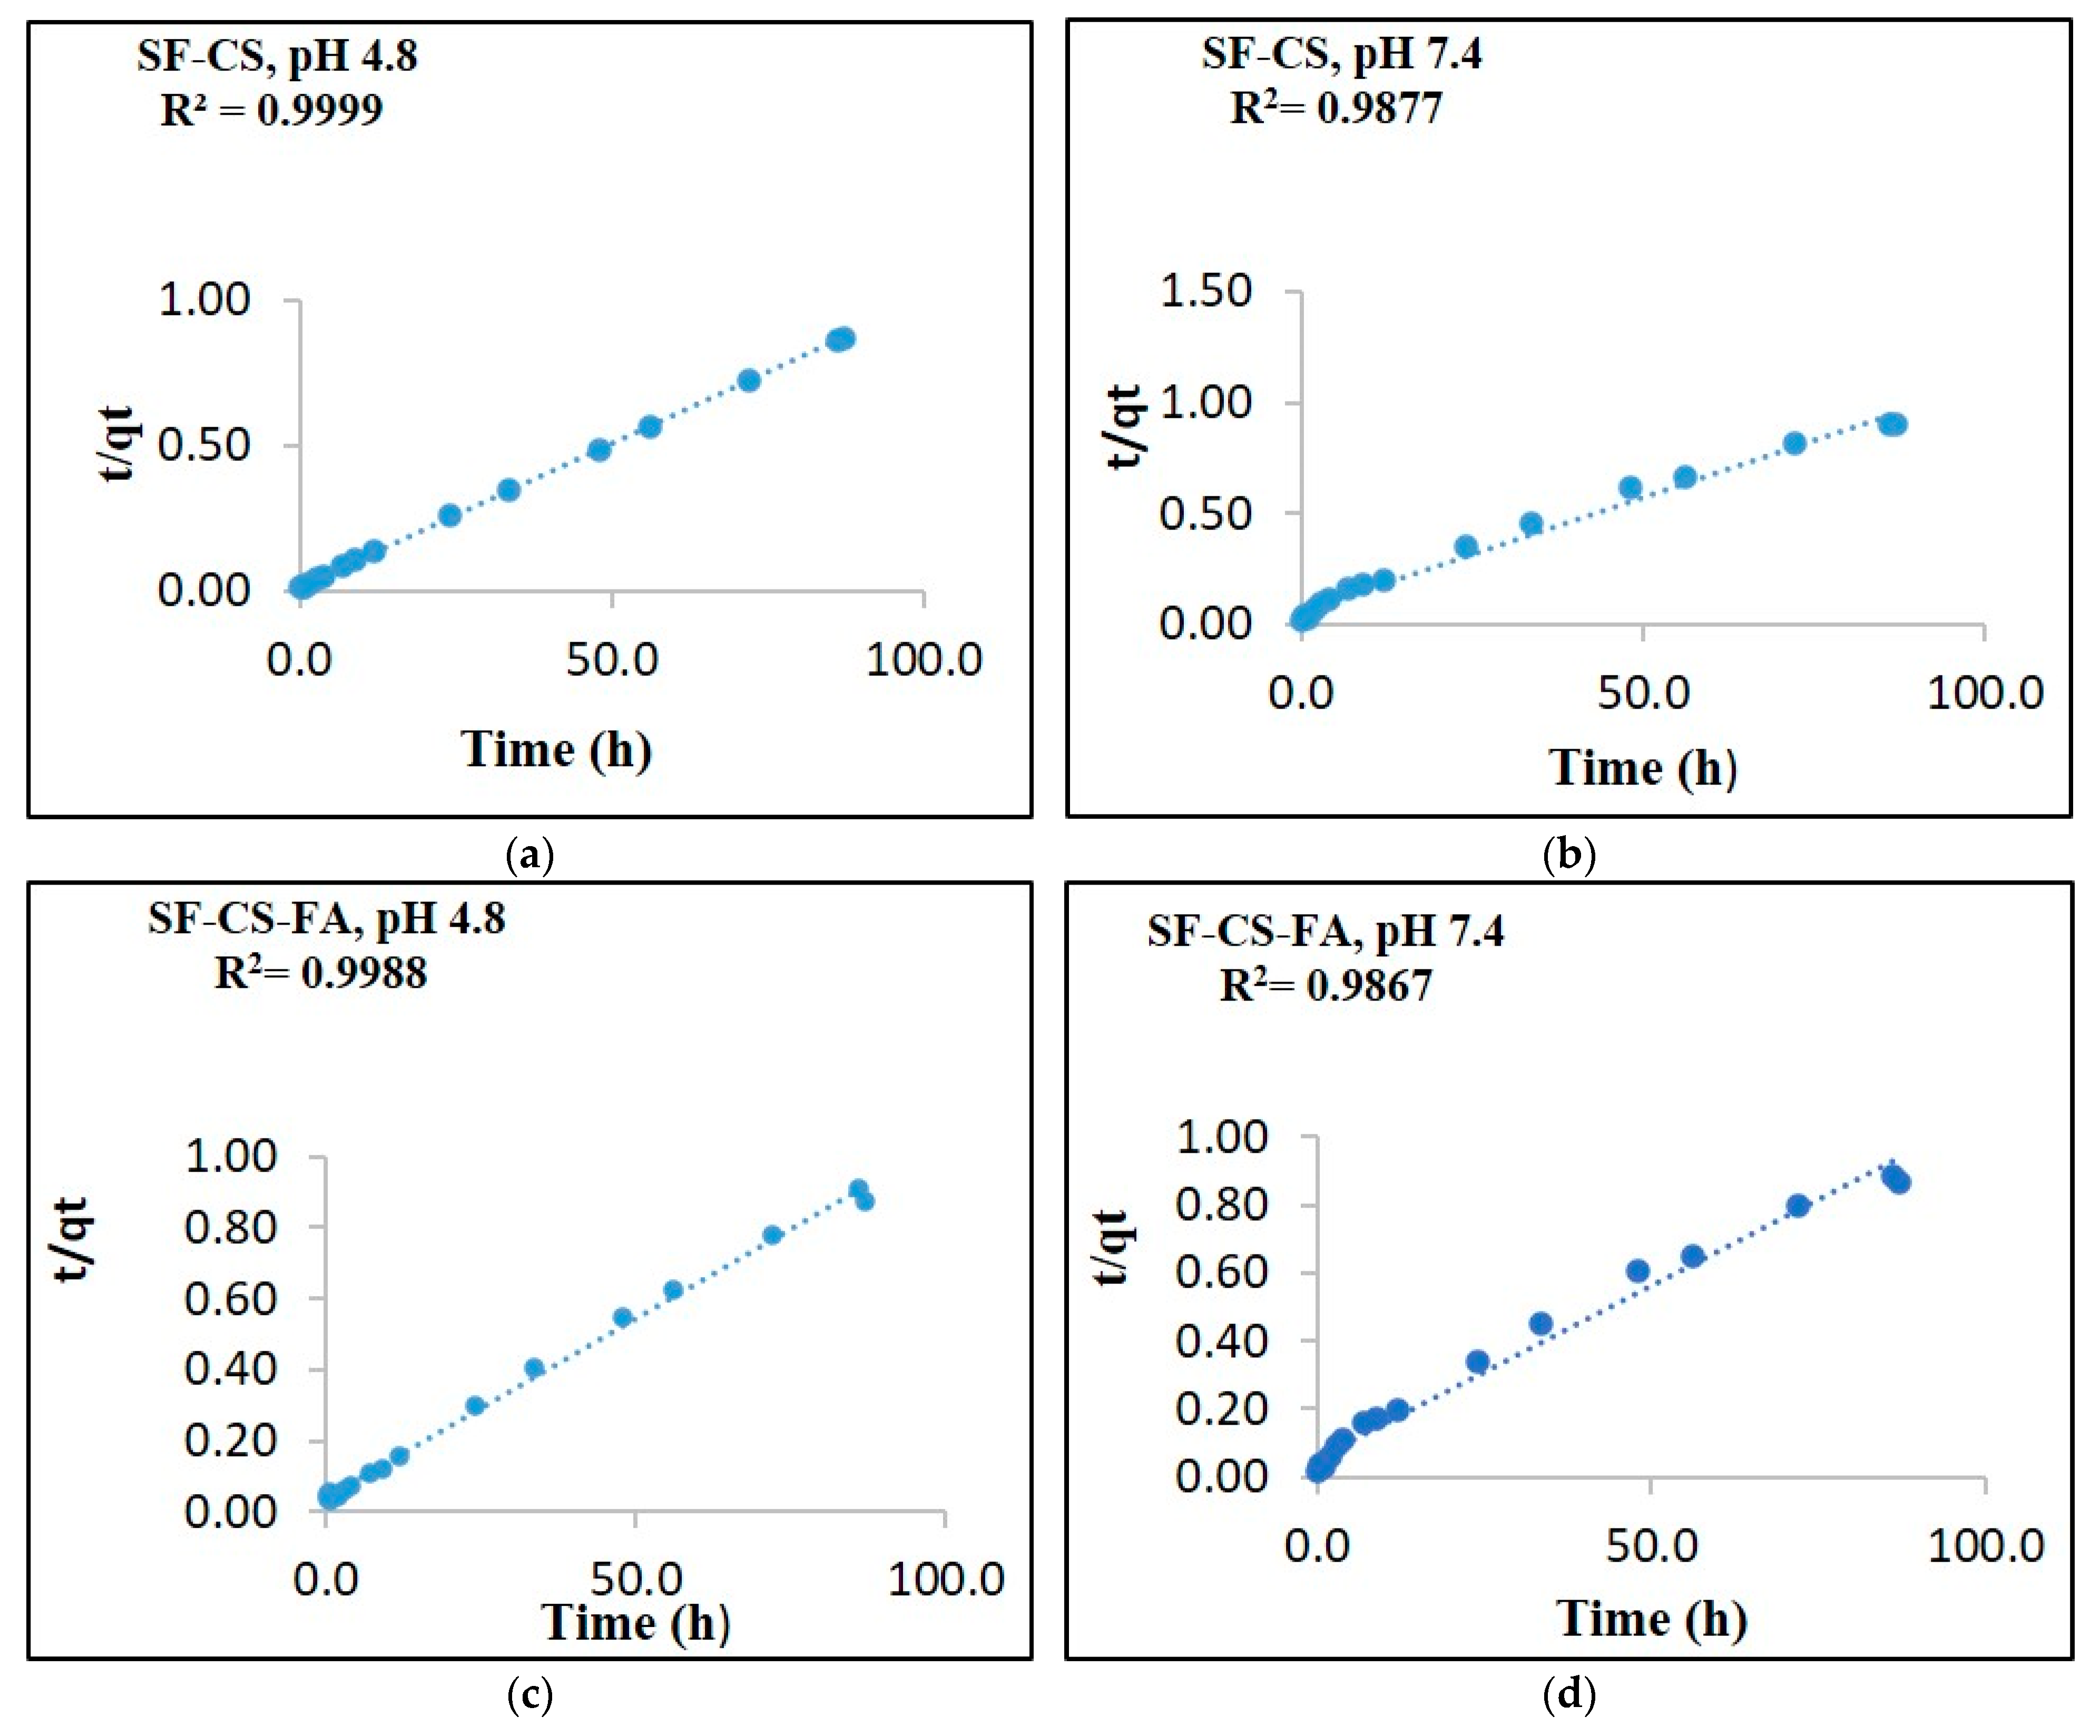
Figure 12.
The data fitting of SF release from its SF-CS nanoparticles at pH 4.8 (a), pH 7.4 (b) and its SF-CS-FA nanoparticles at pH 4.8 (c), pH 7.4 (d) using the pseudo-second-order kinetics models.
Figure 12.
The data fitting of SF release from its SF-CS nanoparticles at pH 4.8 (a), pH 7.4 (b) and its SF-CS-FA nanoparticles at pH 4.8 (c), pH 7.4 (d) using the pseudo-second-order kinetics models.
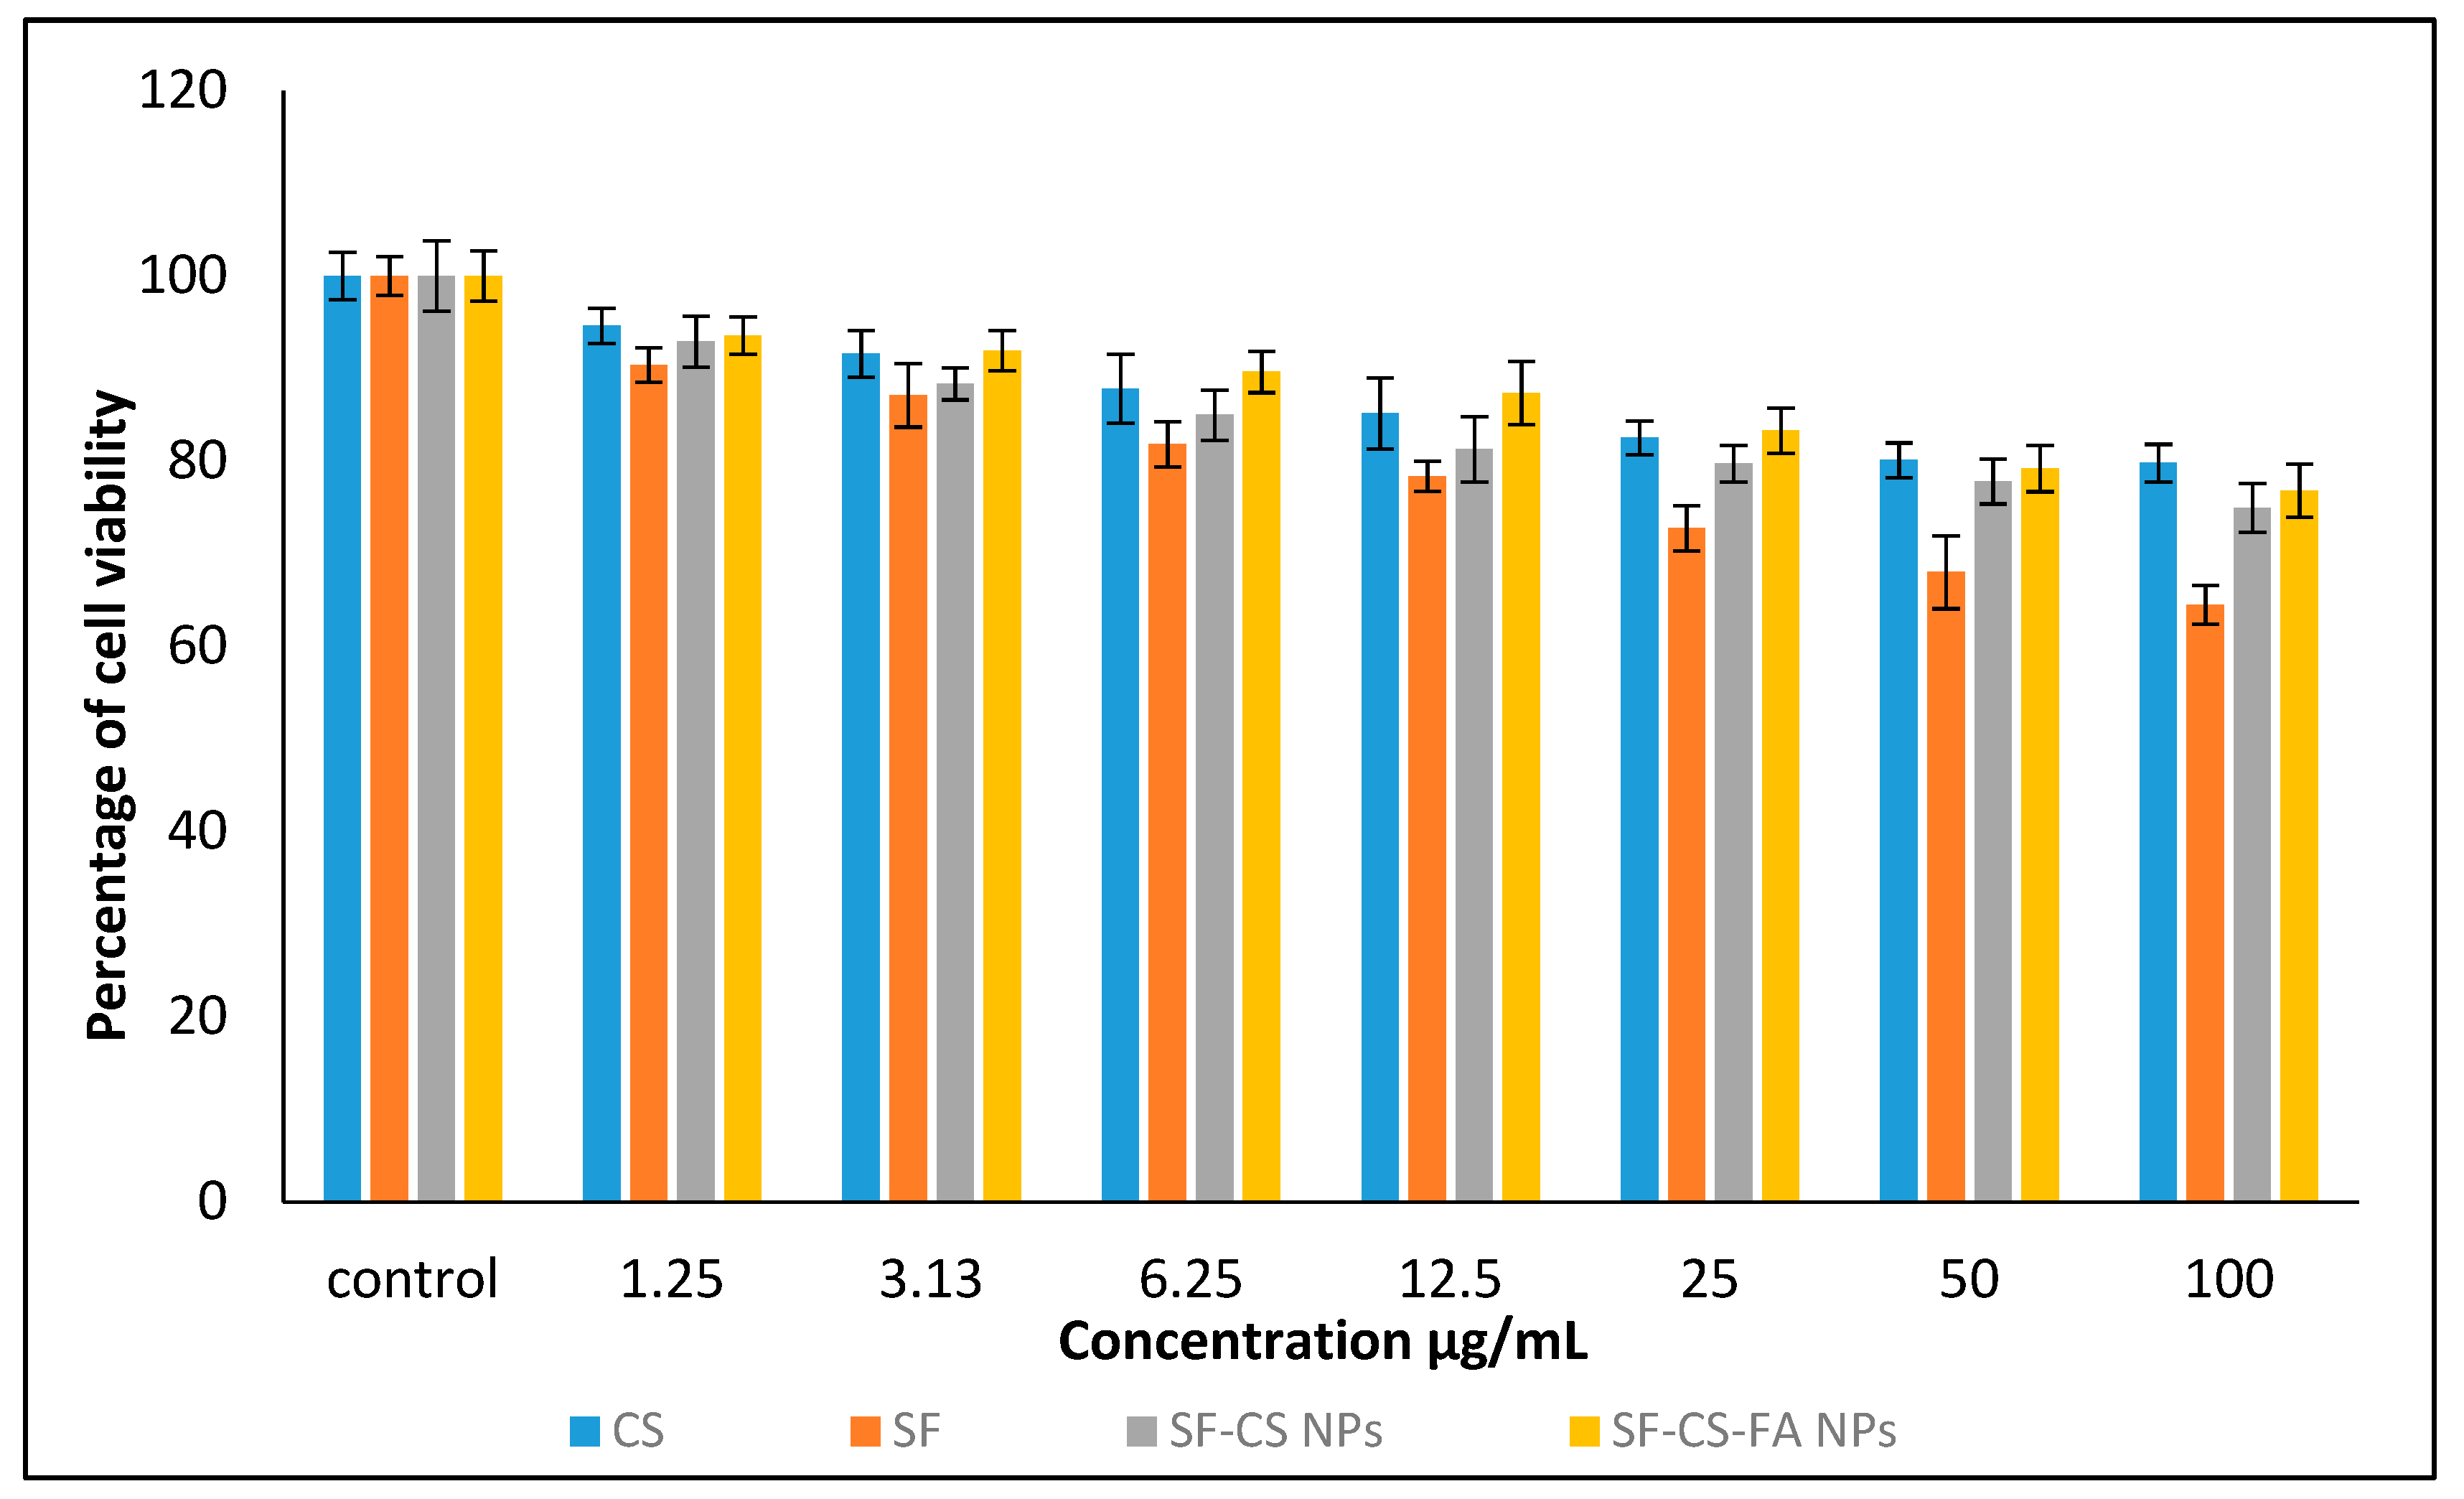
Figure 13.
Cytotoxicity assay of chitosan, pristine sorafenib, CS-sorafenib, and CS-sorafenib-folic acid nanoparticles against normal HDFa dermal fibroblast cells at 72 h. Values are expressed as mean ± SD of triplicates. The significant differences were determined using the one-way ANOVA followed by Duncan’s Multiple Range Test.
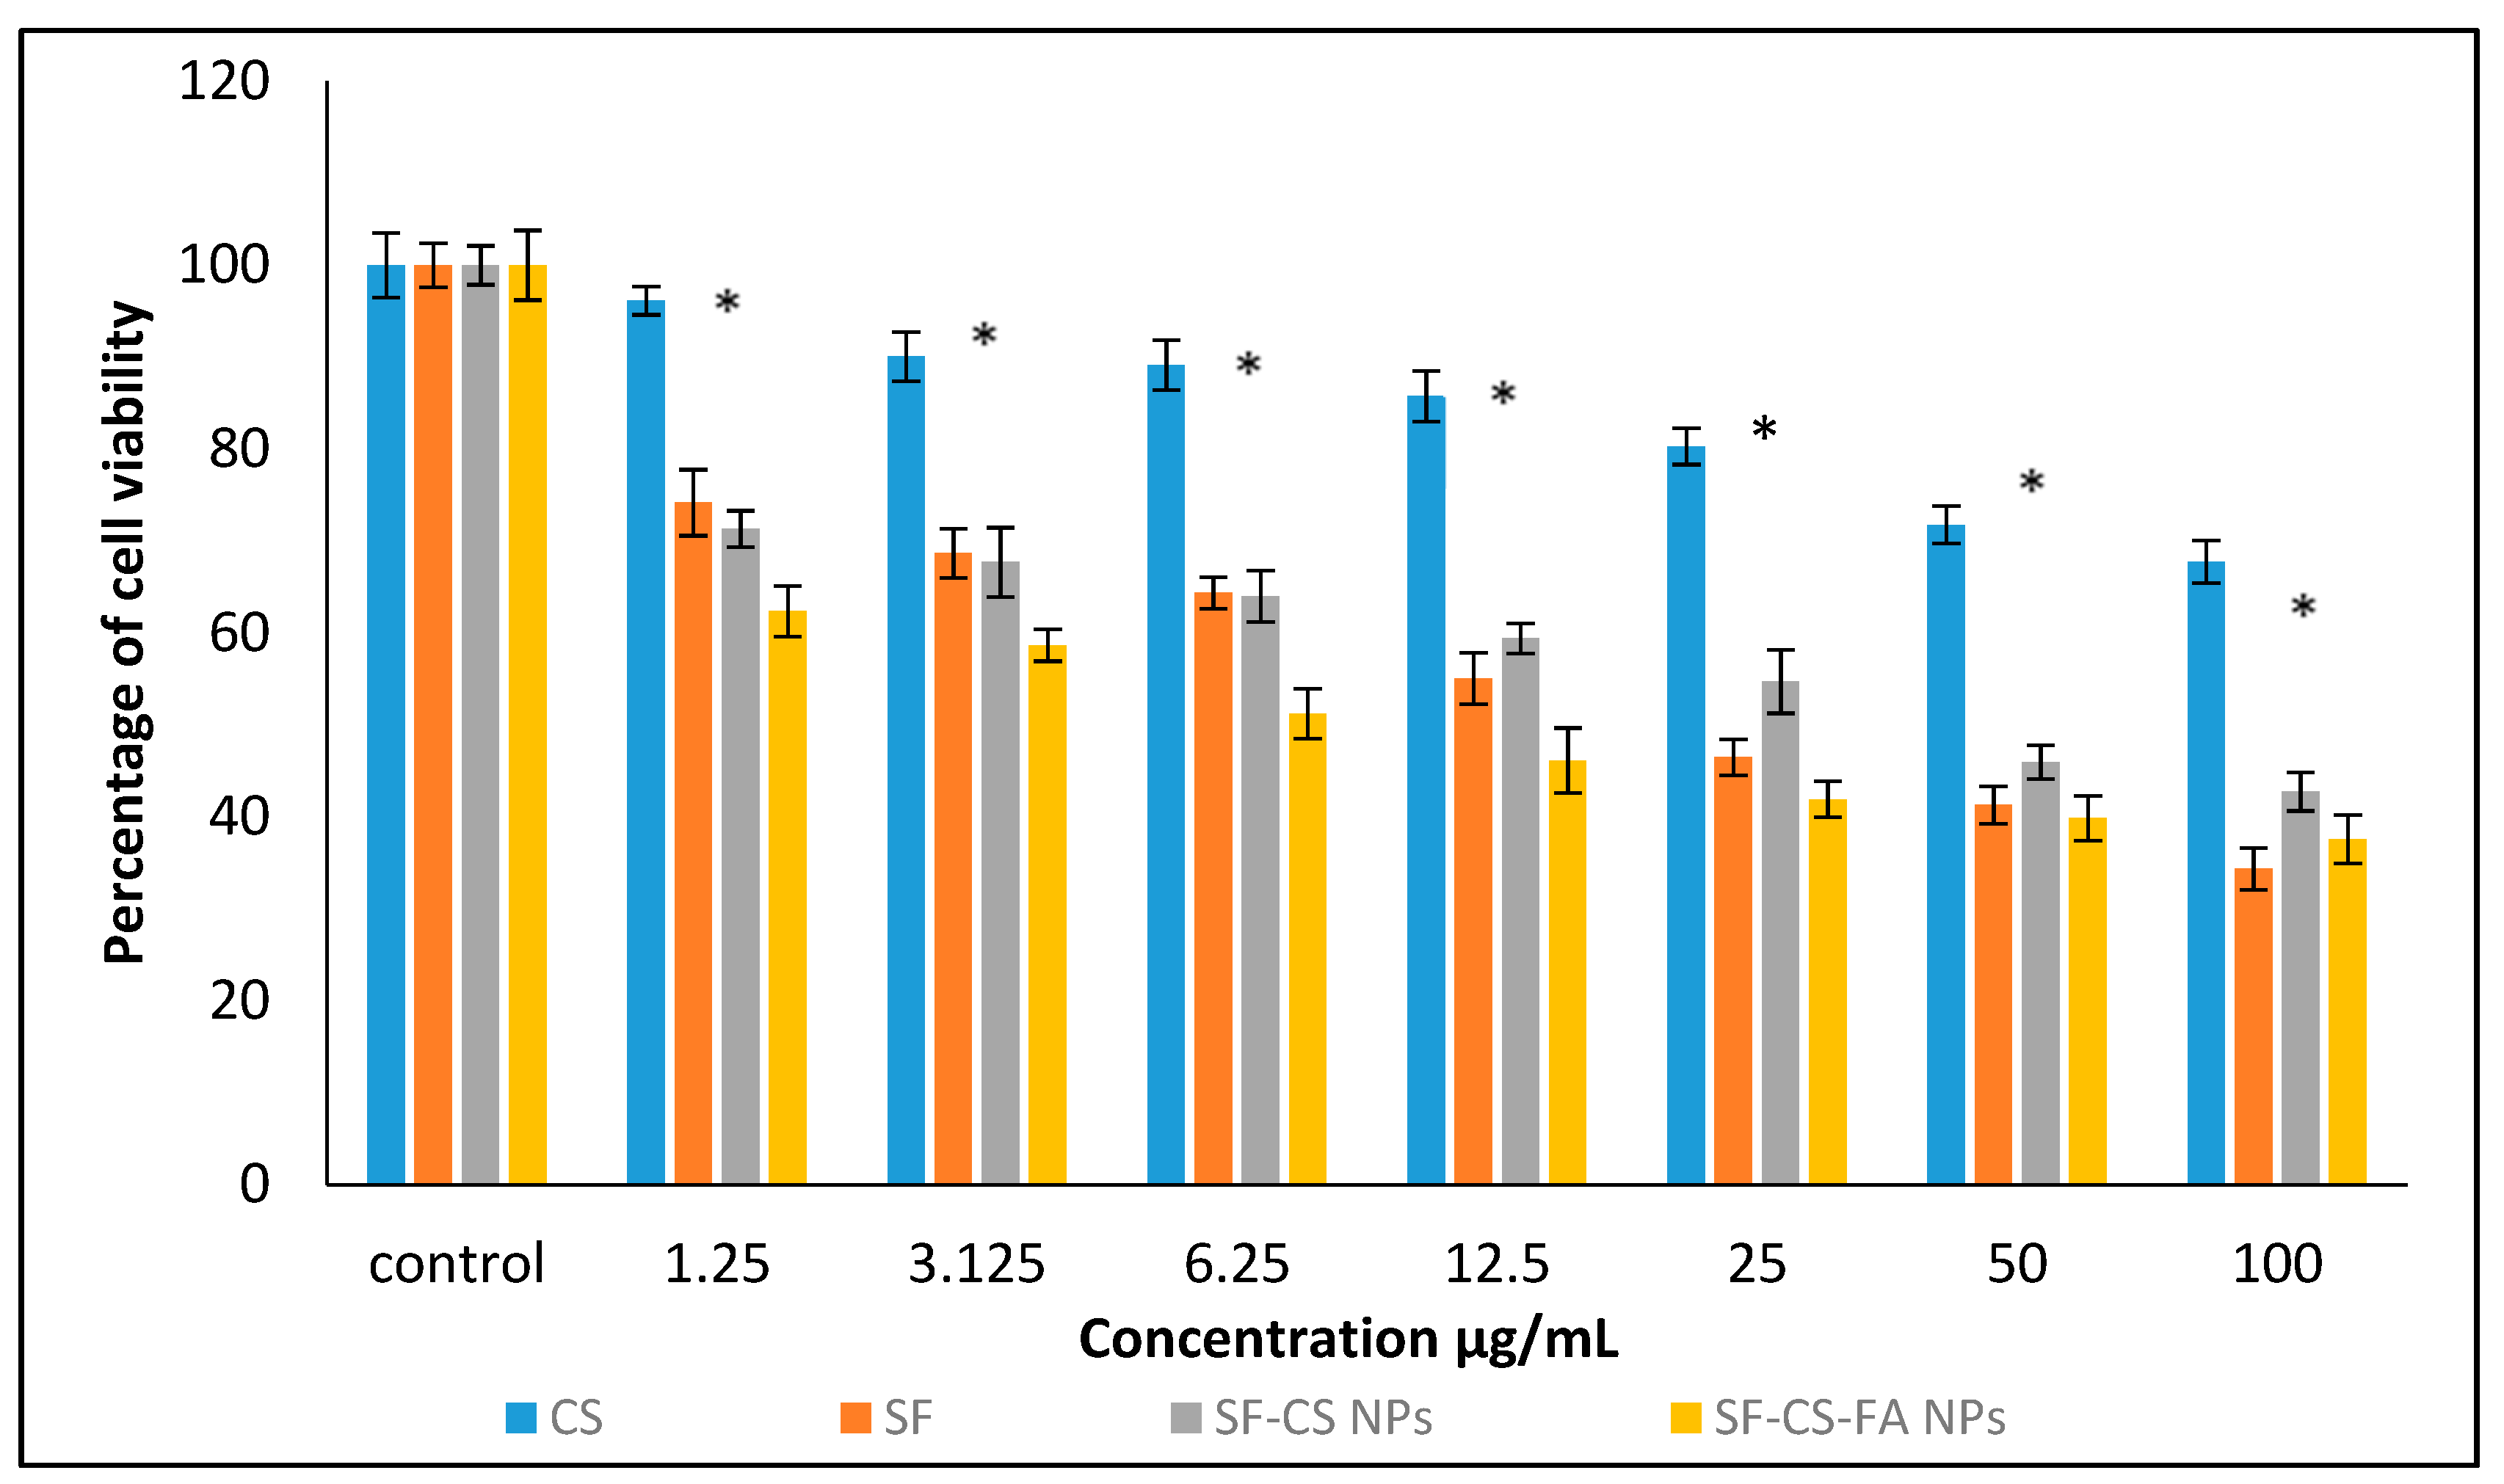
Figure 14.
Cytotoxicity assay of CS, SF, SF-CS, and SF-CS-FA nanoparticles against HepG2 cells at 72 h of incubation. Values are expressed as mean ± SD of triplicates. The significant differences (p < 0.05) * were determined using the one-way ANOVA followed by Duncan’s Multiple Range Test.
Figure 14.
Cytotoxicity assay of CS, SF, SF-CS, and SF-CS-FA nanoparticles against HepG2 cells at 72 h of incubation. Values are expressed as mean ± SD of triplicates. The significant differences (p < 0.05) * were determined using the one-way ANOVA followed by Duncan’s Multiple Range Test.
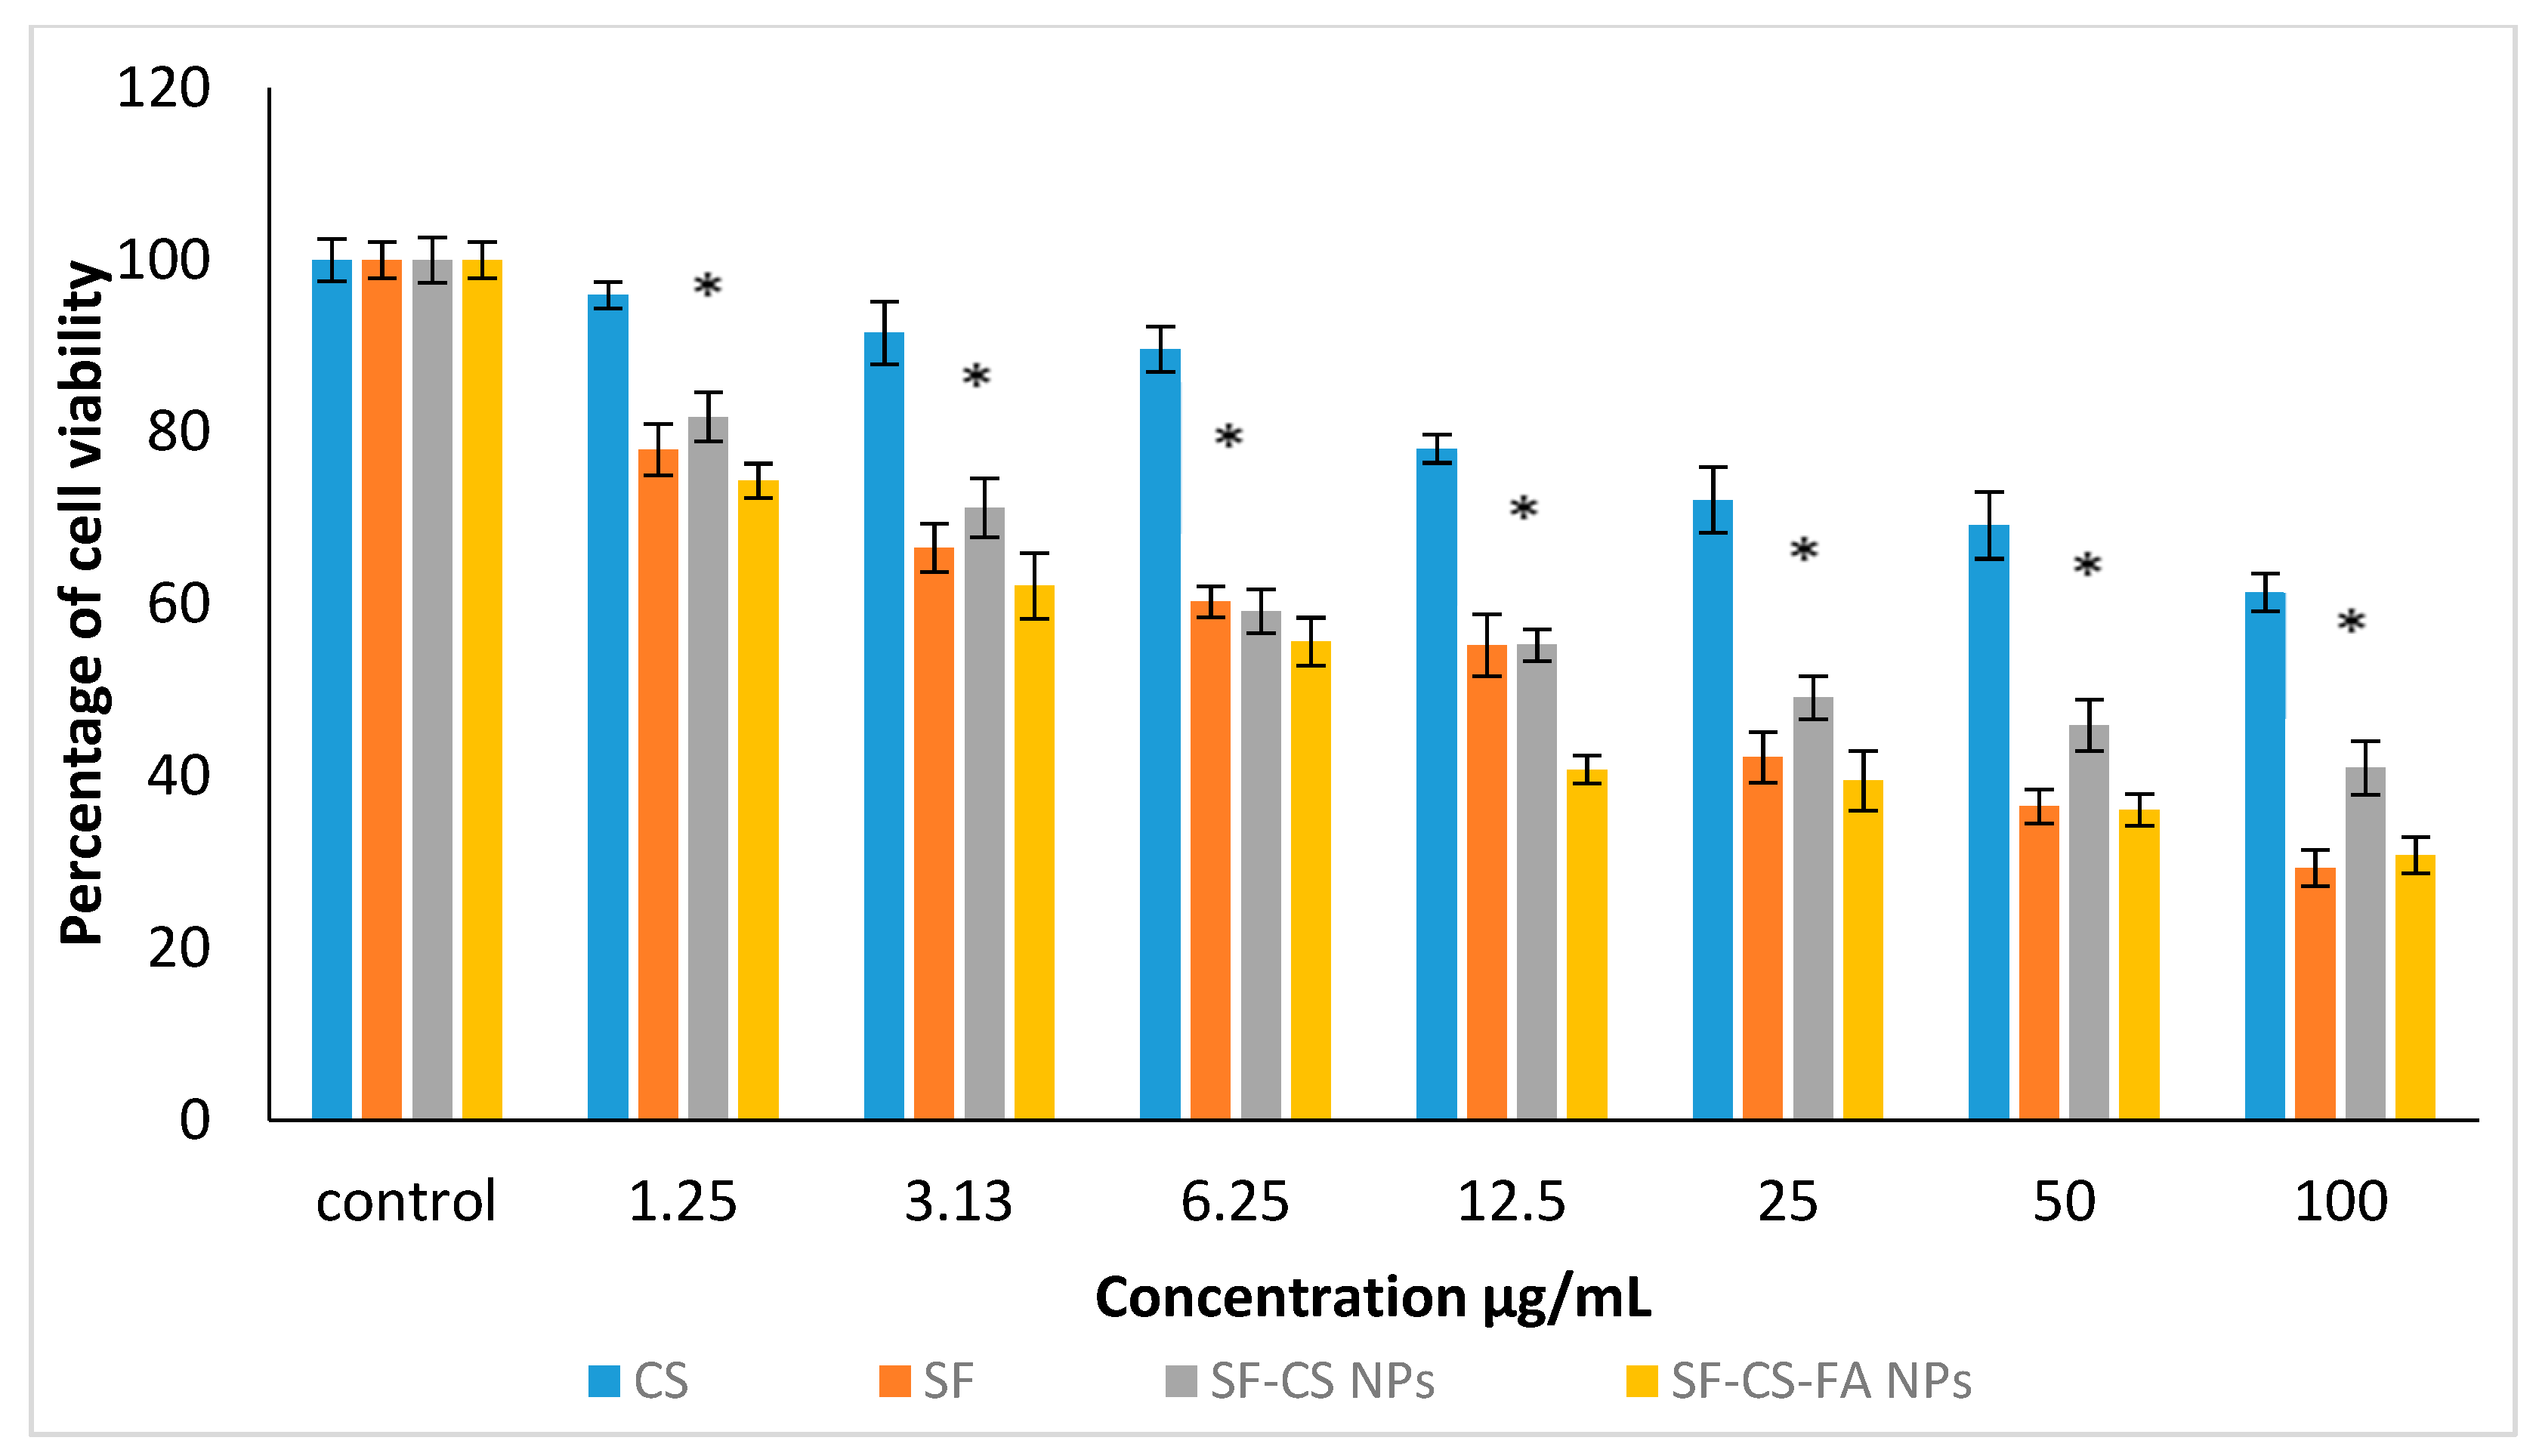
Figure 15.
Cytotoxicity assay of CS, SF, SF-CS, and SF-CS-FA nanoparticles against HT29 cells at 72 h of incubation. Values are expressed as mean ± SD of triplicates. The significant differences (p < 0.05) * were determined among untreated HT29 using the one-way ANOVA followed by Duncan’s Multiple Range Test.
Table 1.
The effect of size, poly dispersity index, encapsulation efficiency (%) and loading content (%), and zeta potential on chitosan: Sorafenib ratios. Optimal parameters are shown in bold.
Table 1.
The effect of size, poly dispersity index, encapsulation efficiency (%) and loading content (%), and zeta potential on chitosan: Sorafenib ratios. Optimal parameters are shown in bold.
| Sample | Chitosan: Sorafenib ratio (mg/mL) | Size (nm) | PDI | EE (%) | LC (%) | Zeta Potentials (mV) |
|---|
| SF-CS NPs | 5:0 | 10.5 ± 9.6 | 0.22 | 0.0 ± 0.0 | 0.0 ± 0.0 | 7.9 ± 0.9 |
| 5:1 | 27.2 ± 12.6 | 0.19 | 20.2 ± 1.2 | 7.7 ± 0.5 | 8.7 ± 0.4 |
| 5:2 | 30.8 ± 11.9 | 0.23 | 69.8 ± 3.3 | 12.2 ± 0.2 | 19.8 ± 0.4 |
| 5:3 | 76.3 ± 13.7 | 0.28 | 83.7 ± 2.4 | 18.2± 1.3 | 31.5 ± 0.6 |
| 5:4 | 67.9 ± 11.2 | 0.10 | 79.9 ± 1.9 | 14.8 ± 1.0 | 32.8 ± 0.5 |
| 5:5 | 28.7 ± 7.8 | 0.45 | 49.8 ± 0.9 | 7.6 ± 0.6 | 37.7 ± 0.4 |
| 5:6 | 15.4 ± 9.8 | 0.68 | 19.4 ± 1.3 | 6.9 ± 0.1 | 37.6 ± 0.1 |
| 5:7 | 27.8 ± 5.0 | 0.92 | 3.7 ± 1.1 | 12.9 ± 0.4 | 31.8 ± 0.3 |
| 5:8 | 14.9 ± 5.9 | 2.07 | 8.8 ± 0.5 | 6.0 ± 0.6 | 25.4 ± 0.7 |
| 1:3 | 18.5 ± 7.3 | 0.09 | 9.8 ± 0.6 | 1.9 ± 0.0 | 17.6 ± 0.9 |
| 2:3 | 47.6 ± 3.9 | 0.05 | 6.9 ± 0.9 | 8.9 ± 0.5 | 11.3 ± 0.8 |
| 4:3 | 52.5 ± 4.2 | 1.19 | 9.0 ± 1.1 | 3.2 ± 0.6 | 27.9 ± 0.5 |
| 6:3 | 66.3 ± 8.2 | 0.34 | 55.9 ± 2.6 | 12.9 ± 1.7 | 21.2 ± 0.5 |
| 7:3 | 139.2 ± 2.7 | 0.21 | 34.9 ± 2.3 | 14.4 ± 1.7 | 34.4 ± 0.7 |
| 8:3 | 120.2 ± 2.9 | 0.49 | 45.6 ± 1.9 | 9.9 ± 1.2 | 29.1 ± 0.4 |
| 9:3 | 201.0 ± 3.8 | 5.07 | 19.7 ± 1.2 | 6.9 ± 1.8 | 24.7 ± 0.5 |
Table 2.
The effect of size, poly dispersity index, encapsulation efficiency (%) and loading content (%), and zeta potential of the SF-CS nanoparticles after coating them with folic acid for the formation of SF-CS-FA nanoparticles. Optimal parameters are shown in bold.
Table 2.
The effect of size, poly dispersity index, encapsulation efficiency (%) and loading content (%), and zeta potential of the SF-CS nanoparticles after coating them with folic acid for the formation of SF-CS-FA nanoparticles. Optimal parameters are shown in bold.
| Sample | CS: SF (mg/mL) | Folic Acid (g/L) | Size (nm) | PDI | EE% | LC% | Zeta Potentials (mV) |
|---|
| SF-CS-FA | 5:3 | 0.1 | 45.8 ± 4.2 | 0.05 | 2.00 ± 0.0 | 0.0 ± 0.0 | 27.6 ± 1.6 |
| 0.2 | 49.7 ± 7.2 | 0.09 | 7.9 ± 1.0 | 0.7 ± 0.5 | 21.1 ± 1.2 |
| 0.3 | 54.5 ± 9.3 | 0.11 | 12.8 ± 1.3 | 9.2 ± 0.2 | 27.2 ± 2.1 |
| 0.4 | 57.8 ± 10.2 | 0.16 | 13.7 ± 1.4 | 8.0 ±0.3 | 25.7 ± 1.3 |
| 0.5 | 62.6 ± 12.9 | 0.13 | 15.8 ± 1.4 | 8.8 ± 1.7 | 37.4 ± 2.1 |
| 0.6 | 61.5 ± 13.7 | 0.21 | 19.9 ± 1.9 | 7.56 ± 0.6 | 39.8 ± 0.7 |
| 0.7 | 78.7 ± 11.1 | 0.20 | 49.9 ± 1.6 | 11.13 ± 1.1 | 38.5 ± 0.6 |
| 0.8 | 81.7 ± 12.9 | 0.24 | 87.9 ± 1.1 | 19.9 ± 1.4 | 37.7 ± 1.4 |
| 0.9 | 89.9 ± 10.6 | 0.26 | 88.9 ± 1.5 | 16.7 ± 1.6 | 36.4 ± 1.5 |
| 1.0 | 91.5 ± 9.9 | 0.31 | 89.8 ± 1.6 | 17.9 ± 1.0 | 37.2 ± 0.3 |
| 1.2 | 140.6 ± 9.7 | 0.50 | 76.2 ± 1.9 | 15.2 ± 1.5 | 27.4 ± 0.5 |
| 1.4 | 165.8 ± 5.5 | 0.90 | 68.6 ± 1.1 | 11.8 ± 1.1 | 22.6 ± 1.7 |
| 1.6 | 180.5 ± 10.1 | 1.89 | 55.9 ± 1.2 | 9.7 ± 0.7 | 23.8 ± 1.5 |
| 1.8 | 289.9 ± 7.8 | 2.67 | 64.9 ± 0.3 | 7.7 ± 1.7 | 26.7 ± 0.5 |
| 2.0 | 298.1 ± 5.9 | 3.83 | 75.6 ± 1.9 | 4.9 ± 1.2 | 29.7 ± 0.5 |
Table 3.
The percentages of LC and EE of SF-CS and SF-CS-FA NPs at the optimum amount of CS, SF, and FA.
Table 3.
The percentages of LC and EE of SF-CS and SF-CS-FA NPs at the optimum amount of CS, SF, and FA.
| Synthesized Nanoparticle | Loading-Content (%) | Encapsulation-Efficiency (%) |
|---|
| SF-CS | 18.2 ± 1.3 | 83.7 ± 2.4 |
| SF-CS-FA | 19.9 ± 1.4 | 87.9 ± 1.1 |
Table 4.
Elemental compositions; atomic% and weight% of the nanoparticles obtained by the EDX analysis.
Table 4.
Elemental compositions; atomic% and weight% of the nanoparticles obtained by the EDX analysis.
|
Atomic and Weight %
|
Element (%)
|
SF-CS NPs
|
SF-CS-FA NPs
|
CS-NPs
|
| Atomic% | C | 46.9 | 48.9 | 36.4 |
| N | 7.6 | 14.2 | - |
| O | 38.6 | 32.5 | 50.1 |
| F | 4.2 | 2.9 | - |
| P | 2.4 | 0.5 | 7.6 |
| Cl | 0.6 | 0.3 | - |
| S | - | 0.5 | - |
| Na | - | - | 5.8 |
| Weight% | C | 39.1 | 42.4 | 27.2 |
| N | 6.4 | 14.7 | 2.6 |
| O | 40.1 | 35.3 | 39.2 |
| F | 5.6 | 3.9 | - |
| P | 5.3 | 1.2 | 14.7 |
| Cl | 1.6 | 0.5 | - |
| S | 0.8 | 1.3 | - |
| Na | 1.3 | 0.6 | 13.96 |
Table 5.
Correlation coefficient value (R2) of kinetics release of SF from its SF-CS and SF-CS-FA nanoparticles into PBS solutions at pH 7.4 and 4.8 using the first-order, pseudo-first-order, pseudo-second-order kinetics, Higuchi, Hixon-Cromwell, and Korsmeyer Peppas models and the pseudo-second-order rate constant, K2 (mg/min).
| Sample | Max Release (%) | Pseudo-First-Order | Pseudo-Second-Order | First-order | Higuchi | Korsmeyer-Peppas | Hixon-Crowell | Pseudo Second Order Rate Constant (mg/min)
K2 |
|---|
| SF-CS | 98 | 0.0388 | 0.9977 | 0.3971 | 0.8246 | 0.8677 | 0.4885 | 7.2 × 10⁻³ |
| SF-CS-FA | 88 | 0.8053 | 0.9877 | 0.3970 | 0.8246 | 0.8677 | 0.4533 | 8.5 × 10⁻³ |
| SF-CS | 99 | 0.8053 | 0.9999 | 0.3961 | 0.8246 | 0.8677 | 0.4533 | 7.6 × 10⁻⁶ |
| SF-CS-FA | 93 | 0.8053 | 0.9988 | 0.3970 | 0.8246 | 0.8677 | 0.4533 | 7.2 × 10⁻⁶ |
Table 6.
The half-maximal inhibitory concentration (IC50) value for chitosan (CS), pristine sorafenib (SF), SF-CS, and SF-CS-FA nanoparticles tested on normal HDFa cells, HepG2 and HT29 cell lines.
Table 6.
The half-maximal inhibitory concentration (IC50) value for chitosan (CS), pristine sorafenib (SF), SF-CS, and SF-CS-FA nanoparticles tested on normal HDFa cells, HepG2 and HT29 cell lines.
| Nanoparticles | HDFa | HepG2 | HT29 |
|---|
| IC50 (μg/mL) |
| Chitosan | N.C | N.C | N.C |
| Sorafenib | N.C | 21.6 ± 1.0 | 16.8 ± 1.8 |
| SF-CS | N.C | 20.3 ± 1.5 | 15.9 ± 2.0 |
| SF-CS-FA | N.C | 14.5 ± 2.5 | 13.0 ± 1.3 |


 ,
, 


