Abstract
L10 ordered FePt and FePtCu nanoparticles (NPs) with a good dispersion were successfully fabricated by a simple, green, one-step solid-phase reduction method. Fe (acac)3, Pt (acac)2, and CuO as the precursors were dispersed in NaCl and annealed at different temperatures with an H2-containing atmosphere. As the annealing temperature increased, the chemical order parameter (S), average particle size (D), coercivity (Hc), and saturation magnetization (Ms) of FePt and FePtCu NPs increased and the size distribution range of the particles became wider. The ordered degree, D, Hc, and Ms of FePt NPs were greatly improved by adding 5% Cu. The highest S, D, Hc, and Ms were obtained when FePtCu NPs annealed at 750 °C, which were 0.91, 4.87 nm, 12,200 Oe, and 23.38 emu/g, respectively. The structure and magnetic properties of FePt and FePtCu NPs at different annealing temperatures were investigated and the formation mechanism of FePt and FePtCu NPs were discussed in detail.
1. Introduction
Magnetic nanomaterials, one kind of the most important functional materials, have been widely used in many fields. Among various magnetic nanomaterials, chemically ordered L10-FePt has attracted much attention because of its very high magnetocrystalline anisotropy constant (Ku) (7 × 10⁷ ergs/cc), which allows very low critical superparamagnetic size (~ 3–4 nm), high Curie temperature, good chemical stability, and biological compatibility [1,2,3]. These properties promote the important potential applications of L10-FePt in the high-density magnetic recording medium [4,5], high performance permanent magnetic materials [6,7], catalysts [8,9], and biological applications [10,11,12,13].
In 2000, Sun et al. successfully prepared mono-disperse spherical FePt nanoparticles (NPs) by using a thermal decomposition method [14]. Fe (CO)5 and Pt (acac)2 were used as Fe and Pt sources, respectively, to decompose Fe (CO)5 at high temperature (297 °C) in a dioctyl ether solvent containing surfactant of oleic acid and oleylamine and to reduce Pt (acac)2 with hexadecanediol to obtain FePt nanoparticles of face-center cubic (FCC) phase. Since the pioneering work of Sun et al., the size and morphology control of FePt NPs have been extensively studied. FePt nanorods [15,16], nanowires [17,18], nano-cubes [19], and coral-shaped [20,21] NPs of the fcc phase have been successfully prepared. However, FePt NPs with fcc phase show low magneto-crystal anisotropy and soft magnetic or superparamagnetic at room temperature which greatly limits their applications. In general, in order to obtain L10-FePt, samples need to be heat treated above 500 °C, which causes undesirable agglomeration and sintering of FePt NPs. For preventing sintering and agglomeration during the annealing process, coating fcc-FePt NPs with a layer of high melting point material (MgO or SiO2) was proposed [22,23]. This method requires multi-step operations: firstly, fcc-FePt NPs are synthesized by the liquid phase method, then coating fcc-FePt NPs with MgO or SiO2, finally carrying out heat treatment and shell removal. Subsequently, heat treatment of the prepared fcc-FePt NPs in salt baths was proposed. All of these methods require multiple steps to prepare L10-FePt NPs. In addition, reducing the ordering temperature of FePt is also an option to prevent FePt NPs from agglomeration and sintering. The ordering temperature of FePt can be reduced by adding about Cu, Ag, or Au elements [24,25]. Wang et al. also reported that the addition of 29% Ag could reduce the ordering temperature of FePt nanoparticles to 400 °C [26]. However, the proportion of L10-FePt fabricated by this method was low and the coercivity was only 7600 Oe. Moreover, a large amount of Ag would greatly reduce the saturation magnetization of the sample.
In this study, a simple, green, and high-yield one-step solid-phase reduction method for L10-FePt NPs was proposed. In this method, the precursors of Fe (acac)3 and Pt (acac)2 were directly mixed with NaCl by ball milling and then annealed at certain temperatures. Since Fe (CO)5 produced toxic CO gas during thermal decomposition, Fe (acac)3 was used as the Fe source in this study. In the study, NaCl was not only used as a substrate when FePt NPs are generated but also as a separating material to prevent FePt NPs from agglomeration and sintering. This method does not require any organic solvents, surfactants, chelators or catalysts. The composition of FePt NPs can be easily adjusted by changing the ratio of precursors. The magnetic properties of FePt NPs can be adjusted by controlling the annealing temperature. Besides, 5% CuO was added to the precursors, which successfully reduced the FePt ordering temperature and improved the magnetic properties of FePt NPs. The structure, magnetic properties, and formation mechanism of FePt and FePtCu NPs at different heat treatment temperatures have been investigated and discussed.
2. Materials and Methods
In this work, the precursors, Fe (III) acetylacetonate (Fe (acac)3 99.9%) and Pt (II) acetylacetonate (Pt (acac)2 98%), were provided by Aladdin, Shanghai, China. CuO (99%) was purchased from Alfa Aesar, Shanghai, China. NaCl (99.5%) was provided by Aladdin, Shanghai, China, and was dried in an oven at 80 °C for 4 h before used. All the reagents were used without further purification. For preparing the L10-FePt nanoparticles, NaCl was ball milled for 12 h and then Pt (acac)2 and Fe (acac)3 at the mole ratio of 1:1 were mixed with NaCl and ball milled for another 24 h. The weight ratio of the precursors and salt was fixed at 1:1000. In this work, all samples were ball milled in one batch (FePt in 2 ball milled pots, FePtCu in another 2). Then, the powder was put into arks and annealed at 400, 500, 550, 600, 650, 700 and 750 °C for 2 h in a tube furnace under a 5% H2 and 95% Ar mixed gas atmosphere. The flow rate of gas was kept at 40 sccm. The heating rate was 10 °C/min. At each annealing temperature, two arks (one was for FePt series, another was for FePtCu series) were put in the furnace. After annealing, the samples were cooled down to room temperature in the reducing gas atmosphere and then were washed with de-ionized water for several times to remove NaCl. The preparation method of FePtCu NPs was the same as that of L10-FePt NPs, which just added an extra 5% CuO in the precursors.
A vibrating sample magnetometer (VSM) in the physical property measurement system (PPMS) was utilized to measure the magnetic properties of the samples at 300 K. The electron probe x-ray microanalysis (EPMA) was utilized to determine the elemental compositions of the samples. The structural analysis was performed by X-ray diffraction (XRD) with Cu Kα radiation (SmartLabTM X, Rigaku Corporation, Tokyo, Japan). The morphology and the lattice fringes of nanoparticles were characterized by transmission electron microscope (TEM)(JME-2100, JEOL Ltd., Tokyo, Japan). For TEM observation, the powder sample was dispersed in alcohol and then dropped onto a carbon film supported on a copper grid.
3. Results
Figure 1 shows the XRD patterns of FePt and FePtCu nanoparticles at different annealing temperatures. It can be seen that the FePt NPs prepared at 400 °C shows the fcc structure. The (111), (200), (220), and (311) peaks appear but the characteristic peaks for L10-FePt, such as (001), (110), and (002) peaks, are not found. With the temperature increases, the peaks shift to the high angle which means that FePt NPs started to form the L10 phase. When the temperature increases to 600 °C, the superlattice peaks (001) and (110) show up. With the further increase of the temperature, (002), (201), (112), and (202) peaks that belonged to L10-FePt are detected. It should be noticed that when the temperature is higher than 650 °C, a bimodal phenomenon occurs at the (111) peak, which means that both the fcc phase and the L10 phase of FePt exist in the sample even when the temperature reached 750 °C. FePtCu NPs are similar to FePt NPs. It should be noticed that FePtCu NPs that annealed at 550 °C have a weak peak corresponding to (110), which is almost undetectable. When the temperature reaches 750 °C, the bimodal phenomenon disappears and the (200) and (002) peaks are clearly separated, which suggests the higher ratio of the L10 phase. For both FePt and FePtCu samples, the higher the annealing temperature, the stronger the observed characteristic peaks of the L10 phase.
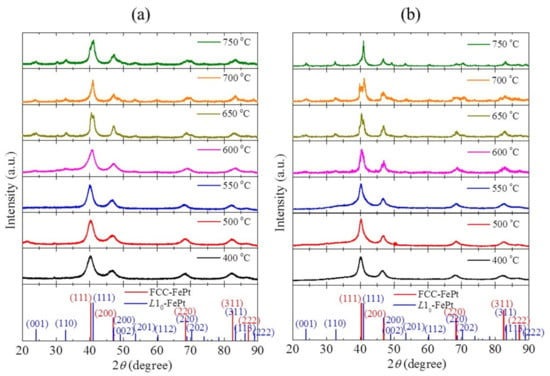
Figure 1.
XRD patterns of (a) FePt and (b) FePtCu nanoparticles at different annealing temperatures.
The ordered degree of FePt can be reflected by the chemical order parameter (S) [27]. The S can be calculated from the following equation [28]: , where I001 and I002 are the intensities of the (001) and (002) peaks. Figure 2 shows the S of FePt and FePtCu NPs at different annealing temperatures. For both FePt and FePtCu NPs, S increases with the increasing annealing temperature. S of FePt NPs increases from 0.72 to 0.85 when the annealing temperature increases from 600 to 750 °C, and that of FePtCu NPs increases from 0.74 to 0.91. It can be found that the FePtCu NPs have higher S than that of FePt NPs at the same temperature, which means that FePtCu needs a lower annealing temperature to reach the same ordered degree. S of FePtCu NPs annealed at 750 °C can reach 0.91. The improved S and the reduction of the ordering temperature of FePt alloying by adding Cu also have been proved by other works [24,25].
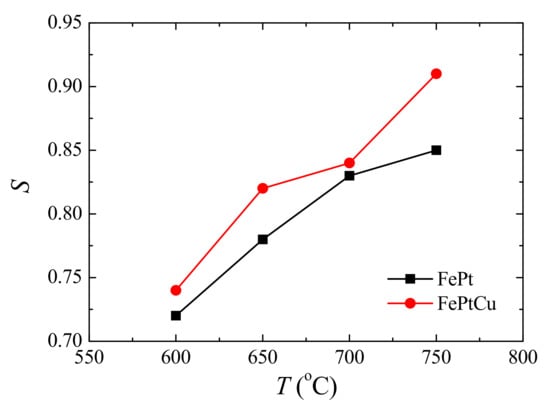
Figure 2.
Chemical order parameter (S) of FePt and FePtCu nanoparticles at different annealing temperatures.
TEM and HRTEM images of the FePt and FePtCu NPs annealed at different temperatures are shown in Figure 3. The samples were dispersed in alcohol and dropped onto a carbon film supported on a copper grid to test, no surfactant was used; therefore, the particles look like little aggregates. From the HRTEM images, the particles show a good dispersion that no sintering or coalescence was observed which means that NaCl can effectively prevent FePt from coalescing or sintering during the annealing process. The size distributions of the particles are shown in Figure 3 (insert images). In each case, over 200 particles were counted to determine the particle size and particle size dispersion.
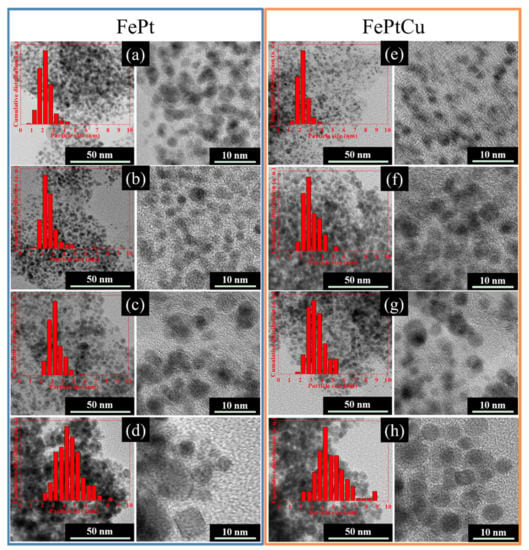
Figure 3.
TEM and HRTEM images of the FePt nanoparticles(NPs) annealed at (a) 400 °C, (b) 550 °C, (c) 650 °C, and (d) 750 °C and FePtCu NPs obtained at (e) 400 °C, (f) 550 °C, (g) 650 °C, and (h) 750 °C. The insets are the size distribution of the particles.
The elements distribution of the FePt and FePtCu NPs was further investigated by STEM-EDS elemental mapping. As shown in Figure 4, Fe (red), Pt (yellow), and Cu (blue) elements are uniformly distributed over the particles, which demonstrates an alloyed nanostructure. There are no rich domains of Fe, Pt or Cu in the samples.
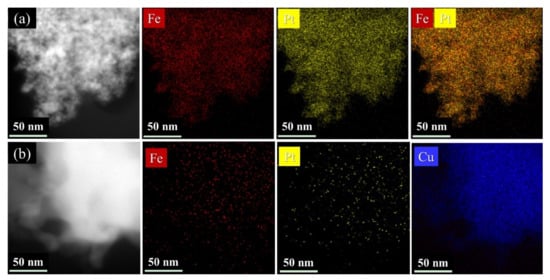
Figure 4.
Scanning transmission electron microscopy - energy dispersive X-ray spectroscopy(STEM-EDS) element mapping of (a) FePt and (b) FePtCu NPs synthesized at 750 °C.
The average particle sizes (D) of FePt and FePtCu NPs are shown in Figure 5. For both FePt and FePtCu NPs, with the increasement of annealing temperature, D increases and the size distribution range becomes wider. It is clear that the D of FePtCu NPs are larger than that of FePt NPs, which means that adding Cu can increase the particle size of FePt NPs. The D of FePt and FePtCu NPs annealed at 400 °C are 2.23 and 2.22 nm, respectively. The size distribution of these two samples ranges from 0.50 to 4.50 nm, and over 90% of the particles are smaller than 3 nm. D of FePt NPs annealed at 550 °C slightly increase to 2.60, and a small number of large size particles (6–7 nm) appear. Compared with FePt NPs, FePtCu NPs annealed at 550 °C have larger D and the amount of particles with the particle size larger than 3 nm is much larger than that of FePt NPs. When the temperature rises to 650 °C, the D of FePt and FePtCu NPs increase to 3.24 and 3.47, respectively. When the annealing temperature further increases to 750 °C, the D of FePt and FePtCu NPs increase to 4.49 and 4.83, respectively. The size distribution of samples annealed at 750 °C ranges from 2 to 9 nm, which is much wider than that of samples annealed at lower temperatures. There are also some particles smaller than 3 nm and some particles with the size around 9 nm appearing.
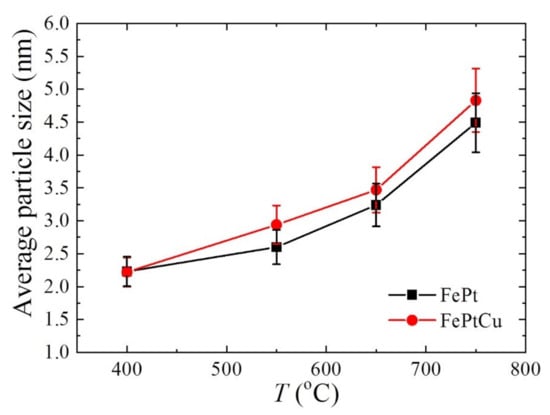
Figure 5.
Average particle size (D) of FePt and FePtCu nanoparticles at different annealing temperatures.
The magnetic hysteresis (M-H) loops were measured by PPMS at 300 K in order to find out how the annealing temperature influences the magnetic properties of the NPs. Figure 6 shows some typical M-H loops of (a) FePt and (b) FePtCu NPs, (c) overlap of the M-H loops of FePt and FePtCu annealed at 750 °C, and (d) the coercivity (Hc) and (e) saturation magnetization (Ms) of FePt and FePtCu NPs at different annealing temperatures. It is shown that the Ms and Hc of FePt and FePtCu NPs annealed at 400 °C are very small. The magnetic properties of FePt NPs are related to the S and morphology of NPs. FePt and FePtCu NPs annealed at 400 °C are the fcc phase, which indicates low Ku and small particle size (2.22 nm). The Hc and Ms of FePtCu NPs annealed at 550 °C are 1730 Oe and 13.07 emu/g, respectively, which are much larger than those of FePt NPs. A total of 82% of FePt NPs annealed at 550 °C are smaller than 3 nm, which essentially make no contribution to Ms at 300 K (room temperature). The saturation magnetization of each particle (ms) is highly volume-dependent because it arises from the collective interaction of atomic magnetic dipoles. As mentioned above, adding Cu can increase the order degree and particle size of FePt NPs. FePtCu NPs annealed at 550 °C have a higher order degree and 39% of the particles are larger than 3 nm, which is twice as large as that of FePt NPs. This is the reason that FePtCu NPs annealed at 550 °C show larger Ms than that of FePt NPs. As shown in Figure 6e, when the annealing temperature increases, the Ms of FePt and FePtCu NPs increases. This is because the S and D of FePt and FePtCu NPs increase as the annealing temperature increases, and, correspondingly, the Ms of FePt and FePtCu NPs also increases. FePtCu NPs show larger Hc and higher Ms than those of FePt NPs due to the fact that adding Cu can improve S and D of NPs. From TEM images, all the observed NPs are single crystal. According to the Stoner-Wohlfarth model [29], for each single crystal particle, Hc = Hk = 2Ku/ms, where Hk is the effective anisotropic field. Thus, Hc of FePt and FePtCu NPs depends on Ku versus ms, Ku is dependent on S of the particles, and ms is dependent on the volume of particles. As shown in Figure 6d, FePtCu NPs have larger Hc than that of FePt NPs (except annealing at 650 °C), which indicates that FePtCu NPs have much larger Ku than that of FePt NPs, which means that adding Cu can greatly improve Ku of FePt NPs. Figure 6c shows the overlap of M-H loops of FePt and FePtCu annealed at 750 °C; solid lines show one batch (B1) of samples while dashed lines show another batch (B2) of samples. The Hc and Ms of FePtCu NPs annealed at 750 °C can reach 12,200 Oe and 23.38 emu/g, respectively. It should be noticed that the M-H loops of FePt and FePtCu NPs annealed at 750 °C show a step where complex magnetic states appeared. This is caused by the wide size of the distribution range of FePt and FePtCu NPs annealed at 750 °C. The Hc and Ms of FePtCu NPs annealed at 750 °C are not as high as expected even though S is high (0.91). This is because FePtCu NPs are single crystal with D of 4.83 nm and some of the particles are smaller than 3 nm. The shapes of the M-H curves of FePt and FePtCu NPs were different, this might be caused by the differences of the size-dispersion and S between FePt and FePtCu NPs. Both FePt and FePtCu NPs prepared at different batches annealed at 750 °C have similar shapes and the same Ms and Hc, which means good reproducibility between them.
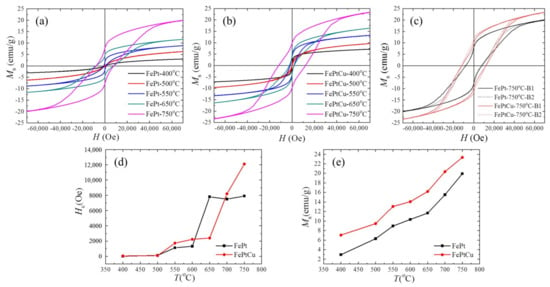
Figure 6.
Magnetic hysteresis (M–H) loops of (a) FePt and (b) FePtCu NPs, (c) overlap of the M-H loops of FePt and FePtCu annealed at 750 °C (dashed lines show the other batch of samples), (d) the coercivity (Hc) and (e) saturation magnetization (Ms) of FePt and FePtCu NPs at different annealing temperatures.
The formation mechanism of the FePtCu NPs is shown as follows: Thermal decomposition of Fe (acac)3 and Pt (acac)2 occurs around 200 °C. At the same time, CuO is reduced to Cu by H2 gas. Fe, Pt, and Cu atoms nucleate and form NPs with a chemically disordered fcc structure. The driving forces for forming NPs are likely the Brownian motion and Van der Waals attraction. At this stage, Cu atoms are distributed inside the FePt lattice, which increases the atomic diffusivity and enhances the kinetics of ordering [30]. The reactions involved are shown as follows:
Pt (C10H14O4) → Pt + H2O + C
Fe (C15H21O6) → Fe + H2O + C
CuO + H2 → Cu + H2O
No harmful products are present, and no organic solvents, surfactants, chelators, and catalysts are required.
4. Conclusions
A simple, green, one-step solid-phase reduction method was proposed to fabricate L10-ordered FePt and FePtCu NPs. Fe (acac)3, Pt (acac)2 and CuO as the precursors were dispersed in NaCl and annealed at 400, 550, 600, 650, 700, and 750 °C in an H2-Ar mixed atmosphere. The particles had good dispersion and no sintering or coalescence was observed. All the observed NPs are single crystal. When the annealing temperature increased, S, D, Hc, and Ms of FePt and FePtCu NPs increased and the size distribution of the particles became wider. Adding 5% Cu could greatly improve the magnetic properties and morphology of FePt NPs, which was ascribed to Cu atoms distributed inside the FePt lattice, increasing the atomic diffusivity and enhancing the kinetics of ordering. The highest S, D, Hc, and Ms could be obtained when FePtCu nanoparticles were annealed at 750 °C, which were 0.91, 4.87 nm, 12,200 Oe, and 23.38 emu/g, respectively. The samples prepared by the current method were too polydisperse, which might hinder their applications. The size dispersion and magnetic properties of FePt NPs could be improved by using a proper weight ratio of the precursors and salt (fixed at 1:1000 in this work). If the precursors (Fe (acac)3 and Pt (acac)2) dissolved in acetone, it would improve the mixing uniformity of precursors, which might help to improve the size dispersion and magnetic properties of FePt NPs.
Author Contributions
Conceptualization, L.Z.; methodology, L.Z.; software, Y.C. and H.L. (Huan Liu); validation, L.Z., J.X. and W.H.; formal analysis, L.Z.; investigation, H.L. (Hongjie Lu) and X.D.; resources, W.H.; data curation, Q.L.; writing—original draft preparation, X.D.; writing—review and editing, L.Z.; visualization, D.G.; supervision, L.Z., J.X. and W.H.; project administration, L.Z.; funding acquisition, W.H.; All authors have read and agreed to the published version of the manuscript.
Funding
This research received no external funding.
Data Availability Statement
Data sharing not applicable.
Conflicts of Interest
The authors declare no conflict of interest.
References
- Watanabe, M.; Masumoto, T.; Ping, D.H.; Hono, K. Microstructure and magnetic properties of FePt–Al–O granular thin films. Appl. Phys. Lett. 2000, 76, 3971–3973. [Google Scholar] [CrossRef]
- Kuo, C.M.; Kuo, P.C.; Wu, H.C. Microstructure and magnetic properties of Fe100−xPtx alloy films. J. Appl. Phys. 1999, 85, 2264–2269. [Google Scholar] [CrossRef]
- Weller, D.; Moser, A.; Folks, L.; Best, M.E. High Ku materials approach to 100 Gbits/in2. IEEE Trans. Magn. Mag. 2000, 36, 10–15. [Google Scholar] [CrossRef]
- Bandic, Z.; Victora, R.H. Advances in Magnetic Data Storage Technologies. Proc. IEEE 2008, 96, 1749–1753. [Google Scholar] [CrossRef]
- Sun, S. Recent Advances in Chemical Synthesis, Self-Assembly, and Applications of FePt Nanoparticles. Adv. Mater. 2006, 18, 393–403. [Google Scholar] [CrossRef]
- Gutfleisch, O.; Lyubina, J.; Müller, K.H.; Schultz, L. FePt Hard Magnets. Adv. Eng. Mater. 2005, 7, 208–212. [Google Scholar] [CrossRef]
- Dahmane, Y.; Cagnon, L.; Voiron, J.; Pairis, S.; Bacia, M.; Ortega, L.; Benbrahim, N.; Kadri, A. Magnetic and structural properties of electrodeposited CoPt and FePt nanowires in nanoporous alumina templates. J. Phys. D Appl. Phys. 2006, 39, 4523. [Google Scholar] [CrossRef]
- Li, S.; Hou, P.; Liu, C.; Gao, L.; Liu, B.; Zhang, L.; Song, M.; Cheng, H.M. Wall-number selective growth of vertically aligned carbon nanotubes from FePt catalysts: A comparative study with Fe catalysts. J. Mater. Chem. 2012, 22, 14149–14154. [Google Scholar] [CrossRef]
- Ohashi, T.; Iwama, H.; Shima, T. Growth of vertically aligned single-walled carbon nanotubes with metallic chirality through faceted FePt-Au catalysts. J. Appl. Phys. 2016, 119, 084303.1–084303.8. [Google Scholar] [CrossRef]
- Hong, R.; Fischer, N.O.; Emrick, T.; Rotello, V.M. Surface PEGylation and ligand exchange chemistry of FePt nanoparticles for biological applications. Chem. Mater. 2005, 17, 4617–4621. [Google Scholar] [CrossRef]
- Jha, D.K.; Saikia, K.; Chakrabarti, S.; Bhattacharya, K.; Varadarajan, K.S.; Patel, A.B.; Goyary, D.; Chattopadhyay, P.; Deb, P. Direct one-pot synthesis of glutathione capped hydrophilic FePt-CdS nanoprobe for efficient bimodal imaging application. Mater. Sci. Eng. C Mater. Biol. Appl. 2017, 72, 415–424. [Google Scholar] [CrossRef] [PubMed]
- Reiss, B.D.; Mao, C.; Solis, D.J.; Ryan, K.S.; Belcher, A.M. Biological Routes to Metal Alloy Ferromagnetic Nanostructures. Nano Lett. 2015, 4, 1127–1132. [Google Scholar] [CrossRef]
- Wang, J.; Yue, L.; Hu, Z.; Dai, Z.; Qi, Y.; Zheng, X.; Li, Z.; Yu, D. Multifunctional FePt–Au heterodimers: Promising nanotheranostic agents for dual-modality MR/CT imaging diagnosis and in situ cancer therapy. RSC Adv. 2016, 6, 107331–107336. [Google Scholar] [CrossRef]
- Sun, S. Monodisperse FePt Nanoparticles and Ferromagnetic FePt Nanocrystal Superlattices. Cheminform 2000, 287, 1989–1992. [Google Scholar] [CrossRef] [PubMed]
- Chen, M.; Pica, T.; Jiang, Y.B.; Li, P.; Yano, K.; Liu, J.P.; Datye, A.K.; Fan, H. Synthesis and Self-Assembly of fcc Phase FePt Nanorods. J. Am. Chem. Soc. 2007, 129, 6348–6349. [Google Scholar] [CrossRef]
- Zhang, Y.; Wang, Q. Magnetic-plasmonic dual modulated FePt-Au ternary heterostructured nanorods as a promising nano-bioprobe. Adv. Mater. 2012, 25, 2485–2490. [Google Scholar] [CrossRef]
- Wang, C.; Hou, Y.; Kim, J.; Sun, S. A General Strategy for Synthesizing FePt Nanowires and Nanorods. Angew. Chem. 2001, 119, 6449–6451. [Google Scholar] [CrossRef]
- Wu, C.; Pei, W.; Wang, X.; Wang, K.; Li, G.; Wang, Q. High magnetic field-induced synthesis of one-dimensional FePt nanomaterials. RSC Adv. 2016, 6, 84684–84688. [Google Scholar] [CrossRef]
- Hachisu, T.; Sato, W.; Sugiyama, A.; Osaka, T. Arrangement of FePt Nanocubes Utilizing Chemical Binding Selectivity. J. Electrochem. Soc. 2010, 157, D514–D518. [Google Scholar] [CrossRef]
- Wu, C.; Pei, W.; Huang, F.; Wang, X.; Wang, K.; He, C.; Zhao, X.; Wang, Q. Tuning the Shape of FePt Nanoparticles by Applying High Magnetic Field in Wet-Chemical Process. J. Nanosci. Nanotechnol. 2017, 17, 7003–7007. [Google Scholar] [CrossRef]
- Pei, W.; Huang, F.; Zhang, Y.; Wu, C.; You, J.; Wang, Q. Synthesis of Coral-Like FePt Nanoparticles with High Grain Boundary Density. J. Nanosci. Nanotechnol. 2017, 17, 7044–7047. [Google Scholar] [CrossRef]
- Kim, J.; Rong, C.; Liu, J.P.; Sun, S. Dispersible Ferromagnetic FePt Nanoparticles. Adv. Mater. 2009, 21, 906–909. [Google Scholar] [CrossRef]
- Yamamoto, S.; Morimoto, Y.; Ono, T.; Takano, M. Magnetically Superior and Easy to Handle L10-FePt Nanocrystals. Appl. Phys. Lett. 2005, 87, 2537. [Google Scholar] [CrossRef]
- Platt, C.L.; Wierman, K.W.; Svedberg, E.B.; Van de Veerdonk, R.; Howard, J.K.; Roy, A.G.; Laughlin, D.E. L–1 0 ordering and microstructure of FePt thin films with Cu, Ag, and Au additive. J. Appl. Phys. 2002, 92, 6104–6109. [Google Scholar] [CrossRef]
- Zhang, L.; Zhong, W.W.; Yu, S.S.; Xue, S.X.; Liu, Y.P.; Li, Z.G.; Chen, W.P. FePtCu–C granular film for perpendicular magnetic recording media. J. Alloys Compd. 2013, 560, 177–180. [Google Scholar] [CrossRef]
- Wang, H.; Shang, P.; Zhang, J.; Guo, M.; Mu, Y.; Li, Q.; Wang, H. One-step Synthesis of High-Coercivity L10-FePtAg Nanoparticles: Effect of Ag on the Morphology and Chemical Ordering of FePt Nanoparticles. Chem. Mater. 2013, 25, 2450–2454. [Google Scholar] [CrossRef]
- Yamane, H.; Narisawa, T.; Hasegawa, T.; Ishio, S. Structural characterization for L10-ordered FePt films with (001) texture by x-ray diffraction. J. Appl. Phys. 2010, 108, 113923. [Google Scholar] [CrossRef]
- Christodoulides, J.A.; Farber, P.; Dannl, M.; Okumura, H.; Hadjipanaysi, G.C.; Skumryev, V.; Simopoulos, A.; Weller, D. Magnetic, structural and microstructural properties of FePt/M (M=C, BN) granular films. IEEE Trans. Magn. 2001, 37, 1292–1294. [Google Scholar] [CrossRef]
- Stoner, E.C.; Wohlfarth, E.P. A Mechanism of Magnetic Hysteresis in Heterogeneous Alloys. Philos. Trans. R. Soc. Lond. Ser. A Math. Phys. Sci. 1948, 240, 599–642. [Google Scholar] [CrossRef]
- Maeda, T.; Kai, T.; Kikitsu, A.; Nagase, T.; Akiyama, J.I. Reduction of ordering temperature of an FePt-ordered alloy by addition of Cu. Appl. Phys. Lett. 2002, 80, 2147. [Google Scholar] [CrossRef]
Publisher’s Note: MDPI stays neutral with regard to jurisdictional claims in published maps and institutional affiliations. |
© 2021 by the authors. Licensee MDPI, Basel, Switzerland. This article is an open access article distributed under the terms and conditions of the Creative Commons Attribution (CC BY) license (https://creativecommons.org/licenses/by/4.0/).