
Effects of TiO2 Nanoparticles Incorporation into Cells of Tomato Roots

 , ,
, , 
Abstract
:1. Introduction
2. Materials and Methods
2.1. TiO2 NPs Characterization Techniques
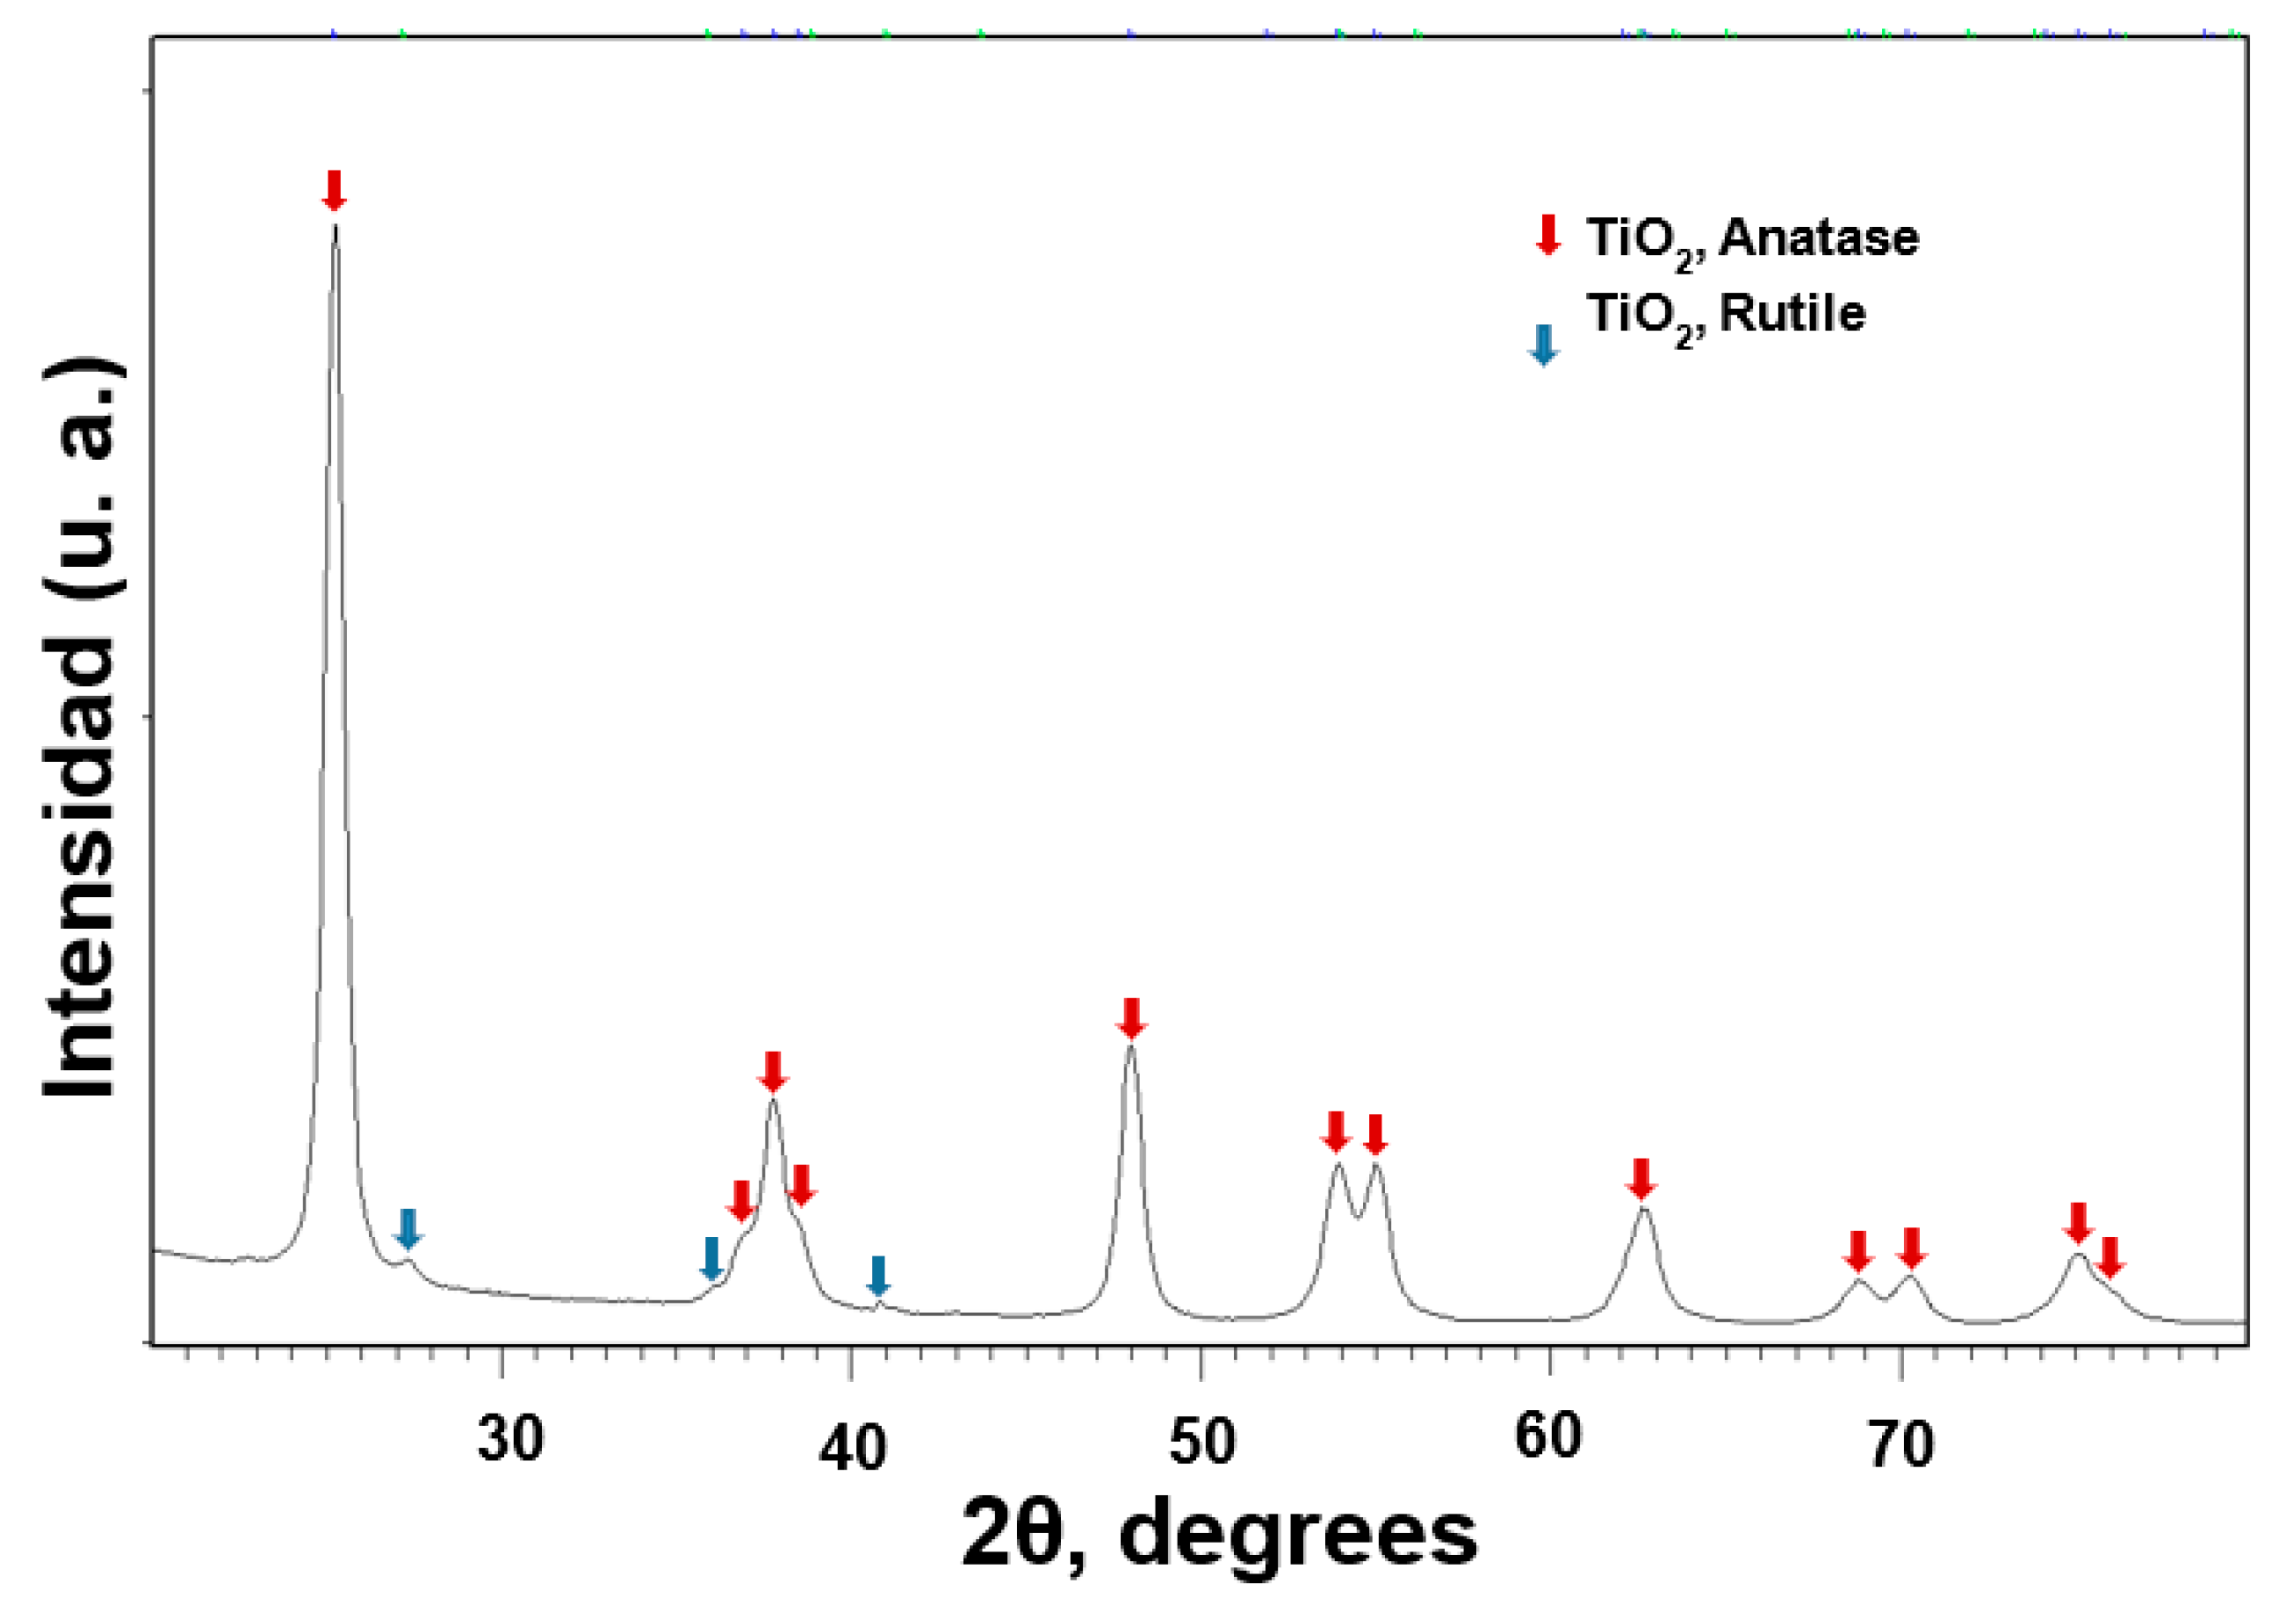
2.1.1. XRD
2.1.2. DLS
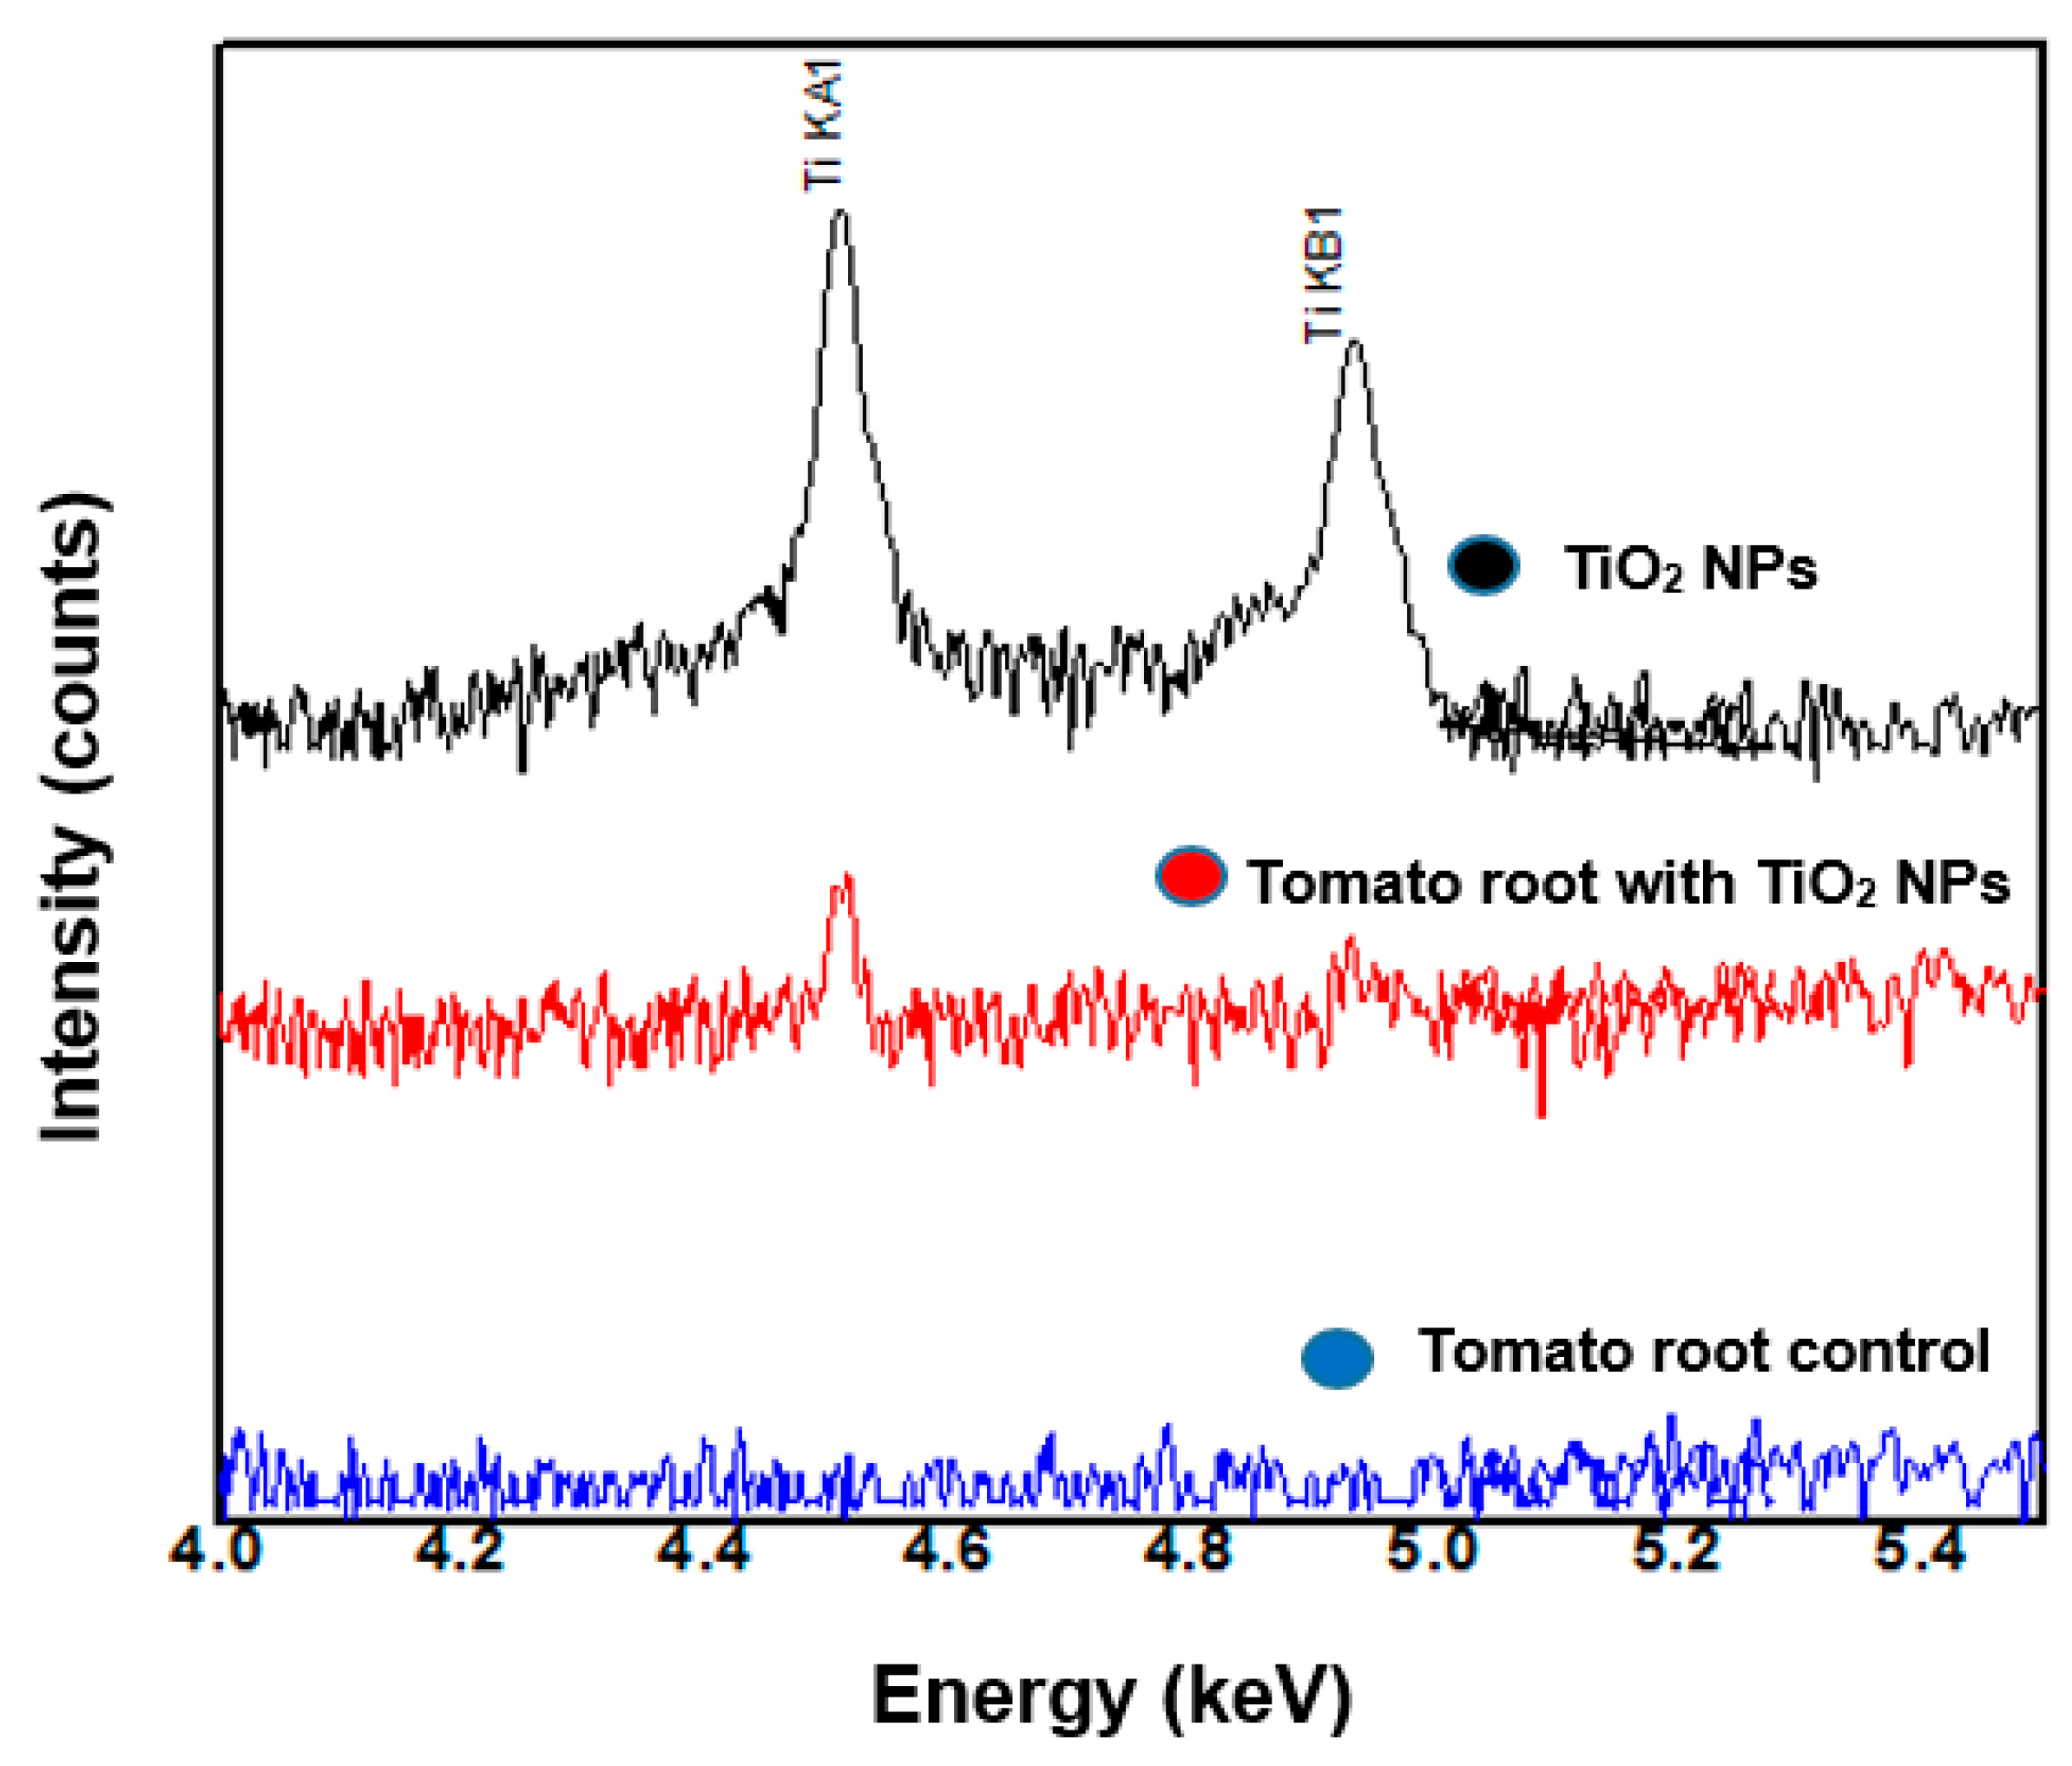
2.1.3. WDXRF
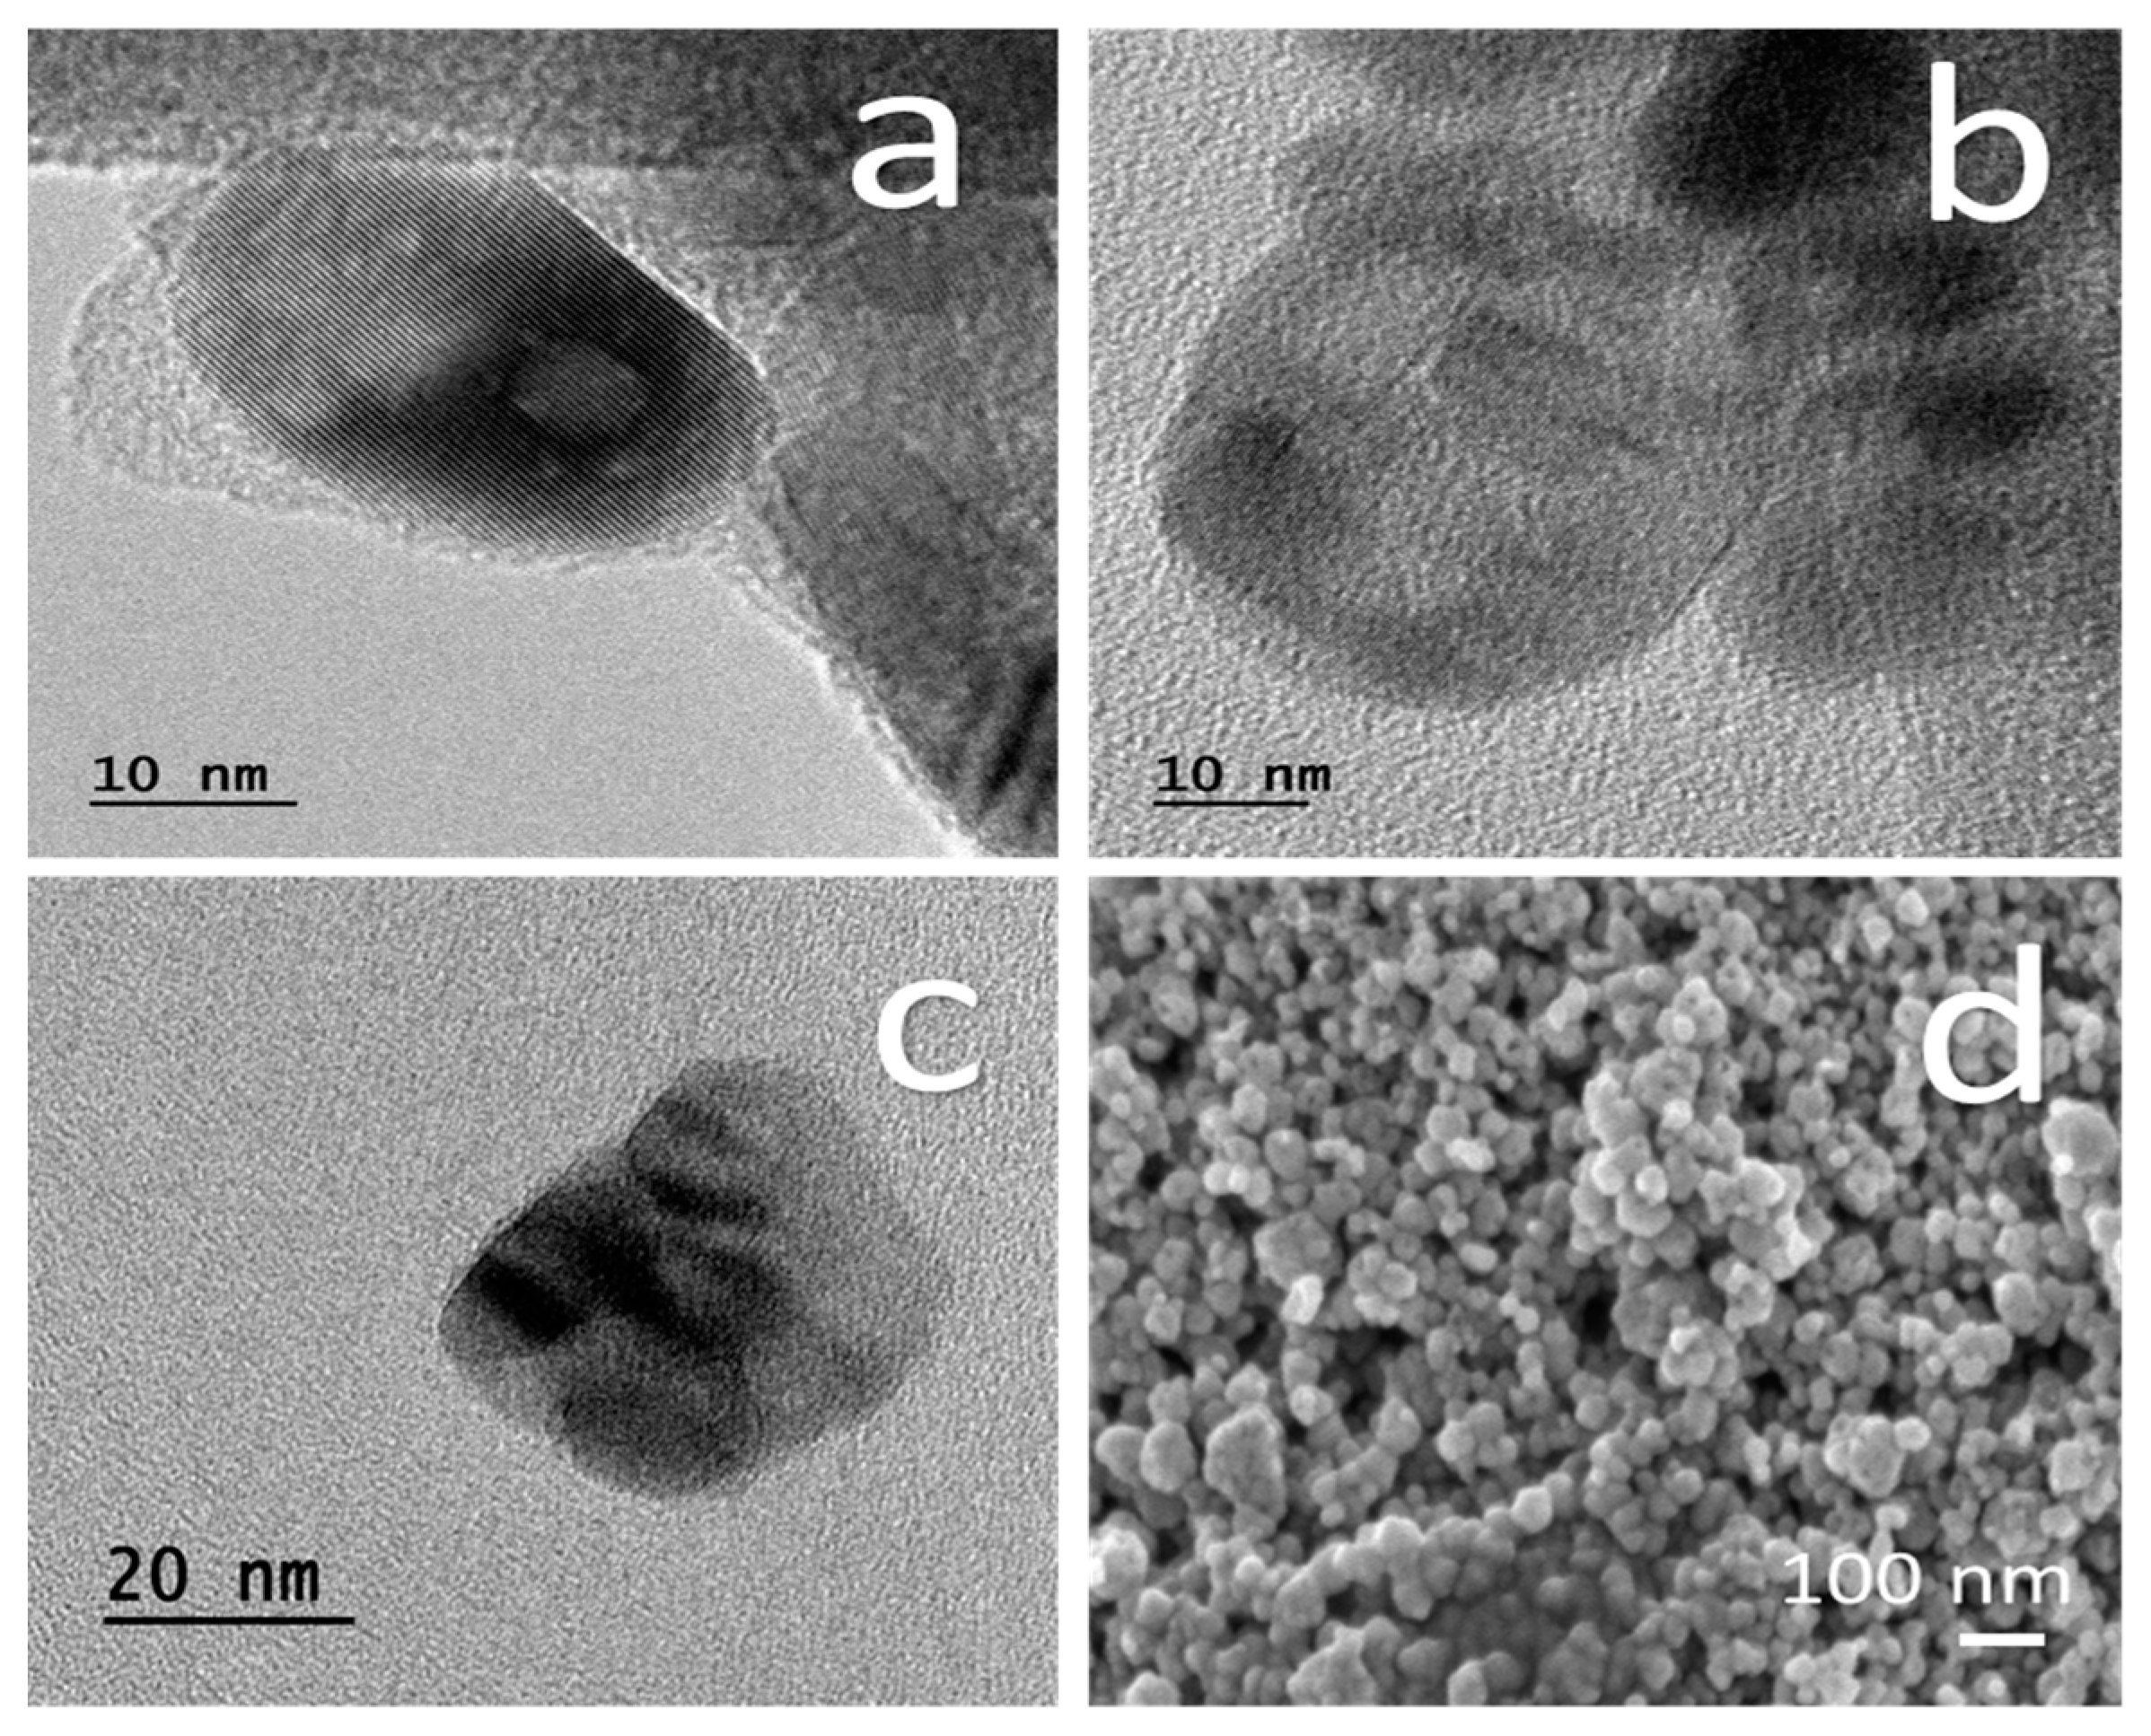
2.1.4. SEM and TEM
2.2. Plant Culture
2.2.1. Tomato Seeds
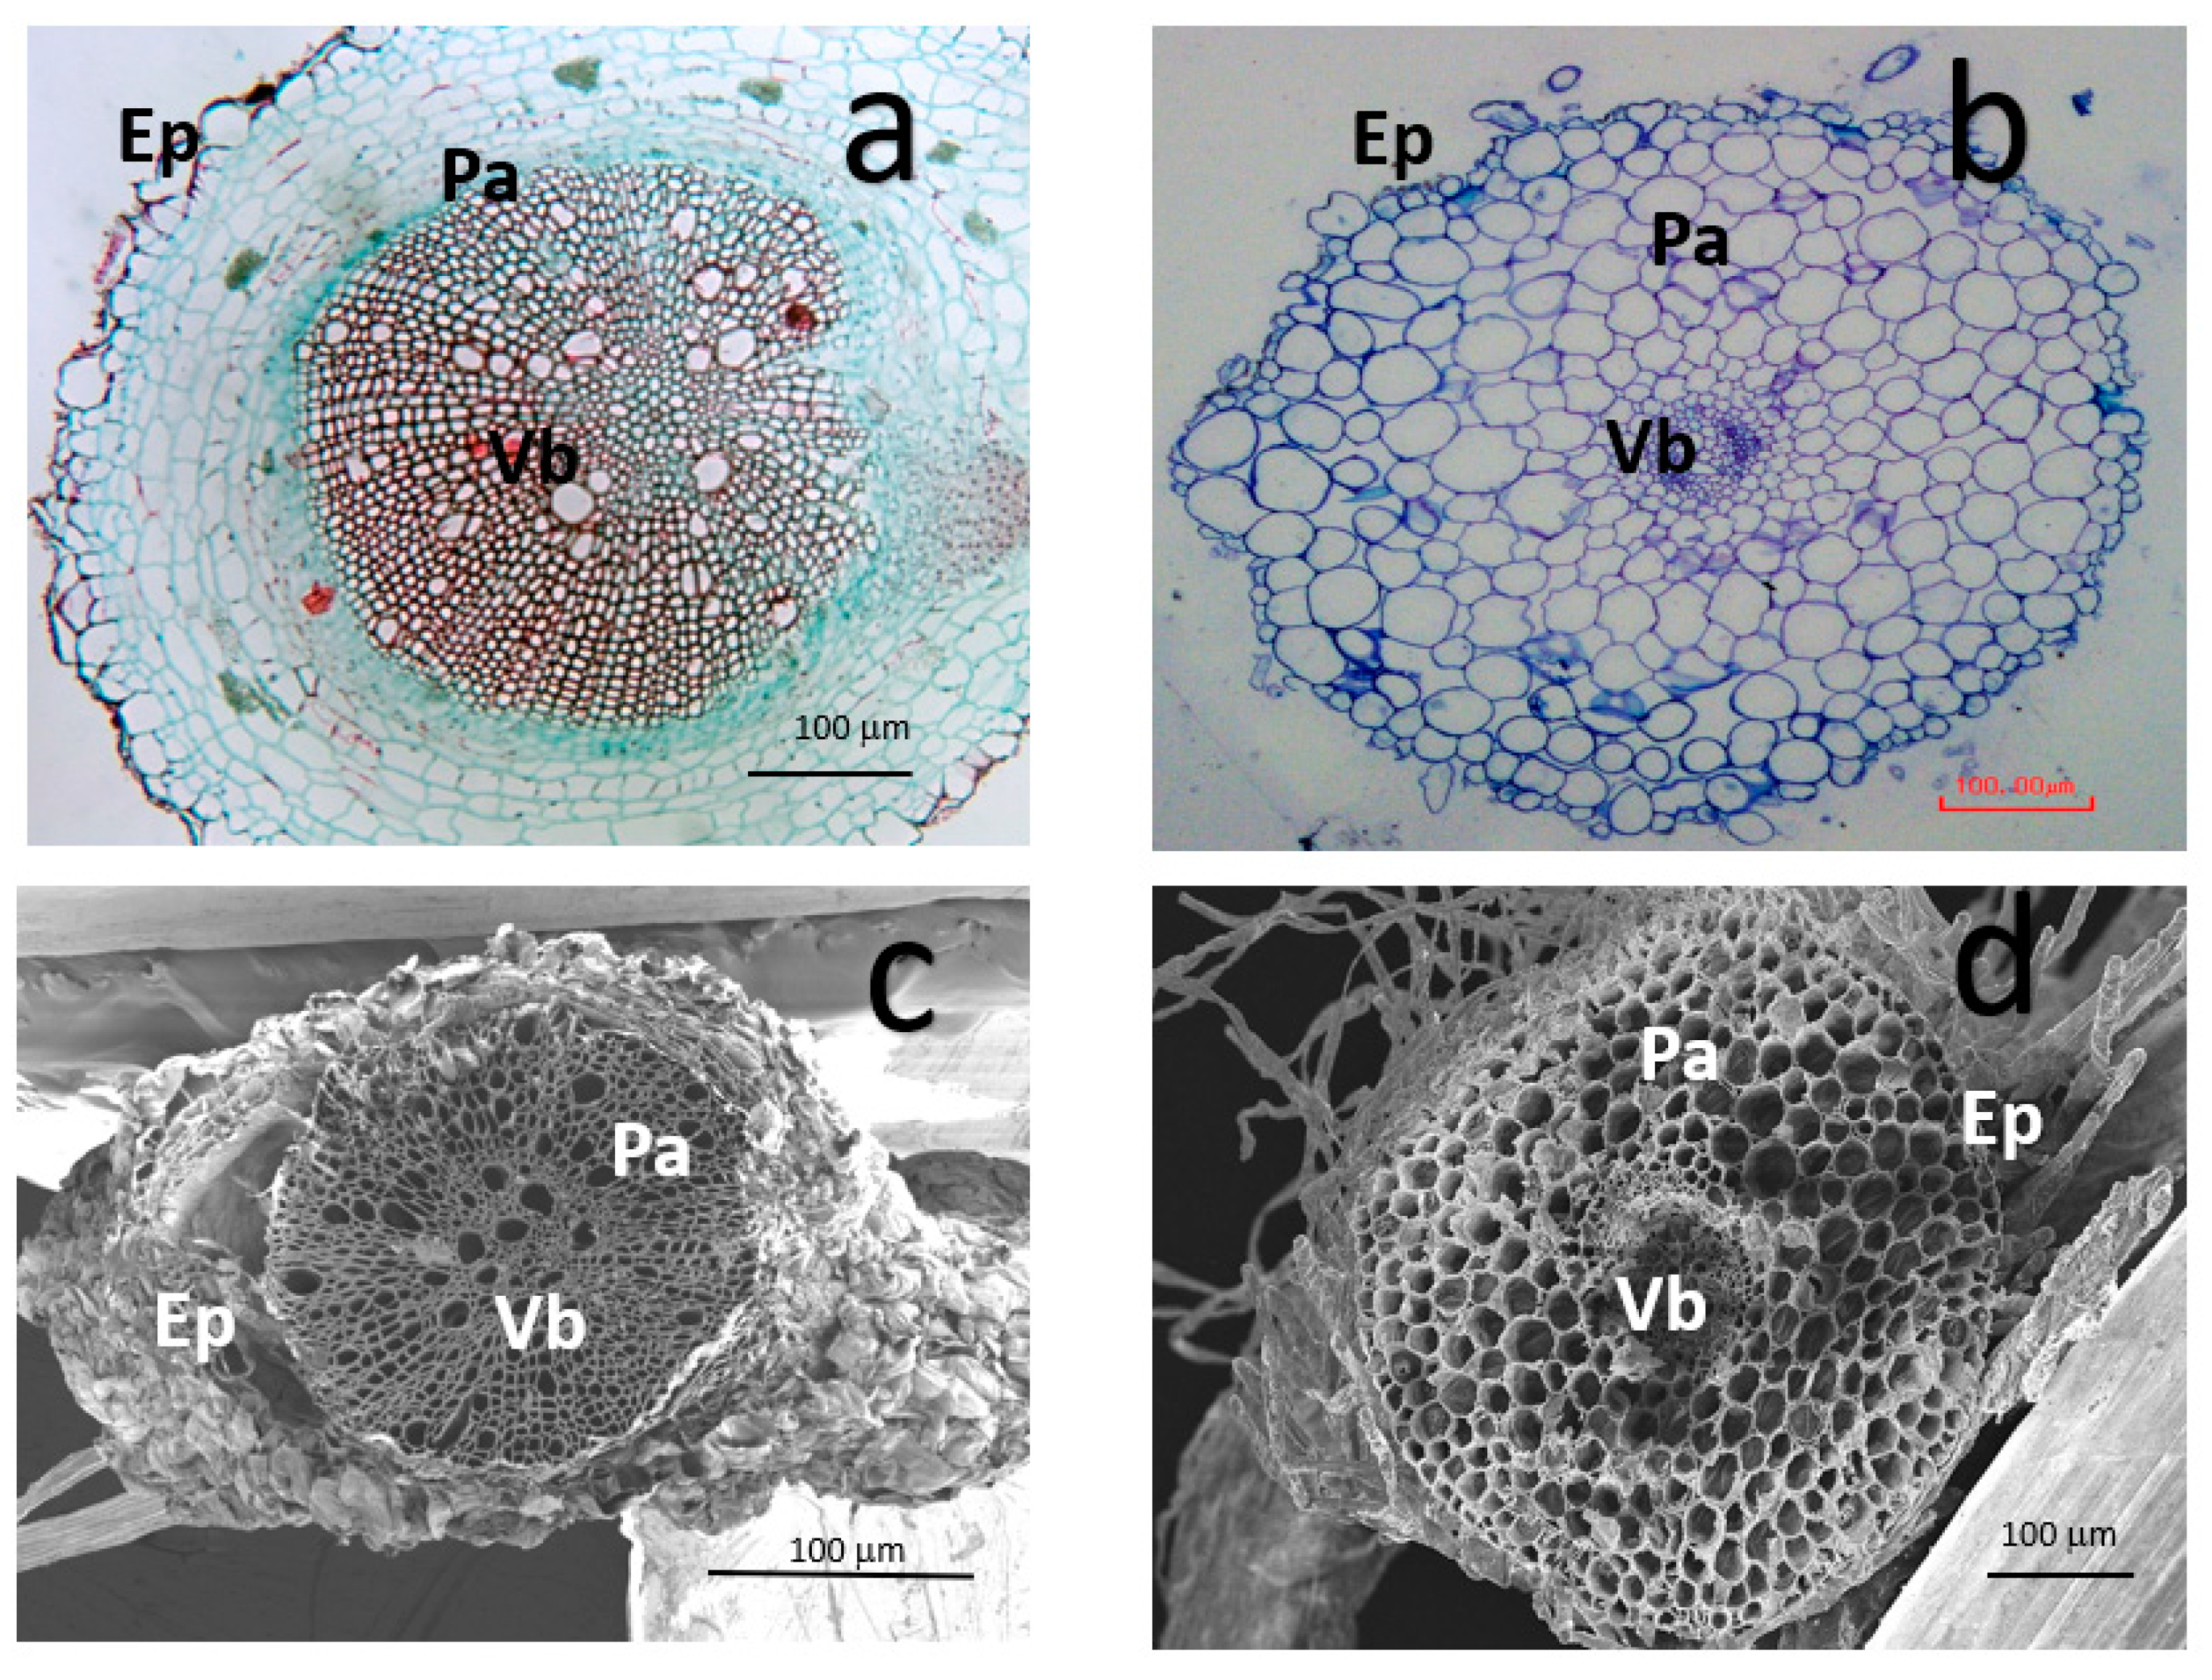
2.2.2. LM for Tomato Root Microstructure
2.3. TiO2 NPs Detection inside Tomato Root
2.3.1. TiO2 NPs Detection by WDXRF
2.3.2. Scanning and Transmission Electron Microscopy (SEM and TEM)
2.4. Nanomechanical Properties
2.4.1. AFM
2.4.2. Nanoindentation and Image Data Analysis
3. Results
3.1. TiO2 NPs Characterization
3.2. Changes in Tomato Root Cell Morphology after Exposure to TiO2 NPs
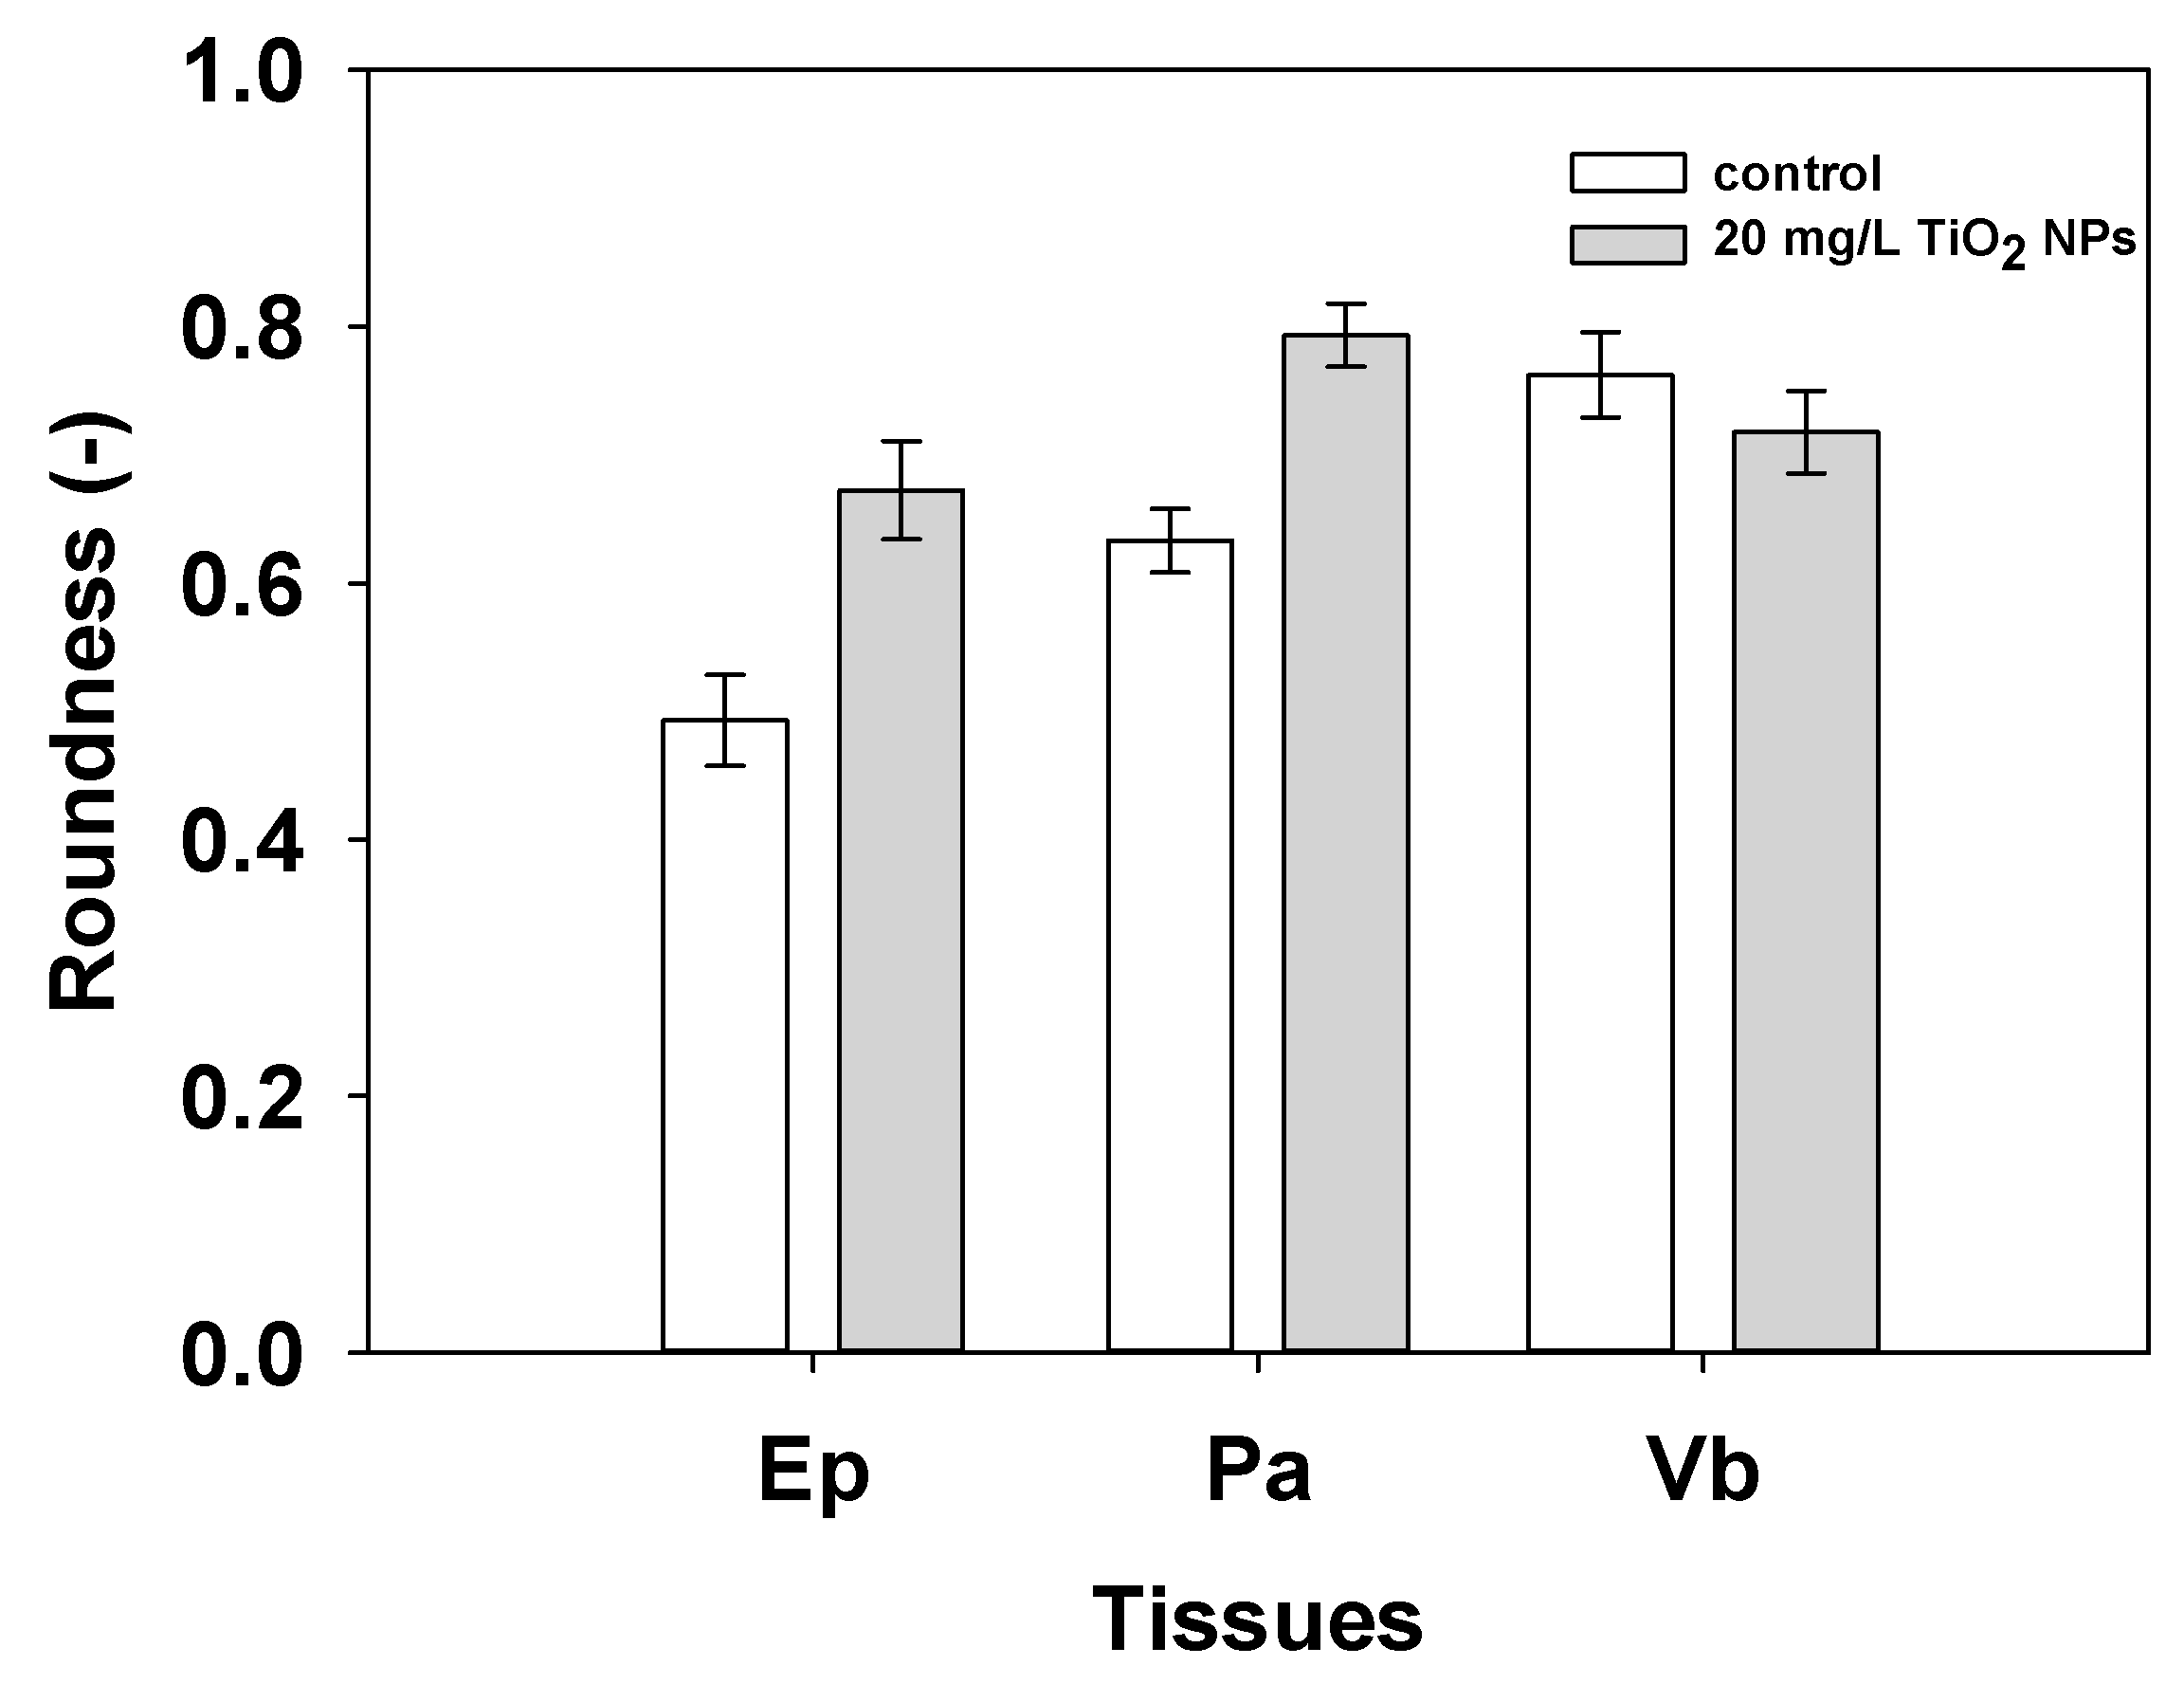
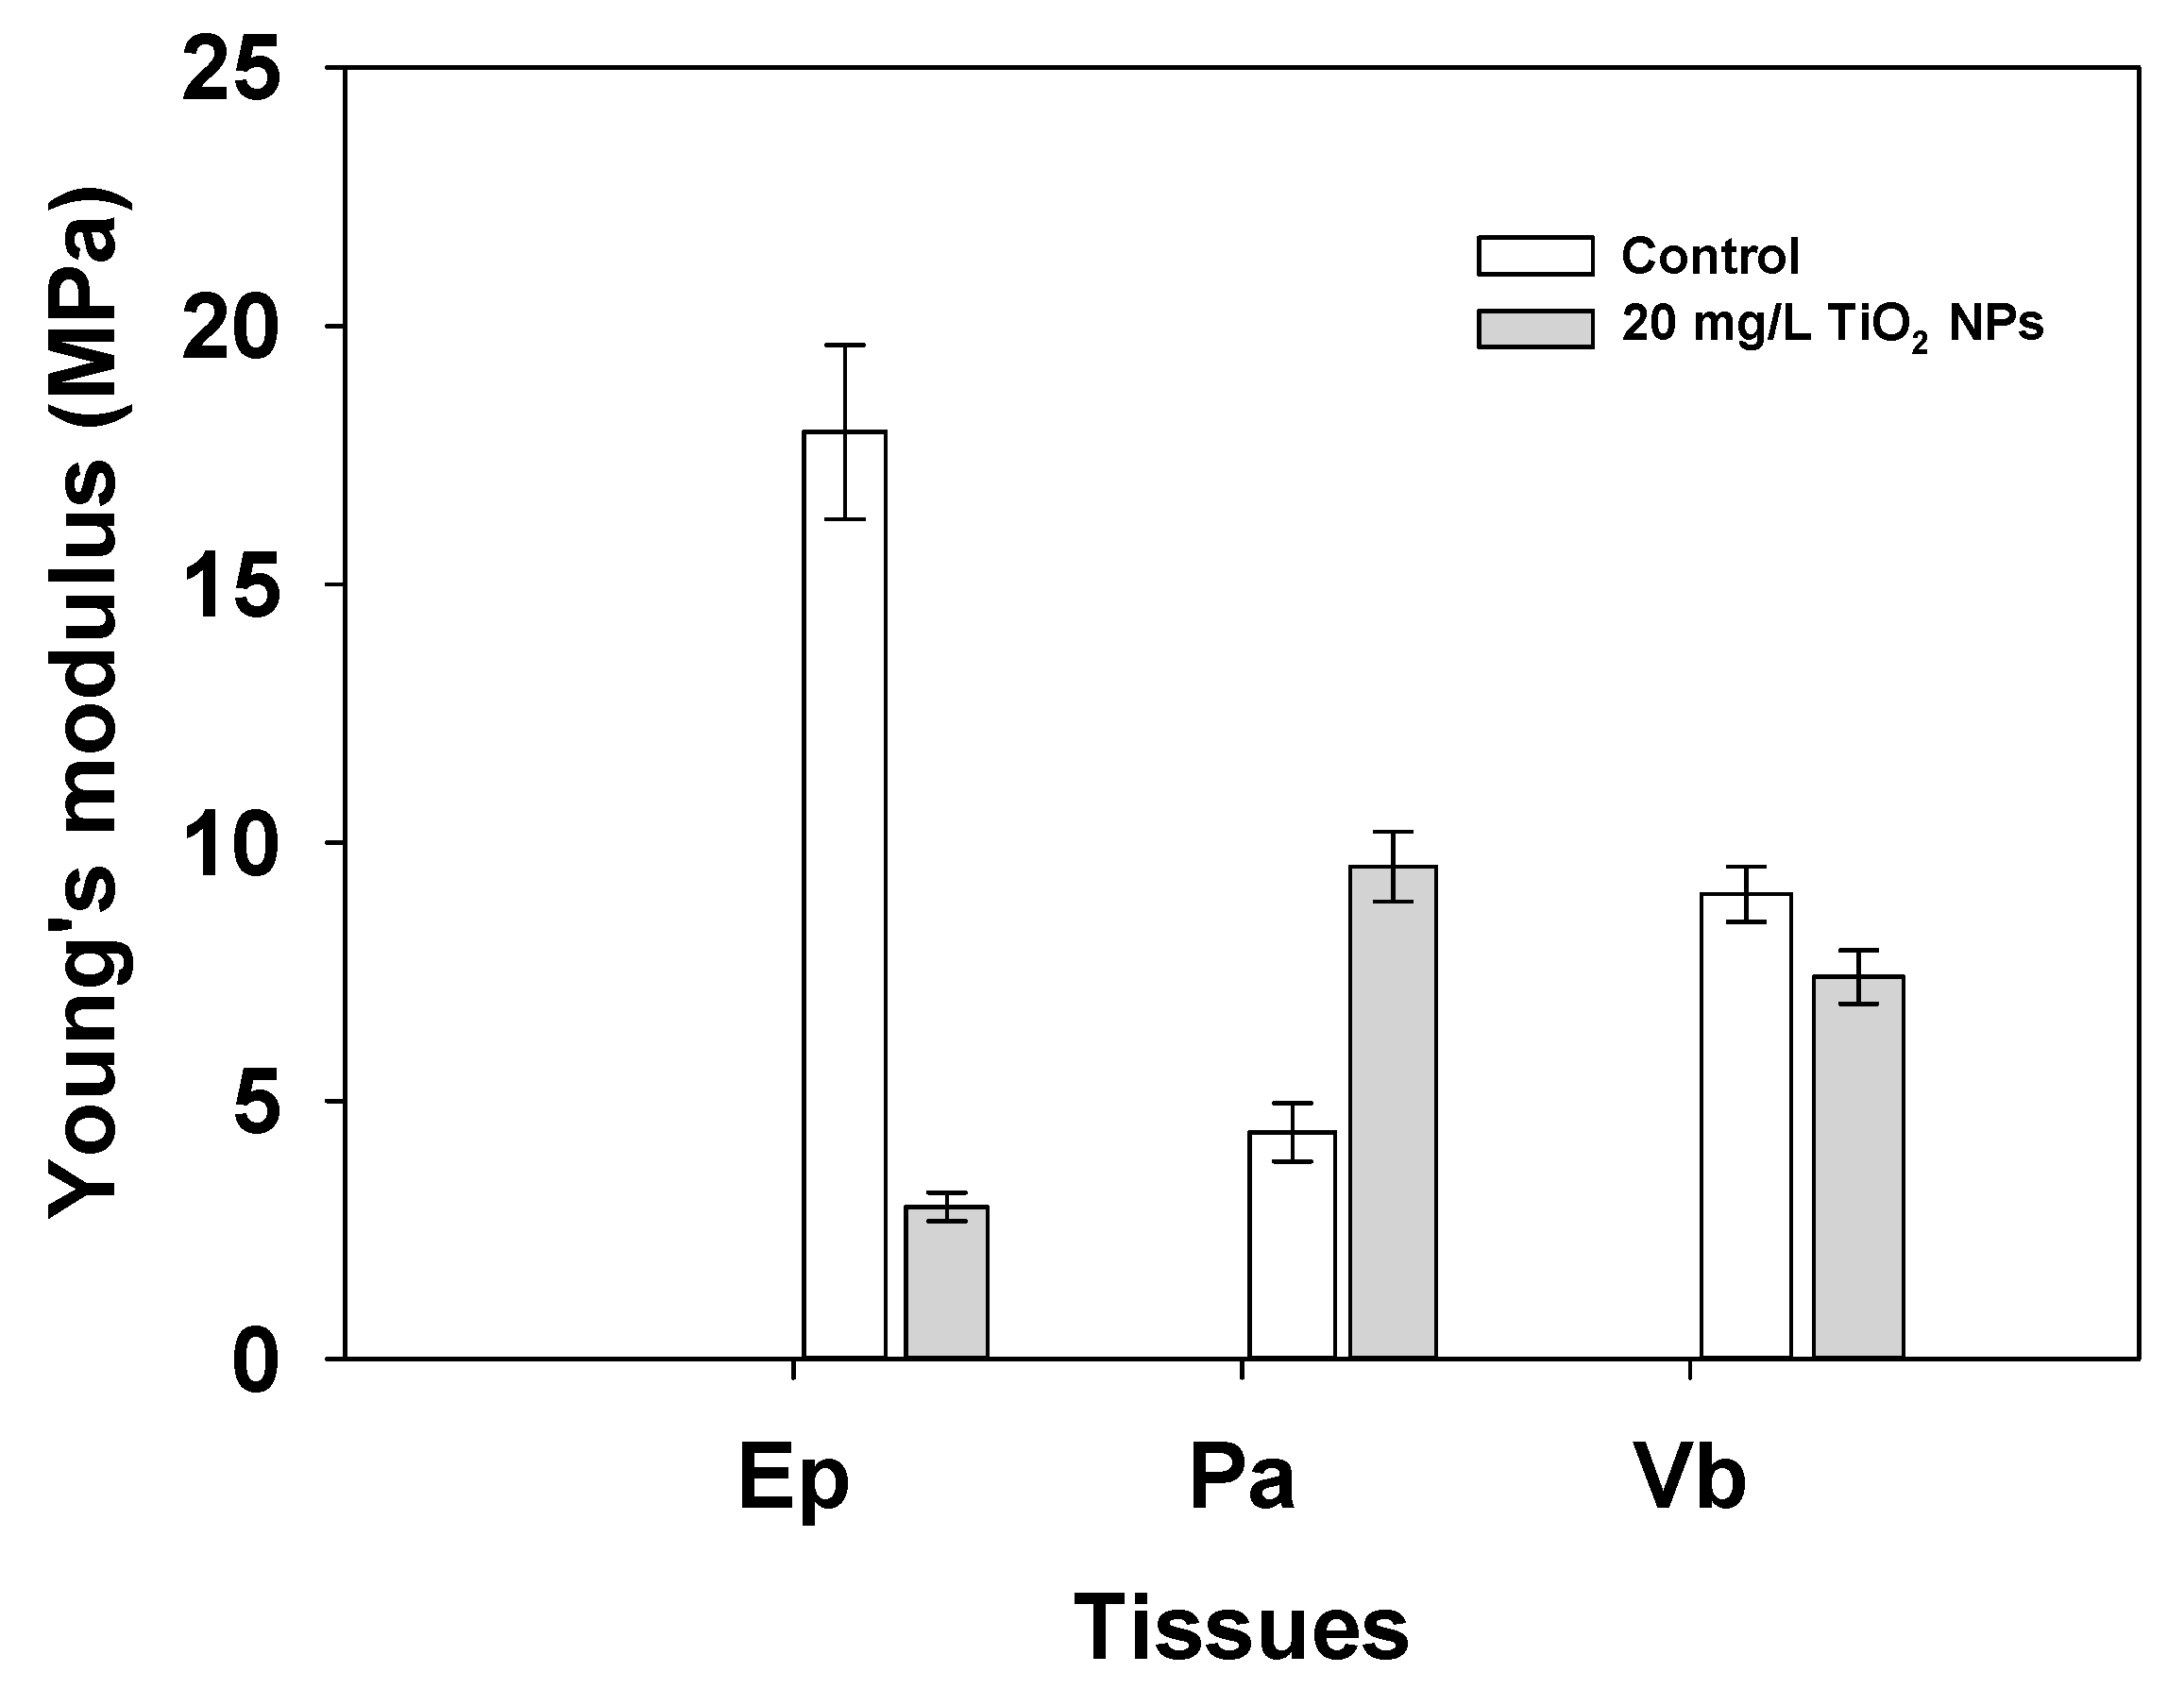
3.3. Nanomechanical Properties
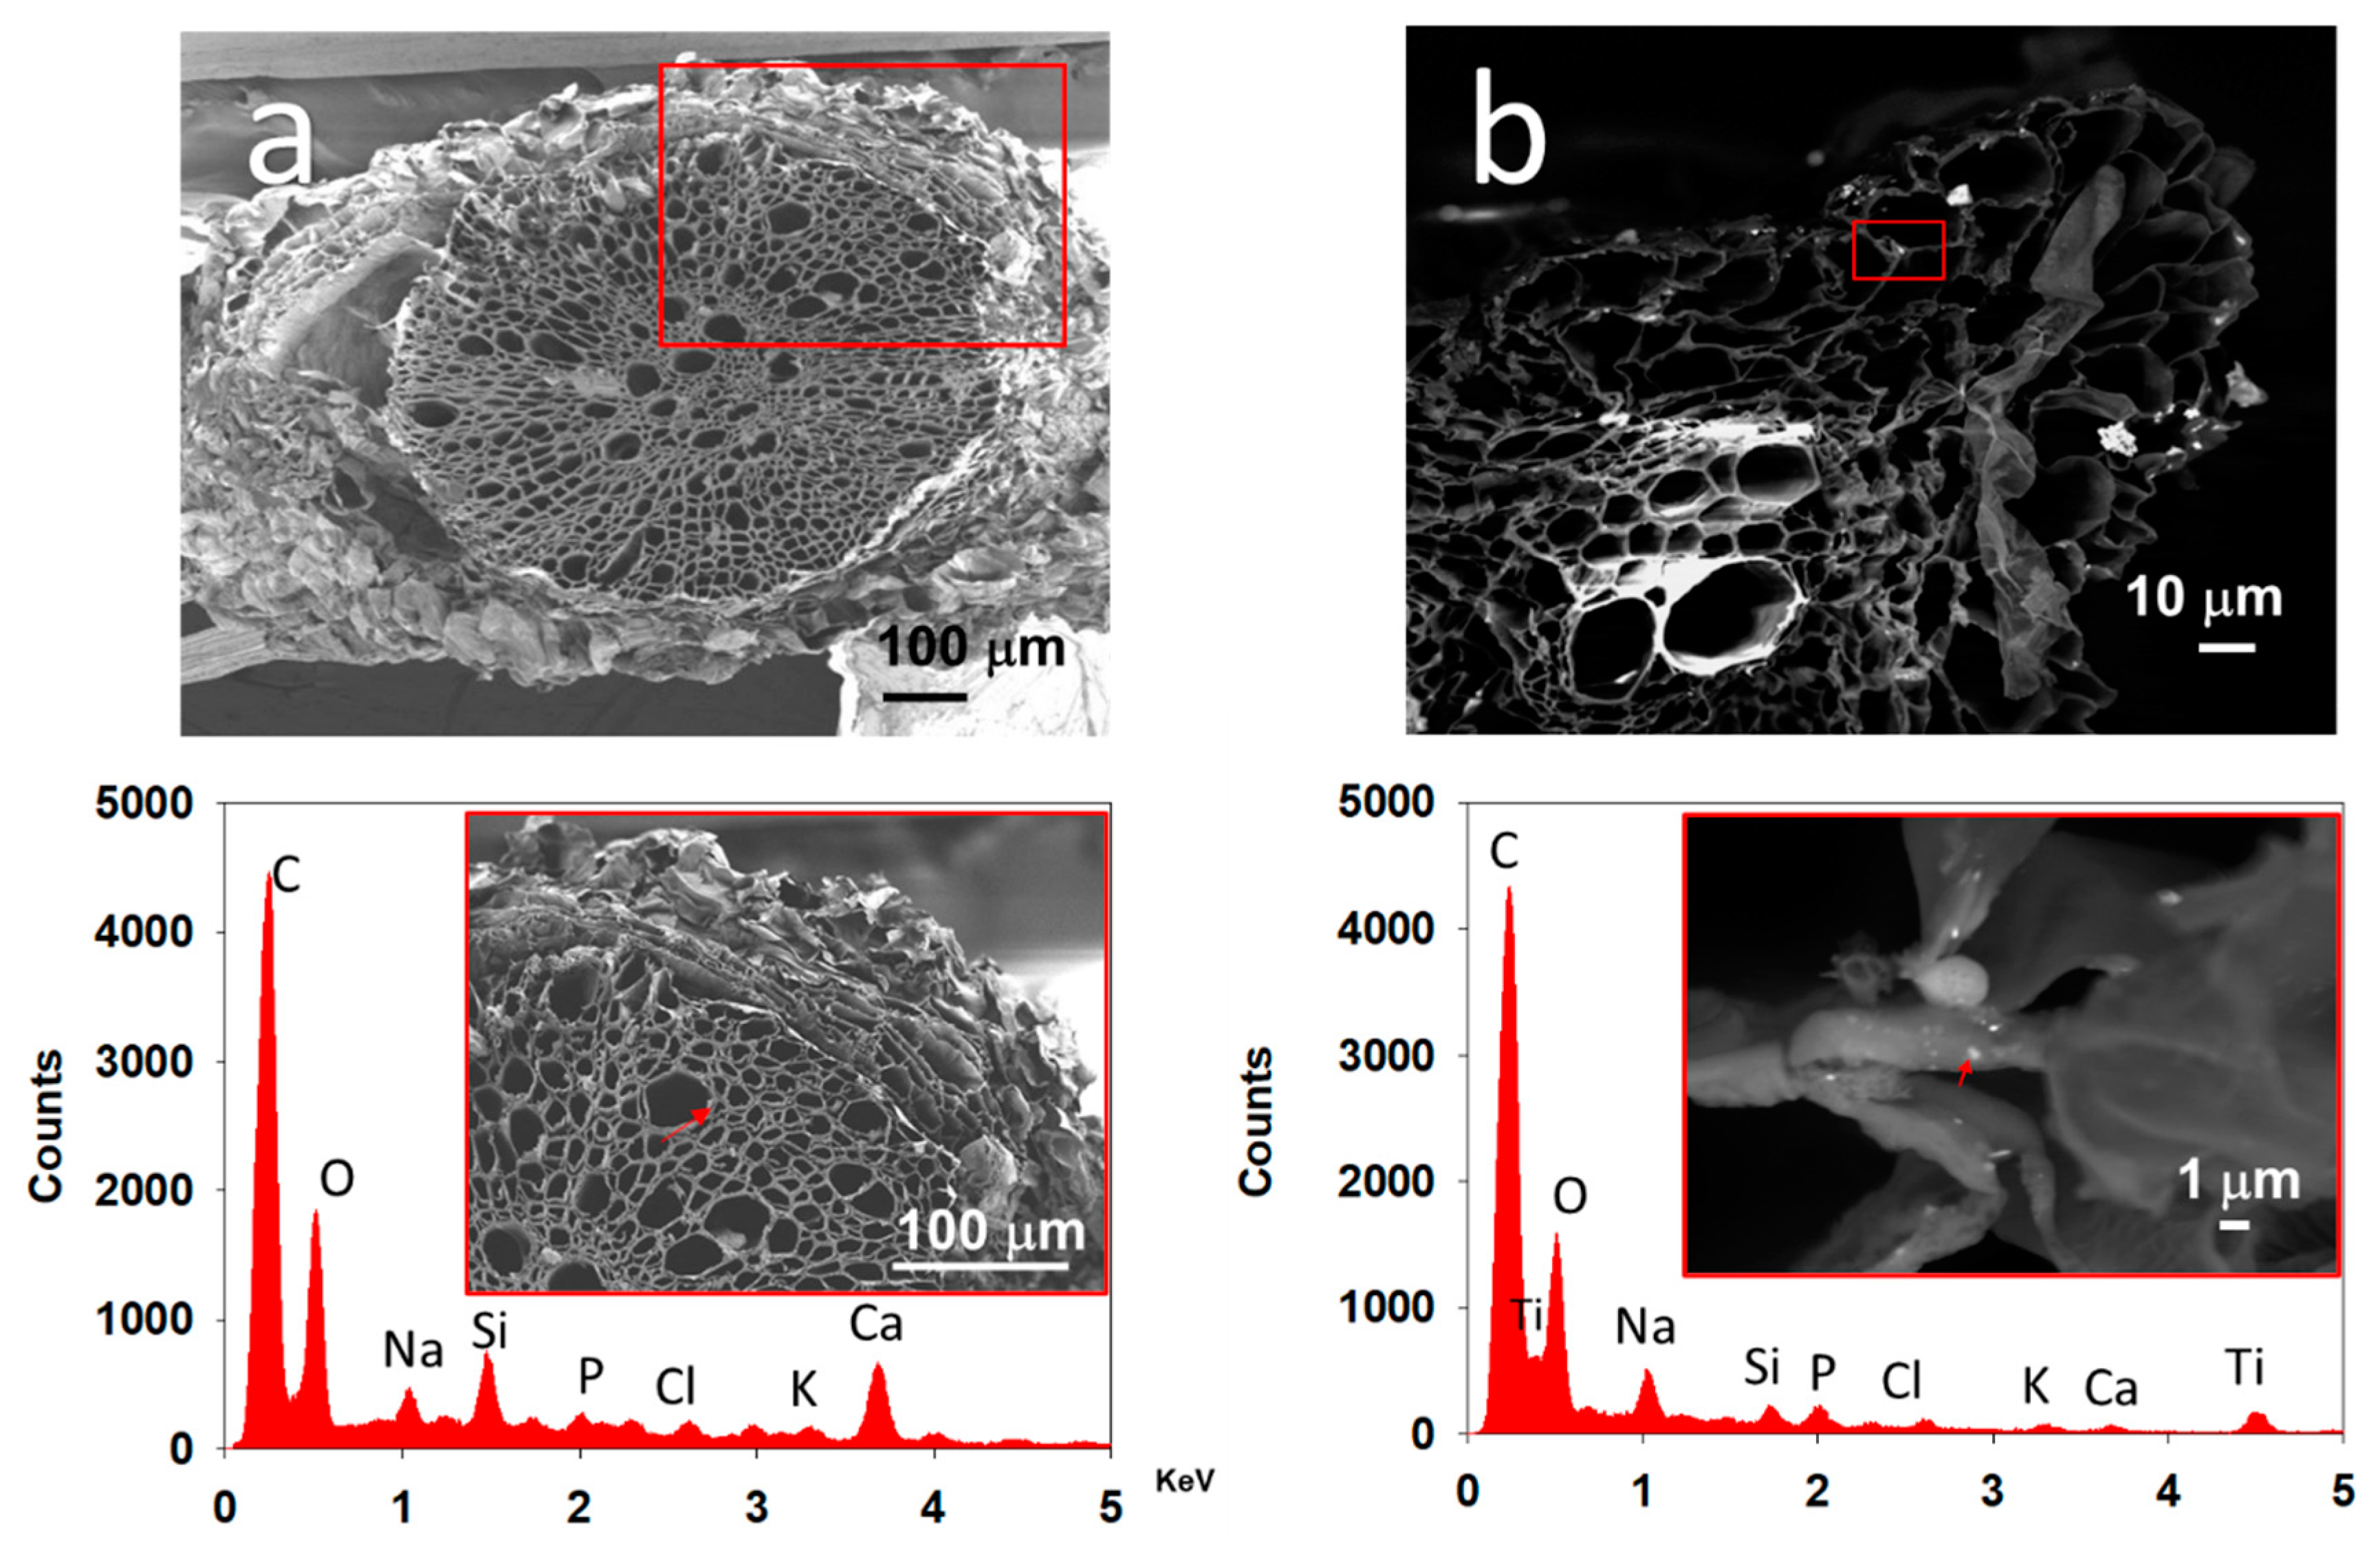
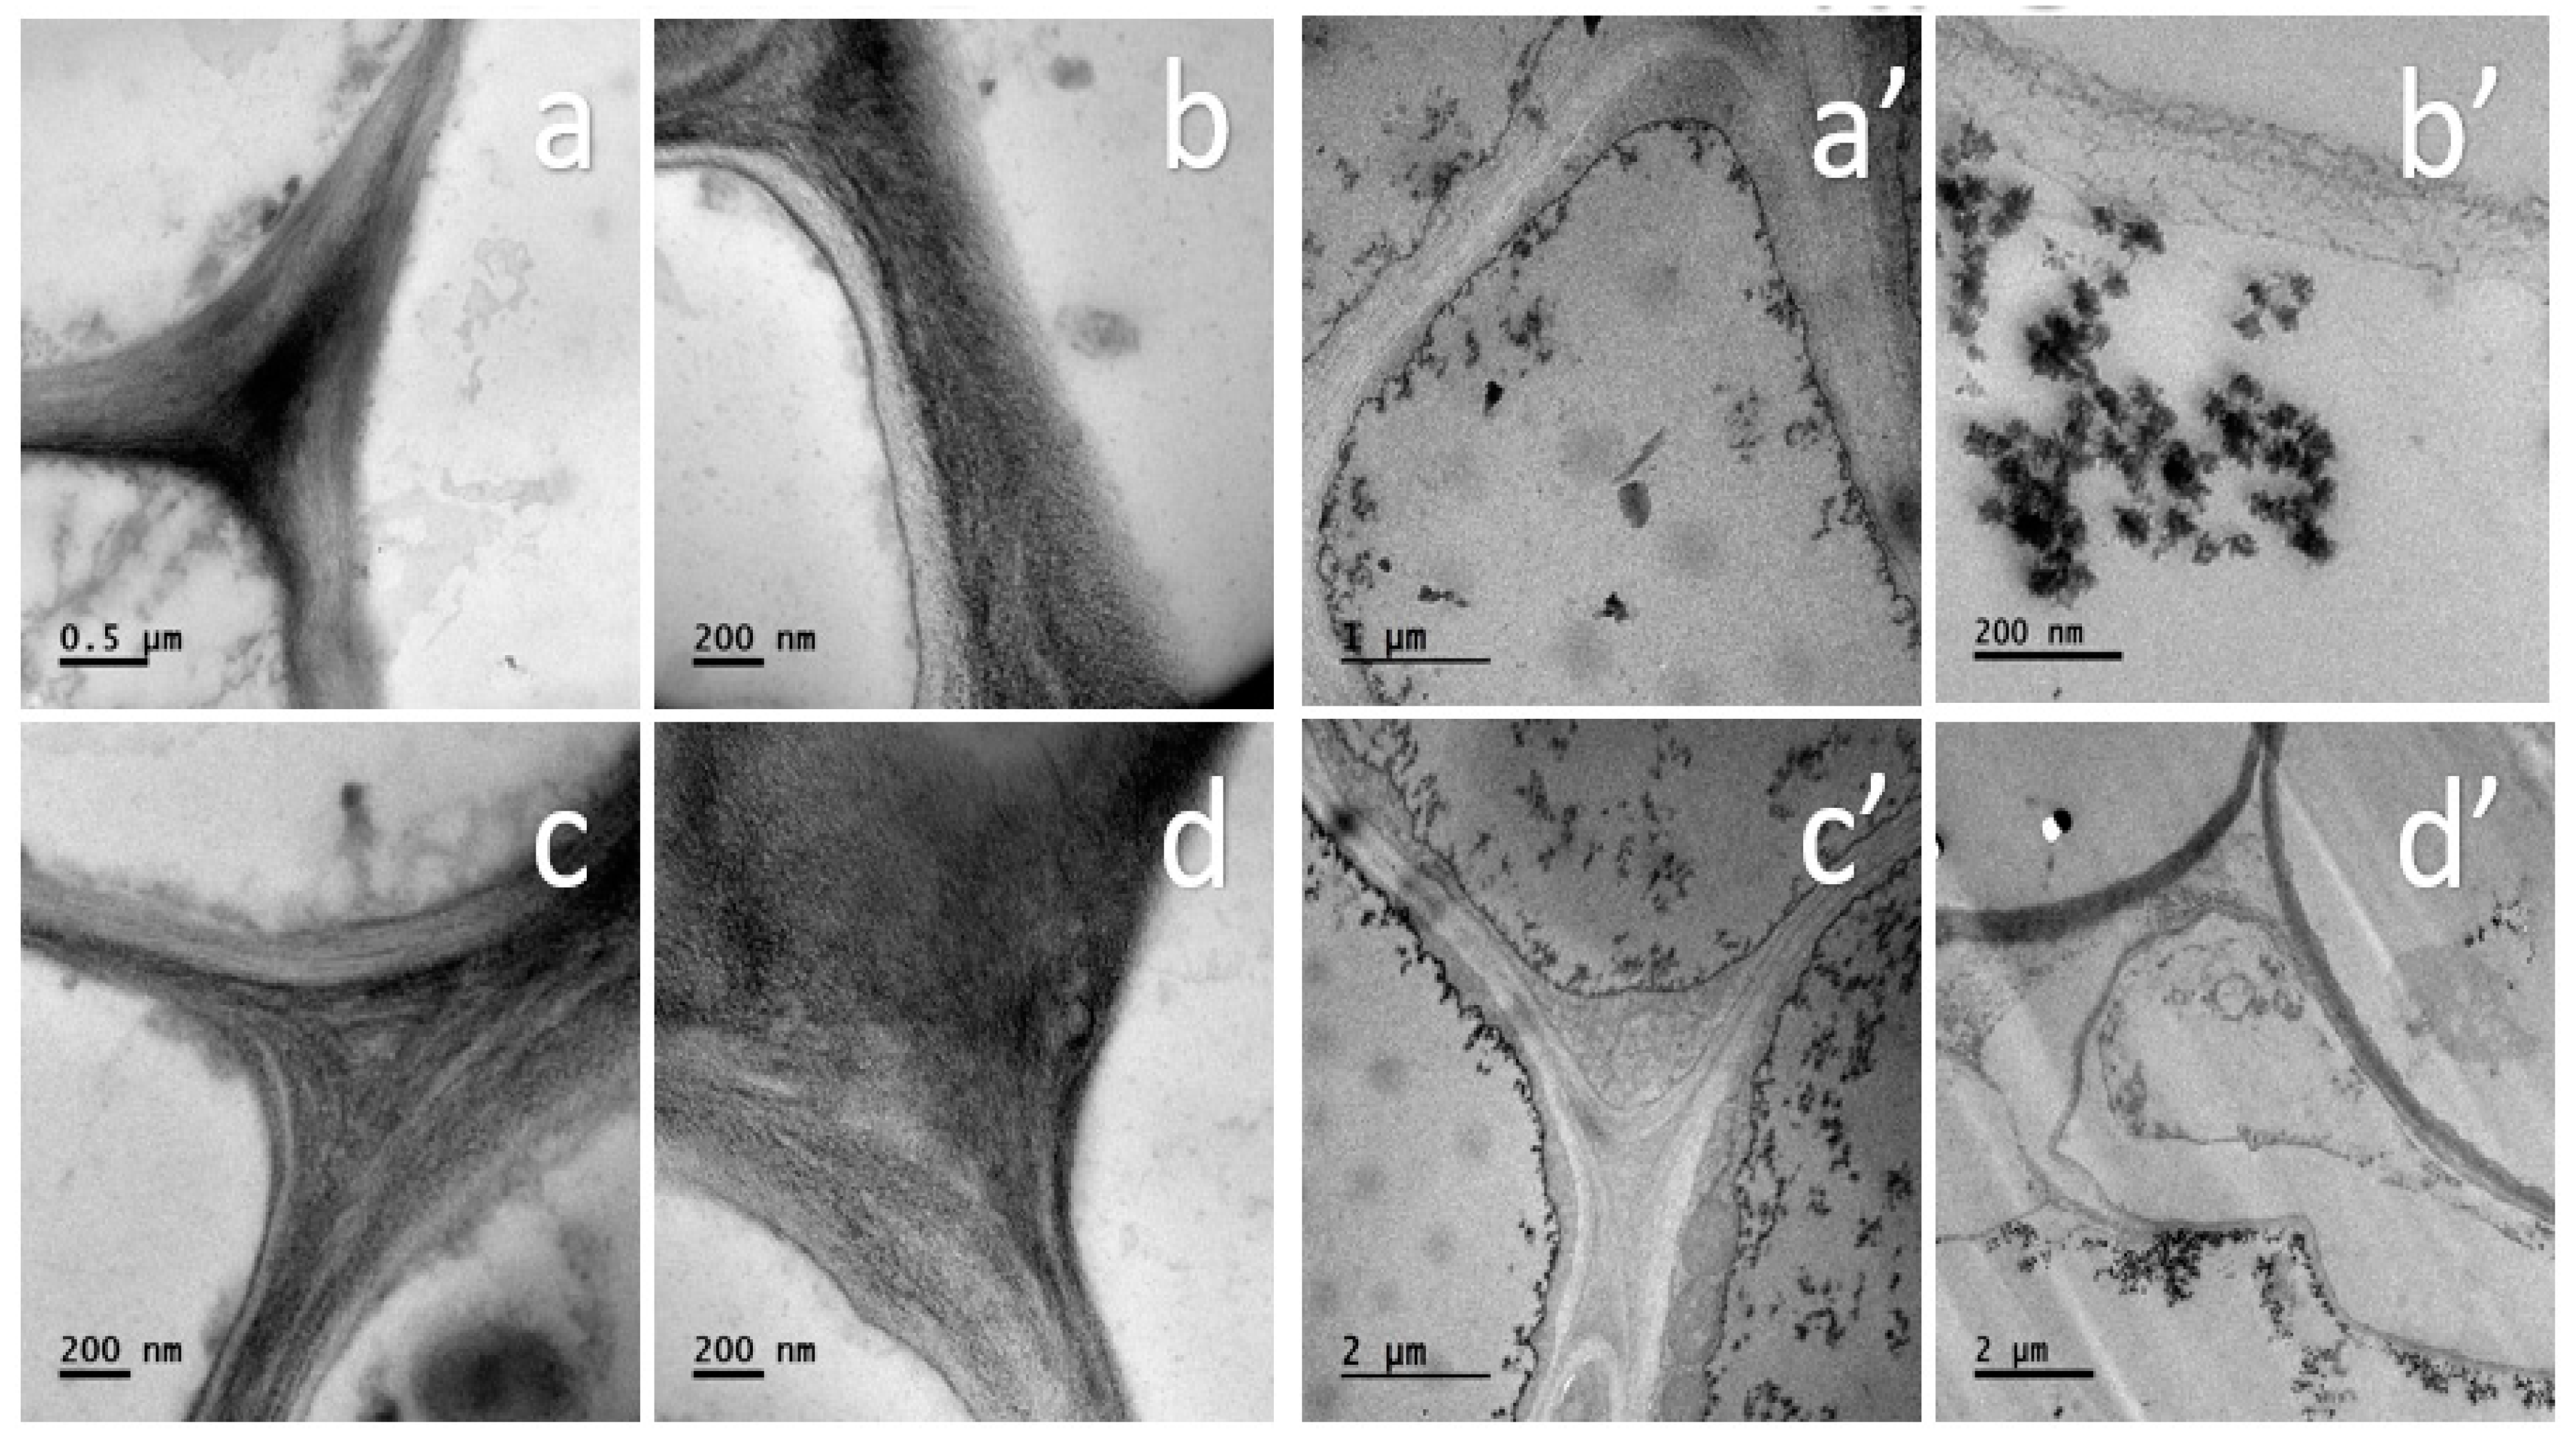
3.4. Localization of TiO2 NPs in Tomato Root Cells
4. Discussion
5. Conclusions
Author Contributions
Funding
Conflicts of Interest
References
- Dutschk, V.; Karapantsios, T.; Liggieri, L.; McMillan, N.; Miller, R.; Starov, V. Smart and green interfaces: From single bubbles/drops to industrial environmental and biomedical applications. Adv. Colloid Interface Sci. 2014, 209, 109–126. [Google Scholar] [CrossRef] [PubMed] [Green Version]
- Varner, K. State of the Science Literature Review: Nano Titanium Dioxide Environmental Matters Research and Development. Available online: https://cfpub.epa.gov/si/si_public_record_report.cfm?Lab=NERL&dirEntryId=227225 (accessed on 9 February 2021).
- Weir, A.; Westerhoff, P.; Fabricius, L.; Hristovski, K.; von Goetz, N. Titanium Dioxide Nanoparticles in Food and Personal Care Products. Environ. Sci. Technol. 2012, 46, 2242–2250. [Google Scholar] [CrossRef] [PubMed] [Green Version]
- Tan, W.; Peralta-Videa, J.R.; Gardea-Torresdey, J.L. Interaction of titanium dioxide nanoparticles with soil components and plants: Current knowledge and future research needs—A critical review. Environ. Sci. Nano 2018, 5, 257–278. [Google Scholar] [CrossRef]
- Song, U.; Jun, H.; Waldman, B.; Roh, J.; Kim, Y.; Yi, J.; Lee, E.J. Functional analyses of nanoparticle toxicity: A comparative study of the effects of TiO2 and Ag on tomatoes (Lycopersicon esculentum). Ecotoxicol. Environ. Saf. 2013, 93, 60–67. [Google Scholar] [CrossRef]
- Monica, R.C.; Cremonini, R. Nanoparticles and higher plants. Caryologia 2009, 62, 161–165. [Google Scholar] [CrossRef] [Green Version]
- Ghosh, M.; Bandyopadhyay, M.; Mukherjee, A. Genotoxicity of titanium dioxide (TiO2) nanoparticles at two trophic levels: Plant and human lymphocytes. Chemosphere 2010, 81, 1253–1262. [Google Scholar] [CrossRef] [PubMed]
- Raliya, R.; Biswas, P.; Tarafdar, J. TiO2 nanoparticle biosynthesis and its physiological effect on mung bean (Vigna radiata L.). Biotechnol. Rep. 2015, 5, 22–26. [Google Scholar] [CrossRef] [Green Version]
- Wu, B.; Zhu, L.; Le, X.C. Metabolomics analysis of TiO2 nanoparticles induced toxicological effects on rice (Oryza sativa L.). Environ. Pollut. 2017, 230, 302–310. [Google Scholar] [CrossRef]
- Deng, Y.; Petersen, E.J.; Challis, K.E.; Rabb, S.A.; Holbrook, R.D.; Ranville, J.F.; Nelson, B.C.; Xing, B. Multiple Method Analysis of TiO2 Nanoparticle Uptake in Rice (Oryza sativa L.) Plants. Environ. Sci. Technol. 2017, 51, 10615–10623. [Google Scholar] [CrossRef] [Green Version]
- Mattiello, A.; Marchiol, L. Application of Nanotechnology in Agriculture: Assessment of TiO2 Nanoparticle Effects on Barley. In Application of Titanium Dioxide; IntechOpen: Udine, Italy, 2017. [Google Scholar]
- Jiang, F.; Shen, Y.; Ma, C.; Zhang, X.; Cao, W.; Rui, Y. Effects of TiO2 nanoparticles on wheat (Triticum aestivum L.) seedlings cultivated under super-elevated and normal CO2 conditions. PLoS ONE 2017, 12, e0178088. [Google Scholar] [CrossRef] [Green Version]
- Silva, S.; Oliveira, H.; Silva, A.M.S.; Santos, C. The cytotoxic targets of anatase or rutile + anatase nanoparticles depend on the plant species. Biol. Plant. 2017, 61, 717–725. [Google Scholar] [CrossRef]
- Mahmoodzadeh, H.; Aghili, R. Effect on Germination and Early Growth Characteristics in Wheat Plants (Triticum aestivum L.) Seeds Exposed to TiO2 Nanoparticles. J. Chem. Health Risks 2014, 4, 29–36. [Google Scholar]
- Tiwari, M.; Sharma, N.C.; Fleischmann, P.; Burbage, J.; Venkatachalam, P.; Sahi, S.V. Nanotitania Exposure Causes Alterations in Physiological, Nutritional and Stress Responses in Tomato (Solanum lycopersicum). Front. Plant Sci. 2017, 8, 633. [Google Scholar] [CrossRef] [PubMed] [Green Version]
- Raliya, R.; Nair, R.; Chavalmane, S.; Wang, W.-N.; Biswas, P. Mechanistic evaluation of translocation and physiological impact of titanium dioxide and zinc oxide nanoparticles on the tomato (Solanum lycopersicum L.) plant. Metallomics 2015, 7, 1584–1594. [Google Scholar] [CrossRef]
- Ko, J.A.; Hwang, Y.S. Effects of nanoTiO2 on tomato plants under different irradiances. Environ. Pollut. 2019, 255, 113141. [Google Scholar] [CrossRef] [PubMed]
- Khodakovskaya, M.V.; de Silva, K.; Nedosekin, D.A.; Dervishi, E.; Biris, A.S.; Shashkov, E.V.; Galanzha, E.I.; Zharov, V.P. Complex genetic, photothermal, and photoacoustic analysis of nanoparticle-plant interactions. Proc. Natl. Acad. Sci. USA 2010, 108, 1028–1033. [Google Scholar] [CrossRef] [PubMed] [Green Version]
- Cárdenas-Pérez, S.; Chanona-Pérez, J.; Méndez-Méndez, J.; Calderón-Domínguez, G.; López-Santiago, R.; Arzate-Vázquez, I. Nanoindentation study on apple tissue and isolated cells by atomic force microscopy, image and fractal analysis. Innov. Food Sci. Emerg. Technol. 2016, 34, 234–242. [Google Scholar] [CrossRef]
- Cárdenas-Pérez, S.; Chanona-Pérez, J.J.; Méndez-Méndez, J.V.; Arzate-Vázquez, I.; Hernández-Varela, J.D.; Vera, N.G. Recent advances in atomic force microscopy for assessing the nanomechanical properties of food materials. Trends Food Sci. Technol. 2019, 87, 59–72. [Google Scholar] [CrossRef]
- Milani, P.; Gholamirad, M.; Traas, J.; Arnéodo, A.; Boudaoud, A.; Argoul, F.; Hamant, O. In vivo analysis of local wall stiffness at the shoot apical meristem in Arabidopsis using atomic force microscopy. Plant J. 2011, 67, 1116–1123. [Google Scholar] [CrossRef]
- Cullity, B.D. Elements of X-ray Diffraction; Addison-Wesley Publishing: Boston, MA, USA, 1956. [Google Scholar]
- Xi, X.; Kim, S.H.; Tittmann, B. Atomic force microscopy based nanoindentation study of onion abaxial epidermis walls in aqueous environment. J. Appl. Phys. 2015, 117, 024703. [Google Scholar] [CrossRef]
- Lu, L.; Tian, S.; Liao, H.; Zhang, J.; Yang, X.; Labavitch, J.M.; Chen, W. Analysis of Metal Element Distributions in Rice (Oryza sativa L.) Seeds and Relocation during Germination Based on X-ray Fluorescence Imaging of Zn, Fe, K, Ca, and Mn. PLoS ONE 2013, 8, e57360. [Google Scholar] [CrossRef] [PubMed]
- Asli, S.; Neumann, P.M. Colloidal suspensions of clay or titanium dioxide nanoparticles can inhibit leaf growth and transpiration via physical effects on root water transport. Plant Cell Environ. 2009, 32, 577–584. [Google Scholar] [CrossRef] [PubMed]
- Samadi, N.; Yahyaabadi, S.; Rezayatmand, Z. Effect of TiO2 and TiO2 Nanoparticle on Germination, Root and Shoot Length and Photosynthetic Pigments of Mentha Piperita. Int. J. Plant Soil Sci. 2014, 3, 408–418. [Google Scholar] [CrossRef]
- Prado, R.; Erdocia, X.; Labidi, J. Effect of the photocatalytic activity of TiO2 on lignin depolymerization. Chemosphere 2013, 91, 1355–1361. [Google Scholar] [CrossRef] [PubMed]


Publisher’s Note: MDPI stays neutral with regard to jurisdictional claims in published maps and institutional affiliations. |
© 2021 by the authors. Licensee MDPI, Basel, Switzerland. This article is an open access article distributed under the terms and conditions of the Creative Commons Attribution (CC BY) license (https://creativecommons.org/licenses/by/4.0/).
Share and Cite
Nicolás-Álvarez, D.E.; Andraca-Adame, J.A.; Chanona-Pérez, J.J.; Méndez-Méndez, J.V.; Borja-Urby, R.; Cayetano-Castro, N.; Martínez-Gutiérrez, H.; López-Salazar, P. Effects of TiO2 Nanoparticles Incorporation into Cells of Tomato Roots. Nanomaterials 2021, 11, 1127. https://doi.org/10.3390/nano11051127
Nicolás-Álvarez DE, Andraca-Adame JA, Chanona-Pérez JJ, Méndez-Méndez JV, Borja-Urby R, Cayetano-Castro N, Martínez-Gutiérrez H, López-Salazar P. Effects of TiO2 Nanoparticles Incorporation into Cells of Tomato Roots. Nanomaterials. 2021; 11(5):1127. https://doi.org/10.3390/nano11051127
Chicago/Turabian StyleNicolás-Álvarez, Dulce Estefanía, José Alberto Andraca-Adame, José Jorge Chanona-Pérez, Juan Vicente Méndez-Méndez, Raúl Borja-Urby, Nicolás Cayetano-Castro, Hugo Martínez-Gutiérrez, and Primavera López-Salazar. 2021. "Effects of TiO2 Nanoparticles Incorporation into Cells of Tomato Roots" Nanomaterials 11, no. 5: 1127. https://doi.org/10.3390/nano11051127