Article

Insight into the Contributions of Surface Oxygen Vacancies on the Promoted Photocatalytic Property of Nanoceria

1
Department of Metallurgical Engineering, College of Materials and Metallurgy, Guizhou University, Huaxi, Guiyang 550025, China
2
Guizhou Province Key Laboratory of Metallurgical Engineering and Process Energy Saving, Guiyang 550025, China
*
Authors to whom correspondence should be addressed.
Nanomaterials 2021, 11(5), 1168; https://doi.org/10.3390/nano11051168
Submission received: 27 March 2021 / Revised: 21 April 2021 / Accepted: 27 April 2021 / Published: 29 April 2021
(This article belongs to the Section Energy and Catalysis)

Abstract

:
Oxygen vacancies (OVs) have critical effects on the photoelectric characterizations and photocatalytic activity of nanoceria, but the contributions of surface OVs on the promoted photocatalytic properties are not clear yet. In this work, we synthesized ceria nanopolyhedron (P-CeO2), ceria nanocube (C-CeO2) and ceria nanorod (R-CeO2), respectively, and annealed them at 600 °C in air, 30%, 60% or pure H2. After annealing, the surface OVs concentration of ceria elevates with the rising of H2 concentration. Photocatalytic activity of annealed ceria is promoted with the increasing of surface OVs, the methylene blue photodegradation ratio with pure hydrogen annealed of P-CeO2, C-CeO2 or R-CeO2 is 93.82%, 85.15% and 90.09%, respectively. Band gap of annealed ceria expands first and then tends to narrow slightly with the rising of surface OVs, while the valence band (VB) and conductive band (CB) of annealed ceria changed slightly. Both of photoluminescence spectra and photocurrent results indicate that the separation efficiency of photoinduced electron-hole pairs is significantly enhanced with the increasing of the surface OVs concentration. The notable weakened recombination of photogenerated carrier is suggested to attribute a momentous contribution on the enhanced photocatalytic activity of ceria which contains surface OVs.

1. Introduction

Cerium is the first element in the periodic table to possess a ground state electron in a 4f orbital (Xe 4f15d16s2), which is responsible for the powerful redox behavior between its two ionic states, Ce4+ (the Xe ground state) and Ce3+ (Xe 4f1) [1]. Cerium dioxide is known for its excellent redox ability, outstanding oxygen storage capacity and stable chemical properties, which make ceria a prominent function material for various applications, e.g., three-way catalysis [2], water gas shift reaction (WGS) [3,4], solar energy conversion [5,6], gas sensor [7] and chemical-mechanical polishing [8]. Meanwhile, nanoceria is also employed as one of the most attractive photocatalysts for environmental applications [9,10], clean energy generation [11,12], CO2 utilization [13,14,15], etc.
It is generally accepted that the photocatalytic application of ceria is impeded by its wide band gap ~3.2 eV and a quick recombination of photogenerated electrons (e) and holes (h+) [16,17]. Attributing to the redox characteristic of Ce4+/Ce3+ pairs, oxygen vacancy is an inescapable topic for researching on ceria based catalysts [1,18,19]. Oxygen vacancies (OVs) or Ce3+ have been reported to affect both band structure and recombination of photocarriers significantly, and promote the photocatalytic activity of ceria [20,21,22,23]. It is believed that the OVs are favorable for reducing the e-/h+ pairs recombination rate [24,25]. Band gaps of ceria are mostly reported to be narrowed after more OVs generated [20,21,26], while a few researchers, e.g., Gao et al. [22] found the ceria with a higher OVs concentration had a blue-shift of light absorption. The existing divergent influence of OVs on ceria band gap may be interrelated to the concentration, distribution or location of OVs in ceria lattice. Though, the ceria containing more OVs shows a higher photocatalytic activity under the same light source [20,21,22,26], then the contributions of OVs on the enhanced photocatalytic property of ceria is unclear.
Reduction of the stoichiometric CeO2 is a main way to enrich OVs concentration in ceria lattice, including CO or H2 reducing [22,27,28], X-ray/UV/Ar+/plasma exposing [29,30,31,32,33,34] or a high temperature annealing [35]. Reducing ratio of ceria by H2 primarily depends on H2 concentration and reduction temperature, while surface oxygen may be taken away by H2 at a low temperature [36]. The subsurface or bulk oxygen of ceria would react with H2 molecules and depart away over around 850 °C, and tends to form Ce2O3 [37]. Annealing the ceria at a same temperature for the same length of time with a different concentration reductant, e.g., H2, is a facile way to produce ceria samples with a surface OVs concentration gradient.
Moreover, different morphologies of ceria mainly expose diverse crystal faces, where the typical morphologies including polyhedral, cubic and rod-like shape of nanoceria primarily expose the (111), (100) and (110)/(100) plane, respectively [38,39]. It is suggested that the (111) is the most stable face, and OVs are most easily formed on the (100) but which would be partially oxidized due to high surface activity, and a higher concentration of surface OVs normally exist on (110) plane [40,41,42]. The effects of OVs on the photoelectric characterizations of various shaped ceria may be different, and which still need to be systematically studied.
Thus, in present work, we synthesized polyhedral, cubic and rod-like shape of nanoceria, and annealed them at 600 °C in air, 30%, 60% or pure H2 to obtain ceria with various surface OVs concentration. The effects of the surface OVs on band structure, photogenerated carriers, and photocatalytic activity of different shapes of nanoceria are carefully discussed.

2. Materials and Methods

2.1. Materials

Cerium nitrate hexahydrate (Ce(NO3)3·6H2O, 99.95%) and sodium hydroxide (NaOH, 99.9%) were purchased from Aladdin Chemistry Co. Ltd. (Shanghai, China), which were used as received without further purification. The H2 and Ar gas with the purity of 99.999% were ordered from Shen-Jian Co., Guiyang, China.

2.2. Synthesis Process

Nanoceria was synthesized by using a simple template-free hydrothermal method under a variety of conditions to modify the morphology, which was similar to the synthetic route reported in Ref. [43]. Briefly, NaOH aqueous solutions were dropwise added into Ce(NO3)6H2O aqueous solution to form light purple mixtures with strong stirring for 30 min and then transferred to a 50 mL Teflon stainless steel autoclave, which would be maintained at a designed temperature for 24 h. More synthetic conditions are listed in Table S1. After the autoclave cooling down, all products were washed and filtered with distilled water and alcohol several times to remove impure ions, followed by drying at 60 °C in air overnight. The obtained polyhedral, cubic, and rod-like nanoceria are named as raw P-CeO2, C-CeO2 and R-CeO2, respectively.

2.3. Annealing Process

The raw P-CeO2, C-CeO2 and R-CeO2 were placed in a ceramic boat and then maintained in a tube furnace (gsl-1600×, Kejing, Hefei, China) for 2 h annealing at 600 °C with a heating rate of 10 °C/min under air, 30, 60 or 100% H2 atmosphere, respectively. Before a H2 annealing process, air was repeatedly expelled from the furnace tube by alternately flowing argon and vacuuming for several times. The total gas flow rate was 400 mL/min and argon was selected as the balance gas (88.79 kPa total pressure of Guiyang), and the annealed powders were henceforth named as P-CeO2-X, C-CeO2-X and R-CeO2-X (X = air, 30% H2, 60% H2 or H2).

2.4. Subsection Analysis

The obtained powders were subjected to several analyses. X-ray powder diffraction pattern was recorded by using X-Pert Powder (Panalytical, The Netherlands) with Cu Kα radiation (λ = 0.15418 nm) from 5.00 to 90.00° at a rate of 0.02°/s. Micrographs were taken by SEM (JSM 7610, JEOL, Tokyo, Japan) and TEM (Tecnai G2 F20, FEI, Hillsboro, OR, USA) in which the samples were ultrasonically dispersed in alcohol and dropped on the silicon wafer or copper grid. TG analysis was recorded by Mettler TGA/SDTA 851e at a heating rate of 10 °C/s from room temperature to 1000 °C with the air and 30%, 60% and pure H2, where Ar was used as carrier gas. H2-TPR was analyzed by AutoChem1 II 2920, 0.1000 ± 0.0005 g of sample was kept at 500 °C in the air for 1 h and cooled down to room temperature. After 30 min purification in Ar at room temperature, the sample was heated to 1000 °C with the mixed gas of 10% H2 and 90% Ar with a total gas flow of 30 mL/min and a heating rate of 10 °C/min. X-ray photoelectron spectroscopy (XPS) was recorded by K-Alpha (Thermo Fisher Scientific, Waltham, MA, USA), in which a monochromatic Al source (hv = 1486.6 eV) and the samples were tested in a vacuum situation of 2 × 10⁻⁹ mbar with C 1s peak (284.8 eV) reference. The UV-visible diffuse reflectance spectra (UV-Vis DRS) were recorded by UV 2700 (Shimadzu, Tokyo, Japan) with the wavelength from 200 to 800 nm and BaSO4 was used as reference, while the photoluminescence spectroscopy (PL spectra) was analyzed by FluoroMax-4 (HORIBA, France) with an excitation wavelength of 300 nm. The ultraviolet photoelectron spectroscopy (UPS) recording by ESCALAB 250Xi (Thermo Fisher, Waltham, MA, USA) was performed the valence states of all samples at the He I line (hv = 21.2 eV) with C 1s reference in a vacuum situation of 2 × 10⁻⁸ mbar. Transient photocurrent curves were recorded under a light irradiation provided by a 250 W xenon lamp in 0.1 mol/L Na2SO4 aqueous solution at bias voltage of 0.4 V, which was employed by an electrochemical workstation (CHI660C, CHI shanghai Co., Shanghai, China) in three electrode cells. The tested samples were dispersed in a nafion (10 μL), ethanol (750 μL) and deionized water (750 μL) mixture solution and further dip-coated on a glassy carbon plate (Φ = 3 mm), which was used as the working electrode, and a Pt plate and Ag/AgCl were employed as the counter and reference electrode, respectively. The BET surface area and N2 adsorption results were analyzed by ASAP2460 (Micromeritics, Norcross, GA, USA).

2.5. Photocatalytic Performance

The photocatalytic performances were tested by a self-built photochemical reactor, which was composed of a 250 W xenon lamp and a quartz vessel. In total, 80 mL of methylene blue (MB) solution with a concentration of 10 mg/L was used for simulating the waste dye solution, and 20 mg of synthesized catalyst was added into the reactor with ultrasound for 10 min. After 30 min of dark adsorption, the lamp was turned on and the catalyst was reacted with the MB under a light facula, 5 mL solution was sampled for 30 min each in the next 2 h. The sampled solution was centrifuged firstly with a speed of 10,000 r/min for 5 min and then the MB concentration was measured by a spectrophotometer under the maximum wavelength of 664 nm. The degradation ratio can be calculated by the following formula [44,45]:
Degradation ratio (%) = (C0Ci)/C0 × 100%.
At a low concentration of MB with a weak adsorption, the photocatalytic reaction kinetics in general follow the Langmuir–Hinshelwood (L-H), and the equation of the pseudo-first-order reaction rate constant [46] can be given as:
ln(Ci) = −kt + ln(C0),
where C0 and Ci are the initial and tested concentration of MB, respectively, k is the pseudo-first-order reaction rate constant (min−1), t is the photocatalytic reaction time (min).

3. Results and Discussion

3.1. Phase and Morphology

XRD patterns of synthesized nanoceria are exhibited in Figure 1, it can be seen that all samples show the typical diffraction peaks of CeO2 with a fluorite-type structure and Fm 3 ¯ m space group (PDF: #03-065-2975). The raw C-CeO2 has the strongest diffraction intensity, followed by raw P-CeO2 and R-CeO2, the crystal sizes of raw P-CeO2, raw C-CeO2 and raw R-CeO2 were calculated as 6.7, 36.5, and 10.0 nm, respectively.
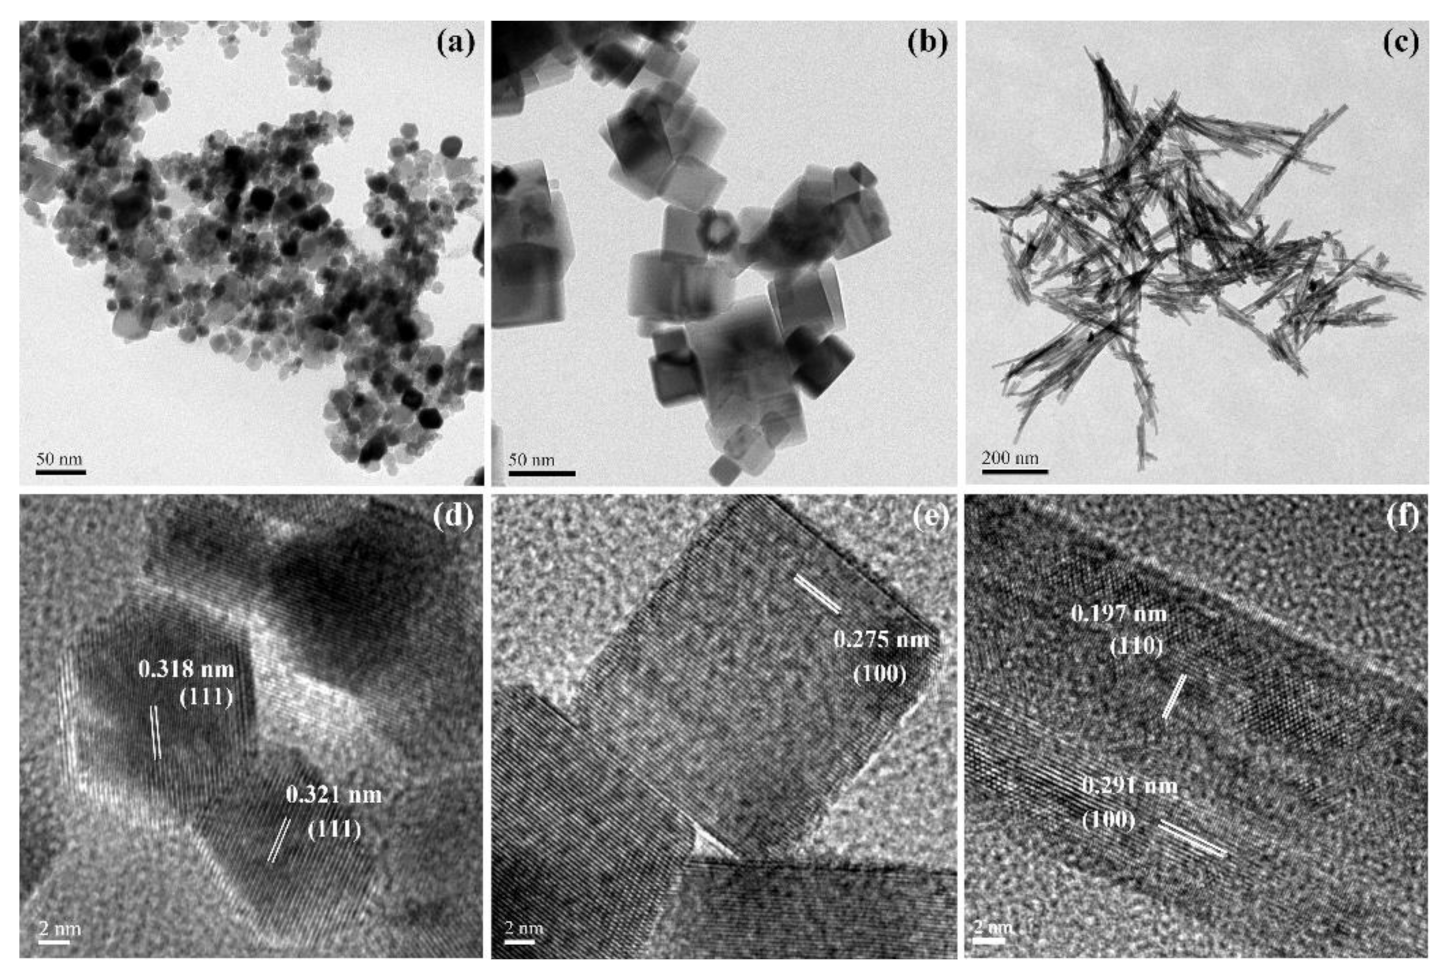
In Figure 2, TEM images clearly exhibit that the synthesized nanoceria samples own the desired morphology of polyhedron, cube and rod, the counted statistical particle size of synthesized ceria is given in Figure S1, showing the average size of P-CeO2, C-CeO2 and R-CeO2 is around 9, 40, and 100 nm (for length), respectively. From the HRTEM images as shown in Figure 2, the spacing lattice fringes are measured as 0.318 and 0.321 nm for the P-CeO2 associating with presenting (111) plane, and the (100) face is found in the HRTEM image of C-CeO2, while both (110) and (100) planes are exposed in the R-CeO2, which is in agreement with the theory for the main exposing face of various shaped ceria [38].

3.2. Reduction of Ceria in H2

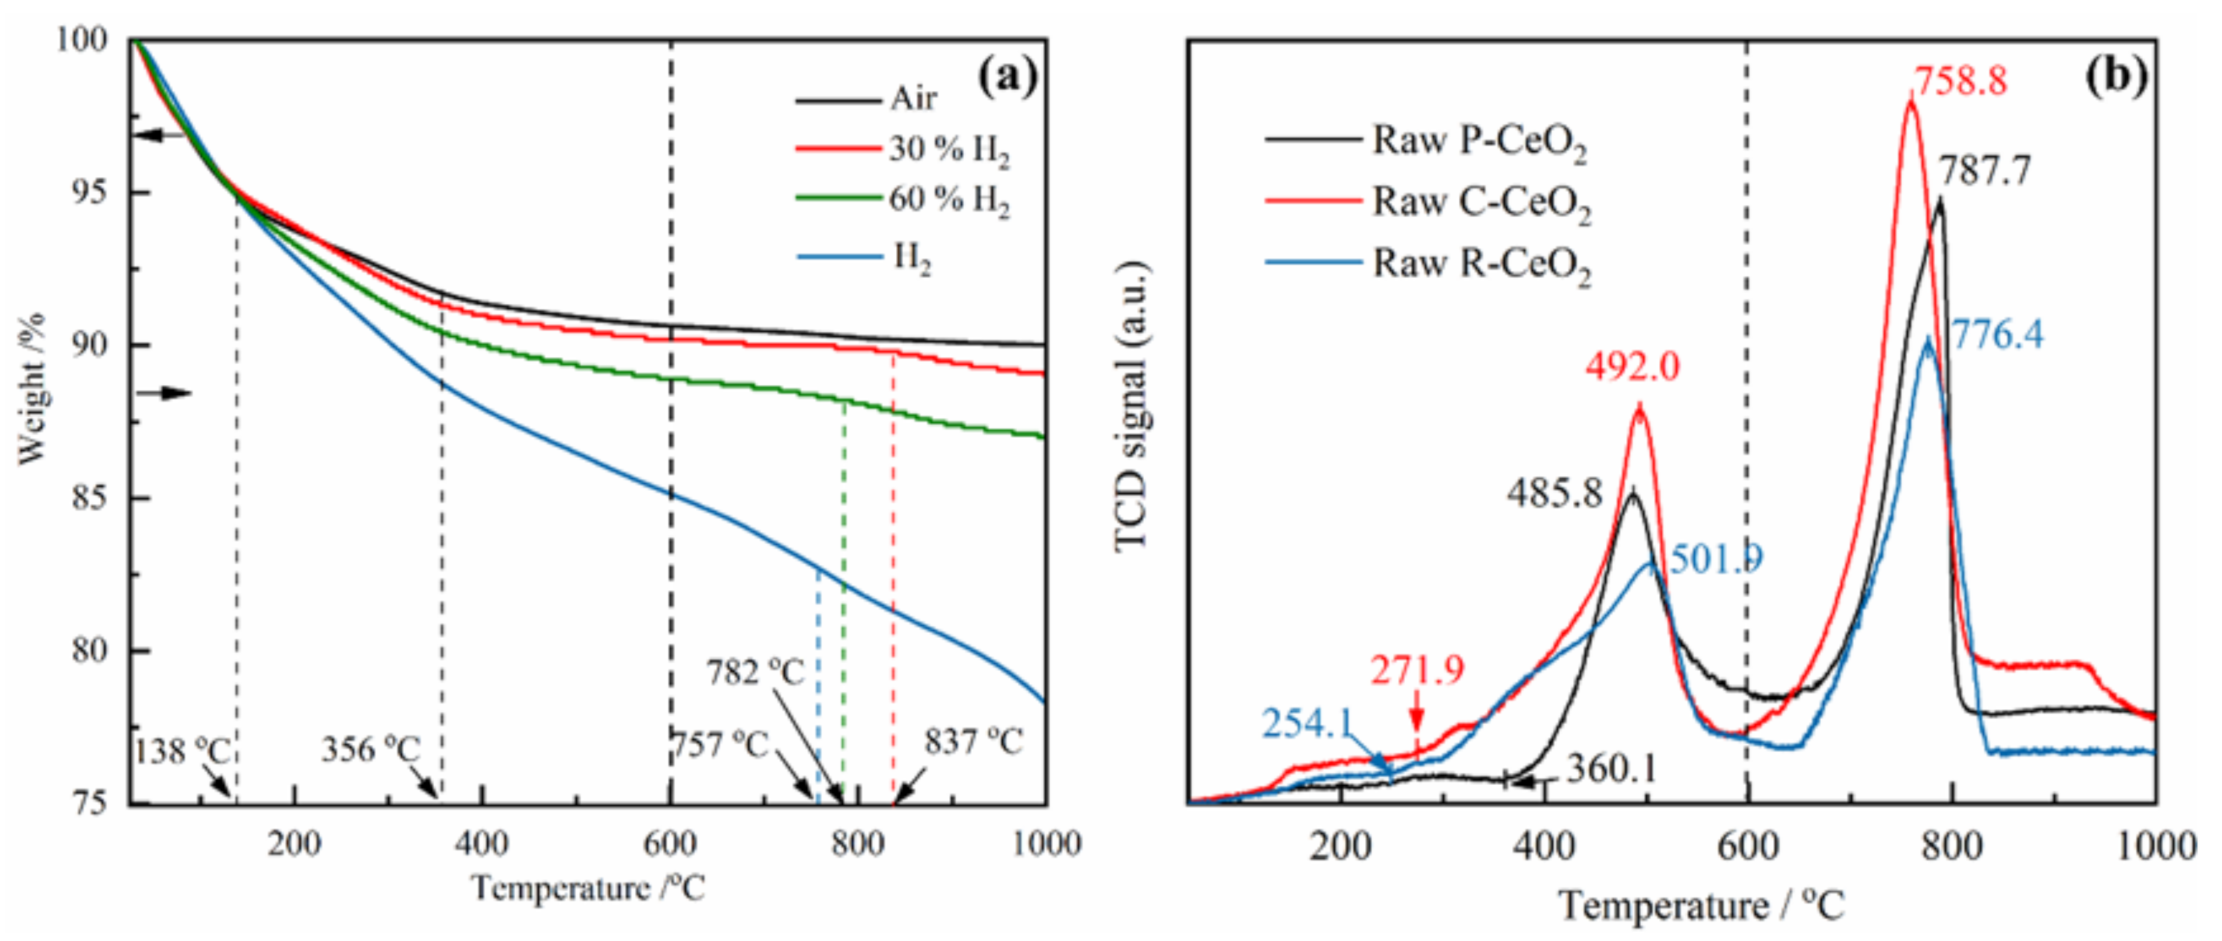
The TG analysis results of raw R-CeO2 under different atmospheres are shown in Figure 3a, obviously weight loss can be found under each atmosphere and the weight loss increases in a higher H2 concentration atmosphere. In air condition, the first weight loss is about 5.6 wt. % corresponding to the vaporization of free water, then the R-CeO2 continues to weightlessness from 138 to 356 °C, where the weight loss is about 3.2 wt. %, which may be in connection with the Ce(OH)4 decomposition [47]. At a higher temperature, the weight signal of sample stabilizes at about 89.0 wt. % of initial weight. The weight loss of ceria in 30%, 60% or pure H2 atmosphere can be divided into four steps: (i) free water evaporation; (ii) H2 adsorbs on the surface of R-CeO2 and hydroxylates with Ce4+ accompanying by the water decomposing [48], which leads to around 2.9, 4.2 and 5.7 wt. % of weightlessness at 356 °C under different hydrogen concentration; (iii) the surface of R-CeO2 is continually and incompletely reduced by H2, and the decrement of weight is about 1.7 wt. % at 837 °C for 30% H2, 2.0 wt. % at 782 °C for 60% H2, and 6.0 wt. % at 757 °C for pure hydrogen atmosphere, respectively; (iv) the subsurface of ceria is reduced and tends to form Ce2O3 [37]. With the increasing of H2 concentration, the weight loss of raw R-CeO2 at the same temperature increases, which means more O atoms are divorced from ceria lattice by the following reaction:
CeO2 + x H2 ↔ CeO2−x + x/2 H2O (g),
where 0 < x < 0.5, and nonstoichiometric value of x depends on the temperature and H2 partial pressure.
The H2-TPR results of synthesized raw CeO2 are shown in Figure 3b. The first and second peak shown in TPR curves corresponds to the surface reduction and bulk reduction of ceria by hydrogen, respectively [36]. The synthesized various structural nanoceria samples show different start/end reduction temperatures for the first reduction stage of three tested samples, where R-CeO2 has the widest reduction range of 254.1–501.9 °C, P-CeO2 shows the narrowest range from 360.1 to 485.8 °C, followed by the 271.9–492.0 °C for C-CeO2. At the second reduction step, the maximum reduction peaks are found to be achieved at the temperature of 758.8, 776.4 and 787.7 °C for C-CeO2, R-CeO2 and P-CeO2, respectively. The notable diversity of the reducing behavior for the R-CeO2, C-CeO2 and P-CeO2 further verifies the different activities of the mainly exposed crystal faces in ceria, where (110) and (100) are more active than (111) facet [40,41,49,50]. Based on the TG and H2-TPR results, annealing ceria at a same temperature of 600 °C in different hydrogen partial pressure atmosphere will produce ceria samples with various concentration of surface OVs.

3.3. OVs Characterization

Three shaped ceria powders were annealed in four types of atmospheres, and different colored products were obtained, where the ceria annealed in air is pale yellow for P-CeO2 and R-CeO2, white for C- CeO2, and then turns to greyish-green or blue-yellow with the increasing of H2 partial pressure, and the colors of annealed ceria are shown in Figure S2. It is known that the color of pure and stoichiometric cerium dioxide is pale yellow [51], and its color will turn to blue or even black after the formation of nonstoichiometric ceria [52], the observed color variation means an abundance of OVs were generated after hydrogen annealing.
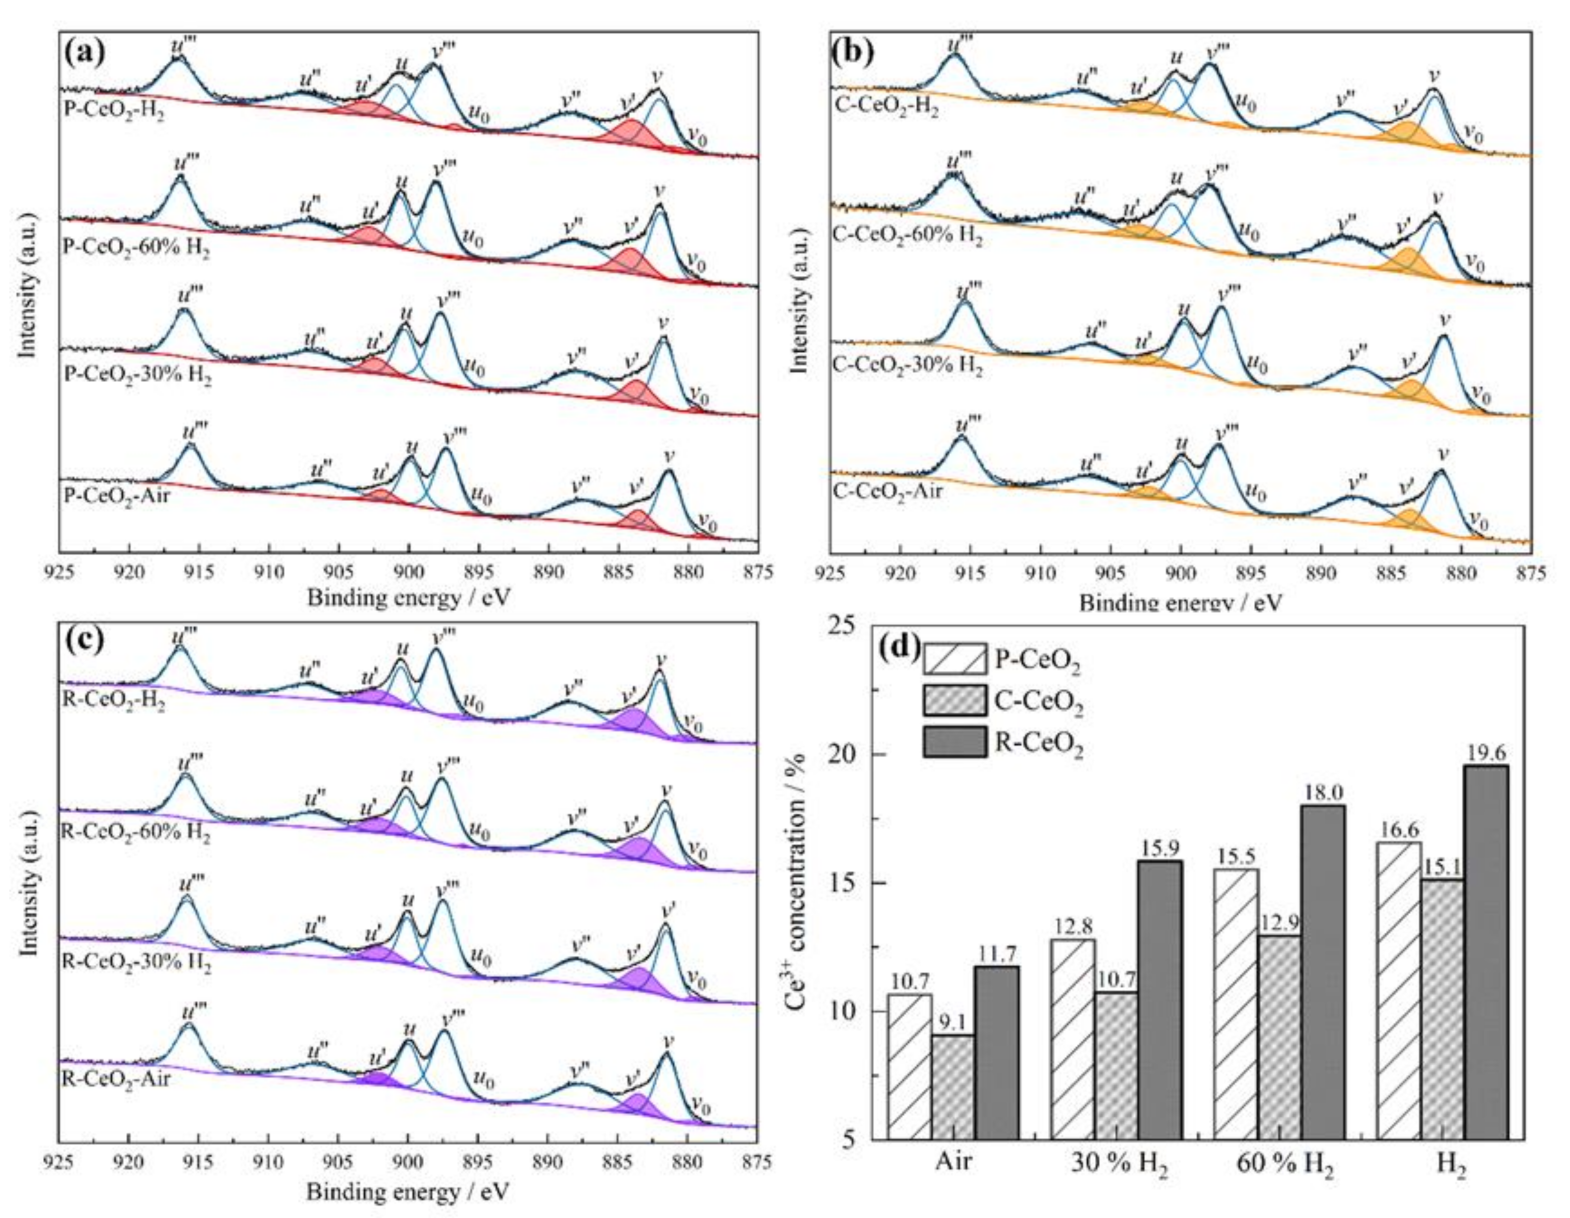
The Ce 3d spectra of raw and annealed ceria are shown in Figure 4, three final states of Ce4+, including Ce3d94f0O2p6, Ce3d94f1Op5 and Ce3d94f2O2p4 expressed as u’’’ (v’’’), u’’ (v’’) and u (v) for Ce3d3/2(Ce3d5/2), respectively; two final states of Ce3+, including Ce3d94f1O2p6 and Ce3d94f2O2p5, are expressed as u’ (v’) and u0 (v0) for Ce3d3/2(Ce3d5/2) [53,54,55,56]. The Ce3+ fraction was calculated by the following equation [57].
Ce3+ / (Ce3+ + Ce4+) = area(v0, u0, v′, u′) / total area.
As shown in Figure 4, the areas of v’ and u’ corresponding to the Ce3+ are increasing after annealing in a higher hydrogen contained atmosphere, which means more Ce4+ in ceria was reduced to Ce3+. Calculated Ce3+ fractions are shown in Figure 4d, where an obvious rising of Ce3+ fraction can be found with the increasing of hydrogen concentration, the Ce3+ % increases from 10.66 to 16.56%, 9.71 to 15.12%, and 11.73 to 19.55% for the P-CeO2, C-CeO2, and R-CeO2, respectively. More OVs appear on the surface of R-CeO2 which is related to the suitable surface activity of (110) facet [58]. In O 1s spectra (are given in Figure S3), oxygen species are originated from lattice oxygen (OL) attached to Ce4+ ion and adsorbed oxygen to Ce3+ site (OV), which can be deconvoluted into two peaks at around 529.2 and 531.3 eV, respectively [59,60]. The area and intensity of OV peak are relevant to the oxygen vacancy in the host lattice, which is calculated and given in Table S2. It can be found that the OV fraction of ceria increases with the rising of H2 concentration in annealing gas, which further identified the results shown in Ce 3d spectra that more surface OVs are generated after annealing in a higher H2 concentration atmosphere at 600 °C.

3.4. Photocatalytic Activities

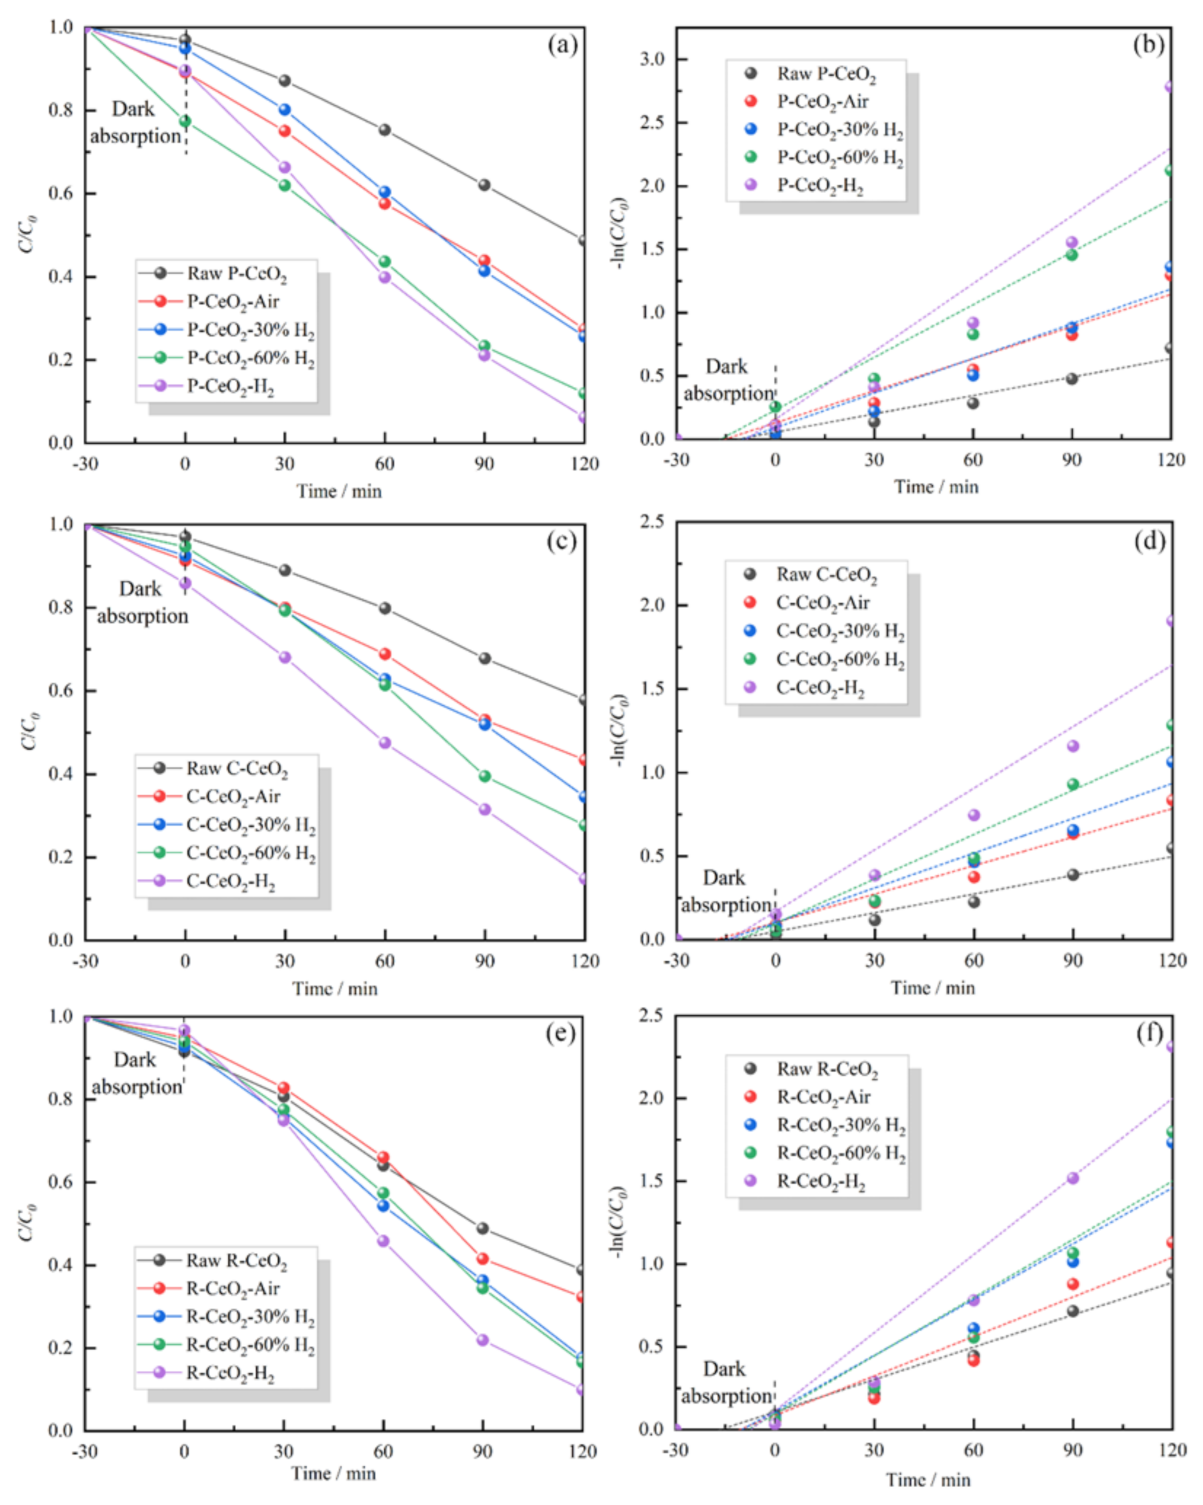
Photocatalytic properties of tested ceria are shown in Figure 5, and the photodegradation ratio of the tested samples is presented in Table S3 together with the calculated degradation rate constants. It is clearly found that the annealed ceria has a higher photocatalytic activity than that of raw material, and the photocatalytic activities of three structural ceria are elevated gradually with the increasing of surface OVs concentration. The observed results further verified the reported results [20,21,22,26] that the OVs are beneficial for the enhancement of photocatalytic property of ceria. P-CeO2-H2 has the highest photodegradation ratio of MB of 93.82%, which is larger than 90.09% of R-CeO2-H2 and 85.15% of C-CeO2-H2. The excellent photocatalytic activity of P-CeO2 may be due to its smallest average particle size around 9 nm.
As it is known that size [61], morphology [62] and OVs concentration [63] are the main factors which influence the photocatalytic activity as well as the photoelectric characterizations of ceria. The TEM images of the CeO2 annealed in air and pure hydrogen are given in Figures S4–S7. It can be seen that the annealed P-CeO2 still exhibits (111) facet, the crystal plane of annealed C-CeO2 is transformed from (100) to stable (111). The plane of calcined R-CeO2-Air is also tended to (111) with small particles aggregating, but the previously existing (110) facets are turned to active (100) in R-CeO2-H2 with the small holes on nanorods. The average particle size of P-CeO2-H2 and C-CeO2-H2 is larger than that of P-CeO2-air, and C-CeO2-air, respectively, but the length of R-CeO2-H2 is found as around 60 nm which is shorter than that of R-CeO2-air.
The XRD patterns of C-CeO2 annealed in air, 30%, 60% and pure H2 are shown in Figure S8. It can be found that all annealed samples have the similar diffraction pattern of CeO2, no peaks of Ce2O3 can be found. The calculated crystal size is given in Table S4, the crystal size of the ceria increased after annealing, which is in agreement with the TEM images, while the sample annealed in hydrogen has a slightly increased crystal size compared with that in air. Moreover, the nitrogen adsorption–desorption isotherms of the P-CeO2, C-CeO2, and R-CeO2 calcining in air or pure H2 are shown in Figure S9. It was calculated that the BET surface area of P-CeO2-air, C-CeO2-air and R-CeO2-air is 60.25, 20.94 and 68.20 m2/g, respectively, where that of P-CeO2-H2, C-CeO2-H2 and R-CeO2-H2 is 10.41, 16.43, and 44.76 m2/g. We found that the BET surface area of all samples decreased after calcining in H2, which further indicates that the surface OVs concentration is the major factor on the photocatalytic properties of ceria in this study. In addition, the excellent photocatalytic performance of P-CeO2 may be related to the ordered mesoporous structure.
Hence, the similar morphology, size and BET surface area of the annealed ceria in different atmospheres suggests that the surface OVs concentration is the major factor in the photocatalytic properties of ceria in this study.

3.5. Band Structure of as Prepared Ceria

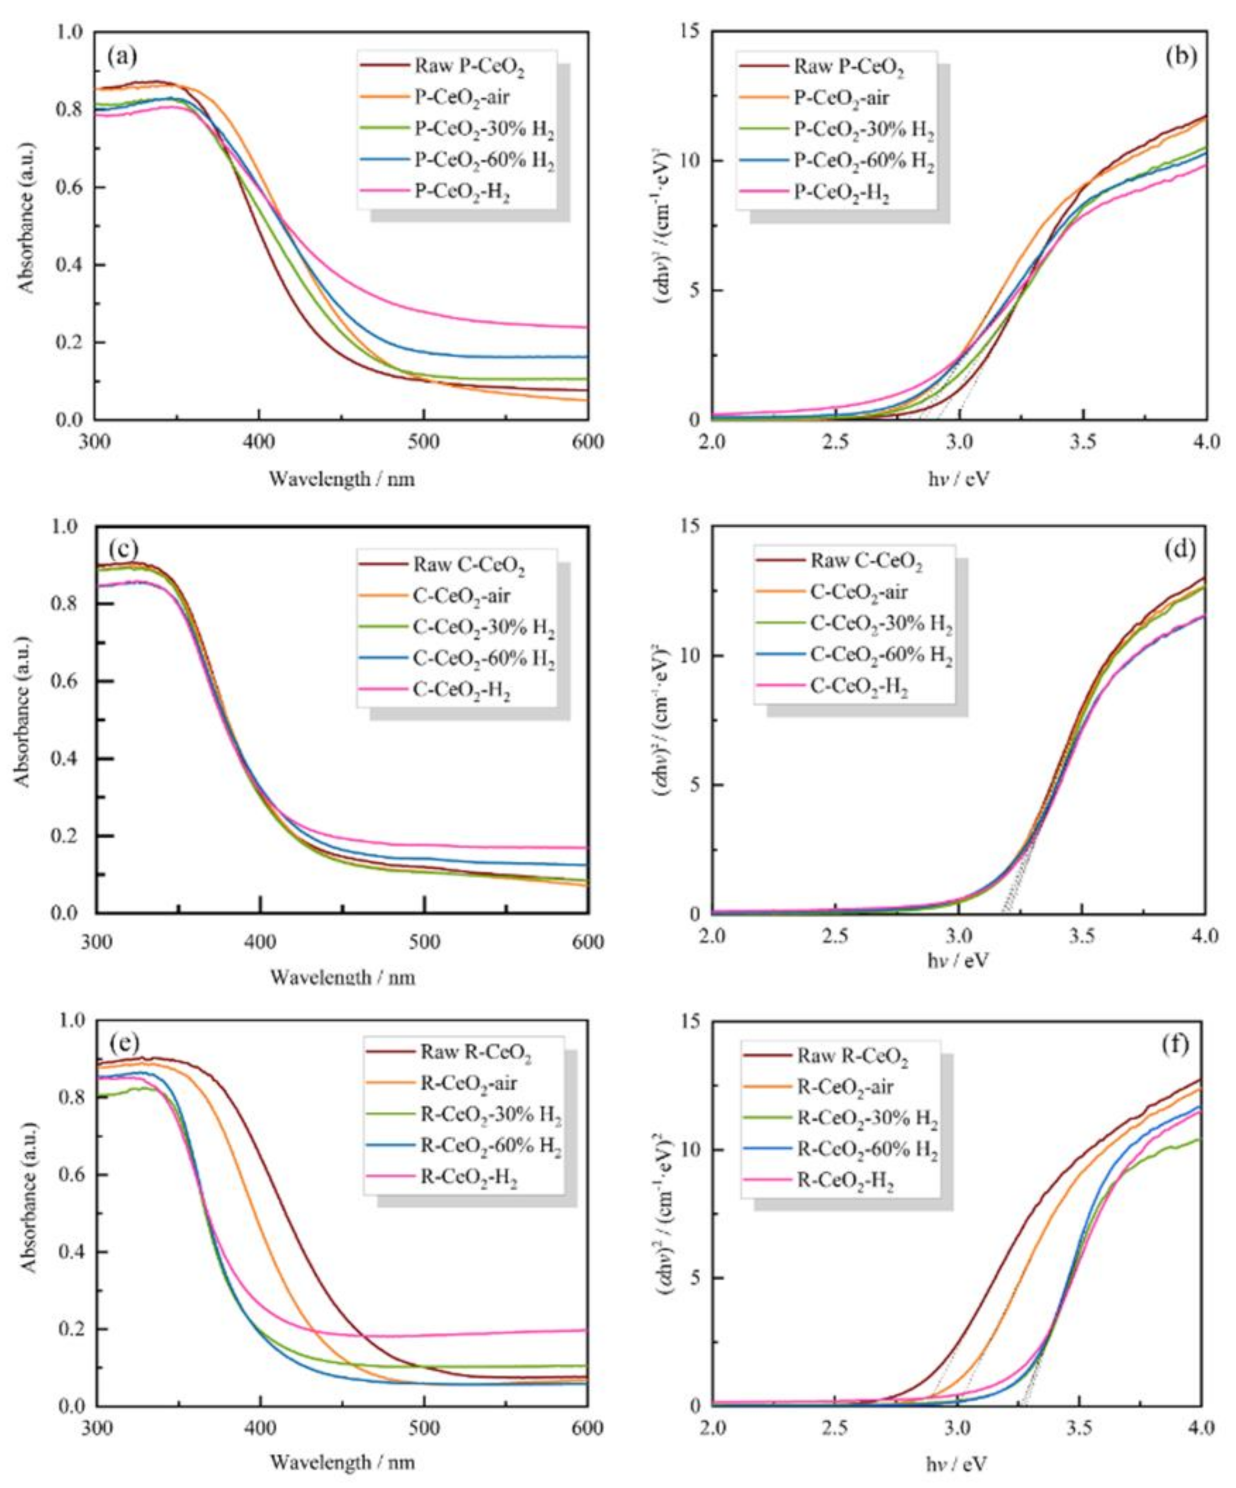
The UV-Vis DRS spectra and the band energy curves of CeO2 are shown in Figure 6, and the calculated band gap values are given in Table S5, and it is found that the variations of the light absorption behavior and the band gap for the different morphology ceria before and after annealing are not stereotyped. After annealing, the band gap firstly expands and then slightly narrows with the increase of surface OVs concentration. Raw P-CeO2 has a band gap of 2.987 eV, while the band gap values of annealed cubic nanoceria are in the range of 2.796–2.864 eV. C-CeO2 samples have similar band gaps of 3.170–3.204 eV. Raw R-CeO2 has a narrower band gap of 2.882 eV than that of annealed R-CeO2 samples, while the band gap value of R-CeO2-air increases to 3.019 eV and then turns to 3.283 eV for 30% H2 annealed sample, by continually increasing the H2 concentration the values tend to decrease slightly. Interestingly, the observed variations of band gap are quite different from the previous reports (e.g., [21,26]), and no significant changes of band gap are observed with the increasing of OVs concentration, which indicates that the surface OVs generated by hydrogen annealing at 600 °C have minimal effects on the band gap of nanoceria.
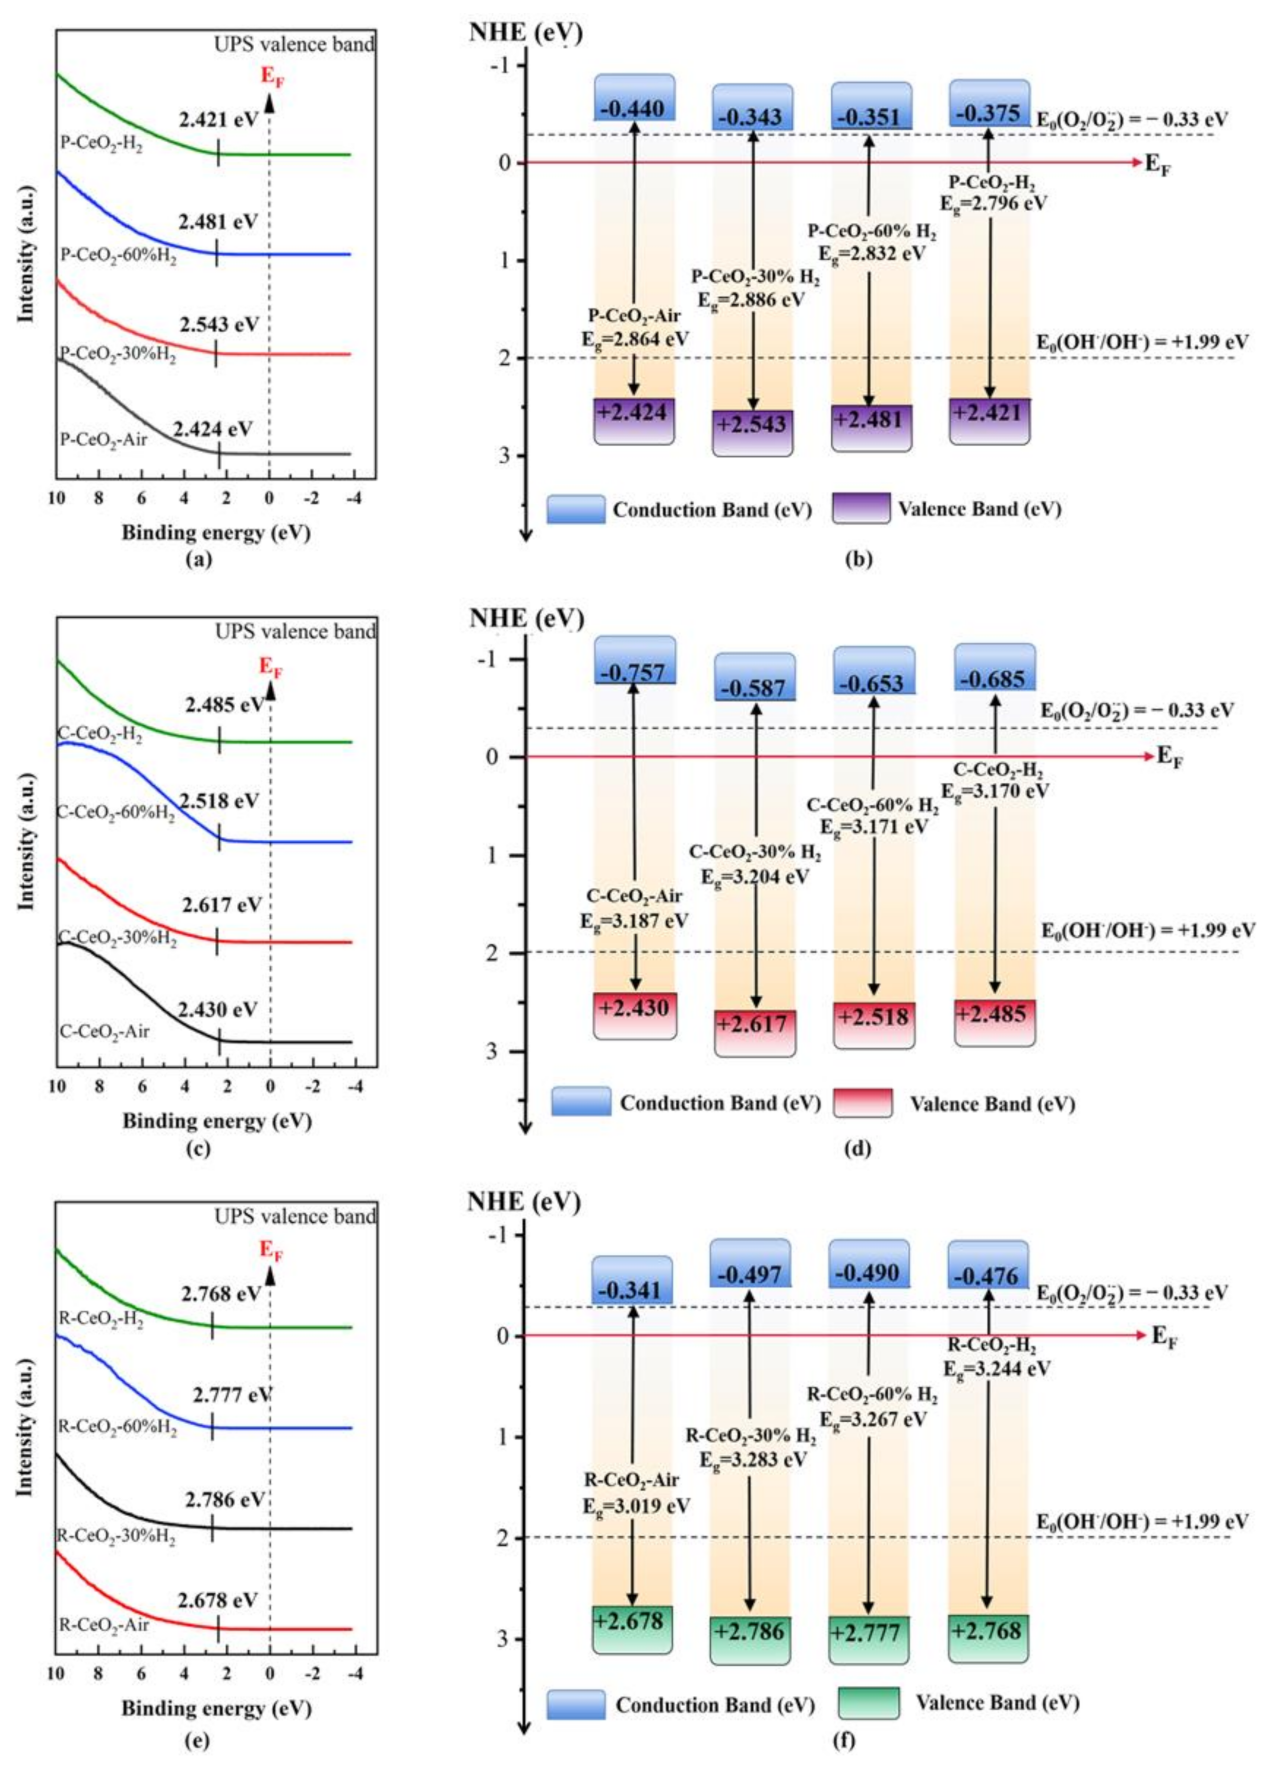
Band gap energy (Eg) of ceria depends on the conduction band (CB) and valence band (VB), the energy of VB (EVB) of annealed ceria was analyzed by UPS and the results are shown in Figure 7, where the band edge position of CB (ECB) was calculated based on the relationship as given in Equation (5).
EVB = ECB + Eg.
Moreover, the value of EVB and ECB can be generally calculated by the Mullikan Electronegativity equation [64]:
ECB = χ − EC − 1 / 2 Eg,
where χ is the absolute electronegativity of EC the semiconductor, the χ value of CeO2 is reported as 5.56 eV [65], and EC is the energy of free electrons on the hydrogen scale (−4.5 eV [66]). The measured and calculated EVB and ECB are listed in Table S5, where it can be found that the band edge positions obtained under different conditions present a similar variation trend for the same shaped ceria samples. For three studied structured ceria, the EVB expands to a more positive position when the annealing atmosphere turns to 30% H2 from air, then decreases with the rising of H2 concentration. On the contrary, the values of ECB of C-CeO2 and P-CeO2 are firstly moved to the Fermi level closely and then become more negative with the OVs concentration rising, while the ECB of R-CeO2 is firstly expanded to a more negative position and then turns back to Fermi level with the increase of surface OVs.

3.6. Separation/Recombination of e/h+

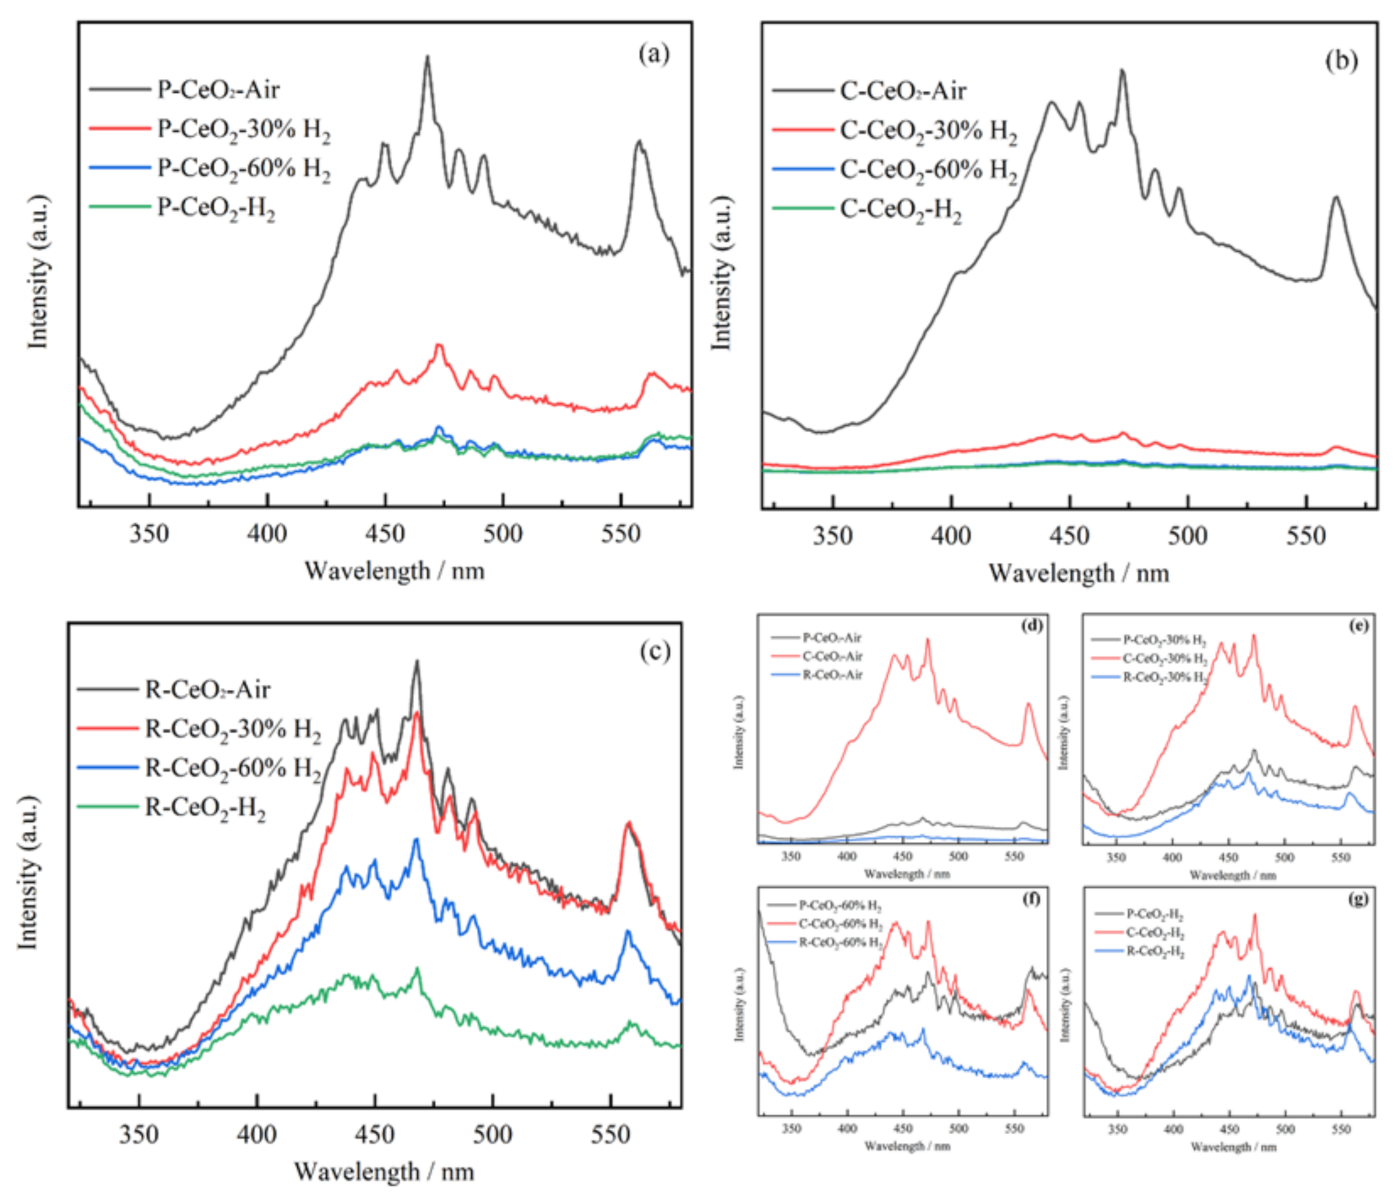
PL spectra, as shown in Figure 8, were employed to investigate the recombination efficiency of photoinduced electrons and holes, where a lower recombination rate is characterized by a lower PL intensity [17,67]. It can be found that all PL spectra show strong blue emission peaks centered at 430–490 nm, which is associated with the defect levels localized between the Ce 4f and O 2p bands [68,69,70,71]. With the rising of surface OVs concentration, the intensities of PL spectra for P-CeO2 and C-CeO2 obviously weaken firstly, then decrease slightly. However, the intensities of emission spectra for R-CeO2 samples are continually weakening with the increasing of OVs concentration, which may offer an evidence for the potential or further reducing of the recombination rate of photogenerated carrier for ceria nanorod with a higher surface OVs concentration. Besides, after annealing in air, 30% and 60% H2, R-CeO2 shows a lower PL intensity than that of other typical structure nanoceria, while after annealing in pure hydrogen, the P-CeO2 exhibits the lowest PL intensity.
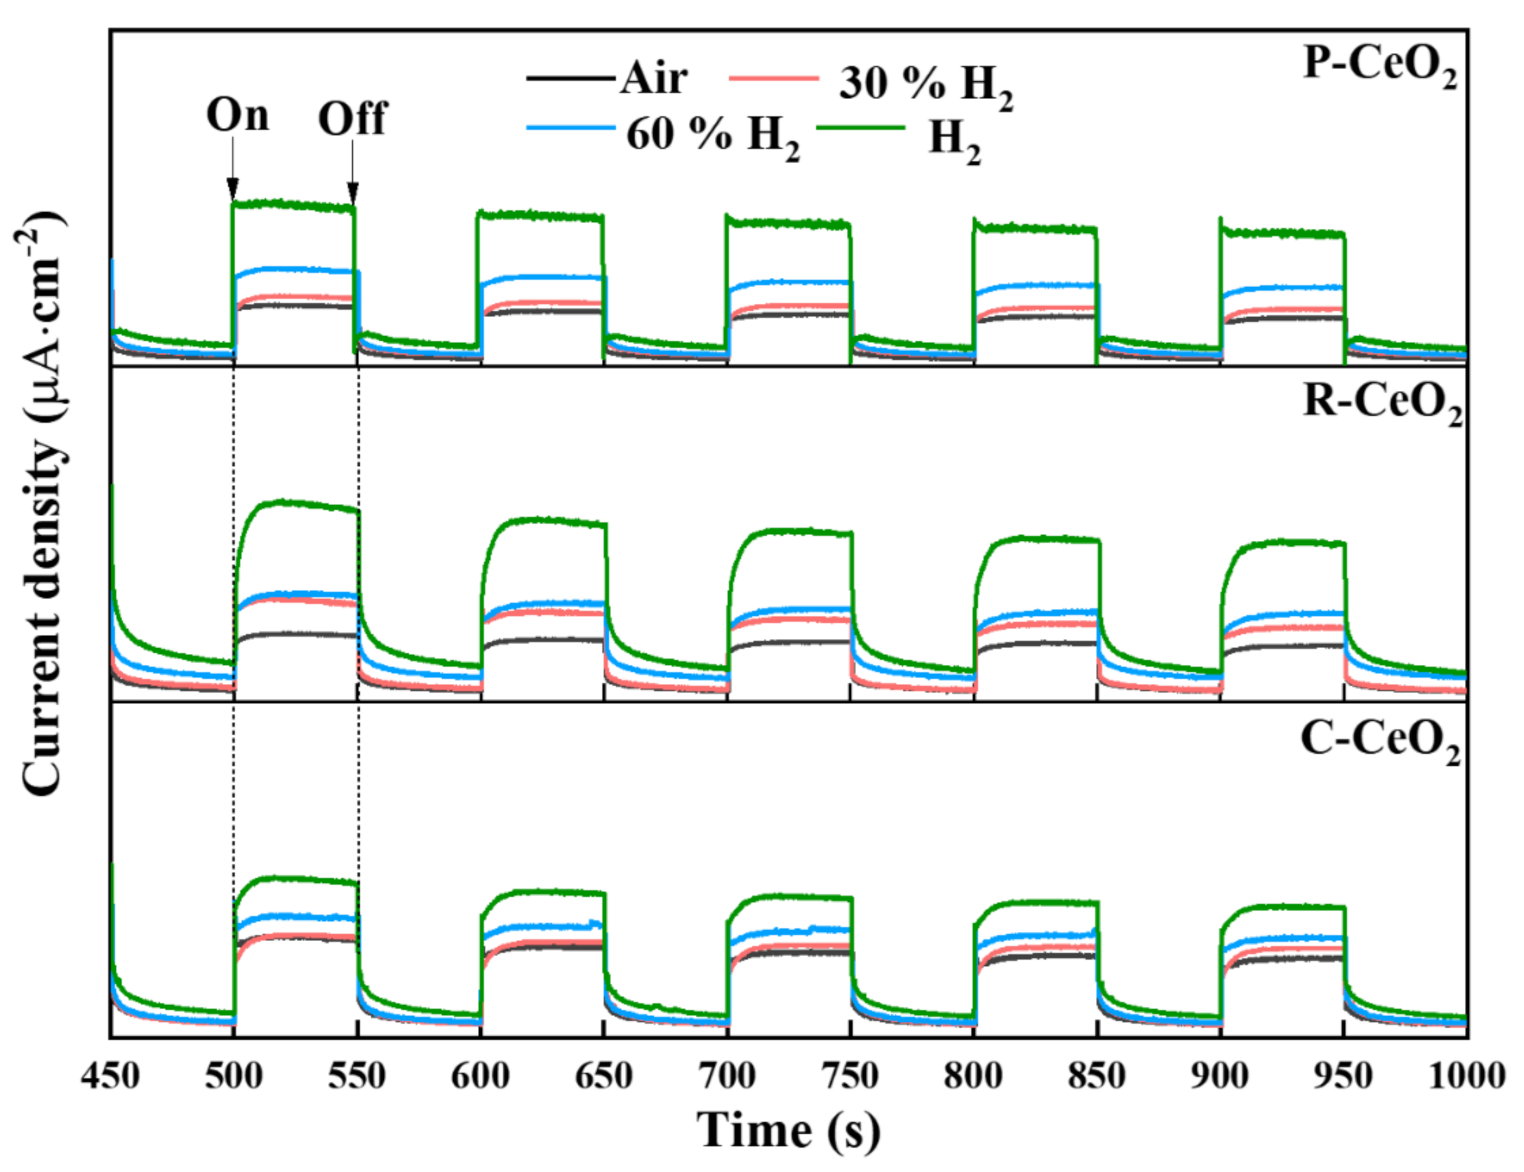
In order to further confirm the separation efficiency of photogenerated electron-hole pairs of the studied samples [72], the transient photocurrent response experiments were measured, and the average photocurrent densities are shown in Figure 9 and Table S6. Higher photocurrent densities are presented with the rising of surface OVs concentration in P-CeO2, C-CeO2 and R-CeO2 annealed in increasing concentration of H2, which suggests a higher surface OVs concentration may elevate the e/h+ separation efficiency of CeO2 photocatalyst. It is generally known that a higher separation and lower recombination rate of e/h+ are beneficial to the better photocatalytic activity [73], which provide further evidence for the enhancement of photocatalytic activity of ceria after annealing in hydrogen.

3.7. Proposed Mechanism for Photocatalytic Enhancement

To evaluate the contributions of surface OVs on the photoelectric characterizations and photocatalytic activity of ceria, the offset values of each property of different hydrogen annealed ceria compared with the air annealed CeO2 were calculated using the following equation:
Offset Value = (PiP0)/P0 × 100%,
where P means the properties including band gap value, photodegradation ratio of MB at 2 h or the photogenerated current, i (i = 0, 1, 2, and 3) represents the number of annealed samples, where 0, 1, 2, and 3 means the sample annealed in air, 30%, 60%, and pure H2, respectively.
The relationships of offset values vs. surface Ce3+ concentration of ceria are shown in Figure 10 and Table S7. The offset value of band gap is slightly decreasing with the increasing of surface Ce3+ while the 30% H2 annealed samples have a wider band gap than that of air annealed ceria, suggesting that surface OVs may expand the band gap of ceria firstly, and then the band gap value tends to decrease slightly with a continual rising of surface OVs. Revealed results may explain the reported references, e.g., Gao et al. [22] obtained rich surface OVs ceria by surface engineering with a blue shift of the UV-Vis spectra. Interestingly, the variations both of the offset value of photodegradation ratio and the photocurrent density are notably rising with an increase of surface OVs, which indicates that the reduction of e/h+ recombination may be the major contribution of surface OVs on the enhancement of photocatalytic activity under same light source.
Comparing the effects of surface OVs on different shaped ceria, it can be found that surface OVs affect the photocatalytic activity most significantly on the cubic ceria, while C-CeO2 contains low surface OVs due to its large particle size and high activity of (100) facet, more surface OVs induced in ceria nanocube lattice may result in a moderate photocatalytic activity. Even the effect of surface OVs working on photocatalytic activity of R-CeO2 is slightly smaller than that of P-CeO2, but more OVs can be generated in the R-CeO2, which also results in a high photocatalytic activity. On the other hand, the polyhedral ceria has the smallest size distribution, which may be one of important reasons for its excellent photocatalytic property.
Based on the revealed results, the contributions of surface OVs on the photocatalytic activity of ceria can be concluded as shown in Figure 11. In the range of studied surface OV concentration in cubic, polyhedral or rod-like ceria, a significantly reduction of the combination of e/h+ is the major contribution of surface OVs on the promoted photocatalytic activity, while the band gap varies slightly. The surface OVs in CeO2 lattice are rearranged to produce small microdomains [74] and ordered together to form electron deep traps which can facilitate the reduction of the recombination rate between photoelectrons and holes during the photocatalytic process [24,75]. Moreover, surface OVs profit the adsorption of O2 or OH on ceria surface, which will promote the generation of radical and reduce the recombination of e/h+ photocarriers [69]. Hence, under the same illumination condition, the photocatalytic activity is obviously enhanced with the rising of surface OVs concentration, which is majorly influenced by the reduced recombination of e/h+. In addition, the effect rule of surface OVs on photoelectric characterizations and photocatalytic activity of cubic, polyhedral and rod-like ceria is similar but with different incidence, furthermore, reducing particle size and gaining OVs concentration of ceria are still the major tactics for enhancing its photocatalytic activity.

4. Conclusions

After sufficient discussion of the revealed results, it can be concluded that a concentration gradient of surface OVs can be generated in ceria lattice after annealing nanoceria at 600 °C in various H2 concentration atmospheres, and the ceria annealed in hydrogen has a larger particle size and the exposing lattice face tuned after annealing. Surface OVs significantly enhanced the photocatalytic activity of ceria, the MB degradation ratio after 2 h with pure hydrogen annealed C-CeO2, P-CeO2, or R-CeO2 is 85.15%, 93.82% and 90.09%, respectively, which is 1.5, 1.29 and 1.33 times higher than that of the air annealed sample. The band structure, including band gap, VB, and CB of annealed samples vary slightly, even the surface OVs in ceria lattice changed obviously. Recombination of photoinduced carrier, e/h+, has a notable reduction with the rising of surface OVs, which is suggested to be the main contribution for the enhancement of photocatalytic activity of ceria with more surface OVs.

Supplementary Materials

The following are available online at https://www.mdpi.com/article/10.3390/nano11051168/s1, Figure S1. Size distribution of raw P-CeO2 (a), C-CeO2 (b) and R-CeO2 (c). Figure S2. Color variation of P-CeO2, C-CeO2 and R-CeO2 (from left to right) calcining in different atmospheres: (a) raw samples without annealing, (b) air, (c) 30% H2, (d) 60% H2, and (e) pure H2 condition. Figure S3. O 1s spectra of P-CeO2 (a), C-CeO2 (b) and R-CeO2 (c) calcining in different concentration of H2. Figure S4. TEM images and size distribution of P-CeO2 calcining in air (ac) and H2 (df) at 600 °C. Figure S5. TEM images and size distribution of C-CeO2 calcining in air (ac) and H2 (df) at 600 °C. Figure S6. TEM images and size distribution of R-CeO2 calcining in air (ac) and H2 (df) at 600 °C. Figure S7. TEM images of raw R-CeO2 (a), R-CeO2-Air (b) and R-CeO2-H2 (c). Figure S8. The XRD patterns of C-CeO2 annealed in air, 30%, 60% and pure H2. Figure S9. Nitrogen adsorption–desorption isotherms of the P-CeO2 (a), C-CeO2 (b), and R-CeO2 (c) calcining in air or pure H2. Table S1. Synthetic conditions of raw P-CeO2, C-CeO2 and R-CeO2. Table S2. Ce3+ and absorbed oxygen concentration of P-CeO2, C-CeO2 and R-CeO2 calcining in different concentration of H2. Table S3. Photocatalytic degradation ratio and rate constants of P-CeO2, C-CeO2, and R-CeO2 calcining in different atmospheres. Table S4. The calculated crystal size of C-CeO2 annealed in air, 30%, 60% and pure H2. Table S5. Energy band gap, calculated valence and conductive band, tested valence and conductive band of P-CeO2, C-CeO2, and R-CeO2 calcining in different concentration of H2. Table S6. Average current density (μA/cm2) of P-CeO2, C-CeO2, and R-CeO2 calcining in different concentration of H2. Table S7. Offset values of photodegradation ratio, band gap and photocurrent density of different hydrogen annealed ceria.

Author Contributions

Conceptualization, Y.L.; data curation, X.X. and X.M.; formal analysis, Y.L.; investigation, Y.L., X.X., X.M., J.Z. and F.L.; methodology, Y.L.; supervision, J.L. and C.C.; writing—original draft, Y.L.; writing—review and editing, X.X., X.M., D.N., Z.C., J.Z. and F.L. All authors have read and agreed to the published version of the manuscript.

Funding

This research was funded by National Natural Science Foundation of China under Grant No. 51804088 and 52074096, the Talents & Platform Funding from Science & Technology Department of Guizhou Province, China, under the Grant No. (2017)5788 and (2018)5781, the Basic Research Program from Science & Technology Department of Guizhou Province (2020)1Y219 and (2019)1082, and the Cultivation Funding of No. 2019(30) and Doctor Funding of No. (2017)04 supported by Guizhou University are gratefully acknowledged.

Data Availability Statement

Data is contained within the article and supplementary material.

Conflicts of Interest

The authors declare no conflict of interest.

References

  1. Reed, K.; Cormack, A.; Kulkarni, A.; Mayton, M.; Sayle, D.; Klaessig, F. Exploring the properties and applications of nanoceria: Is there still plenty of room at the bottom? Environ. Sci. Nano 2014, 1, 390–405. [Google Scholar] [CrossRef] [Green Version]
  2. Kašpar, J.; Fornasiero, P.; Graziani, M. Use of CeO2-based oxides in the three-way catalysis. Catal. Today 1999, 50, 285–298. [Google Scholar] [CrossRef]
  3. Jha, A.; Jeong, D.-W.; Jang, W.-J.; Lee, Y.-L.; Roh, H.-S. Hydrogen production from water–gas shift reaction over Ni–Cu–CeO2 oxide catalyst: The effect of preparation methods. Int. J. Hydrog. Energy 2015, 40, 9209–9216. [Google Scholar] [CrossRef]
  4. Gabrovska, M.; Ivanov, I.; Nikolova, D.; Krstić, J.; Venezia, A.M.; Crişan, D.; Crişan, M.; Tenchev, K.; Idakiev, V.; Tabakova, T. Improved Water–Gas Shift Performance of Au/NiAl LDHs Nanostructured Catalysts via CeO2 Addition. Nanomaterials 2021, 11, 366. [Google Scholar] [CrossRef] [PubMed]
  5. Chueh, W.C.; Falter, C.; Abbott, M.; Scipio, D.; Furler, P.; Haile, S.M.; Steinfeld, A. High-flux solar-driven thermochemical dissociation of CO2 and H2O using nonstoichiometric ceria. Science 2010, 330, 1797–1801. [Google Scholar] [CrossRef] [PubMed] [Green Version]
  6. Ackermann, S.; Sauvin, L.; Castiglioni, R.; Rupp, J.L.; Scheffe, J.R.; Steinfeld, A. Kinetics of CO2 Reduction over Nonstoichiometric Ceria. J. Phys. Chem. C 2015, 119, 16452–16461. [Google Scholar] [CrossRef] [PubMed] [Green Version]
  7. Jasinski, P.; Suzuki, T.; Anderson, H.U. Nanocrystalline undoped ceria oxygen sensor. Sens. Actuators B Chem. 2003, 95, 73–77. [Google Scholar] [CrossRef]
  8. Feng, X.; Sayle, D.C.; Wang, Z.L.; Paras, M.S.; Santora, B.; Sutorik, A.C.; Sayle, T.X.; Yang, Y.; Ding, Y.; Wang, X. Converting ceria polyhedral nanoparticles into single-crystal nanospheres. Science 2006, 312, 1504–1508. [Google Scholar] [CrossRef] [Green Version]
  9. Yang, J.; Xie, N.; Zhang, J.; Fan, W.; Huang, Y.; Tong, Y. Defect Engineering Enhances the Charge Separation of CeO2 Nanorods toward Photocatalytic Methyl Blue Oxidation. Nanomaterials 2020, 10, 2307. [Google Scholar] [CrossRef]
  10. Mao, X.; Xia, X.; Ning, D.; Li, J.; Chen, C.; Lan, Y.-P. Characterizations and photocatalytic activity of ceria nanoparticles synthesized in KCl–LiCl/KOH–NaOH molten flux from different precursors. J. Nanoparticle Res. 2021, 23, 69. [Google Scholar] [CrossRef]
  11. Li, M.; Chen, C.; Xu, L.; Jia, Y.; Liu, Y.; Liu, X. Surface defect-rich ceria quantum dots anchored on sulfur-doped carbon nitride nanotubes with enhanced charge separation for solar hydrogen production. J. Energy Chem. 2021, 52, 51–59. [Google Scholar] [CrossRef]
  12. Huang, Z.-Q.; Li, T.-H.; Yang, B.; Chang, C.-R. Role of surface frustrated Lewis pairs on reduced CeO2 (110) in direct conversion of syngas. Chin. J. Catal. 2020, 41, 1906–1915. [Google Scholar] [CrossRef]
  13. Wang, M.; Shen, M.; Jin, X.; Tian, J.; Li, M.; Zhou, Y.; Zhang, L.; Li, Y.; Shi, J. Oxygen vacancy generation and stabilization in CeO2−x by Cu introduction with improved CO2 photocatalytic reduction activity. ACS Catal. 2019, 9, 4573–4581. [Google Scholar] [CrossRef]
  14. Pu, Y.; Luo, Y.; Wei, X.; Sun, J.; Li, L.; Zou, W.; Dong, L. Synergistic effects of Cu2O-decorated CeO2 on photocatalytic CO2 reduction: Surface Lewis acid/base and oxygen defect. Appl. Catal. B Environ. 2019, 254, 580–586. [Google Scholar] [CrossRef]
  15. Wang, H.; Guan, J.; Li, J.; Li, X.; Ma, C.; Huo, P.; Yan, Y. Fabricated g-C3N4/Ag/m-CeO2 composite photocatalyst for enhanced photoconversion of CO2. Appl. Surf. Sci. 2020, 506, 144931. [Google Scholar] [CrossRef]
  16. Huang, Y.C.; Wu, S.H.; Hsiao, C.-H.; Lee, A.T.; Huang, M.H. Mild Synthesis of Size-Tunable CeO2 Octahedra for Band Gap Variation. Chem. Mater. 2020, 32, 2631–2638. [Google Scholar] [CrossRef]
  17. Xia, X.W.; Lan, Y.P.; Li, J.Q.; Chen, C.Y.; Mao, X.S. Facile synthesis of nanoceria by a molten hydroxide method and its photocatalytic properties. J. Rare Earths 2019, 38, 951–960. [Google Scholar] [CrossRef]
  18. Schmitt, R.; Nenning, A.; Kraynis, O.; Korobko, R.; Frenkel, A.I.; Lubomirsky, I.; Haile, S.M.; Rupp, J.L. A review of defect structure and chemistry in ceria and its solid solutions. Chem. Soc. Rev. 2020, 49, 554–592. [Google Scholar] [CrossRef] [Green Version]
  19. Pinto, F.M.; Suzuki, V.Y.; Silva, R.C.; La Porta, F.A. Oxygen Defects and Surface Chemistry of Reducible Oxides. Front. Mater. 2019, 6, 260. [Google Scholar] [CrossRef]
  20. Ma, R.; Islam, M.J.; Reddy, D.A.; Kim, T.K. Transformation of CeO2 into a mixed phase CeO2/Ce2O3 nanohybrid by liquid phase pulsed laser ablation for enhanced photocatalytic activity through Z-scheme pattern. Ceram. Int. 2016, 42, 18495–18502. [Google Scholar] [CrossRef]
  21. Choudhury, B.; Choudhury, A. Ce3+ and oxygen vacancy mediated tuning of structural and optical properties of CeO2 nanoparticles. Mater. Chem. Phys. 2012, 131, 666–671. [Google Scholar] [CrossRef]
  22. Gao, W.; Li, J.; Ma, Y.; Qu, Y. Surface engineering on CeO2 nanorods by chemical redox etching and their enhanced catalytic activity for CO oxidation. Nanoscale 2015, 7, 11686–11691. [Google Scholar] [CrossRef] [PubMed]
  23. Mao, X.; Xia, X.; Li, J.; Chen, C.; Gu, X.; Li, S.; Lan, Y.-P. Self-assembly of structured CeCO3OH and its decomposition in H2 for a novel tactic to obtain CeO2−x with excellent photocatalytic property. J. Alloy. Compd. 2021, 870, 159424. [Google Scholar] [CrossRef]
  24. Ansari, S.A.; Khan, M.M.; Kalathil, S.; Nisar, A.; Lee, J.; Cho, M.H. Oxygen vacancy induced band gap narrowing of ZnO nanostructures by an electrochemically active biofilm. Nanoscale 2013, 5, 9238–9246. [Google Scholar] [CrossRef] [PubMed]
  25. Wen, W.; Lou, Z.; Chen, Y.; Chen, D.; Tian, S.; Xiong, Y. Tuning the structural properties of CeO2 by Pr and Fe codoping for enhanced visible-light catalytic activity. J. Chem. Technol. Biotechnol. 2019, 94, 1576–1584. [Google Scholar] [CrossRef]
  26. Yuán, S.; Xu, B.; Zhang, Q.; Liu, S.; Xie, J.; Zhang, M.; Ohno, T. Development of visible light response of CeO2−x with the high content of Ce3+ and its photocatalytic property. ChemCatChem 2018, 10, 1267–1271. [Google Scholar] [CrossRef]
  27. Padeste, C.; Cant, N.W.; Trimm, D.L. The influence of water on the reduction and reoxidation of ceria. Catal. Lett. 1993, 18, 305–316. [Google Scholar] [CrossRef]
  28. Binet, C.; Badri, A.; Lavalley, J.-C. A Spectroscopic Characterization of the Reduction of Ceria from Electronic Transitions of Intrinsic Point Defects. J. Phys. Chem. 1994, 98, 6392–6398. [Google Scholar] [CrossRef]
  29. Ansari, S.A.; Khan, M.M.; Ansari, M.O.; Kalathil, S.; Lee, J.; Cho, M.H. Band gap engineering of CeO2 nanostructure using an electrochemically active biofilm for visible light applications. RSC Adv. 2014, 4, 16782–16791. [Google Scholar] [CrossRef]
  30. Rao, M.R.; Shripathi, T. Photoelectron spectroscopic study of X-ray induced reduction of CeO2. J. Electron Spectrosc. 1997, 87, 121–126. [Google Scholar]
  31. Qiu, L.; Liu, F.; Zhao, L.; Ma, Y.; Yao, J. Comparative XPS study of surface reduction for nanocrystalline and microcrystalline ceria powder. Appl. Surf. Sci. 2006, 252, 4931–4935. [Google Scholar] [CrossRef]
  32. González-Elipe, A.R.; Fernández, A.; Holgado, J.P.; Caballero, A.; Munuera, G. Mixing effects in CeO2/TiO2 and CeO2/SiO2 systems submitted to Ar+ sputtering. J. Vac. Sci. Technol. A 1993, 11, 58–65. [Google Scholar] [CrossRef]
  33. Sundaram, K.B.; Wahid, P.F.; Melendez, O. Deposition and X-ray photoelectron spectroscopy studies on sputtered cerium dioxide thin films. J. Vac. Sci. Technol. A 1997, 15, 52–56. [Google Scholar] [CrossRef]
  34. Holgado, J.; Munuera, G.; Espinós, J.; González-Elipe, A. XPS study of oxidation processes of CeOx defective layers. Appl. Surf. Sci. 2000, 158, 164–171. [Google Scholar] [CrossRef]
  35. Chen, X.; Liu, L.; Peter, Y.Y.; Mao, S.S. Increasing solar absorption for photocatalysis with black hydrogenated titanium dioxide nanocrystals. Science 2011, 331, 746–750. [Google Scholar] [CrossRef] [PubMed]
  36. Zhu, H.; Qin, Z.; Shan, W.; Shen, W.; Wang, J. Pd/CeO2–TiO2 catalyst for CO oxidation at low temperature: A TPR study with H2 and CO as reducing agents. J. Catal. 2004, 225, 267–277. [Google Scholar] [CrossRef]
  37. Lan, Y.P.; Sohn, H.Y. Effect of oxygen vacancies and phases on catalytic properties of hydrogen-treated nanoceria particles. Mater. Res. Express 2018, 5, 035501. [Google Scholar] [CrossRef]
  38. Lee, Y.; He, G.; Akey, A.J.; Si, R.; Flytzani-Stephanopoulos, M.; Herman, I.P. Raman analysis of mode softening in nanoparticle CeO2−δ and Au-CeO2−δ during CO oxidation. J. Am. Chem. Soc. 2011, 133, 12952–12955. [Google Scholar] [CrossRef]
  39. Zhou, Y.; Chen, A.L.; Ning, J.; Shen, W.J. Electronic and geometric structure of the copper-ceria interface on Cu/CeO2 catalysts. Chin. J. Catal. 2020, 41, 928–937. [Google Scholar] [CrossRef]
  40. Zheng, J.; Zhu, Z.; Gao, G.; Liu, Z.; Wang, Q.; Yan, Y.S. Construction of spindle structured CeO2 modified with rod-like attapulgite as a high-performance photocatalyst for CO2 reduction. Catal. Sci. Technol. 2019, 9, 3788–3799. [Google Scholar] [CrossRef]
  41. Wang, Z.J.; Gao, Y.Z.; Chabal, Y.J.; Balkus, K.J. Oxidative Dehydrogenation of Cyclohexane and Cyclohexene over Y-doped CeO2 Nanorods. Catal. Lett. 2017, 147, 738–744. [Google Scholar] [CrossRef]
  42. Xia, X.; Li, J.; Chen, C.; Lan, Y.-P.; Mao, X.; Bai, F. Optimal rare-earth (La, Y and Sm) doping conditions and enhanced mechanism for photocatalytic application of ceria nanorods. Nanotechnology 2021, 32, 195708. [Google Scholar] [CrossRef] [PubMed]
  43. Mai, H.X.; Sun, L.D.; Zhang, Y.W.; Si, R.; Feng, W.; Zhang, H.P.; Liu, H.C.; Yan, C.H. Shape-Selective Synthesis and Oxygen Storage Behavior of Ceria Nanopolyhedra, Nanorods, and Nanocubes. J. Phys. Chem. B 2005, 109, 24380–24385. [Google Scholar] [CrossRef]
  44. Murali, A.; Lan, Y.P.; Sohn, H.Y. Effect of oxygen vacancies in non-stoichiometric ceria on its photocatalytic properties. Nano-Struct. Nano Objects 2019, 18, 100257. [Google Scholar] [CrossRef]
  45. Pouretedal, H.R.; Kadkhodaie, A. Synthetic CeO2 Nanoparticle Catalysis of Methylene Blue Photodegradation: Kinetics and Mechanism. Chin. J. Catal. 2010, 31, 1328–1334. [Google Scholar] [CrossRef]
  46. Liu, B.; Zhao, X.; Terashima, C.; Fujishima, A.; Nakata, K. Thermodynamic and kinetic analysis of heterogeneous photocatalysis for semiconductor systems. Phys. Chem. Chem. Phys. 2014, 16, 8751–8760. [Google Scholar] [CrossRef] [PubMed]
  47. Djuričić, B.; Pickering, S. Nanostructured cerium oxide: Preparation and properties of weakly-agglomerated powders. J. Eur. Ceram. Soc. 1999, 19, 1925–1934. [Google Scholar] [CrossRef]
  48. Perrichon, V.; Laachir, A.; Bergeret, G.; Fréty, R.; Tournayan, L.; Touret, O. Reduction of cerias with different textures by hydrogen and their reoxidation by oxygen. J. Chem. Soc. Faraday Trans. 1994, 90, 773. [Google Scholar] [CrossRef]
  49. Wu, Z.; Li, M.; Howe, J.; Meyer, H.M.; Overbury, S.H. Probing defect sites on CeO2 nanocrystals with well-defined surface planes by Raman spectroscopy and O2 adsorption. Langmuir 2010, 26, 16595–16606. [Google Scholar] [CrossRef]
  50. Esch, F.; Fabris, S.; Zhou, L.; Montini, T.; Africh, C.; Fornasiero, P.; Comelli, G.; Rosei, R. Electron localization determines defect formation on ceria substrates. Science 2005, 309, 752–755. [Google Scholar] [CrossRef]
  51. Neish, A.C. Preparation of pure cerium salts and the color of cerium oxide. J. Am. Chem. Soc. 1909, 31, 517–523. [Google Scholar] [CrossRef] [Green Version]
  52. Mogensen, M.; Sammes, N.M.; Tompsett, G.A. Physical, chemical and electrochemical properties of pure and doped ceria. Solid State Ion. 2000, 129, 63–94. [Google Scholar] [CrossRef]
  53. Burroughs, P.; Hamnett, A.; Orchard, A.F.; Thornton, G. Satellite structure in the X-ray photoelectron spectra of some binary and mixed oxides of lanthanum and cerium. J. Chem. Soc. Dalton Trans. 1976, 1686–1698. [Google Scholar] [CrossRef]
  54. Le Normand, F.; El Fallah, J.; Hilaire, L.; Légaré, P.; Kotani, A.; Parlebas, J.C. Photoemission on 3d core levels of Cerium: An experimental and theoretical investigation of the reduction of cerium dioxide. Solid State Commun. 1989, 71, 885–889. [Google Scholar] [CrossRef]
  55. Romeo, M.; Bak, K.; El Fallah, J.; Le Normand, F.; Hilaire, L. XPS Study of the reduction of cerium dioxide. Surf. Interface Anal. 1993, 20, 508–512. [Google Scholar] [CrossRef]
  56. Skála, T.; Šutara, F.; Škoda, M.; Prince, K.C.; Matolín, V. Palladium interaction with CeO2, Sn–Ce–O and Ga–Ce–O layers. J. Phys. Condens. Matter 2009, 21, 055005. [Google Scholar] [CrossRef]
  57. Borchert, H.; Frolova, Y.V.; Kaichev, V.V.; Prosvirin, I.P.; Alikina, G.M.; Lukashevich, A.I.; Zaikovskii, V.I.; Moroz, E.M.; Trukhan, S.N.; Ivanov, V.P. Electronic and chemical properties of nanostructured cerium dioxide doped with praseodymium. J. Phys. Chem. B 2005, 109, 5728–5738. [Google Scholar] [CrossRef] [PubMed]
  58. Jiang, D.; Wang, W.; Zhang, L.; Zheng, Y.; Wang, Z. Insights into the Surface-Defect Dependence of Photoreactivity over CeO2 Nanocrystals with Well-Defined Crystal Facets. ACS Catal. 2015, 5, 4851–4858. [Google Scholar] [CrossRef]
  59. Du, H.W.; Wang, Y.; Arandiyan, H.; Scott, J.; Wan, T.; Chu, D.W. Correlating morphology and doping effects with the carbon monoxide catalytic activity of Zn doped CeO2 nanocrystals. Catal. Sci. Technol. 2017, 8, 134–138. [Google Scholar] [CrossRef]
  60. Fan, L.; Wang, K.; Xu, K.; Liang, Z.; Wang, H.; Zhou, S.F.; Zhan, G. Structural Isomerism of Two Ce-BTC for Fabricating Pt/CeO2 Nanorods toward Low-Temperature CO Oxidation. Small 2020, 16, 2003597. [Google Scholar] [CrossRef] [PubMed]
  61. Khan, S.B.; Faisal, M.; Rahman, M.M.; Akhtar, K.; Asiri, A.M.; Khan, A.; Alamry, K.A. Effect of particle size on the photocatalytic activity and sensing properties of CeO2 nanoparticles. Int. J. Electrochem. Sci. 2013, 8, 7284–7297. [Google Scholar]
  62. Yang, X.; Liu, Y.; Li, J.; Zhang, Y. Effects of calcination temperature on morphology and structure of CeO2 nanofibers and their photocatalytic activity. Mater. Lett. 2019, 241, 76–79. [Google Scholar] [CrossRef]
  63. Zhang, Q.; Zhao, X.; Duan, L.; Shen, H.; Liu, R. Controlling oxygen vacancies and enhanced visible light photocatalysis of CeO2/ZnO nanocomposites. J. Photochem. Photobiol. A Chem. 2020, 392, 112156. [Google Scholar] [CrossRef]
  64. Islam, M.J.; Reddy, D.A.; Choi, J.; Kim, T.K. Surface oxygen vacancy assisted electron transfer and shuttling for enhanced photocatalytic activity of a Z-scheme CeO2–AgI nanocomposite. RSC Adv. 2016, 6, 19341–19350. [Google Scholar] [CrossRef]
  65. Wetchakun, N.; Chaiwichain, S.; Inceesungvorn, B.; Pingmuang, K.; Phanichphant, S.; Minett, A.I.; Chen, J. BiVO4/CeO2 Nanocomposites with High Visible-Light-Induced Photocatalytic Activity. ACS Appl. Mater. Interfaces 2012, 4, 3718. [Google Scholar] [CrossRef]
  66. Issarapanacheewin, S.; Wetchakun, K.; Phanichphant, S.; Kangwansupamonkon, W.; Wetchakun, N. A novel CeO2/Bi2WO6 composite with highly enhanced photocatalytic activity. Mater. Lett. 2015, 156, 28–31. [Google Scholar] [CrossRef]
  67. Bakkiyaraj, R.; Balakrishnan, M.; Bharath, G.; Ponpandian, N. Facile synthesis, structural characterization, photocatalytic and antimicrobial activities of Zr doped CeO2 nanoparticles. J. Alloy. Compd. 2017, 724, 555–564. [Google Scholar] [CrossRef]
  68. Syed, K.Y.A.; Balamurugan, A.; Devarajan, V.P.; Subramanian, R. Hydrothermal Synthesis of Gadolinium (Gd) Doped Cerium Oxide (CeO2) Nanoparticles: Characterization and Antibacterial Activity. Orient. J. Chem. 2017, 33, 2405–2411. [Google Scholar]
  69. Younis, A.; Chu, D.W.; Kaneti, Y.V.; Li, S. Tuning the surface oxygen concentration of {111} surrounded ceria nanocrystals for enhanced photocatalytic activities. Nanoscale 2016, 8, 378–387. [Google Scholar] [CrossRef]
  70. Magdalane, C.M.; Kaviyarasu, K.; Priyadharsini, G.M.A.; Bashir, A.K.H.; Maaza, M. Improved photocatalytic decomposition of aqueous Rhodamine-B by solar light illuminated hierarchical yttria nanosphere decorated ceria nanorods. J. Mater. Res. Technol. 2019, 8, 2898–2909. [Google Scholar] [CrossRef]
  71. Kesarla, M.K.; Fuentez-Torres, M.O.; Alcudia-Ramos, M.A.; Ortiz-Chi, F.; Espinosa-González, C.G.; Aleman, M.; Torres-Torres, J.G.; Godavarthi, S. Synthesis of g-C3N4/N-doped CeO2 composite for photo catalytic degradation of an herbicide. J. Mater. Res. Technol. 2019, 8, 1628–1635. [Google Scholar] [CrossRef]
  72. Lu, X.; Li, X.; Qian, J.; Miao, N.; Yao, C.; Chen, Z. Synthesis and characterization of CeO2/TiO2 nanotube arrays and enhanced photocatalytic oxidative desulfurization performance. J. Alloy. Compd. 2016, 661, 363–371. [Google Scholar] [CrossRef]
  73. Yang, C.; Yang, J.; Duan, X.; Hu, G.; Liu, Q.C.; Ren, S.; Li, J.L.; Kong, M. Roles of photo-generated holes and oxygen vacancies in enhancing photocatalytic performance over CeO2 prepared by molten salt method. Adv. Powder Technol. 2020, 31, 4072–4081. [Google Scholar] [CrossRef]
  74. Ikegami, L.T. Oxide ionic conductivity and microstructures of Sm- or La-doped CeO2-based systems. Solid State Ion. 2002, 154–155, 461–466. [Google Scholar]
  75. Mao, X.; Xia, X.; Li, J.; Chen, C.; Zhang, J.; Ning, D.; Lan, Y.-P. Homogenously Rare-Earth-Ion-Doped Nanoceria Synthesis in KOH-NaOH Molten Flux: Characterization and Photocatalytic Property. J. Mater. Eng. Perform. 2021. [Google Scholar] [CrossRef]
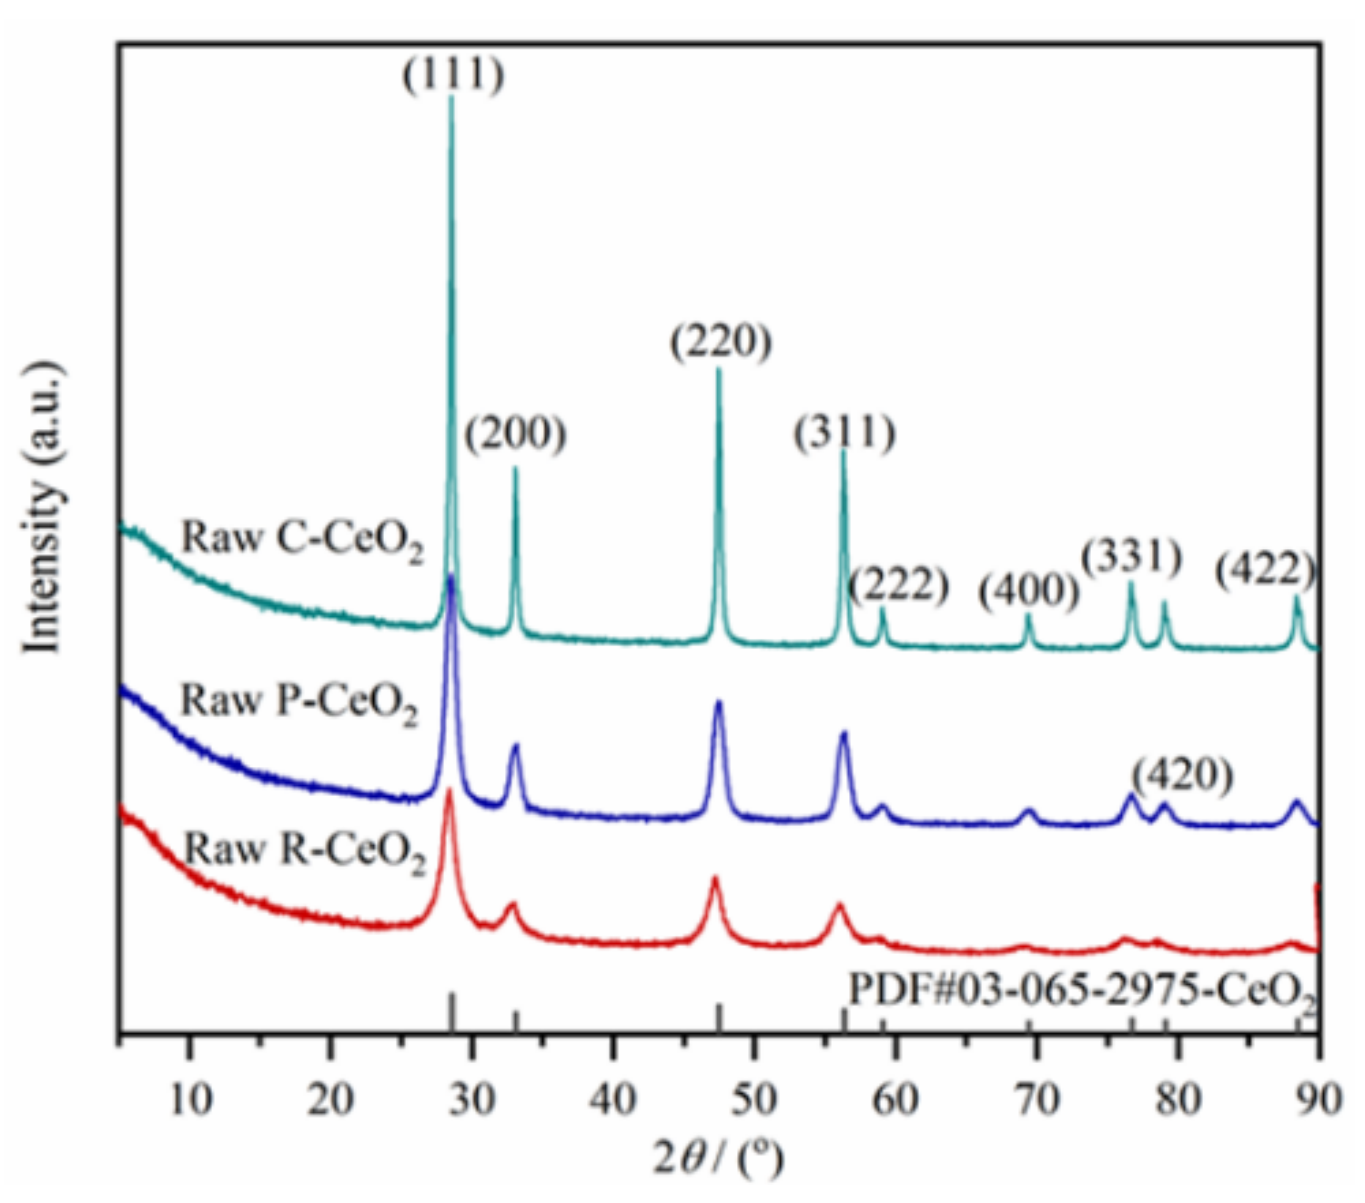
Figure 1. XRD patterns of raw P-CeO2, C-CeO2 and R-CeO2.
Nanomaterials 11 01168 g001
Figure 2. TEM images of raw P-CeO2 (a), C-CeO2 (b) and R-CeO2 (c), HRTEM images of raw P-CeO2 (d), C-CeO2 (e) and R-CeO2 (f).
Nanomaterials 11 01168 g002
Figure 3. Thermal reduction behavior of synthesized ceria, (a) the thermo-gravimetric analysis of raw R-CeO2 under different atmosphere, (b) the H2-TPR of raw P-CeO2, C-CeO2 and R-CeO2.
Nanomaterials 11 01168 g003
Figure 4. The XPS spectra of P-CeO2 (a), C-CeO2 (b) and R-CeO2 (c) annealed in different concentration of H2, and the calculated Ce3+ fractions (d).
Nanomaterials 11 01168 g004
Figure 5. The photocatalytic degradation ratio and rate of P-CeO2 (a,b), C-CeO2 (c,d), and R-CeO2 (e,f) calcining in different atmosphere.
Nanomaterials 11 01168 g005
Figure 6. UV-Vis DRS and energy band curves of P-CeO2 (a,b), C-CeO2 (c,d) and R-CeO2 (e,f) calcining in different concentration of H2.
Nanomaterials 11 01168 g006
Figure 7. UPS valence band spectra and energy band gap schematic diagram of P-CeO2 (a,b), C-CeO2 (c,d), and R-CeO2 (e,f) annealed in different concentration of H2.
Nanomaterials 11 01168 g007
Figure 8. The PL spectra of annealed P-CeO2 (a), C-CeO2 (b), R-CeO2 (c) and the samples annealed in same condition (dg).
Nanomaterials 11 01168 g008
Figure 9. The transient photocurrent curves of P-CeO2, C-CeO2 and R-CeO2 calcining in different concentration of H2.
Nanomaterials 11 01168 g009
Figure 10. The contributions of Ce3+ on the photoelectric characterizations and photocatalytic activity.
Nanomaterials 11 01168 g010
Figure 11. Mechanism schematic of promoted photocatalytic activity of surface contained nanoceria.
Nanomaterials 11 01168 g011
Publisher’s Note: MDPI stays neutral with regard to jurisdictional claims in published maps and institutional affiliations.