
Charge-Order on the Triangular Lattice: A Mean-Field Study for the Lattice S = 1/2 Fermionic Gas


Abstract
:
1. Introduction
2. The Model and the Method
2.1. General Definitions of Phases Existing in the Investigated System
2.2. Expressions for the Ground State
2.3. Expressions for Finite Temperatures
2.4. Macroscopic Phase Separation
3. Results for the Ground State ( and )
3.1. Analysis for Fixed Chemical Potential
3.2. Analysis for Fixed Particle Concentration n
4. Results for Finite Temperatures ( and )
5. Final Remarks
Author Contributions
Funding
Institutional Review Board Statement
Informed Consent Statement
Data Availability Statement
Acknowledgments
Conflicts of Interest
Abbreviations
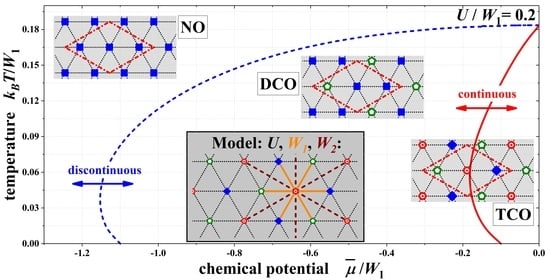
| NO | Non-ordered phase with the same concentrations in all three sublattices |
| DCO | Charge-ordered phase with two different concentrations in sublattices |
| TCO | Charge-ordered phase with three different concentrations in sublattices |
Appendix A. Analytic Expressions for Continuous Transition Temperatures
References
- Campbell, C.E.; Schick, M. Triangular Lattice Gas. Phys. Rev. A 1972, 5, 1919–1925. [Google Scholar] [CrossRef]
- Kaburagi, M.; Kanamori, J. Ordered Structure of Adatoms in the Extended Range Lattice Gas Model. Japan. J. Appl. Phys. 1974, 13 (Suppl. S2), 145–148. [Google Scholar] [CrossRef] [Green Version]
- Mihura, B.; Landau, D.P. New Type of Multicritical Behavior in a Triangular Lattice Gas Model. Phys. Rev. Lett. 1977, 38, 977–980. [Google Scholar] [CrossRef]
- Kaburagi, M.; Kanamori, J. Ground State Structure of Triangular Lattice Gas Model with up to 3rd Neighbor Interactions. J. Phys. Soc. Jpn. 1978, 44, 718–727. [Google Scholar] [CrossRef]
- Wannier, G.H. The Statistical Problem in Cooperative Phenomena. Rev. Mod. Phys. 1945, 17, 50–60. [Google Scholar] [CrossRef]
- Ising, E. Beitrag zur Theorie des Ferromagnetismus. Z. Phys. 1925, 31, 253–258. [Google Scholar] [CrossRef]
- Onsager, L. Crystal Statistics. I. A Two-Dimensional Model with an Order-Disorder Transition. Phys. Rev. 1944, 65, 117–149. [Google Scholar] [CrossRef]
- Binney, J.J.; Dowrick, N.J.; Fisher, A.J.; Newman, M.E.J. The Theory of Critical Phenomena: An Introduction to the Renormalization Group; Oxford University Press: Oxford, UK, 1992. [Google Scholar]
- Vives, E.; Castán, T.; Planes, A. Unified Mean-Field Study of Ferro-and Antiferromagnetic Behavior of the Ising Model with External Field. Amer. J. Phys. 1997, 65, 907–913. [Google Scholar] [CrossRef]
- Micnas, R.; Robaszkiewicz, S.; Chao, K.A. Multicritical Behavior of the Extended Hubbard Model in the Zero-Bandwidth Limit. Phys. Rev. B 1984, 29, 2784–2789. [Google Scholar] [CrossRef]
- Micnas, R.; Ranninger, J.; Robaszkiewicz, S. Superconductivity in Narrow-Band Systems with Local Nonretarded Attractive Interactions. Rev. Mod. Phys. 1990, 62, 113–171. [Google Scholar] [CrossRef]
- Georges, A.; Kotliar, G.; Krauth, W.; Rozenberg, M.J. Dynamical Mean-Field Theory of Strongly Correlated Fermion Systems and the Limit of Infinite Dimensions. Rev. Mod. Phys. 1996, 68, 13–125. [Google Scholar] [CrossRef] [Green Version]
- Imada, M.; Fujimori, A.; Tokura, Y. Metal-Insulator Transitions. Rev. Mod. Phys. 1998, 70, 1039–1263. [Google Scholar] [CrossRef] [Green Version]
- Kotliar, G.; Savrasov, S.Y.; Haule, K.; Oudovenko, V.S.; Parcollet, O.; Marianetti, C.A. Electronic Structure Calculations with Dynamical Mean-Field Theory. Rev. Mod. Phys. 2006, 78, 865–951. [Google Scholar] [CrossRef] [Green Version]
- Davoudi, B.; Hassan, S.R.; Tremblay, A.M.S. Competition Between Charge and Spin Order in the t-U-V Extended Hubbard Model on the Triangular Lattice. Phys. Rev. B 2008, 77, 214408. [Google Scholar] [CrossRef] [Green Version]
- Cano-Cortés, L.; Ralko, A.; Février, C.; Merino, J.; Fratini, S. Geometrical Frustration Effects on Charge-Driven Quantum Phase Transitions. Phys. Rev. B 2011, 84, 155115. [Google Scholar] [CrossRef] [Green Version]
- Merino, J.; Ralko, A.; Fratini, S. Emergent Heavy Fermion Behavior at the Wigner-Mott Transition. Phys. Rev. Lett. 2013, 111, 126403. [Google Scholar] [CrossRef] [PubMed] [Green Version]
- Tocchio, L.F.; Gros, C.; Zhang, X.F.; Eggert, S. Phase Diagram of the Triangular Extended Hubbard Model. Phys. Rev. Lett. 2014, 113, 246405. [Google Scholar] [CrossRef] [PubMed] [Green Version]
- Litak, G.; Wysokiński, K.I. Evolution of the Charge Density Wave Order on the Two-Dimensional Hexagonal Lattice. J. Magn. Magn. Mater. 2017, 440, 104–107. [Google Scholar] [CrossRef]
- Aichhorn, M.; Evertz, H.G.; von der Linden, W.; Potthoff, M. Charge Ordering in Extended Hubbard Models: Variational Cluster Approach. Phys. Rev. B 2004, 70, 235107. [Google Scholar] [CrossRef] [Green Version]
- Tong, N.H.; Shen, S.Q.; Bulla, R. Charge Ordering and Phase Separation in the Infinite Dimensional Extended Hubbard Model. Phys. Rev. B 2004, 70, 085118. [Google Scholar] [CrossRef] [Green Version]
- Amaricci, A.; Camjayi, A.; Haule, K.; Kotliar, G.; Tanasković, D.; Dobrosavljević, V. Extended Hubbard Model: Charge Ordering and Wigner-Mott Transition. Phys. Rev. B 2010, 82, 155102. [Google Scholar] [CrossRef] [Green Version]
- Ayral, T.; Biermann, S.; Werner, P.; Boehnke, L. Influence of Fock Exchange in Combined Many-Body Perturbation and Dynamical Mean Field Theory. Phys. Rev. B 2017, 95, 245130. [Google Scholar] [CrossRef] [Green Version]
- Kapcia, K.J.; Robaszkiewicz, S.; Capone, M.; Amaricci, A. Doping-Driven Metal-Insulator Transitions and Charge Orderings in the Extended Hubbard Model. Phys. Rev. B 2017, 95, 125112. [Google Scholar] [CrossRef] [Green Version]
- Terletska, H.; Chen, T.; Paki, J.; Gull, E. Charge Ordering and Nonlocal Correlations in the Doped Extended Hubbard Model. Phys. Rev. B 2018, 97, 115117. [Google Scholar] [CrossRef] [Green Version]
- Freericks, J.K.; Zlatić, V. Exact Dynamical Mean-Field Theory of the Falicov-Kimball Model. Rev. Mod. Phys. 2003, 75, 1333–1382. [Google Scholar] [CrossRef] [Green Version]
- Kapcia, K.J.; Lemański, R.; Zygmunt, M.J. Extended Falicov–Kimball Model: Hartree–Fock vs DMFT approach. J. Phys. Condens. Matter 2020, 33, 065602. [Google Scholar] [CrossRef]
- Aziz, R.A.; Buck, U.; Jónsson, H.; Ruiz-Suárez, J.; Schmidt, B.; Scoles, G.; Slaman, M.J.; Xu, J. Two- and Three-Body Forces in the Interaction of He Atoms with Xe Overlayers Adsorbed on (0001) Graphite. J. Chem. Phys. 1989, 91, 6477–6493. [Google Scholar] [CrossRef]
- Caragiu, M.; Finberg, S. Alkali Metal Adsorption on Graphite: A Review. J. Phys. Condens. Matter 2005, 17, R995–R1024. [Google Scholar] [CrossRef]
- Petrović, M.; Lazić, P.; Runte, S.; Michely, T.; Busse, C.; Kralj, M. Moiré-Regulated Self-Assembly of Cesium Adatoms on Epitaxial Graphene. Phys. Rev. B 2017, 96, 085428. [Google Scholar] [CrossRef]
- Dimakis, N.; Valdez, D.; Flor, F.A.; Salgado, A.; Adjibi, K.; Vargas, S.; Saenz, J. Density Functional Theory Calculations on Alkali and the Alkaline Ca Atoms Adsorbed on Graphene Monolayers. Appl. Sur. Sci. 2017, 413, 197–208. [Google Scholar] [CrossRef]
- Zhour, K.; El Haj Hassan, F.; Fahs, H.; Vaezzadeh, M. Ab Initio Study of the Adsorption of Potassium on B, N, and BN-Doped Graphene Heterostructure. Mater. Today Commun. 2019, 21, 100676. [Google Scholar] [CrossRef]
- Huang, Y.C.; Zhao, K.Y.; Liu, Y.; Zhang, X.Y.; Du, H.Y.; Ren, X.W. Investigation on Adsorption of Ar and N2 on α-Al2O3(0001) Surface from First-Principles Calculations. Vacuum 2020, 176, 109344. [Google Scholar] [CrossRef]
- Xing, H.; Hu, P.; Li, S.; Zuo, Y.; Han, J.; Hua, X.; Wang, K.; Yang, F.; Feng, P.; Chang, T. Adsorption and Diffusion of Oxygen on Metal Surfaces Studied by First-Principle Study: A Review. J. Mater. Sci. Technol. 2021, 62, 180–194. [Google Scholar] [CrossRef]
- Profeta, G.; Ottaviano, L.; Continenza, A. R30∘→3×3 Distortion on the C/Si(111) Surface. Phys. Rev. B 2004, 69, 241307. [Google Scholar] [CrossRef]
- Tresca, C.; Brun, C.; Bilgeri, T.; Menard, G.; Cherkez, V.; Federicci, R.; Longo, D.; Debontridder, F.; D’angelo, M.; Roditchev, D.; et al. Chiral Spin Texture in the Charge-Density-Wave Phase of the Correlated Metallic Pb/Si(111) Monolayer. Phys. Rev. Lett. 2018, 120, 196402. [Google Scholar] [CrossRef] [Green Version]
- Rodríguez, B.C.R.; Santana, J.A. Adsorption and Diffusion of Sulfur on the (111), (100), (110), and (211) Surfaces of FCC Metals: Density Functional Theory Calculations. J. Chem. Phys. 2018, 149, 204701. [Google Scholar] [CrossRef]
- Patra, A.; Peng, H.; Sun, J.; Perdew, J.P. Rethinking CO Adsorption on Transition-Metal Surfaces: Effect of Density-Driven Self-Interaction Errors. Phys. Rev. B 2019, 100, 035442. [Google Scholar] [CrossRef] [Green Version]
- Menkah, E.S.; Dzade, N.Y.; Tia, R.; Adei, E.; de Leeuw, N.H. Hydrazine Adsorption on Perfect and Defective FCC Nickel (100), (110) and (111) Surfaces: A Dispersion corrected DFT-D2 study. Appl. Sur. Sci. 2019, 480, 1014–1024. [Google Scholar] [CrossRef] [Green Version]
- Bretz, M.; Dash, J.G. Ordering Transitions in Helium Monolayers. Phys. Rev. Lett. 1971, 27, 647–650. [Google Scholar] [CrossRef]
- Bretz, M.; Dash, J.G.; Hickernell, D.C.; McLean, E.O.; Vilches, O.E. Phases of He3 and He4 Monolayer Films Adsorbed on Basal-Plane Oriented Graphite. Phys. Rev. A 1973, 8, 1589–1615. [Google Scholar] [CrossRef]
- Zhou, S.; Wang, Z. Charge and Spin Order on the Triangular Lattice: NaxCoO2 at x = 0.5. Phys. Rev. Lett. 2007, 98, 226402. [Google Scholar] [CrossRef] [Green Version]
- Soumyanarayanan, A.; Yee, M.M.; He, Y.; van Wezel, J.; Rahn, D.J.; Rossnagel, K.; Hudson, E.W.; Norman, M.R.; Hoffman, J.E. Quantum Phase Transition from Triangular to Stripe Charge Order in NbSe2. Proc. Natl. Acad. Sci. USA 2013, 110, 1623–1627. [Google Scholar] [CrossRef] [PubMed] [Green Version]
- Ugeda, M.M.; Bradley, A.J.; Zhang, Y.; Onishi, S.; Chen, Y.; Ruan, W.; Ojeda-Aristizabal, C.; Ryu, H.; Edmonds, M.T.; Tsai, H.Z.; et al. Characterization of Collective Ground States in Single-Layer NbSe2. Nat. Phys. 2016, 12, 92–97. [Google Scholar] [CrossRef]
- Xi, X.; Wang, Z.; Zhao, W.; Park, J.H.; Law, K.T.; Berger, H.; Forro, L.; Shan, J.; Mak, K.F. Ising Pairing in Superconducting NbSe2 Atomic Layers. Nat. Phys. 2016, 12, 139–143. [Google Scholar] [CrossRef] [Green Version]
- Ptok, A.; Głodzik, S.; Domański, T. Yu-Shiba-Rusinov States of Impurities in a Triangular Lattice of NbSe2 with Spin-Orbit Coupling. Phys. Rev. B 2017, 96, 184425. [Google Scholar] [CrossRef] [Green Version]
- Lian, C.S.; Si, C.; Duan, W. Unveiling Charge-Density Wave, Superconductivity, and Their Competitive Nature in Two-Dimensional NbSe2. Nano Lett. 2018, 18, 2924–2929. [Google Scholar] [CrossRef]
- Kolekar, S.; Bonilla, M.; Ma, Y.; Diaz, H.C.; Batzill, M. Layer- and Substrate-Dependent Charge Density Wave Criticality in 1T-TiSe2. 2D Mater. 2018, 5, 015006. [Google Scholar] [CrossRef]
- Ryu, H.; Chen, Y.; Kim, H.; Tsai, H.Z.; Tang, S.; Jiang, J.; Liou, F.; Kahn, S.; Jia, C.; Omrani, A.A.; et al. Persistent Charge-Density-Wave Order in Single-Layer TaSe2. Nano Lett. 2018, 18, 689–694. [Google Scholar] [CrossRef] [Green Version]
- Pásztor, A.; Scarfato, A.; Barreteau, C.; Giannini, E.; Renner, C. Dimensional Crossover of the Charge Density Wave Transition in Thin Exfoliated VSe2. 2D Mater. 2017, 4, 041005. [Google Scholar] [CrossRef] [Green Version]
- Zhao, J.; Wijayaratne, K.; Butler, A.; Yang, J.; Malliakas, C.D.; Chung, D.Y.; Louca, D.; Kanatzidis, M.G.; van Wezel, J.; Chatterjee, U. Orbital Selectivity Causing Anisotropy and Particle-Hole Asymmetry in the Charge Density Wave Gap of 2H-TaS2. Phys. Rev. B 2017, 96, 125103. [Google Scholar] [CrossRef] [Green Version]
- Chhowalla, M.; Shin, H.S.; Eda, G.; Li, L.J.; Loh, K.P.; Zhang, H. The Chemistry of Two-Dimensional Layered Transition Metal Dichalcogenide Nanosheets. Nat. Chem. 2013, 5, 263–275. [Google Scholar] [CrossRef]
- Kaneko, R.; Tocchio, L.F.; Valentí, R.; Gros, C. Emergent Lattices with Geometrical Frustration in Doped Extended Hubbard Models. Phys. Rev. B 2016, 94, 195111. [Google Scholar] [CrossRef] [Green Version]
- Kaneko, R.; Tocchio, L.F.; Valenti, R.; Becca, F. Charge Orders in Organic Charge-Transfer Salts. New J. Phys. 2017, 19, 103033. [Google Scholar] [CrossRef] [Green Version]
- Han, Z.; Kivelson, S.A.; Yao, H. Strong Coupling Limit of the Holstein-Hubbard Model. Phys. Rev. Lett. 2020, 125, 167001. [Google Scholar] [CrossRef] [PubMed]
- Müller-Hartmann, E. Correlated Fermions on a Lattice in High Dimensions. Z. Phys. B Condens. Matter 1989, 74, 507–512. [Google Scholar] [CrossRef]
- Pearce, P.A.; Thompson, C.J. The Anisotropic Heisenberg Model in the Long-Range Interaction Limit. Commun. Math. Phys. 1975, 41, 191–201. [Google Scholar] [CrossRef]
- Pearce, P.A.; Thompson, C.J. The High Density Limit for Lattice Spin Models. Commun. Math. Phys. 1978, 58, 131–138. [Google Scholar] [CrossRef]
- Kapcia, K.; Robaszkiewicz, S. The Effects of the Next-Nearest-Neighbour Density-Density Interaction in the Atomic Limit of the Extended Hubbard Model. J. Phys. Condens. Matter 2011, 23, 105601. [Google Scholar] [CrossRef] [Green Version]
- Kapcia, K.J.; Robaszkiewicz, S. On the Phase Diagram of the Extended Hubbard Model with Intersite Density-Density Interactions in the Atomic Limit. Phys. A 2016, 461, 487–497. [Google Scholar] [CrossRef]
- Borgs, C.; Jedrzejewski, J.; Koteckỳ, R. The Staggered Charge-Order Phase of the Extended Hubbard Model in the Atomic Limit. J. Phys. A Math. Gen. 1996, 29, 733–747. [Google Scholar] [CrossRef] [Green Version]
- Fröhlich, J.; Rey-Bellet, L.; Ueltschi, D. Quantum Lattice Models at Intermediate Temperature. Commun. Math. Phys. 2001, 224, 33–63. [Google Scholar] [CrossRef] [Green Version]
- Pawłowski, G. Charge Orderings in the Atomic Limit of the Extended Hubbard Model. Eur. Phys. J. B 2006, 53, 471–479. [Google Scholar] [CrossRef]
- Ganzenmüller, G.; Pawłowski, G. Flat Histogram Monte Carlo Sampling for Mechanical Variables and Conjugate Thermodynamic Fields with Example Applications to Strongly Correlated Electronic Systems. Phys. Rev. E 2008, 78, 036703. [Google Scholar] [CrossRef] [PubMed]
- Jędrzejewski, J. Phase Diagrams of Extended Hubbard Models in the Atomic Limit. Phys. A 1994, 205, 702–717. [Google Scholar] [CrossRef]
- Rademaker, L.; Pramudya, Y.; Zaanen, J.; Dobrosavljević, V. Influence of Long-Range Interactions on Charge Ordering Phenomena on a Square Lattice. Phys. Rev. E 2013, 88, 032121. [Google Scholar] [CrossRef] [PubMed] [Green Version]
- Kapcia, K.J.; Barański, J.; Robaszkiewicz, S.; Ptok, A. Various Charge-Ordered States in the Extended Hubbard Model with On-Site Attraction in the Zero-Bandwidth Limit. J. Supercond. Nov. Magn. 2017, 30, 109–115. [Google Scholar] [CrossRef] [Green Version]
- Kapcia, K.J.; Barański, J.; Ptok, A. Diversity of Charge Orderings in Correlated Systems. Phys. Rev. E 2017, 96, 042104. [Google Scholar] [CrossRef] [Green Version]
- Lee, S.J.; Lee, J.R.; Kim, B. Patterns of Striped Order in the Classical Lattice Coulomb Gas. Phys. Rev. Lett. 2001, 88, 025701. [Google Scholar] [CrossRef] [Green Version]
- Mancini, F.; Mancini, F.P. One-Dimensional Extended Hubbard Model in the Atomic Limit. Phys. Rev. E 2008, 77, 061120. [Google Scholar] [CrossRef] [Green Version]
- Mancini, F.; Mancini, F.P. Extended Hubbard Model in the Presence of a Magnetic Field. Eur. Phys. J. B 2009, 68, 341–351. [Google Scholar] [CrossRef] [Green Version]
- Mancini, F.; Plekhanov, E.; Sica, G. Exact Solution of the 1D Hubbard Model with NN and NNN Interactions in the Narrow-Band Limit. Eur. Phys. J. B 2013, 86, 408. [Google Scholar] [CrossRef] [Green Version]
- Kaneko, R.; Nonomura, Y.; Kohno, M. Thermal Algebraic-Decay Charge Liquid Driven by Competing Short-Range Coulomb Repulsion. Phys. Rev. B 2018, 97, 205125. [Google Scholar] [CrossRef] [Green Version]
- Kapcia, K.J. Charge Order of Strongly Bounded Electron Pairs on the Triangular Lattice: The Zero-Bandwidth Limit of the Extended Hubbard Model with Strong Onsite Attraction. J. Supercond. Nov. Magn. 2019, 32, 2751–2757. [Google Scholar] [CrossRef]
- Houtappel, R.M.F. Statistics of Two-Dimensional Hexagonal Ferromagnetics with “Ising”-Interaction Between Nearest Neighbours Only. Physica 1950, 16, 391–392. [Google Scholar] [CrossRef]
- Houtappel, R.M.F. Order-Disorder in Hexagonal Lattices. Physica 1950, 16, 425–455. [Google Scholar] [CrossRef]
- Wannier, G.H. Antiferromagnetism. The Triangular Ising Net. Phys. Rev. 1950, 79, 357–364. [Google Scholar] [CrossRef] [Green Version]
- Wannier, G.H. Antiferromagnetism. The Triangular Ising Net (erratum). Phys. Rev. B 1973, 7, 5017. [Google Scholar] [CrossRef]
- Schick, M.; Walker, J.S.; Wortis, M. Phase Diagram of the Triangular Ising Model: Renormalization-Group Calculation with Application to Adsorbed Monolayers. Phys. Rev. B 1977, 16, 2205–2219. [Google Scholar] [CrossRef]
- Metcalf, B.D. Ground State Spin Orderings of the Triangular Ising Model with the Nearest and Next Nearest Neighbor Interaction. Phys. Lett. A 1974, 46, 325–326. [Google Scholar] [CrossRef]
- Oitmaa, J. The Triangular Lattice Ising Model with First and Second Neighbour Interactions. J. Phys. A Math. Gen. 1982, 15, 573–585. [Google Scholar] [CrossRef]
- Saito, Y.; Igeta, K. Antiferromagnetic Ising Model on a Triangular Lattice. J. Phys. Soc. Jpn. 1984, 53, 3060–3069. [Google Scholar] [CrossRef]
- Tanaka, Y.; Uryû, N. Ground State Spin Configurations of the Triangular Ising Net with the First, Second and Third Nearest Neighbor Interactions. Prog. Theor. Phys. 1976, 55, 1356–1372. [Google Scholar] [CrossRef] [Green Version]
- Kudo, T.; Katsura, S. A Method of Determining the Orderings of the Ising Model with Several Neighbor Interactions under the Magnetic Field and Applications to Hexagonal Lattices. Prog. Theor. Phys. 1976, 56, 435–449. [Google Scholar] [CrossRef] [Green Version]
- Arrigoni, E.; Strinati, G.C. Doping-Induced Incommensurate Antiferromagnetism in a Mott-Hubbard Insulator. Phys. Rev. B 1991, 44, 7455–7465. [Google Scholar] [CrossRef]
- Bąk, M. Mixed Phase and Bound States in the Phase Diagram of the Extended Hubbard Model. Acta Phys. Pol. A 2004, 106, 637–646. [Google Scholar] [CrossRef]
- Bursill, R.J.; Thompson, C.J. Variational Bounds for Lattice Fermion Models II. Extended Hubbard Model in the Atomic Limit. J. Phys. A Math. Gen. 1993, 26, 4497–4511. [Google Scholar] [CrossRef]
- Kapcia, K.; Robaszkiewicz, S. Stable and Metastable Phases in the Atomic Limit of the Extended Hubbard Model with Intersite Density-Density Interactions. Acta. Phys. Pol. A. 2012, 121, 1029–1031. [Google Scholar] [CrossRef]
- Becker, C.; Soltan-Panahi, P.; Kronjäger, J.; Dörscher, S.; Bongs, K.; Sengstock, K. Ultracold Quantum Gases in Triangular Optical Lattices. New J. Phys. 2010, 12, 065025. [Google Scholar] [CrossRef] [Green Version]
- Struck, J.; Ölschläger, C.; Le Targat, R.; Soltan-Panahi, P.; Eckardt, A.; Lewenstein, M.; Windpassinger, P.; Sengstock, K. Quantum Simulation of Frustrated Classical Magnetism in Triangular Optical Lattices. Science 2011, 333, 996–999. [Google Scholar] [CrossRef] [PubMed] [Green Version]
- Cao, Y.; Fatemi, V.; Fang, S.; Watanabe, K.; Taniguchi, T.; Kaxiras, E.; Jarillo-Herrero, P. Unconventional Superconductivity in Magic-Angle Graphene Superlattices. Nature 2018, 556, 43–50. [Google Scholar] [CrossRef] [PubMed]
- Cao, Y.; Fatemi, V.; Demir, A.; Fang, S.; Tomarken, S.L.; Luo, J.Y.; Sanchez-Yamagishi, J.D.; Watanabe, K.; Taniguchi, T.; Kaxiras, E.; et al. Correlated Insulator Behaviour at Half-Filling in Magic-Angle Graphene Superlattices. Nature 2018, 556, 80–84. [Google Scholar] [CrossRef]
- Yankowitz, M.; Chen, S.; Polshyn, H.; Zhang, Y.; Watanabe, K.; Taniguchi, T.; Graf, D.; Young, A.F.; Dean, C.R. Tuning Superconductivity in Twisted Bilayer Graphene. Science 2019, 363, 1059–1064. [Google Scholar] [CrossRef] [PubMed] [Green Version]
- Wu, F.; MacDonald, A.H.; Martin, I. Theory of Phonon-Mediated Superconductivity in Twisted Bilayer Graphene. Phys. Rev. Lett. 2018, 121, 257001. [Google Scholar] [CrossRef] [PubMed] [Green Version]
- Xu, C.; Balents, L. Topological Superconductivity in Twisted Multilayer Graphene. Phys. Rev. Lett. 2018, 121, 087001. [Google Scholar] [CrossRef] [Green Version]
- Lian, B.; Wang, Z.; Bernevig, B.A. Twisted Bilayer Graphene: A Phonon-Driven Superconductor. Phys. Rev. Lett. 2019, 122, 257002. [Google Scholar] [CrossRef] [Green Version]
- Wang, G.; Chernikov, A.; Glazov, M.M.; Heinz, T.F.; Marie, X.; Amand, T.; Urbaszek, B. Colloquium: Excitons in Atomically Thin Transition Metal Dichalcogenides. Rev. Mod. Phys. 2018, 90, 021001. [Google Scholar] [CrossRef] [Green Version]
- Xu, Y.; Liu, S.; Rhodes, D.A.; Watanabe, K.; Taniguchi, T.; Hone, J.; Elser, V.; Mak, K.F.; Shan, J. Correlated Insulating States at Fractional Fillings of Moiré Superlattices. Nature 2020, 587, 214–218. [Google Scholar] [CrossRef]
- Kapcia, K. Metastability and phase separation in a simple model of a superconductor with extremely short coherence length. J. Supercond. Nov. Magn. 2014, 27, 913–917. [Google Scholar] [CrossRef] [Green Version]
Short Biography of Authors
 | Konrad Jerzy Kapcia is an assistant professor (adjunct) at Condensed Matter Theory Division of Faculty of Physics of Adam Mickiewicz University (AMU) in Poznań (Poland). He graduated in physics (M.Sc.) in 2009 and defended his dissertation (PhD) in theoretical physics in 2014 (both at AMU). Next, he worked in the Institute of Physics of the Polish Academy of Sciences (PAS) in Warsaw and in the Henryk Niewodniczański Institute of Nuclear Physics of PAS in Kraków. He was a visiting scientist at SISSA in Trieste (Italy) and CFEL-DESY in Hamburg (Germany). He is interested in theoretical physics, mainly in the field of strongly correlated systems (including cold gases on optical lattices) and superconductivity as well as in ab initio modeling of real materials (electron and phonon properties). He was the head and principal investigator of several projects financed by National Science Centre (Poland) and a recipient of a few scholarships of Ministry of Science and Higher Education (Poland). He is a member of the Polish Physical Society, the Institute of Physics (IoP, UK), and the American Physical Society. |


| Phase | ||||||
|---|---|---|---|---|---|---|
| NO (NO) | 0 | 0 | 0 | 0 | ||
| NO (NO) | 1 | 1 | 1 | |||
| NO (NO) | 2 | 2 | 2 | |||
| DCO | 0 | 0 | 1 | |||
| DCO | 1 | 2 | 2 | |||
| DCO | 0 | 0 | 2 | |||
| DCO | 0 | 2 | 2 | |||
| DCO | 0 | 1 | 1 | |||
| DCO | 1 | 1 | 2 | |||
| TCO (TCO) | 0 | 1 | 2 |
| Phase | PS | ||||||
|---|---|---|---|---|---|---|---|
| DCO | 0 | 0 | 0 | NO/DCO | |||
| DCO | 0 | 0 | 0 | 0 | NO/DCO | ||
| DCO | 0 | 0 | DCO/DCO | ||||
| DCO | 1 | 1 | 0 | 1 | DCO/NO | ||
| TCO | 0 | 2 | DCO/DCO | ||||
| TCO | 0 | 2 | 1 | DCO/TCO | |||
| TCO | 0 | 1 | 0 | DCO/DCO | |||
| DCO | 2 | 2 | 2 | DCO/NO | |||
| DCO | 2 | 2 | 2 | DCO/NO | |||
| DCO | 2 | 2 | DCO/DCO | ||||
| DCO | 1 | 1 | 1 | NO/DCO | |||
| TCO | 0 | 2 | DCO/DCO | ||||
| TCO | 0 | 2 | 1 | TCO/DCO | |||
| TCO | 1 | 2 | DCO/DCO |
Publisher’s Note: MDPI stays neutral with regard to jurisdictional claims in published maps and institutional affiliations. |
© 2021 by the author. Licensee MDPI, Basel, Switzerland. This article is an open access article distributed under the terms and conditions of the Creative Commons Attribution (CC BY) license (https://creativecommons.org/licenses/by/4.0/).
Share and Cite
Kapcia, K.J. Charge-Order on the Triangular Lattice: A Mean-Field Study for the Lattice S = 1/2 Fermionic Gas. Nanomaterials 2021, 11, 1181. https://doi.org/10.3390/nano11051181
Kapcia KJ. Charge-Order on the Triangular Lattice: A Mean-Field Study for the Lattice S = 1/2 Fermionic Gas. Nanomaterials. 2021; 11(5):1181. https://doi.org/10.3390/nano11051181
Chicago/Turabian StyleKapcia, Konrad Jerzy. 2021. "Charge-Order on the Triangular Lattice: A Mean-Field Study for the Lattice S = 1/2 Fermionic Gas" Nanomaterials 11, no. 5: 1181. https://doi.org/10.3390/nano11051181