
Self-Photoluminescence of Unzipped Multi-Walled Carbon Nanotubes

 ,
,
Abstract
:1. Introduction
2. Materials and Methods
2.1. Materials
2.2. Experimental Section
2.3. Characterization
3. Results and Discussion
4. Conclusions
Author Contributions
Funding
Institutional Review Board Statement
Informed Consent Statement
Data Availability Statement
Conflicts of Interest
References
- Iijima, S. Helical microtubules of graphitic carbon. Nature 1991, 354, 56–58. [Google Scholar] [CrossRef]
- Mohanraj, J.; Armaroli, N. Luminophores and Carbon Nanotubes: An Odd Combination? J. Phys. Chem. Lett. 2013, 4, 767–778. [Google Scholar] [CrossRef] [PubMed]
- Kataura, H.; Kumazawa, Y.; Maniwa, Y.; Umezu, I.; Suzuki, S.; Ohtsuka, Y.; Achiba, Y. Optical properties of single-wall carbon nanotubes. Synth. Met. 1999, 103, 2555–2558. [Google Scholar] [CrossRef]
- O’Connell, M.J.; Bachilo, S.M.; Huffman, C.B.; Moore, V.C.; Smalley, R.E. Band Gap Fluorescence from Individual Single-Walled Carbon Nanotubes. Science 2002, 297, 593–596. [Google Scholar] [CrossRef] [PubMed] [Green Version]
- Aprile, C.; Martín, R.; Alvaro, M.; Scaiano, J.C.; Garcia, H. Near-Infrared Emission Quantum Yield of Soluble Short Single-Walled Carbon Nanotubes. Chem. Phys. Chem. 2009, 10, 1305–1310. [Google Scholar] [CrossRef] [PubMed]
- Riggs, J.E.; Guo, Z.; Carroll, D.L.; Sun, Y.P. Strong Luminescence of Solubilized Carbon Nanotubes. J. Am. Chem. Soc. 2000, 122, 5879–5880. [Google Scholar] [CrossRef]
- Ge, C.; Li, W.; Li, Y.; Li, B.; Du, J.; Qiu, Y.; Liu, Y.; Gao, Y.; Chai, Z.; Chen, C. Significance and systematic analysis of metallic impurities of carbon nanotubes produced by different manufacturers. J. Nanosci. Nanotechnol. 2011, 11, 2389–2397. [Google Scholar] [CrossRef]
- Georgakilas, V.; Kordatos, K.; Prato, M.; Guldi, D.M.; Holzinger, M.; Hirsch, A. Organic Functionalization of Carbon Nanotubes. J. Am. Chem. Soc. 2002, 124, 760–761. [Google Scholar] [CrossRef]
- Han, C.; Jiang, H.; Wang, P.; Yu, L.; Wang, J.; Han, J.; Shen, W.; Zheng, N.; Wen, S.; Li, Y.J.M.C.F. An isomerized alkyl side chain enables efficient nonfullerene organic photovoltaics with good tolerance to pre/post-treatments. Mater. Chem. Front. 2021, 5, 3050–3060. [Google Scholar] [CrossRef]
- Tasis, D.; Tagmatarchis, N.; Georgakilas, V.; Gamboz, C.; Prato, M.J.C. Supramolecular organized structures of fullerene-based materials and organic functionalization of carbon nanotubes. C. R. Chim. 2004, 6, 597–602. [Google Scholar] [CrossRef]
- Qi, X.; Zhang, W.; Yang, N.; Yang, D.; Bychko, I.; Chen, M.; Wang, Y.; Han, D.; Huang, L.; Jiang, H. Direct anchoring of Eu3+ complex to derivative surfaces of multi-wall carbon nanotubes (Eu@DSCNTs) for linear fluorescence nanomaterials. J. Alloy. Compd. 2020, 853, 156880. [Google Scholar] [CrossRef]
- Shen, W.; Zhao, G.; Zhang, X.; Bu, F.; Yun, J.; Tang, J.J.N. Using Dual Microresonant Cavity and Plasmonic Effects to Enhance the Photovoltaic Efficiency of Flexible Polymer Solar Cells. Nanomaterials 2020, 10, 944. [Google Scholar] [CrossRef]
- Saito, R.; Dresselhaus, G.; Dresselhaus, M.S. Electronic structure of double-layer graphene tubules. J. Appl. Phys. 1993, 73, 494–500. [Google Scholar] [CrossRef]
- Chien, C.; Li, S.; Lai, W.; Yeh, Y.; Chen, H.; Chen, I. Tunable Photoluminescence from Graphene Oxide. Angew. Chem. 2012, 124, 6766–6770. [Google Scholar] [CrossRef]
- Higginbotham, A.L.; Kosynkin, D.V.; Sinitskii, A.; Sun, Z.; Tour, J.M. Lower-defect graphene oxide nanoribbons from multiwalled carbon nanotubes. ACS Nano 2010, 4, 2059–2069. [Google Scholar] [CrossRef]
- Dutta, S.; Pati, S.K. Novel properties of graphene nanoribbons: A review. J. Mater. Chem. 2010, 20, 8207–8223. [Google Scholar] [CrossRef]
- Ma, L.; Wang, J.; Ding, F. Recent Progress and Challenges in Graphene Nanoribbon Synthesis. ChemPhysChem 2013, 14, 47–54. [Google Scholar] [CrossRef]
- Wang, H.; Wang, Y.; Hu, Z.; Wang, X. Cutting and Unzipping Multiwalled Carbon Nanotubes into Curved Graphene Nanosheets and Their Enhanced Supercapacitor Performance. ACS Appl. Mater. Interfaces 2012, 4, 6827–6834. [Google Scholar] [CrossRef] [PubMed]
- Kosynkin, D.V.; Higginbotham, A.L.; Sinitskii, A.; Lomeda, J.R.; Dimiev, A.; Price, B.K.; Tour, J.M. Longitudinal unzipping of carbon nanotubes to form graphene nanoribbons. Nature 2017, 458, 872–876. [Google Scholar] [CrossRef] [Green Version]
- Youn, H.C.; Park, S.H.; Roh, K.C.; Kim, K.B. Highly dispersible surface-unzipped multi-walled carbon nanotubes as binder-free electrodes for supercapacitor applications. Curr. Appl. Phys. 2015, 15, S21–S26. [Google Scholar] [CrossRef]
- Zhang, Y.; Song, Y.; Gan, Y.; Feng, M.; Zhan, H. Broadband nonlinear optical and optical limiting effects of partially unzipped carbon nanotubes. J. Mater. Chem. C 2015, 3, 9948–9954. [Google Scholar] [CrossRef]
- Yuen, S.M.; Ma, C.C.M.; Lin, Y.Y.; Kuan, H.C. Preparation, morphology and properties of acid and amine modified multiwalled carbon nanotube/polyimide composite. Compos. Sci. Technol. 2007, 67, 2564–2573. [Google Scholar] [CrossRef]
- Ferrari, A.; Robertson, J. Interpretation of Raman spectra of disordered and amorphous carbon. Phys. Rev. B 2000, 61, 14095–14107. [Google Scholar] [CrossRef] [Green Version]
- Guo, H.L.; Wang, X.F.; Qian, Q.Y.; Wang, F.B.; Xia, X.H. A green approach to the synthesis of graphene nanosheets. ACS Nano 2009, 3, 2653–2659. [Google Scholar] [CrossRef]
- Yaragalla, S.; Anilkumar, G.; Kalarikkal, N.; Thomas, S. Structural and optical properties of functionalized multi-walled carbon nanotubes. Mater. Sci. Semicond. Proc. 2016, 41, 491–496. [Google Scholar] [CrossRef]
- Boehm, H.P. Surface oxides on carbon and their analysis: A critical assessment. Carbon 2002, 40, 145–149. [Google Scholar] [CrossRef]
- Mahmoud, W.E.; Al-Hazmi, F.S.; Al-Harbi, G.H. Wall by wall controllable unzipping of MWCNTs via intercalation with oxalic acid to produce multilayers graphene oxide ribbon. Chem. Eng. J. 2015, 281, 192–198. [Google Scholar] [CrossRef]
- Entezari, M.H.; Goharshadi, E.K. Graphene oxide nanosheets synthesized by ultrasound: Experiment versus MD simulation. Appl. Surf. Sci. 2018, 451, 112–120. [Google Scholar]
- Cui, D.; Xiang, Q.; Song, Z.; Xia, Z.; Liu, Q.L. The synthesis of narrow-band red-emitting SrLiAl3N4:Eu2+ phosphor and improvement of its luminescence properties. J. Mater. Chem. C 2016, 4, 7332–7338. [Google Scholar] [CrossRef]
- Haranath, D.; Mishra, S.; Yadav, S.; Sharma, R.K.; Kandpal, L.M.; Vijayan, N.; Dalai, M.K.; Sehgal, G.; Shanker, V. Rare-earth free yellow-green emitting NaZnPO4:Mn phosphor for lighting applications. Appl. Phys. Lett. 2012, 101, 95. [Google Scholar] [CrossRef] [Green Version]
- Shabrawy, K.E.; Maharatna, K.; Bagnall, D.; Al-Hashimi, B.M. Modeling SWCNT Bandgap and Effective Mass Variation Using a Monte Carlo Approach. IEEE Trans. Nanotechnol. 2010, 9, 184–193. [Google Scholar] [CrossRef] [Green Version]
- Ryu, M.; Honda, R.; Reich, A.; Cernescu, A.; Li, J.-L.; Hu, J.; Juodkazis, S.; Morikawa, J. Near-Field IR Orientational Spectroscopy of Silk. Appl. Sci. 2019, 9, 3991. [Google Scholar] [CrossRef] [Green Version]
- Li, H.; Kang, Z.; Liu, Y.; Lee, S.T. Carbon nanodots: Synthesis, properties and applications. J. Mater. Chem. 2012, 22, 24230. [Google Scholar] [CrossRef]
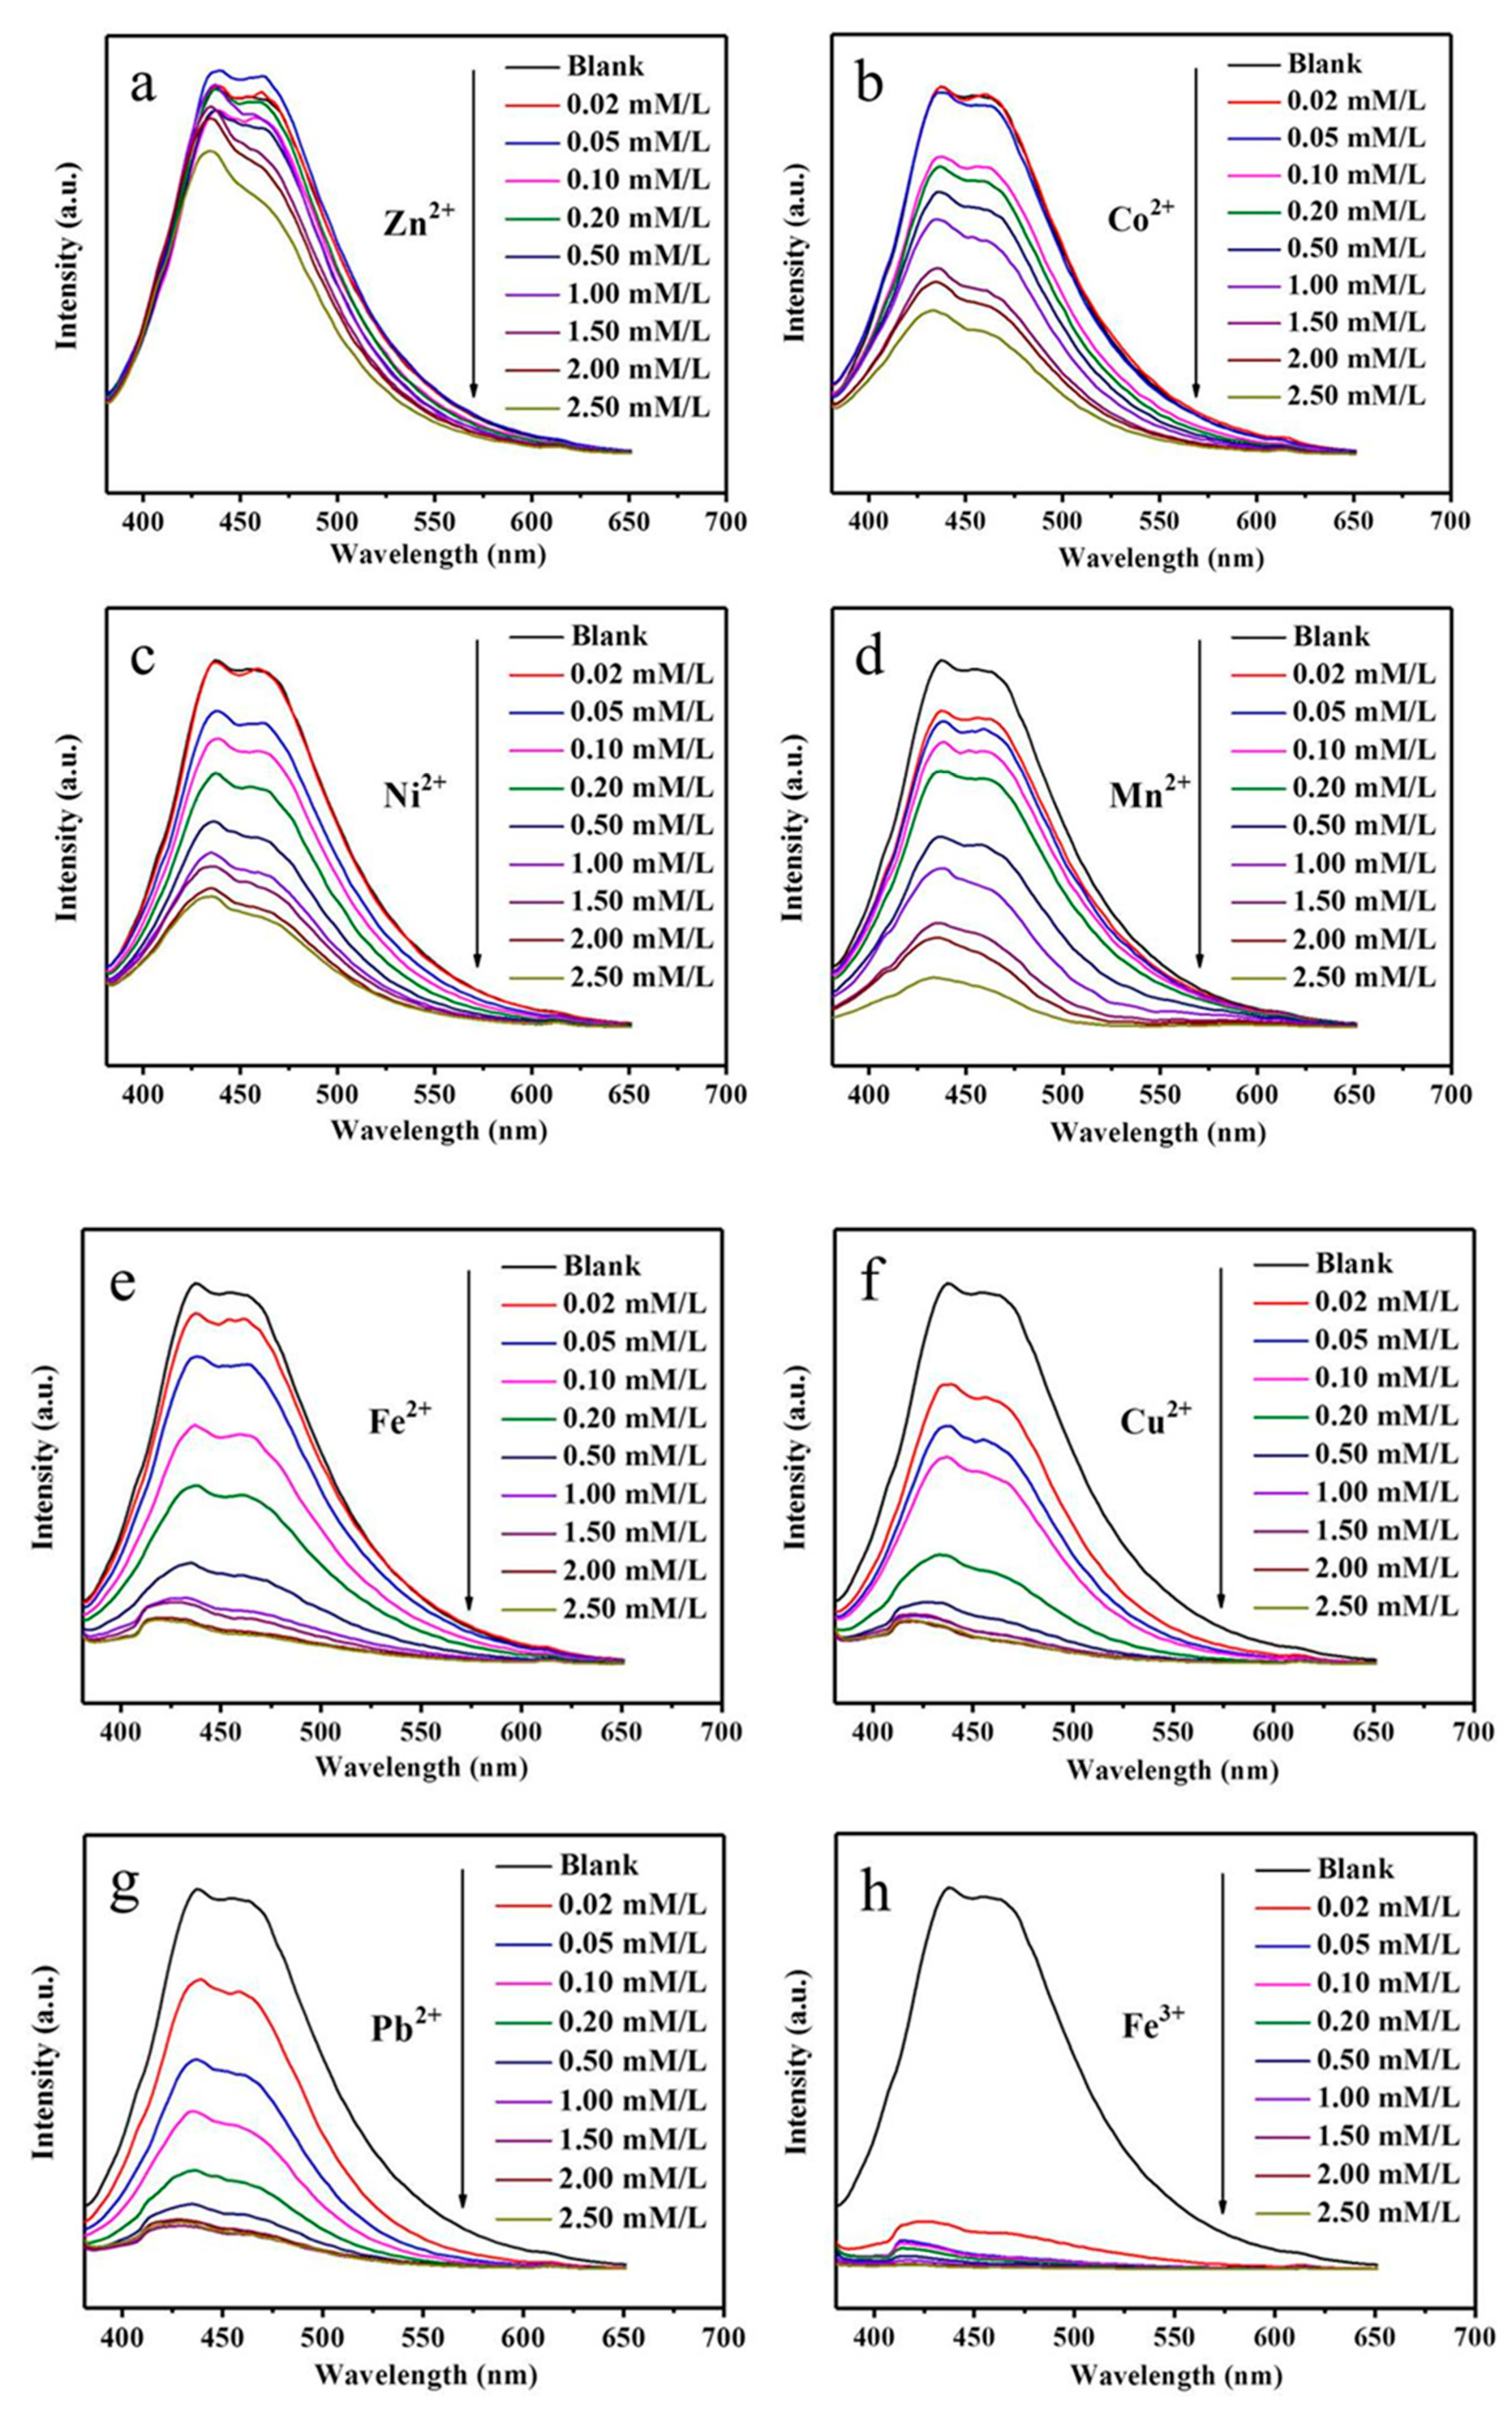
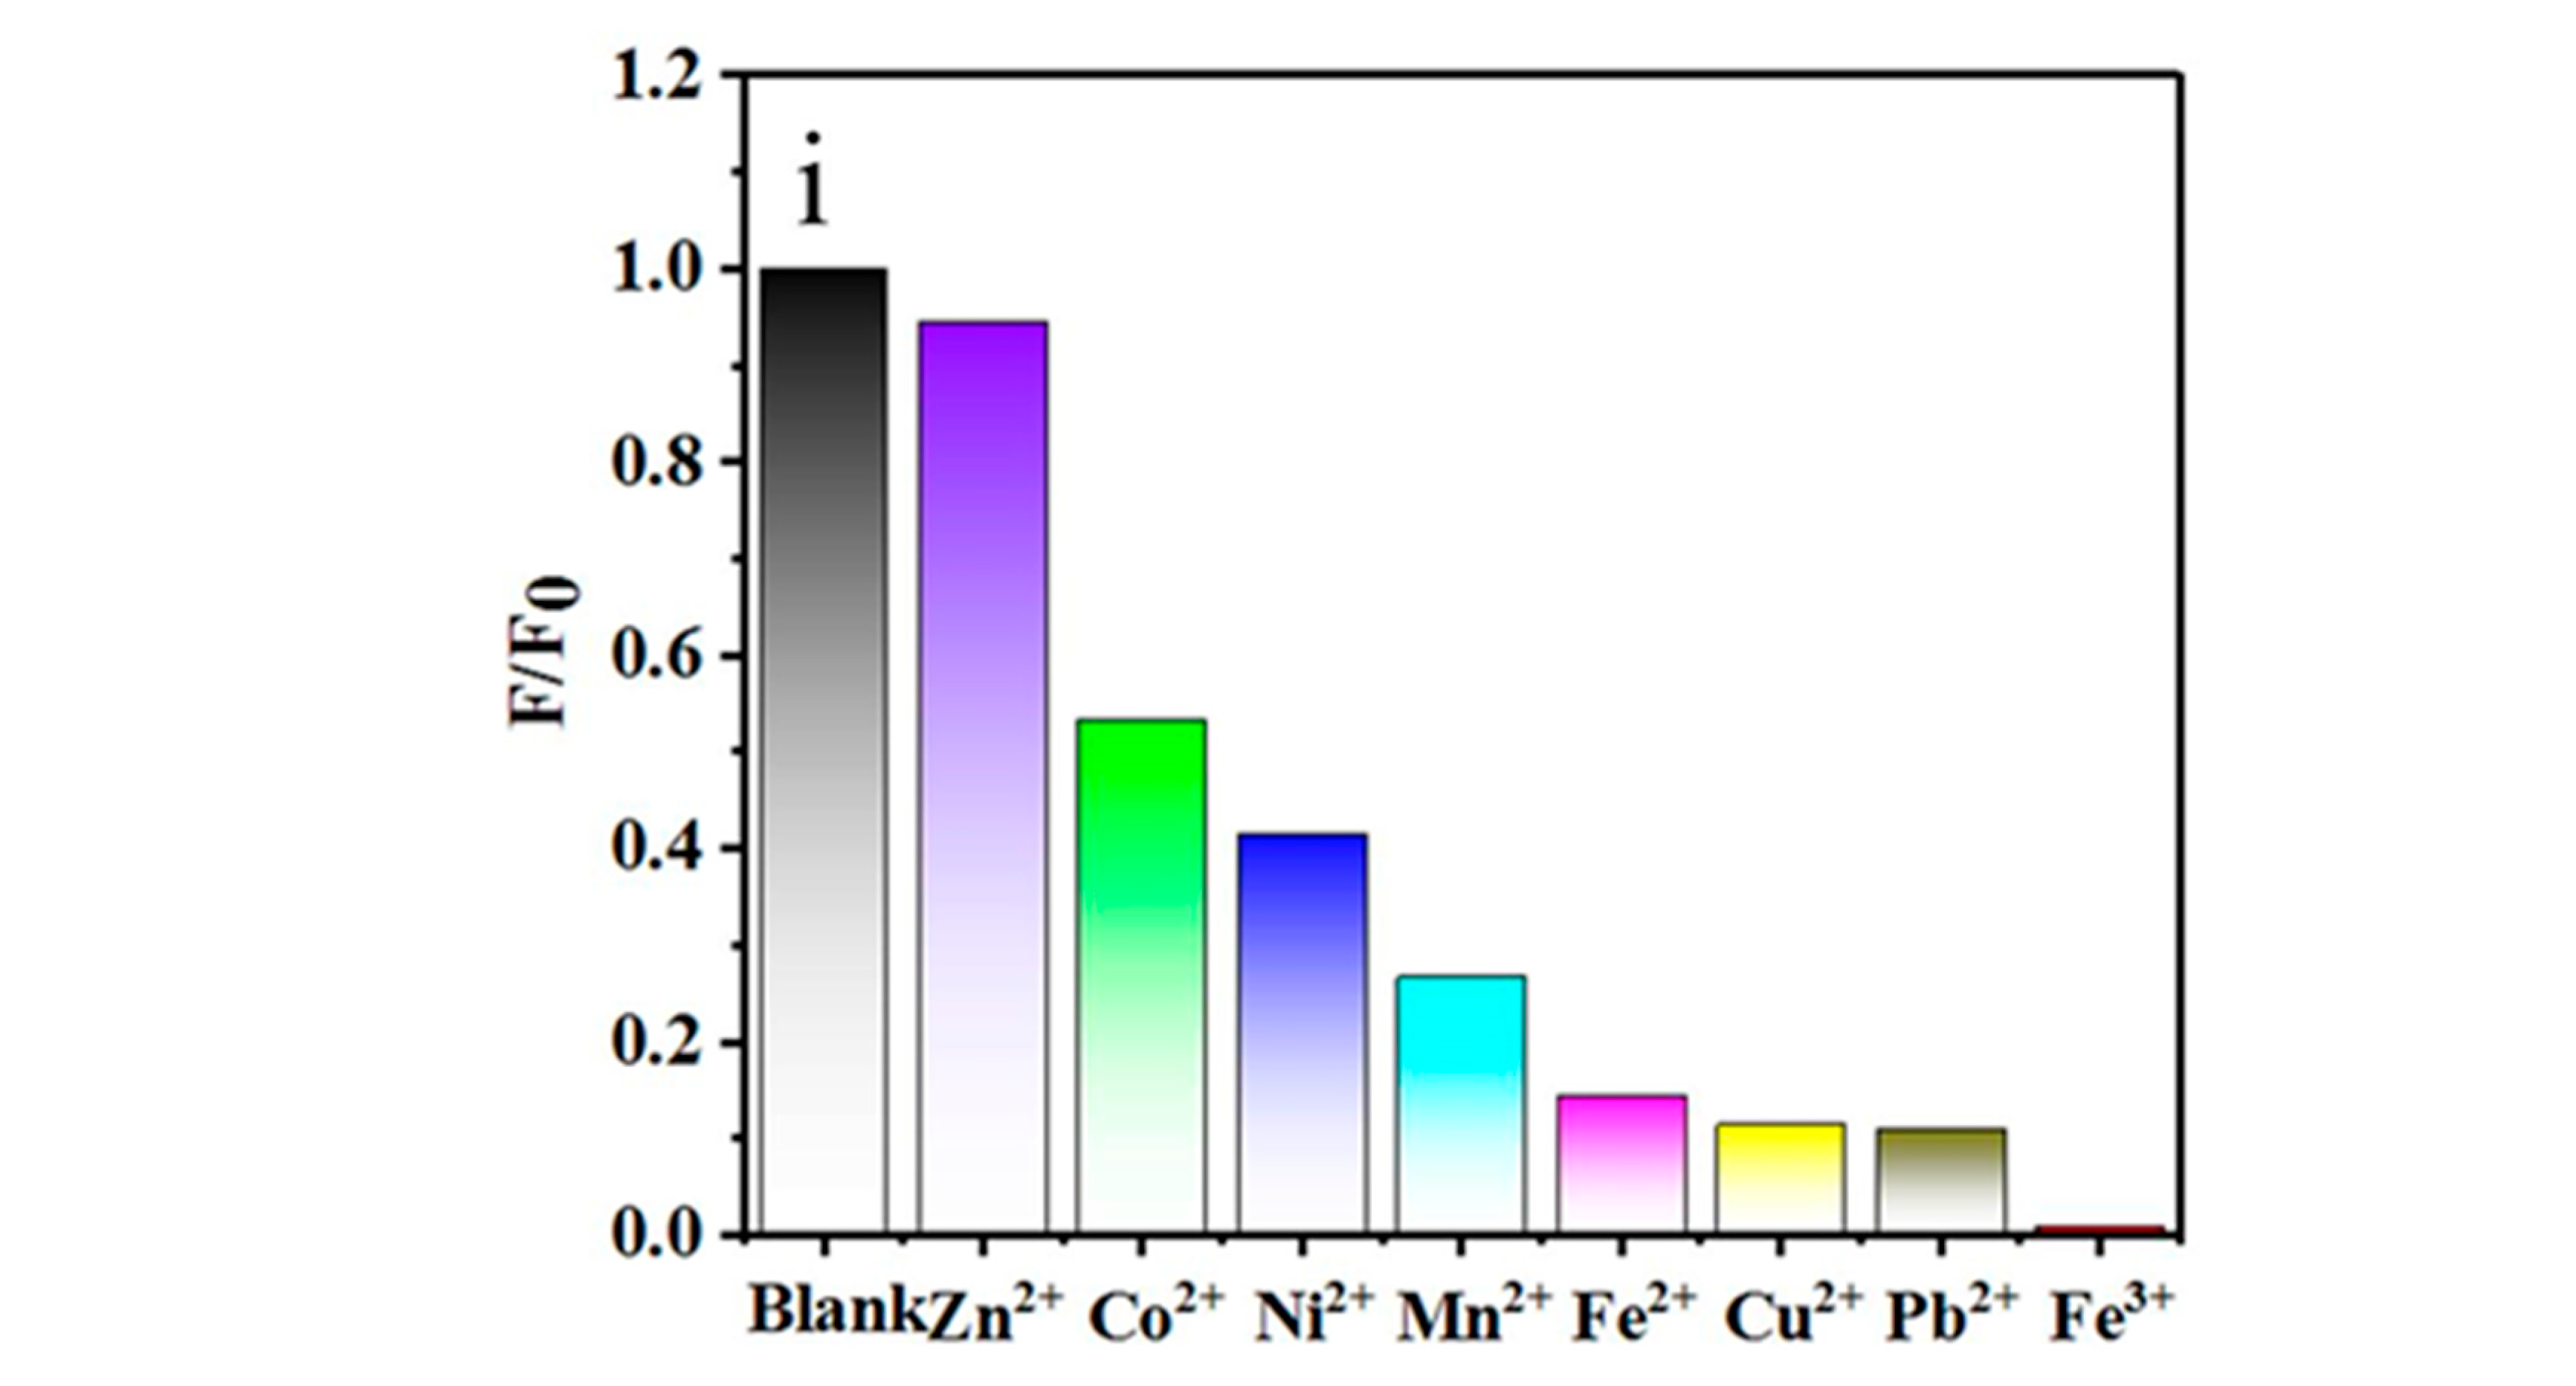
- Brege, J.J.; Gallaway, C.; Barron, A.R. Fluorescence Quenching of Single-Walled Carbon Nanotubes with Transition-Metal Ions. J. Phys. Chem. C 2009, 113, 4270–4276. [Google Scholar] [CrossRef]


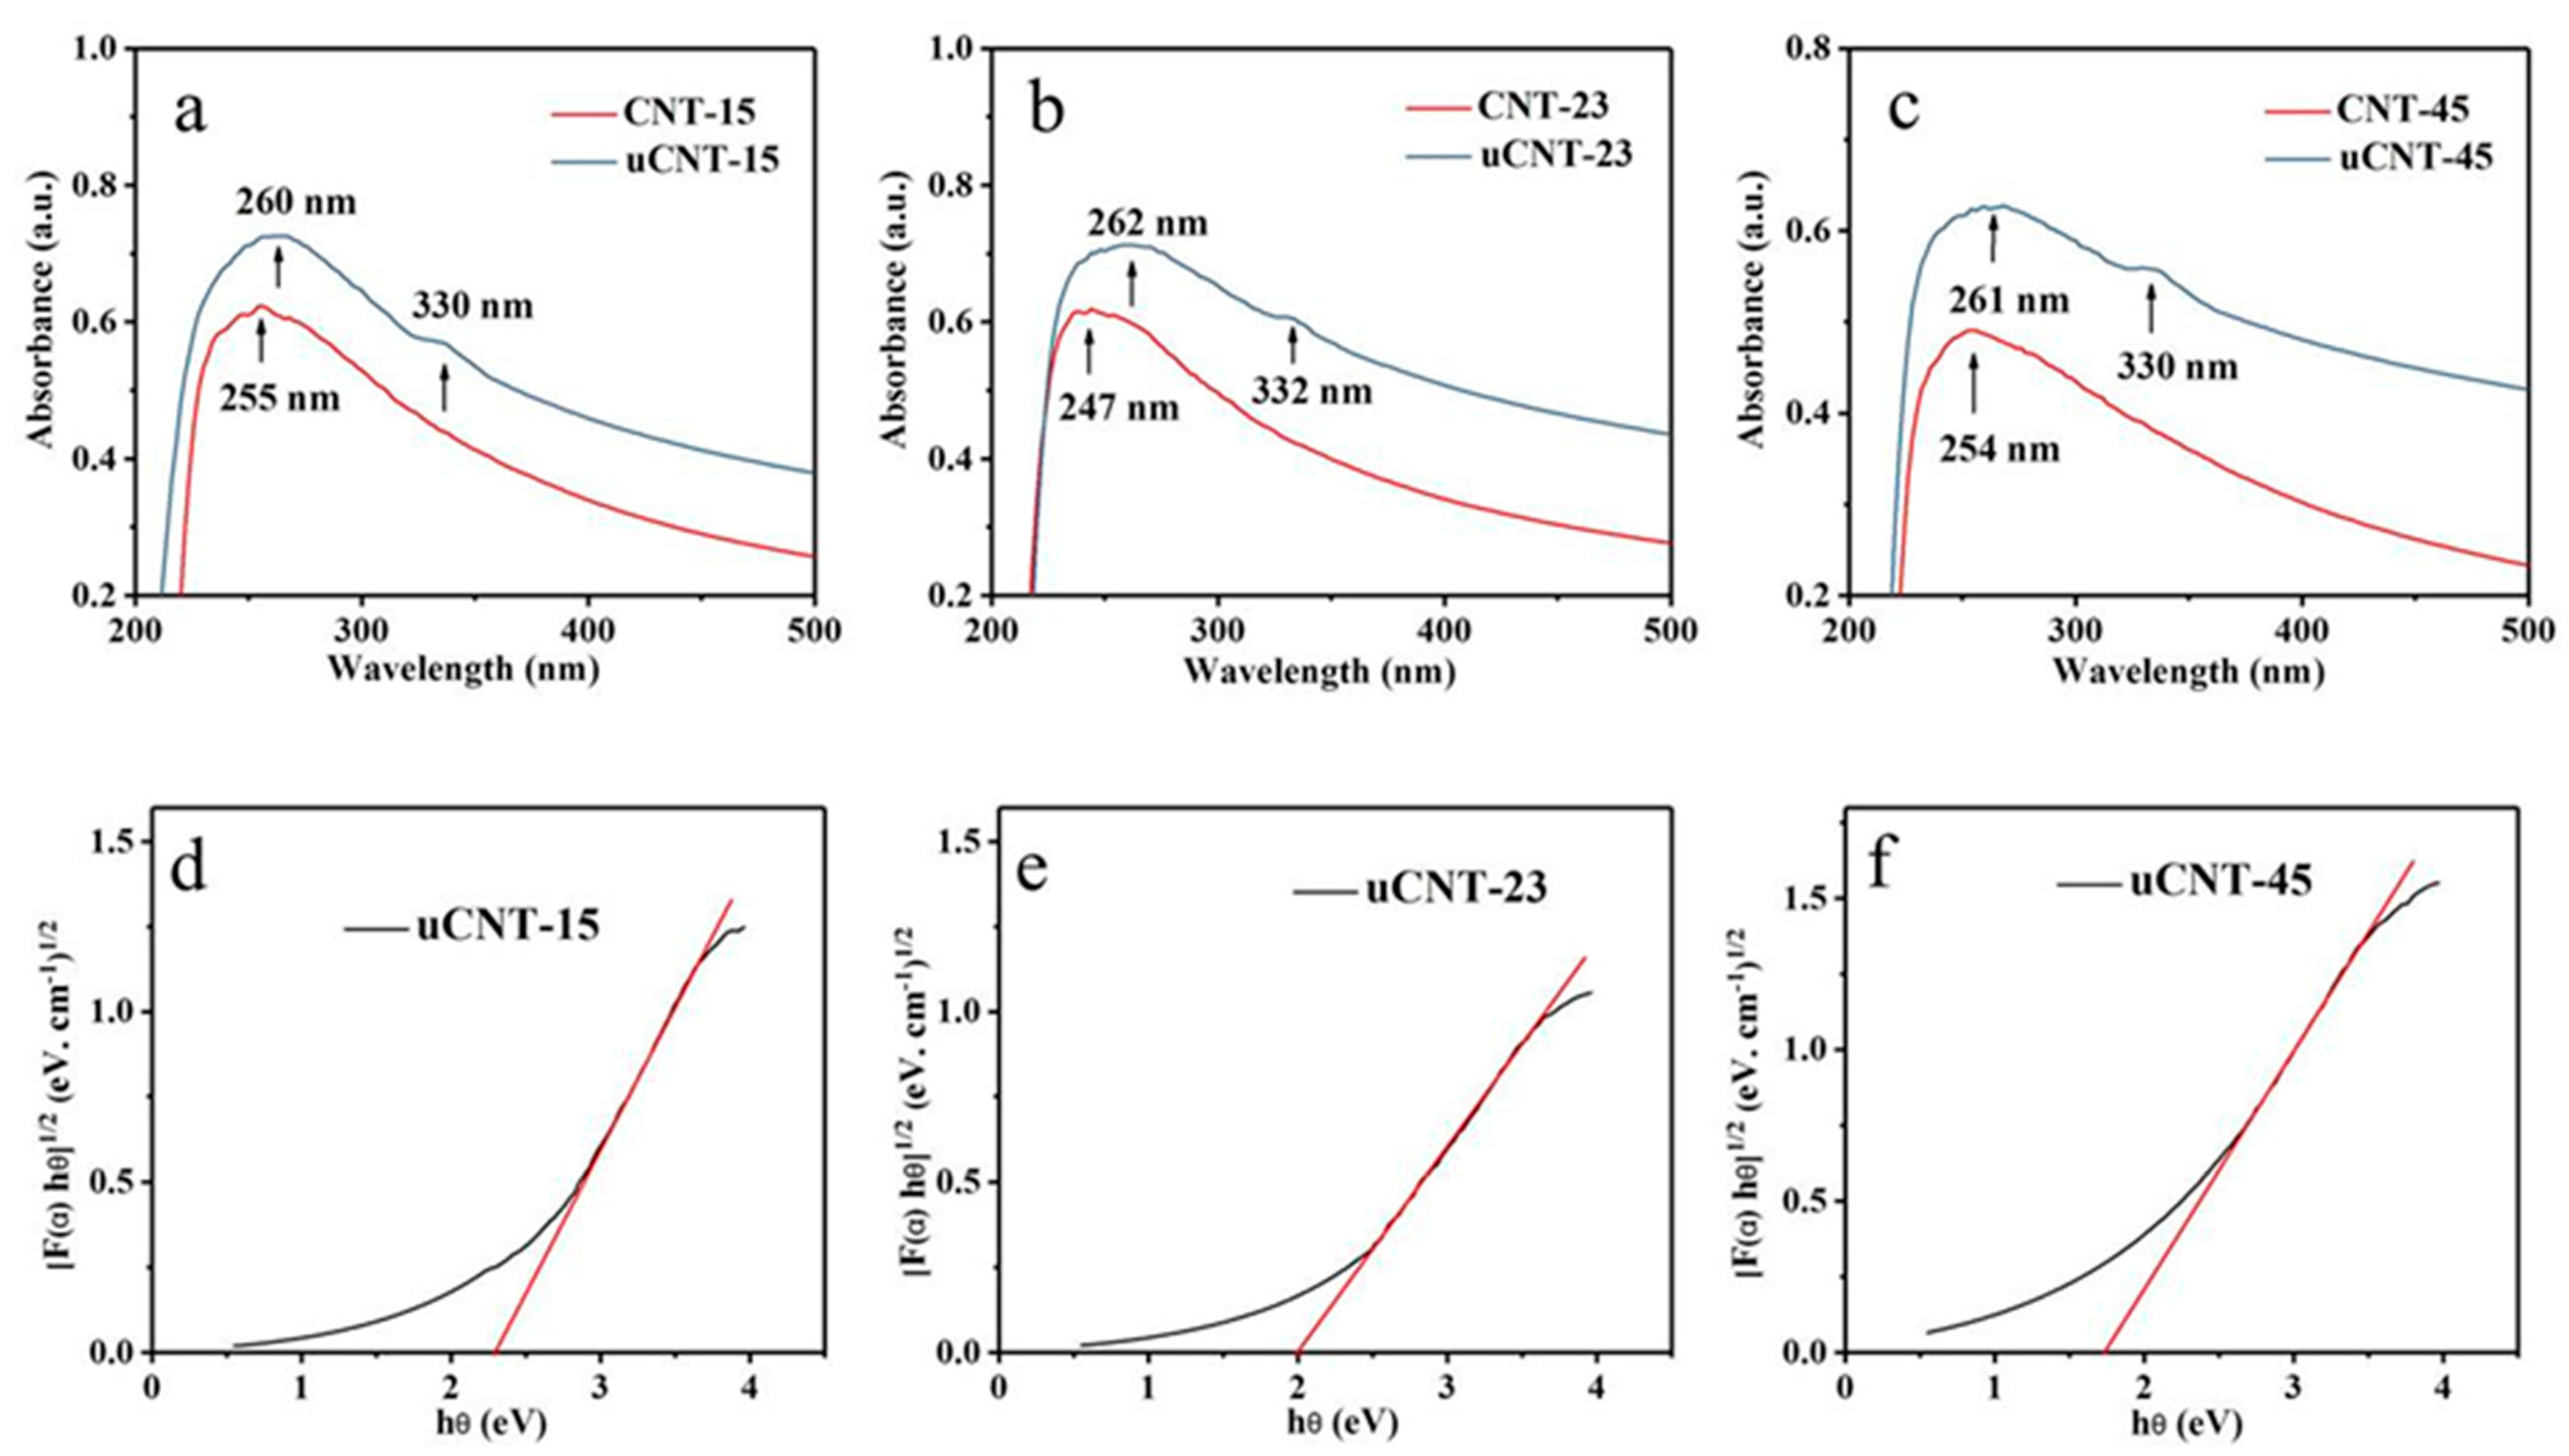
| Sample | D, Diameter of CNT, nm | FWHM for D, nm | W, Width of uCNT, nm | FWHM for W, nm | E = (1 − W/πD) × 100,% |
|---|---|---|---|---|---|
| CNT-15 | 14.88 ± 0.11 | 3.7 | 28.12 ± 0.57 | 20.3 | 40 ± 1 |
| CNT-23 | 22.84 ± 0.76 | 10.5 | 34.90 ± 0.57 | 20.2 | 51 ± 3 |
| CNT-45 | 45.04 ± 0.17 | 5.8 | 62.22 ± 0.75 | 32.5 | 56 ± 1 |
| Sample | 2θ (deg) | FWHM (deg) |
|---|---|---|
| CNT-15 | 26.1 | 1.379 |
| 43.0 | 2.0 | |
| uCNT-15 | 25.8 | 7.2 |
| 43.26 | 2.3 | |
| CNT-23 | 26.02 | 1.039 |
| 43.01 | 1.15 | |
| uCNT-23 | 25.9 | 6.15 |
| 42.92 | 2.0 | |
| CNT-45 | 26.0 | 0.997 |
| 43.0 | 1.1 | |
| uCNT-45 | 25.78 | 5.5 |
| 42.92 | 1.8 |
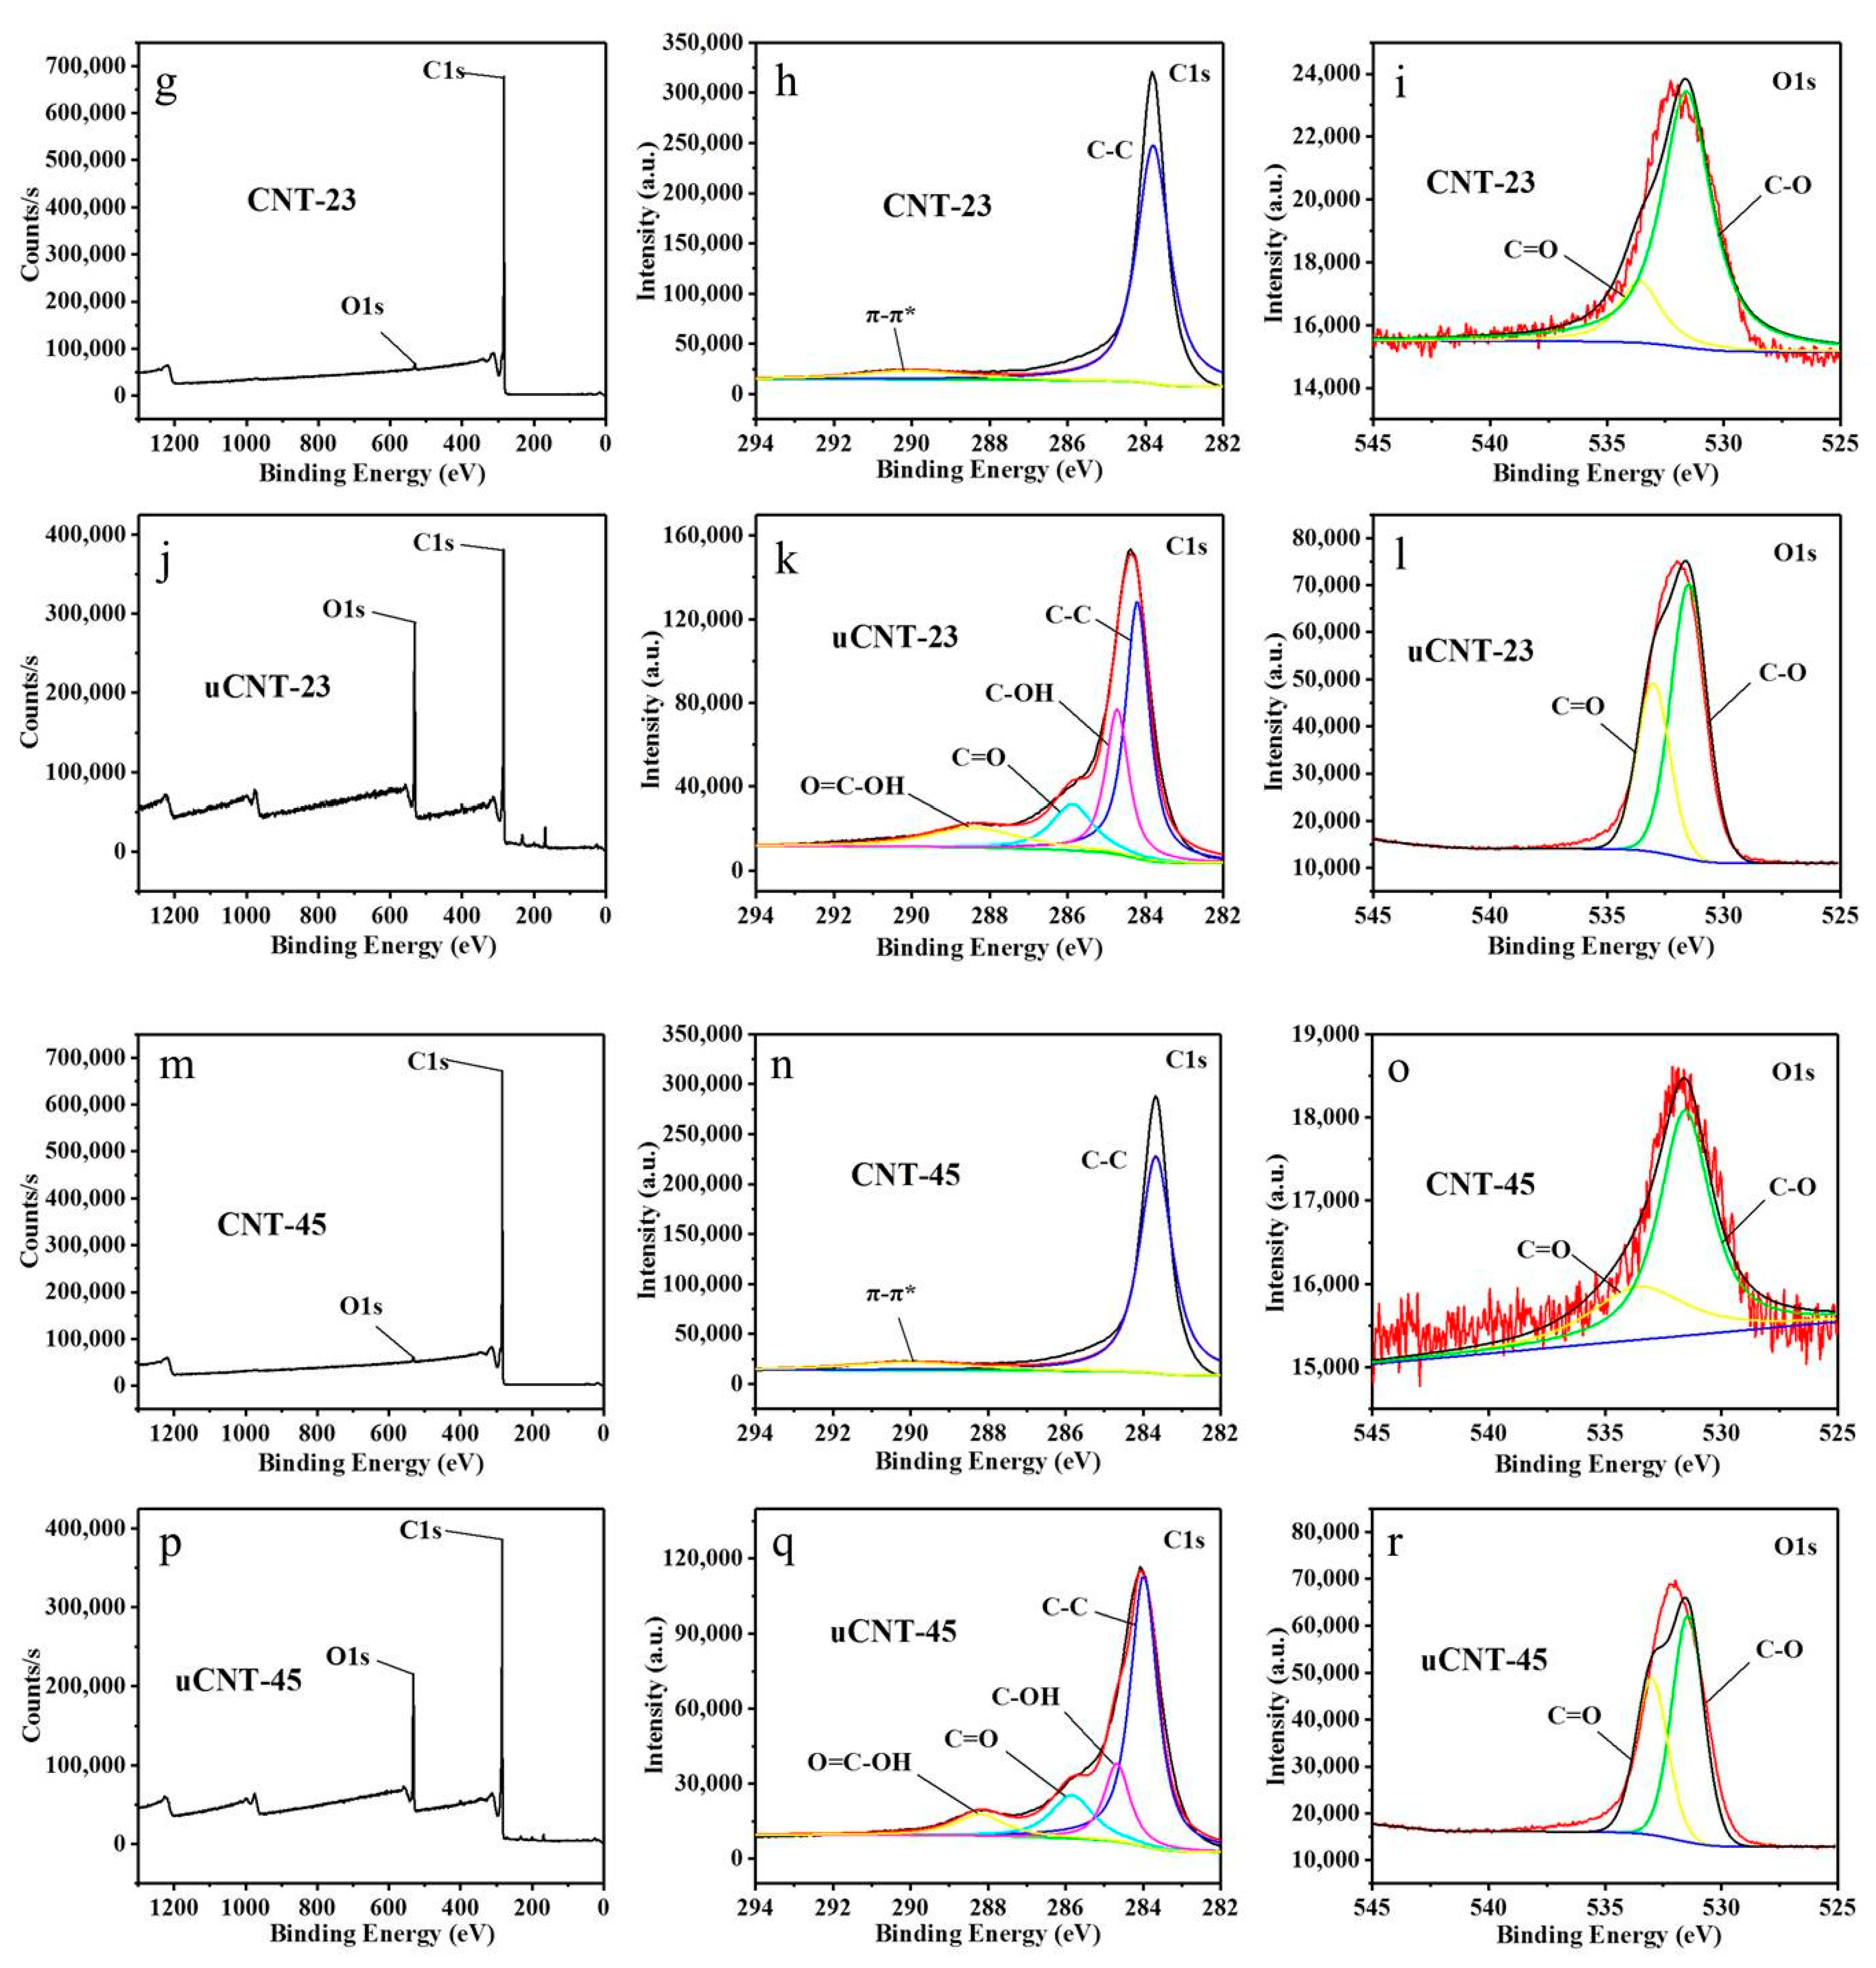
| Sample | C (%) | O (%) | O/C |
|---|---|---|---|
| CNT-15 | 99.54 | 0.46 | 0.0046 |
| uCNT-15 | 80.82 | 19.18 | 23.73 |
| CNT-23 | 99.56 | 0.44 | 0.0044 |
| uCNT-23 | 83.04 | 16.96 | 20.42 |
| CNT-45 | 99.59 | 0.41 | 0.0041 |
| uCNT-45 | 86.3 | 13.7 | 15.87 |
Publisher’s Note: MDPI stays neutral with regard to jurisdictional claims in published maps and institutional affiliations. |
© 2021 by the authors. Licensee MDPI, Basel, Switzerland. This article is an open access article distributed under the terms and conditions of the Creative Commons Attribution (CC BY) license (https://creativecommons.org/licenses/by/4.0/).
Share and Cite
Chen, M.; Qi, X.; Zhang, W.; Yang, N.; Yang, D.; Wang, Y.; Zhang, L.; Yang, W.; Huang, L.; Zhang, M.; et al. Self-Photoluminescence of Unzipped Multi-Walled Carbon Nanotubes. Nanomaterials 2021, 11, 1632. https://doi.org/10.3390/nano11071632
Chen M, Qi X, Zhang W, Yang N, Yang D, Wang Y, Zhang L, Yang W, Huang L, Zhang M, et al. Self-Photoluminescence of Unzipped Multi-Walled Carbon Nanotubes. Nanomaterials. 2021; 11(7):1632. https://doi.org/10.3390/nano11071632
Chicago/Turabian StyleChen, Mengyao, Xiaohua Qi, Wenna Zhang, Na Yang, Di Yang, Yao Wang, Lixiu Zhang, Wenbin Yang, Linjun Huang, Miaorong Zhang, and et al. 2021. "Self-Photoluminescence of Unzipped Multi-Walled Carbon Nanotubes" Nanomaterials 11, no. 7: 1632. https://doi.org/10.3390/nano11071632
APA StyleChen, M., Qi, X., Zhang, W., Yang, N., Yang, D., Wang, Y., Zhang, L., Yang, W., Huang, L., Zhang, M., Wang, S., Strizhak, P., & Tang, J. (2021). Self-Photoluminescence of Unzipped Multi-Walled Carbon Nanotubes. Nanomaterials, 11(7), 1632. https://doi.org/10.3390/nano11071632