1. Introduction
Luminescence based nanothermometry has established itself as a versatile approach to measuring temperature with high resolution in both thermal and spatial dimensions. The selling points of this technology are easily identified, as it is a non-contact measurement and it can be used for voluminous measurements in doped media [
1] and on surfaces [
2]. Moreover, it is robust against many external influences, such as electric fields [
1]. The fundamental quantity to measure in nanothermometry is the luminescence intensity ratio (FIR) of two emission lines. Temperature dependence of the FIR is ensured by choosing emission lines originating from thermally coupled energy levels, separated by
E. This leads to a Boltzmann dependency of the FIR given by
with N
and N
being the population densities of the two upper energy levels, k
the Boltzmann constant, and T the temperature. The relative sensitivity
is then determined by the FIR at room temperature FIR
, and by the rate at which the FIR changes with temperature. The temperature resolution
T can be derived from Equation (
2) to be
Based on this set of equations, material selection for nanothermometry seems to be straight forward, as the only criterion for inclusion should be a correctly chosen relation of
E/k
T [
3]. Although this is sufficient for most practical applications, further effects need to be considered when aiming at an optimization of the resolution and a reduction of the setup’s complexity. For example, non-radiative relaxations may impose measurement errors if the transition rate is comparable to the thermal relaxation rate [
4]. Absorption of the luminescence in the host material can cause errors exceeding 10 K [
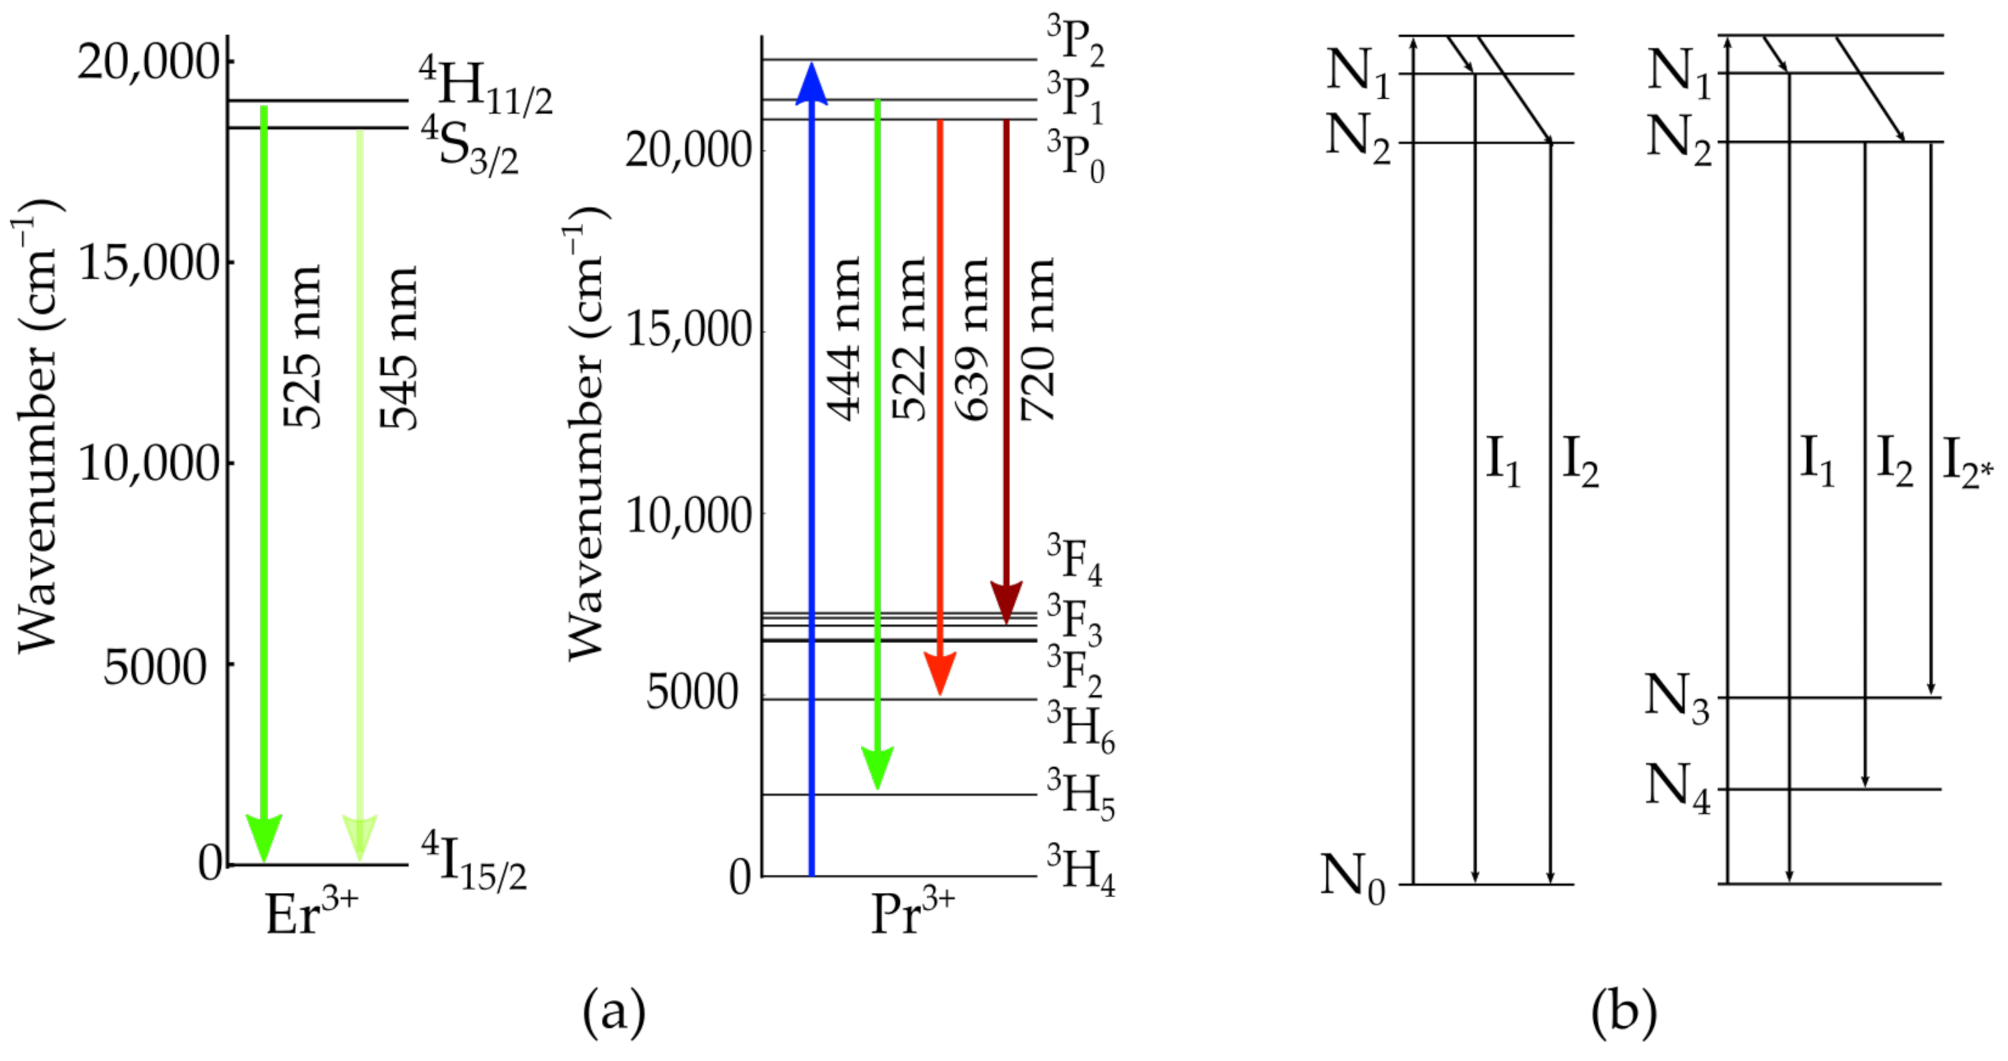
5] and needs to be considered, especially if the absorption strength is also temperature dependent. However, the pumping regime is mostly overlooked as a potential source of temperature errors although it strongly affects the population densities of the lower energy levels during the measurement. The influence of population densities can be illustrated by comparing the energy level configuration of two commonly used active ions, Erbium (Er
) [
6] and Praseodymium (Pr
) [
7], as depicted in
Figure 1a. The combinations of transitions used in Er
nanothermometry are
H
I
centered around 525 nm with
S
I
centered around 545 nm, therefore including only one lower energy level. In contrast, using Pr
for nanothermometry enables different transitions, for example,
P
H
at 522 nm and
P
H
at 639 nm with varying lower energy levels. The same distinction applies to other active ions, such as Nd
[
3] or Ho
[
8], respectively. The schematic 3- and 4-level laser diagrams provide a more general view and are shown in
Figure 1b. One benefit of using varying lower energy levels is the spectral separation of the emission lines independent of the energy gap of the upper levels, therefore adding flexibility to measurements.
Currently, the sensitivity of nanothermometers is characterized either under pulsed excitation [
7,
8] or continuous excitation [
1,
3]. This raises the question of whether calibration data acquired with either of these systems are interchangeable, even for the same active ion. Re-absorption of emission could prevent this transfer because these population densities differ between instantaneous and steady state conditions. Re-absorption is a well-known phenomenon resulting, for example, in the reduced efficiency of Pr:YLF lasers emitting in the orange spectral range [
9]. Fitting the thermal evolution of the FIR in Pr
:YF
for the same upper levels, but different lower laser levels, may yield different
E values [
10], which could also be attributed to re-absorption differences. Consequently, a population of lower energy levels has to be considered as the origin of FIR deviations, even in the absence of temperature variations, therefore causing measurement errors. We addressed this issue by utilizing time dependent laser rate equations. Since the two main factors determining the population density in luminescence applications are the pumping rate and the emission lifetime, we derived the corresponding relationships for a population of lower energy levels. As a result of this, different calibration regimes for nanothermometry can be defined depending on the pump duration and luminescence lifetime. The pumping rate fluctuates through variations of either energy, wavelength or duration, and the corresponding error caused by re-absorption is presented for an exemplary Pr
based nanothermometer system. The main finding of our work is that either short pulses or continuous excitation should be preferred, as both help to improve temperature resolution. For practical applications, distinctions between the two regimes may be necessary depending on the desired sampling rate or complexity of the setup. Therefore, we developed a formalism to unify pumping schemes and to maintain baseline measurements.
2. Population Densities
We used laser rate equations [
11], as given in
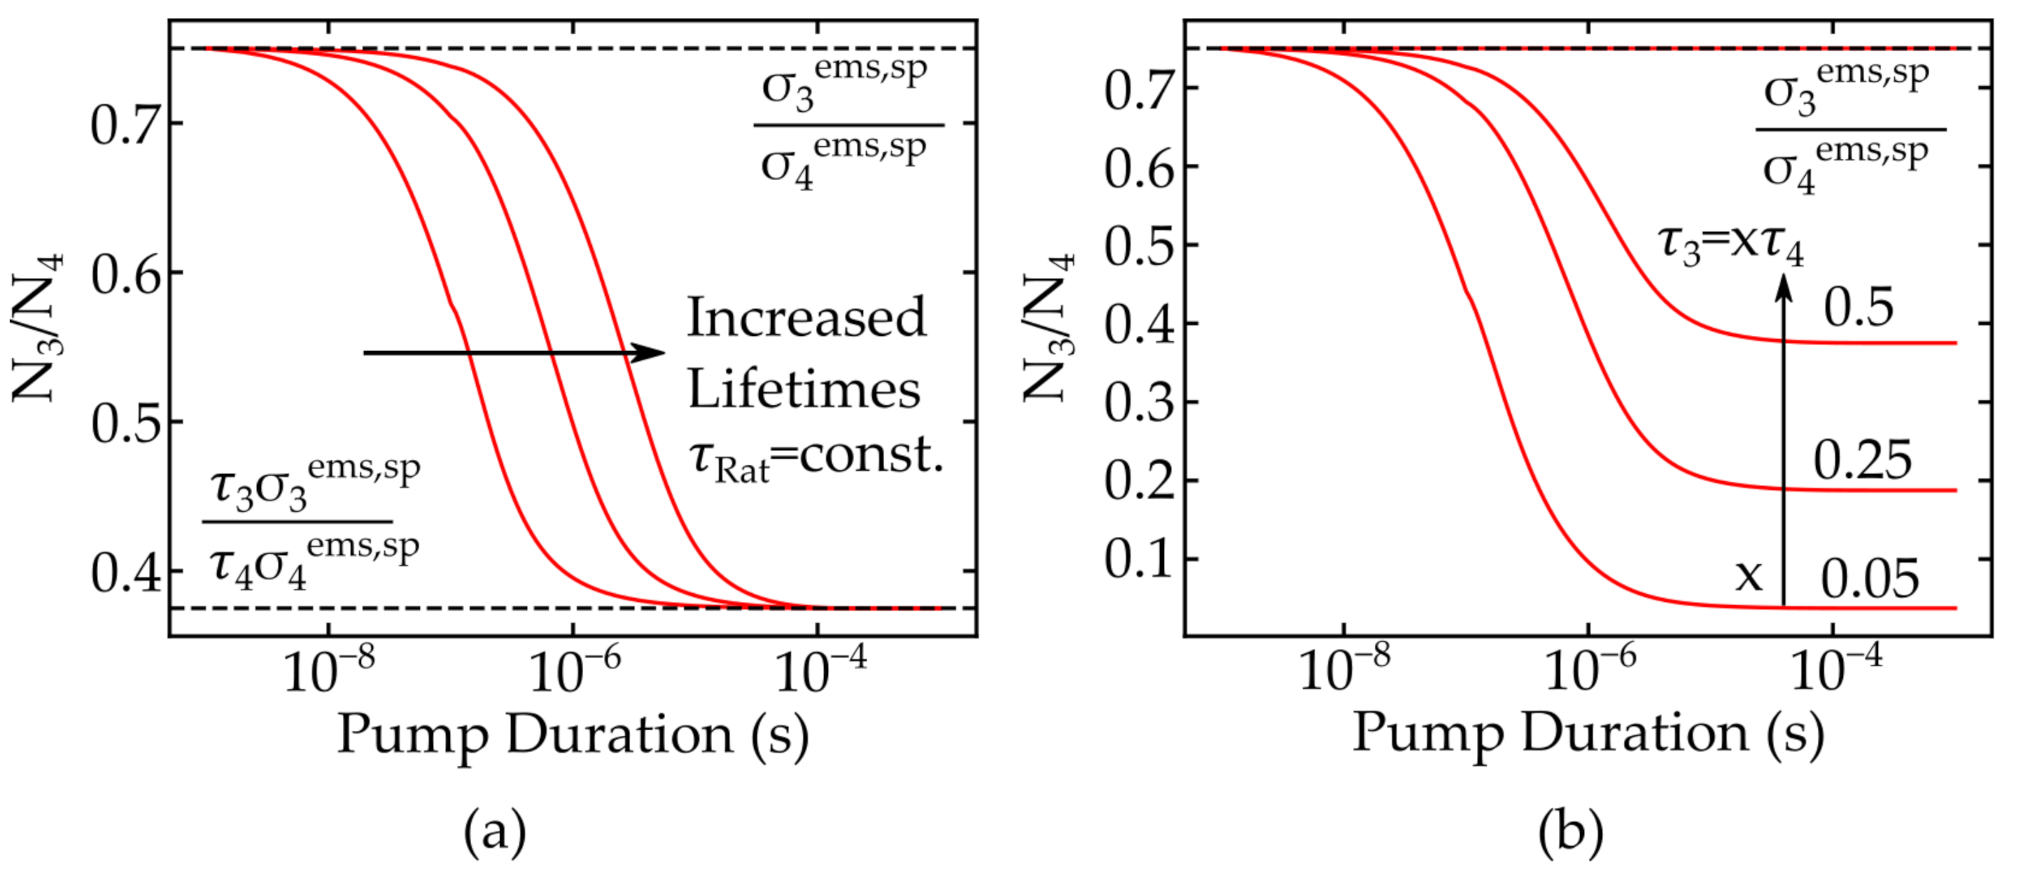
Appendix A, to calculate the population density of the emission levels N
and N
of a 4–level scheme as shown in
Figure 1.
Figure 2 illustrates the relations of these populations depending on the relative strength of the spontaneous emissions, which is determined by their emission cross sections
and
, and the lifetimes of the levels
and
, respectively.
The material parameters were taken according to a Pr:LiLuF crystal [
12] and the simulations were performed with a constant pump power of 1 W. The amplitude and temporal evolution of these changes is determined by the material parameters, as seen in
Figure 2. The onset of the different stable regimes is determined by the absolute values of the lifetimes
and
and, for example, increasing the lifetimes delays the achievement of the steady state operation. This result is shown for a constant ratio
in
Figure 2a. The difference of the population ratio depends on the ratio between the two lifetimes, as depicted in
Figure 2b.
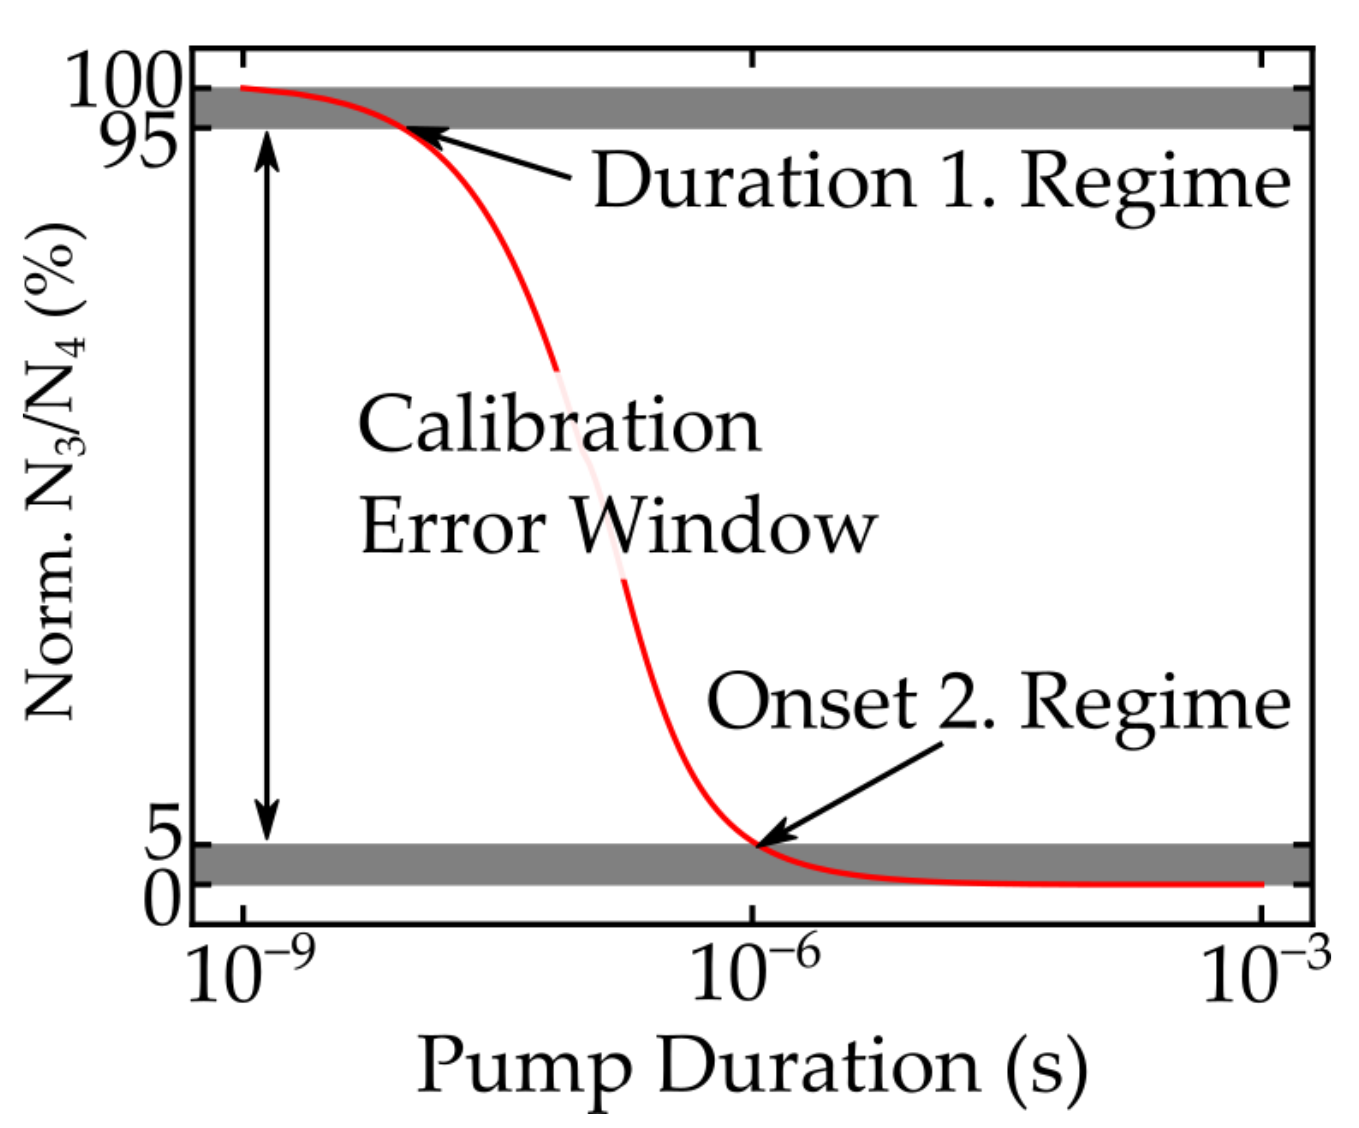
These relations can be used to identify application areas for nanothermometry.
Figure 3 highlights that two stable regimes of the temporal evolution of N
/N
exist, depending on the pump duration. For short excitation times, the population relation is defined only by their respective emission cross sections. The influence of the lifetimes
and
grows for longer pump duration. Once the steady state regimes of all involved energy levels are reached, the second stable regime commences. Generally, these results apply to all materials where the luminescence occurs at different, lower energy levels. For materials such as Er
, however, this effect vanishes as the lifetime and cross sections of lower levels are identical and both regimes are the same. The population of lower energy levels and the FIR error are connected through the reabsorption of luminescence in order to transfer these results to a temperature measurement. The corresponding cross section
was calculated using the McCumber relation [
13] from
, Z
and Z
as parameters for the degeneracy of the Stark levels in the two involved energy levels 1 and 2, and the energy distance E
between the lowest energy levels of both manifolds 1 and 2 [
14]. The relation is defined as follows:
and material parameters were chosen for a Pr
nanothermometer. This formalism gives a proportionality between the absorption and emission cross section, with an additional factor of Stark level splitting and population [
15]. It is therefore used to gain an estimation of the remaining luminescence P(z) after absorption via the Lambert–Beers Law. Applying the approximation for a short interaction length z yields
Based on these relations and Equation (
1), a factor C to convert the instantaneous FIR
to the steady state FIR
is defined:
3. Influence of Pump Fluctuations in Pulsed Regime
Pulsed excitation sources operating in the nanosecond regime are frequently used in nanothermometry [
7,
8], and typical pump sources, such as OPOs or q-switched lasers, are prone to power and energy fluctuations, respectively. As the value of
is wavelength dependent, fluctuations of the emission wavelength can also be treated as energy fluctuations, as can be seen from Equation (
5). Furthermore, the pulse duration FWHM
, corresponding to a Gaussian shaped pulse, may also fluctuate, resulting in another source of measurement errors. The temporal evolution of luminescence emission is simulated to characterize these effects and to gain the amplitude of
FIR.
The corresponding temperature error
T, caused by the fluctuations, can be accessed by using the specifications of Pr:YLF nanothermometers with FIR
1.2 and S ≈ 1.1 %/K [
7] through Equation (
3). The lifetimes of energy levels for a given dopand also depends on the host material. Unfortunately, the lifetimes of Pr:YLF crystals were not available, so the lifetimes of the
F
or
F
levels in Pr:LaCl
, reported to be 58
s [
16], were used for the calculations. However, the proposed formalism is still valid for different lifetimes, and the calculations can easily be adapted after measuring the transition rates inside the desired material. The results are shown in
Figure 4 and
Figure 5.
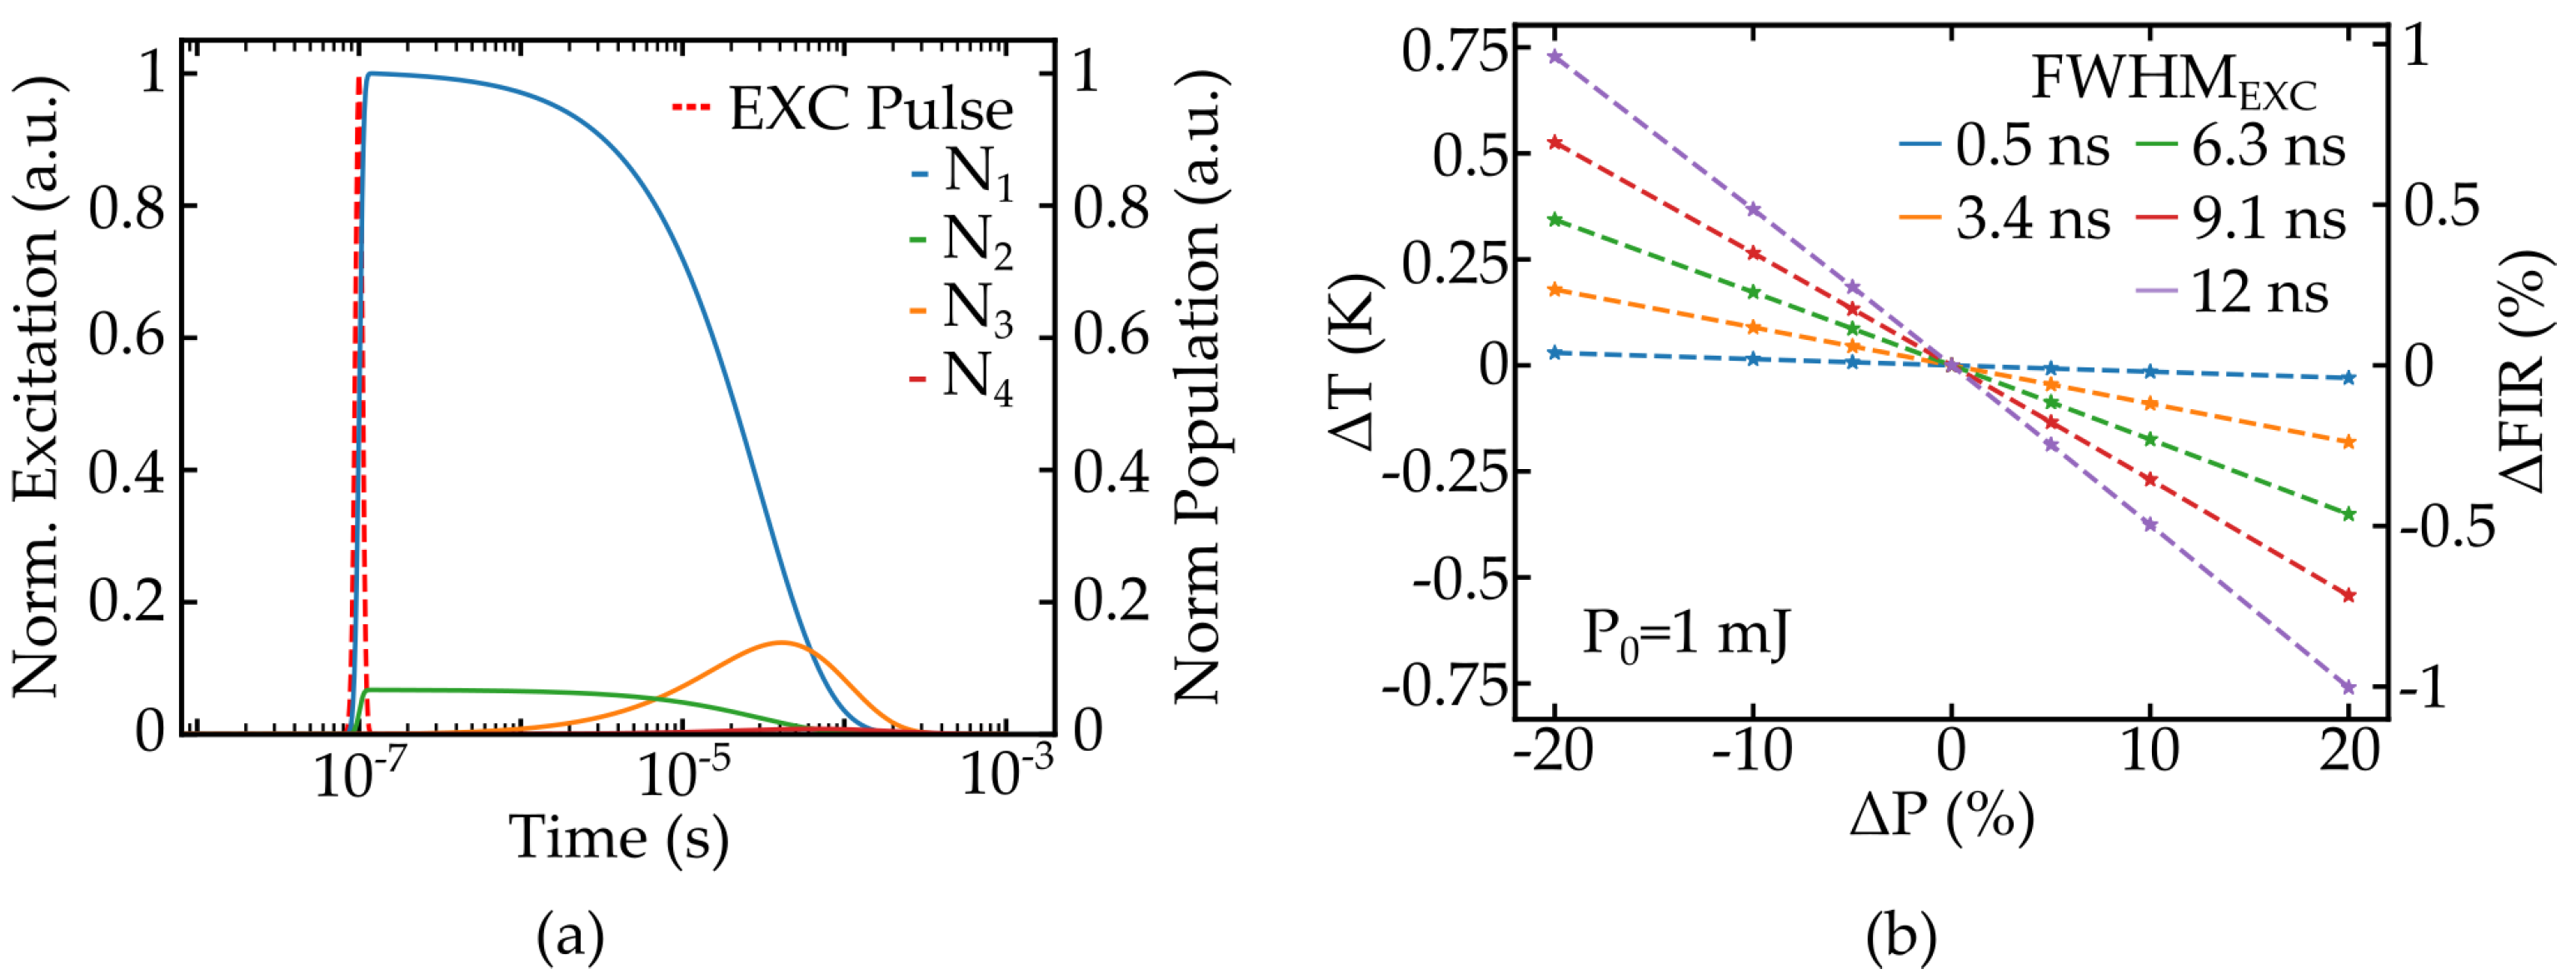
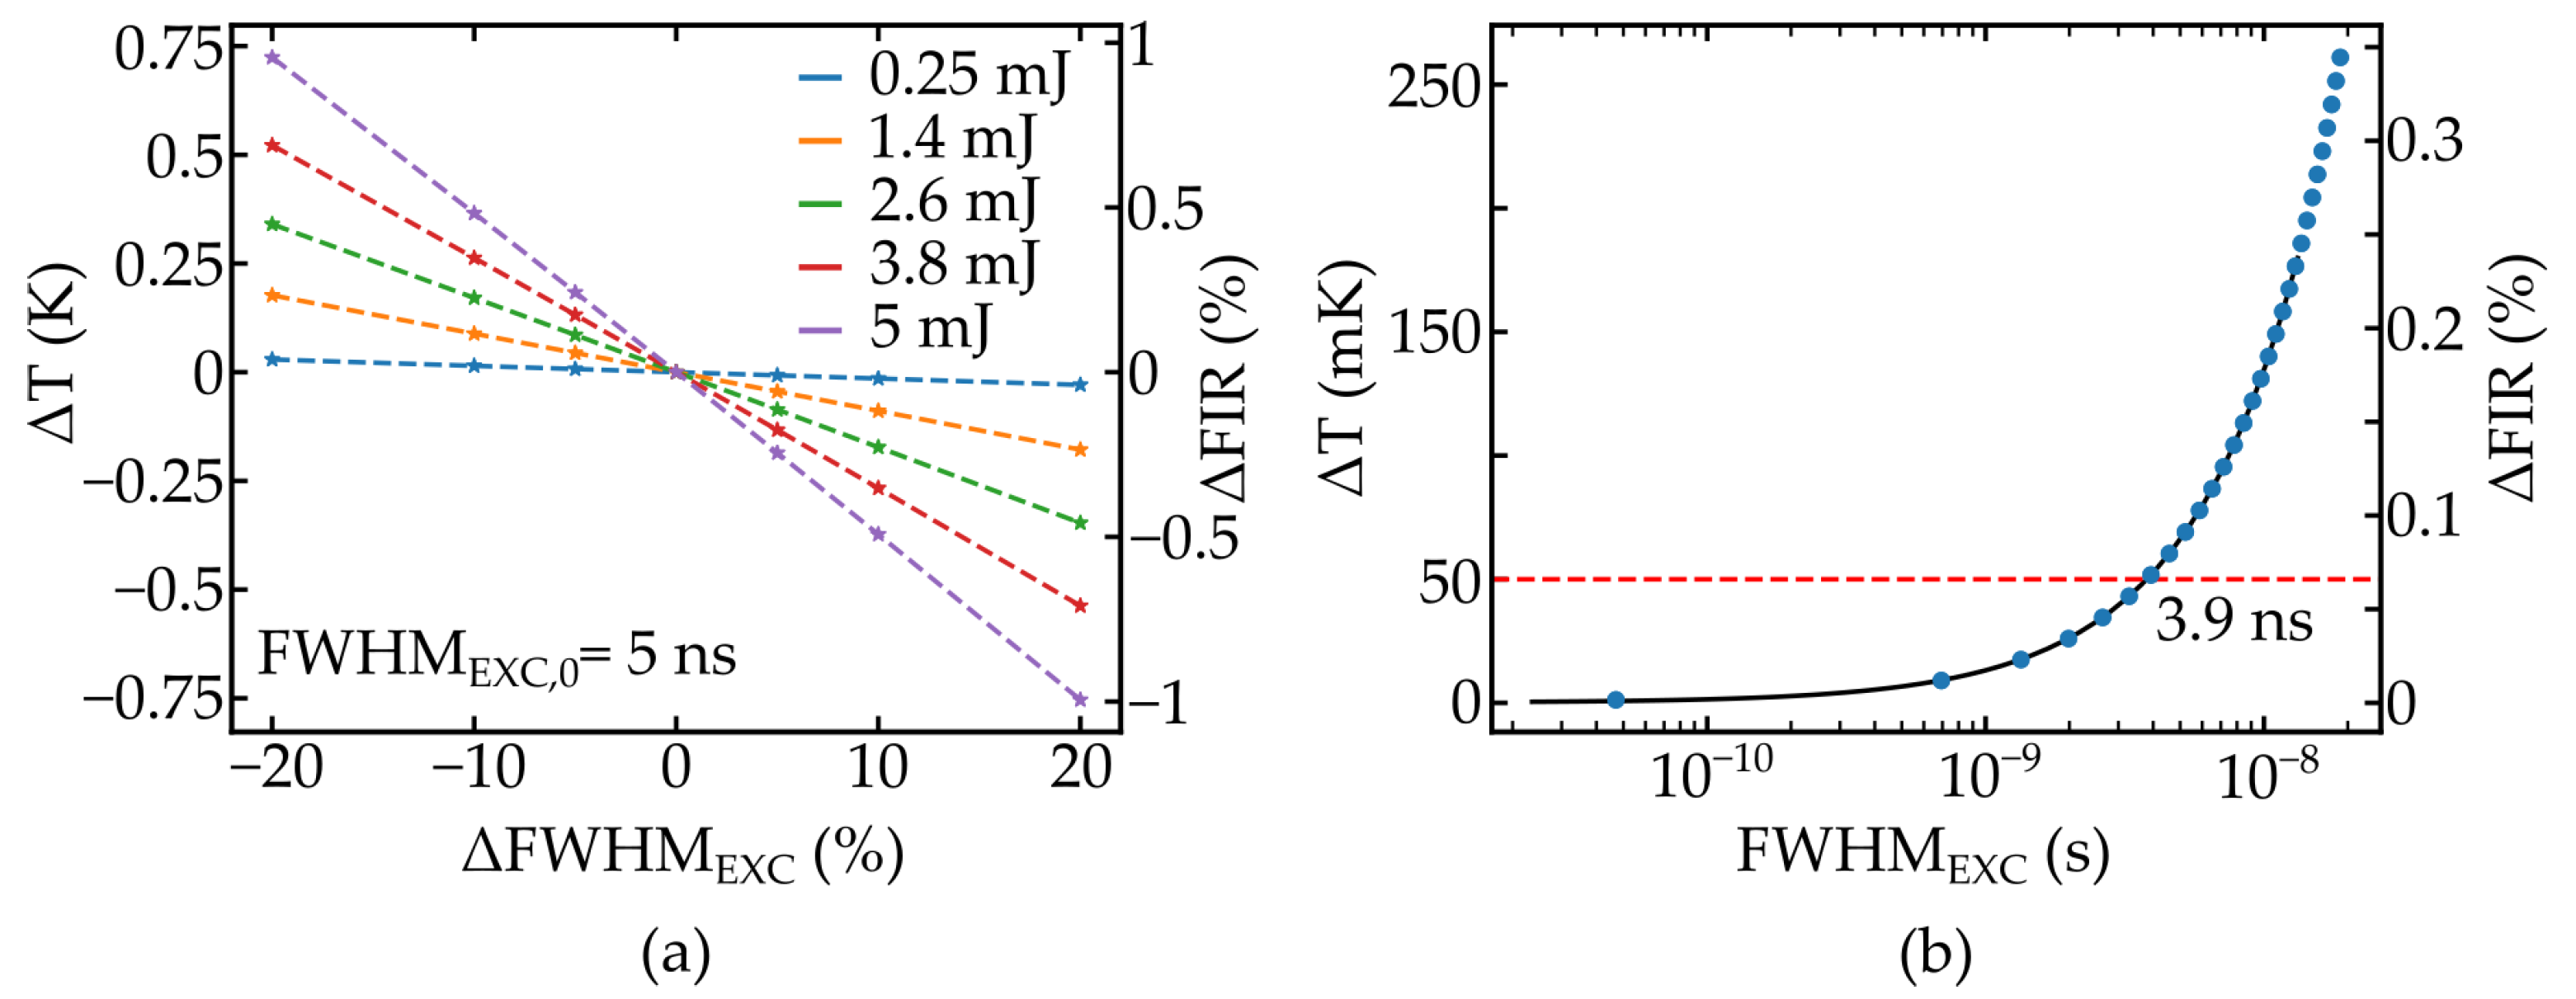
As seen in
Figure 4a, the populations of the thermally coupled emission levels N
and N
reach their respective maximums closely following the excitation pulse, whereas the populations of the lower levels N
and N
are shifted due to the lifetime of the upper levels, as expected. The temperature error caused by the different absorptions of luminescence emission over time is given in
Figure 4b and
Figure 5a, depending on energy variation
P and pulse duration fluctuations
FWHM
, respectively. The amplitude of the error is similar and, for both fluctuations, ranges of 20% are identified to cause a temperature error of approximately 0.75 K. This error
T does not directly correlate to the actual resolution achievable in a measurement as additional noise sources need to be factored in. Therefore, this value should rather be considered as a minimum value. It becomes apparent that in order to perform high precision temperature measurements, pump rate fluctuations need to be minimized by using stabilized short pulse pump lasers, although even stabilized OPO systems exhibit ±6% energy fluctuations [
17].
The dependency of
T on pulse duration and a constant energy fluctuation of 10% are shown in
Figure 5b; a pump pulse duration of below one nanosecond should be preferred.
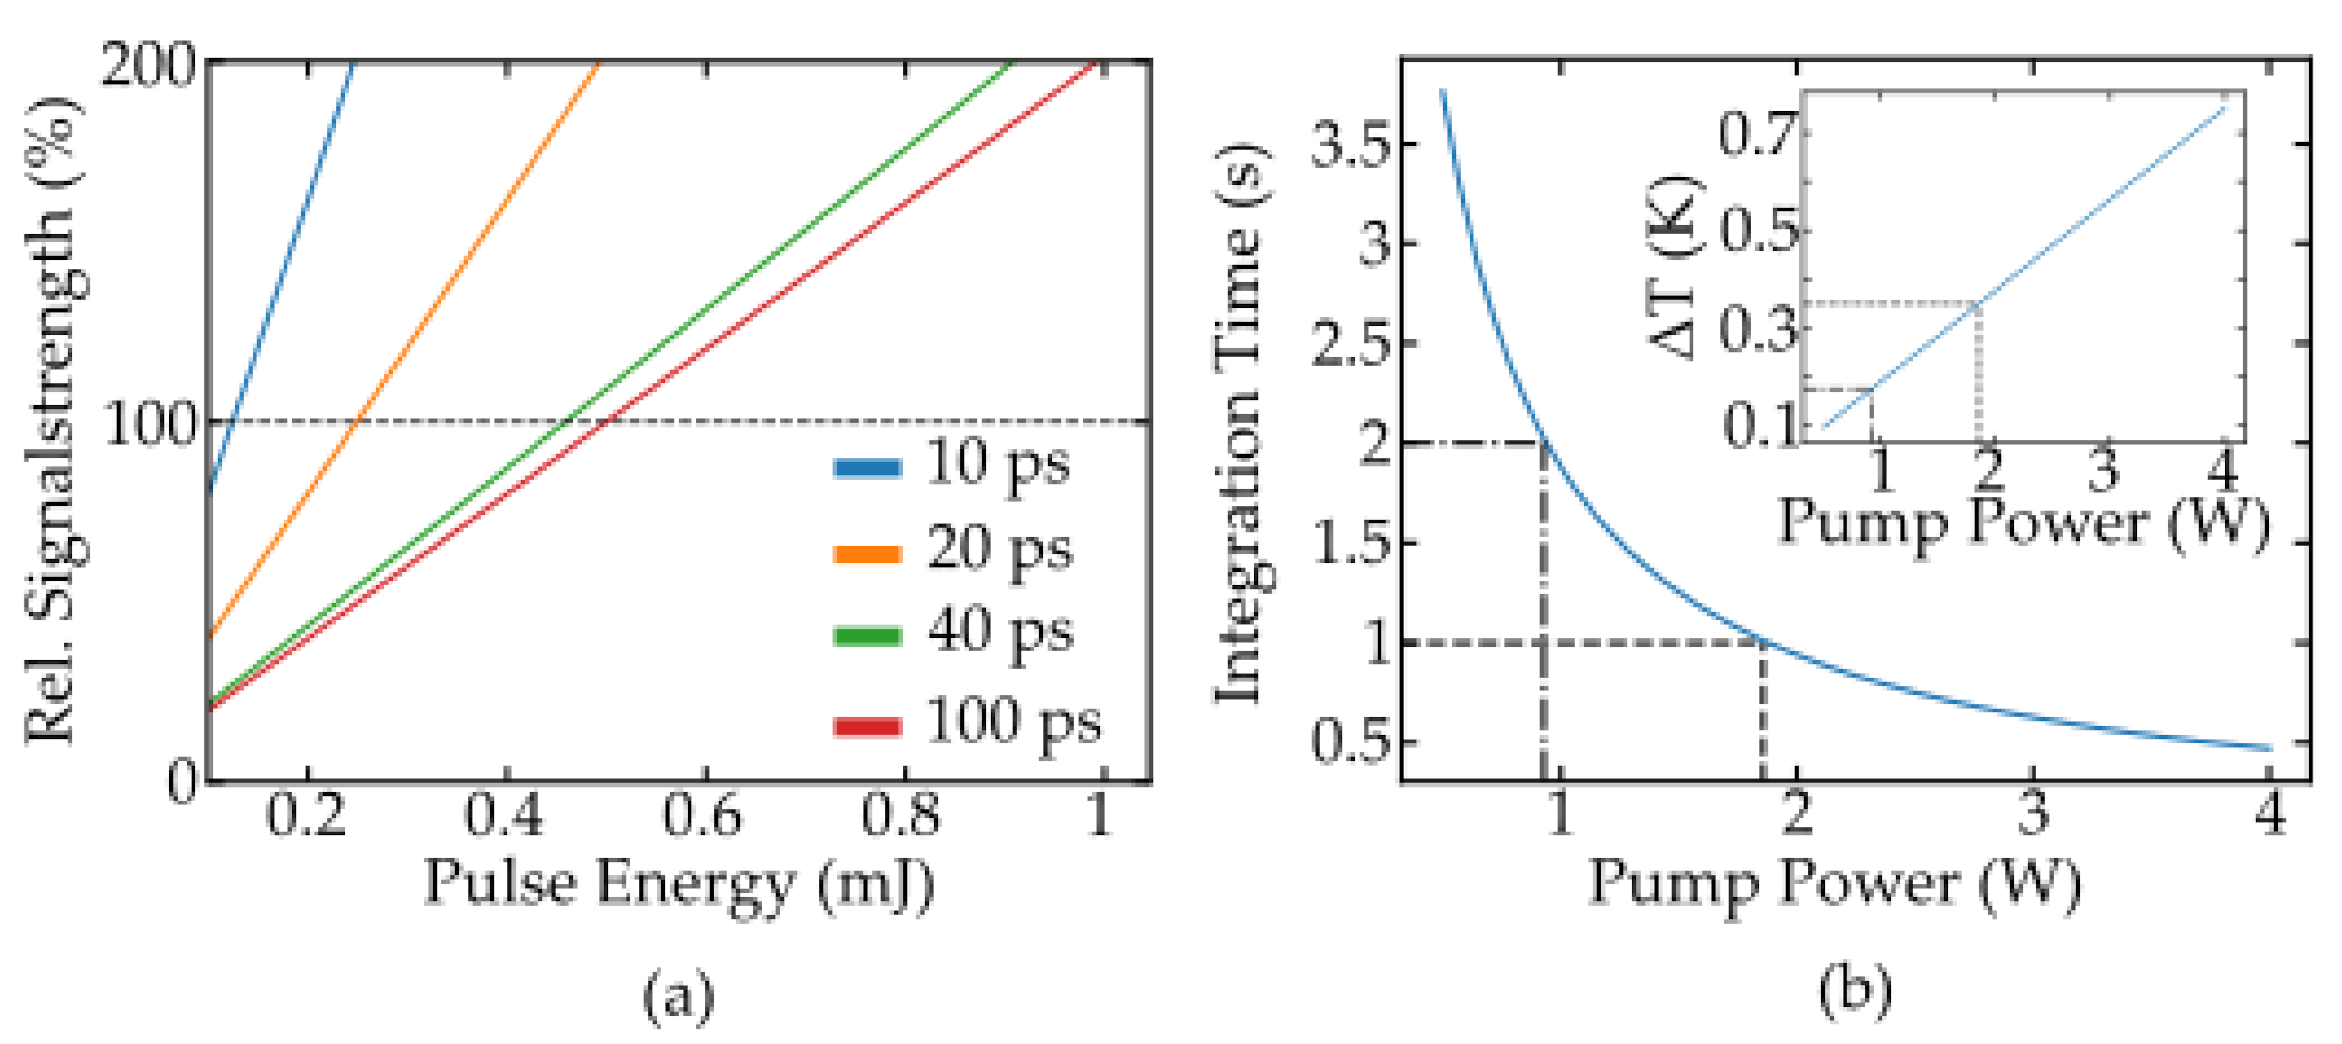
Apart from pump noise, the overall error budget is also influenced by the strength of the emitted luminescence. Therefore, switching the pump regime may result in the need to also adjust the pump energy or power, respectively. Simulations were performed for both short pulsed lasers (>>1 ns) and continuously emitting diodes to obtain these values and to maintain the signal strength of the assumed 3.9 ns pulse, marked in
Figure 5b. Therefore, the most relevant in these simulations is the strength of luminescence emission, which again is proportional to the population densities. For the short pulsed laser systems, three pulse durations of 20 ps, 50 ps and 100 ps were chosen and the total emission is compared relative to the aforementioned nanosecond pulse. For the continuous case, the integration time was included as a parameter to identify the required combinations of integration time and pump power for the desired signal strength. The results are shown in
Figure 6 and highlight the two optimum pump regimes for nanothermometry: short pulse and continuous wave excitation. The pulse energy needed for an excitation duration of 100 ps is approximately 0.5 mJ, and this pump regime can be used for high precision measurements even without the exact knowledge of material parameters like the emission lifetimes. However, especially for cost effective measurements, this approach can be undesired as it requires more complex laser sources. A continuous excitation is hence favorable. On the other hand, the integration time necessary to achieve the same signal strength with a simplified setup using a continuous emitting laser diode lies in the range of 1–2 s and is thus not applicable for high sampling rates. The increased heat input by the pump laser is another potential drawback of continuous excitation. The steady state temperature deviation caused by 1–2 W incident pump power can be estimated with approximately 0.15 K–0.35 K, as depicted in the inset of
Figure 6. The quantum defect of the Pr:YLF emission was considered to be the main heat source, and doped SiO
was assumed to be the host material in this calculation. The formalism used for this estimation can be found in [
18]. Additional absorption, for example, by the host material, may further increase
T but the measurement error caused by this can be easily calibrated as shown in [
1].
4. Calibration for Different Pump Regimes
Both of the presented pumping regimes offer advantages and disadvantages, and their usage should be carefully chosen depending on the desired application. Since most baseline measurements that are currently used are conducted with either pulsed or continuous excitation, the formalism presented in Equation (
6) can be used to transfer baseline measurements. This procedure is described for a switch from pulsed to continuous excitation in the following.
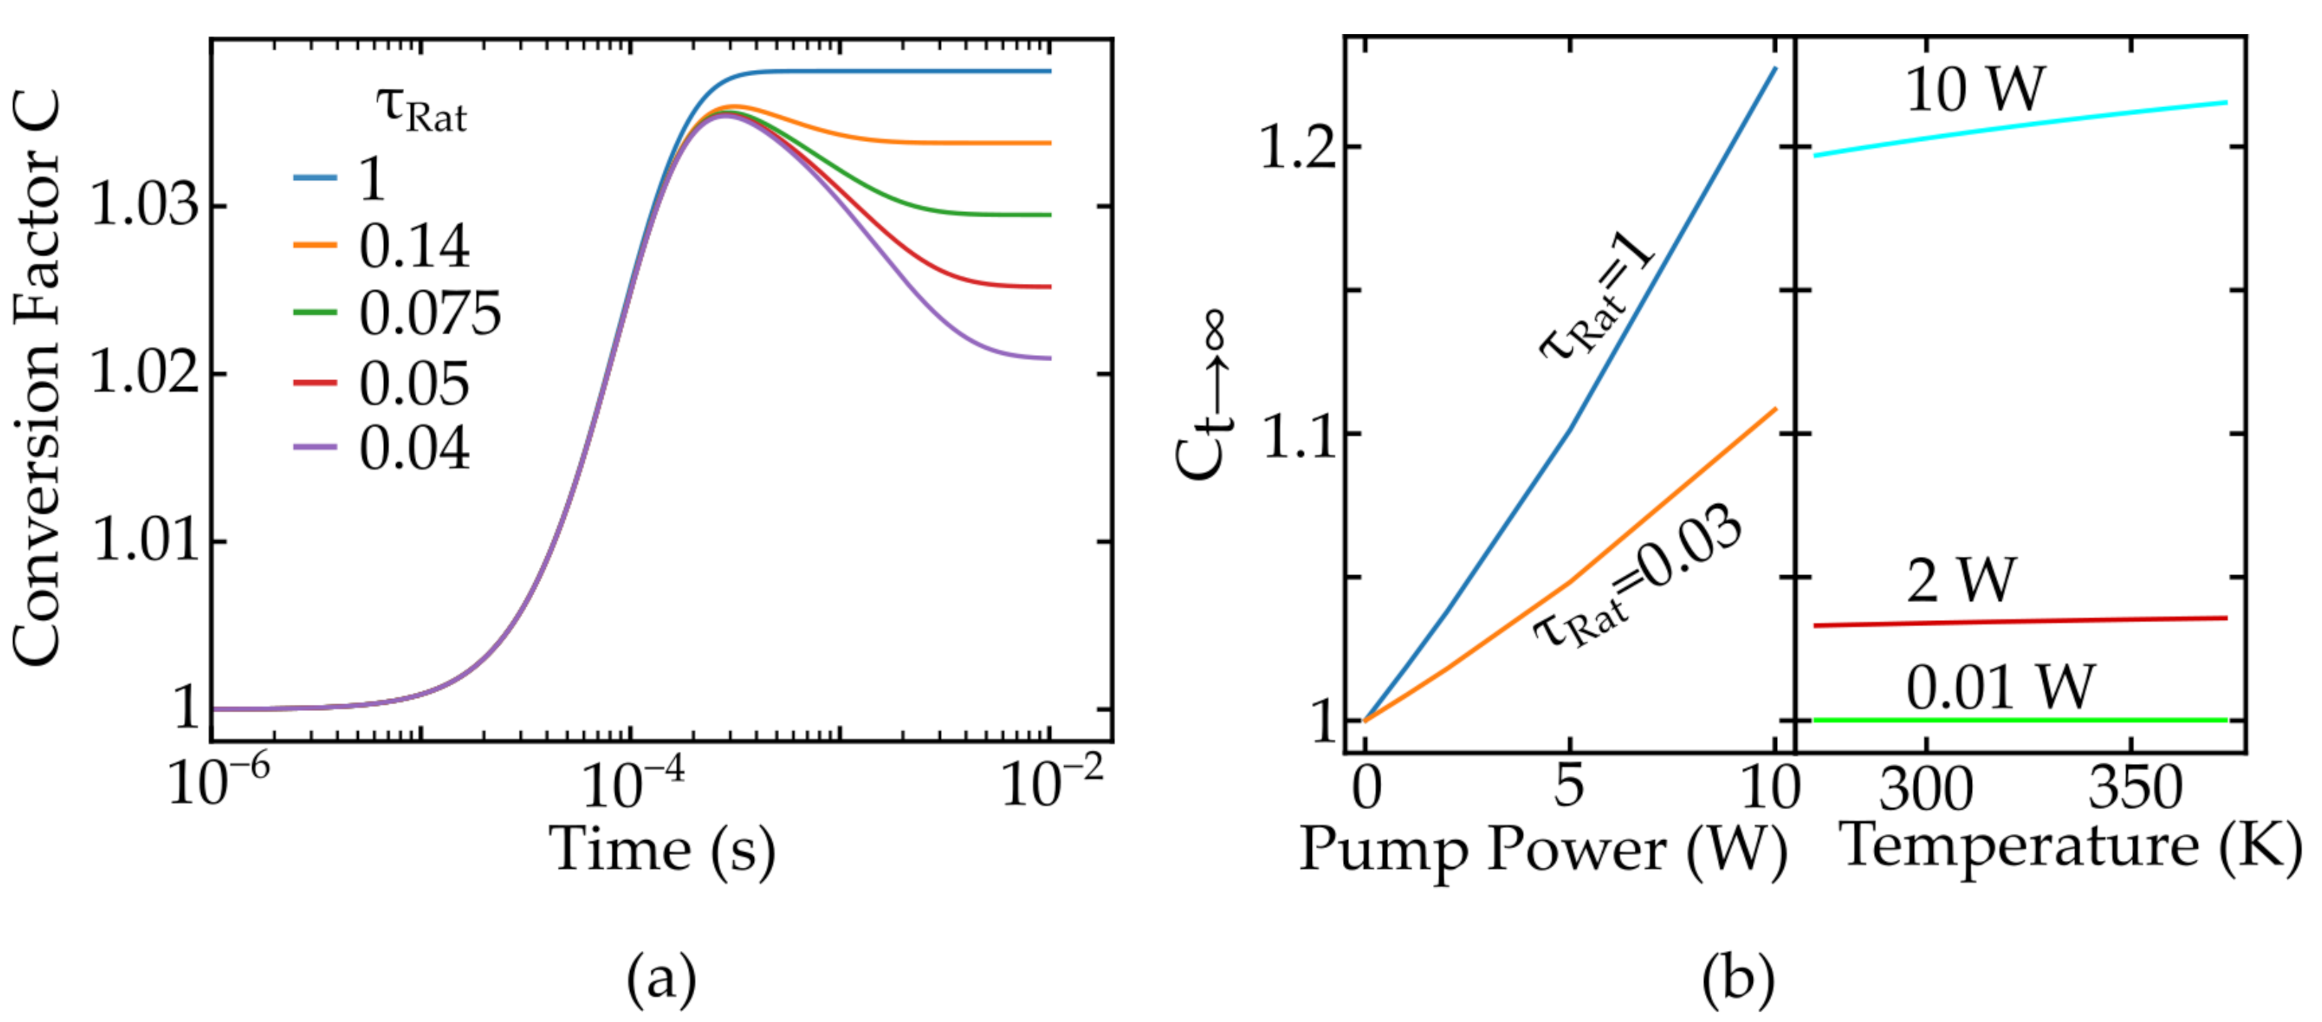
The first step is to measure the lifetimes of the lower levels, giving access to the ratio
of lifetimes of the lower energy levels. In
Figure 7a, the conversion factor is again given for different values of
, with again one value fixed to 58
s. The temporal evolution is explained by the different onsets of the steady state regime combined with varying absorption strengths of the emission lines causing local extreme values. Once the material is identified, the main parameters that are varied during the measurements are the pump power and the temperature of the surrounding media. The pump power is used to improve the signal-to-noise ratio, and the temperature needs to be included because reabsorption also depends on temperature via the Stark level population, as seen in Equation (
4). The dependency of re-absorption on the temperature is especially important for the formalism, as it shifts the assumed single exponential Boltzmann dependency of the FIR on temperature given in Equation (
1).
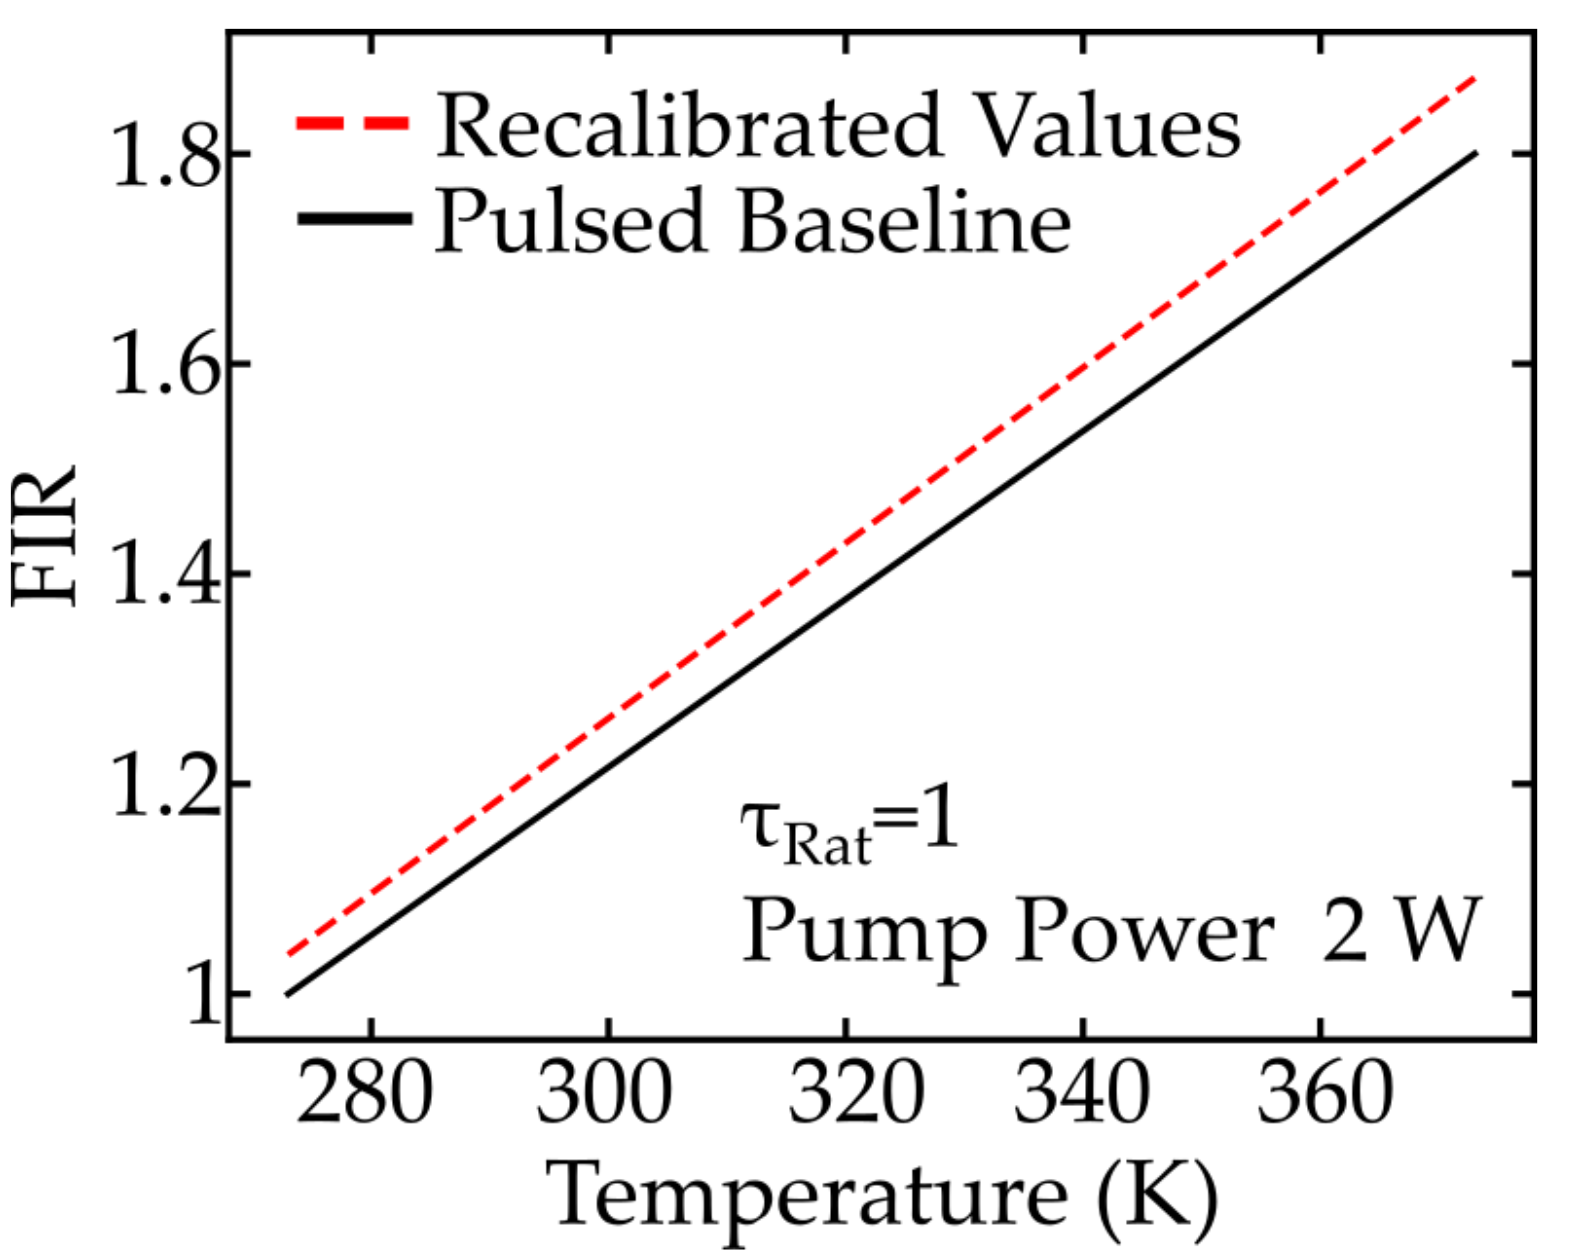
This shift factor is applied to an approximated FIR evolution for the Pr:YLF nanothermometers [
7] and the results are shown in
Figure 8. As depicted, the correction of FIR therefore helps to prevent a systematic overestimation of the measured temperature in cw-measurements.


