Article

High Performance Low-Temperature Solid Oxide Fuel Cells Based on Nanostructured Ceria-Based Electrolyte

Key Laboratory of Semiconductor Photovoltaic Technology of Inner Mongolia Autonomous Region, School of Physical Science and Technology, Inner Mongolia University, 235 West Daxue Street, Hohhot 010021, China
*
Author to whom correspondence should be addressed.
Nanomaterials 2021, 11(9), 2231; https://doi.org/10.3390/nano11092231
Submission received: 17 July 2021 / Revised: 20 August 2021 / Accepted: 21 August 2021 / Published: 29 August 2021
(This article belongs to the Special Issue Advanced Fuel Cells and Solid Batteries)

Abstract

:
Ceria based electrolyte materials have shown potential application in low temperature solid oxide fuel cells (LT-SOFCs). In this paper, Sm3+ and Nd3+ co-doped CeO2 (SNDC) and pure CeO2 are synthesized via glycine-nitrate process (GNP) and the electro-chemical properties of the nanocrystalline structure electrolyte are investigated using complementary techniques. The result shows that Sm3+ and Nd3+ have been successfully doped into CeO2 lattice, and has the same cubic fluorite structure before, and after, doping. Sm3+ and Nd3+ co-doped causes the lattice distortion of CeO2 and generates more oxygen vacancies, which results in high ionic conductivity. The fuel cells with the nanocrystalline structure SNDC and CeO2 electrolytes have exhibited excellent electrochemical performances. At 450, 500 and 550 °C, the fuel cell for SNDC can achieve an extraordinary peak power densities of 406.25, 634.38, and 1070.31 mW·cm−2, which is, on average, about 1.26 times higher than those (309.38, 562.50 and 804.69 mW·cm−2) for pure CeO2 electrolyte. The outstanding performance of SNDC cell is closely related to the high ionic conductivity of SNDC electrolyte. Moreover, the encouraging findings suggest that the SNDC can be as potential candidate in LT-SOFCs application.

1. Introduction

Solid oxide fuel cells (SOFCs), as a kind of clean energy device which can directly convert chemical energy into electric energy, have attracted wide concern [1,2,3]. Generally, conventional SOFCs require high working temperature over 800 °C, which not only narrows the selection range of electrolyte materials, but also limits the practical applications of cells. Therefore, it is necessary to lower the traditional operating temperature to the range of low temperature (400–600 °C). Currently, a great deal of effort has been focused on the research of LT-SOFCs. One of the key challenges in developing LT-SOFCs is to seek electrolyte materials with high ionic conductivity as alternatives of traditional yttrium-stabilized zirconium (YSZ) electrolyte. Extensive attempts have been devoted to obtaining highly ionic conductors by exploring the new electrolyte materials or optimizing the existing ones.
In recent years, cerium-based oxide (CeO2) has attracted extensive interests as the electrolyte in the fields of fuel cell due to the characteristic to store and release oxygen via facile Ce4+/Ce3+ redox cycles [4,5,6]. However, pure CeO2 has poor thermal stability and can be easily sintered at high temperature, which causes a rapid decrease in its oxygen storage/release capacity and catalytic activity [7,8]. In addition, pure CeO2 itself is an insulator, its ionic conductivity is very low (10−5 S·cm−1) [9]. One approach to overcome this limitation is to use the doping with lower valence metal cations, especially for some trivalent rare earth (RE) cations. The doping of RE cations can lead to the ceria lattice disorder and create stress in the ceria lattice, which could increase oxygen mobility from ceria lattice to its surface, and decrease the activation energy of oxygen vacancy formation because of the charge neutrality and nonstoichiometry compensation [10]. Therefore, it is expected that the oxygen ionic conductivity can dramatic rise due to the increase in the oxygen vacancy concentration causing by the RE doping. For example, the conductivity of Sm-doped ceria (Ce0.8Sm0.2O1.9, SDC) is 0.0114 S·cm−1 at 600 °C [11], while Gd-doped ceria (Ce0.9Gd0.1O1.95, GDC) obtains a conductivity of 0.019 S·cm−1 at 600 °C [12]. The Pr-doped CeO2 can improve the ionic conductivity by 1–3 orders of magnitude [13]. It was found that oxygen vacancies can also be promoted in the ceria lattice by other aliovalent doping of lower valence cations Nd3+, Ga3+ or Ca2+ [14]. Another promising approach is co-doped or multiple ion doping route, i.e., ceria doped with two or more aliovalent cation, which has been found to show higher ionic conductivity than single coped ceria. Banerjee et.al. [15] reported that Ca and Sm co-doped ceria displayed an amazing ionic conductivity of 0.122 S·cm−1 at 700 °C. Sr and Tm co-doped ceria designed by Zhu produced the ionic conductivity of 0.13 S·cm−1 at 550 °C [16]. Fan et.al. [13] developed the SDC with Nd3+ and Pr3+ dopants and the ionic conductivity of the doped ceria reached 0.125 S·cm−1 at 600 °C. Aliye Arabacı et al. [17] studied the performance of Gd3+ and Nd3+ co-doped CeO2 electrolyte (GNDC) materials, and found that the GNDC ionic conductivity was significantly improved compared with undoped ceria. Shobit Omar et al. [18,19] found the ionic conductivity of Sm3+ and Nd3+ co-doped ceria (SNDC) to be 30% higher that of GDC at 550 °C. These results demonstrate that double or co-doping is a successful strategy and can greatly promote the ionic conductivity of ceria-based electrolytes.
In addition, the nanotechnology approach is also very effective in enhancing the ionic conductivity of ceria-based oxides. And it has aroused extensive interests of scientist community in gaining good ionic conductivity. Recently, nanocrystalline ceria alone have been introduced as the electrolyte for advance LT-SOFCs. Using nanocrystalline electrolytes, the ionic conductivity can be further improved. Takamura [20] prepared the CeO2-based nanoparticles and acquired the conductivity of 0.003 S·cm−1 at the low temperature (300 °C). Chen et al. [21] reported that the nanocrystalline GDC electrolyte generated a remarkable power out of 591.8 mWcm−2 with extraordinary ionic conductivity of 0.37 S·cm−1 at 550 °C. The out performance is more than 3 times higher than that of traditional high-temperature sintered GDC electrolyte. The nanocrystalline electrolyte has presented unexceptionable properties as compared to the conventional electrolyte, which revealed that the interface/surface conduction of nanocrystalline GDC electrolyte was critical in improving ionic conductivity.
Given that the advantages of co-doped strategy and nanocrystalline electrolyte, in this work, we synthesized a Sm0.075Nd0.075Ce0.85O2-δ (SNDC) material with better performance than GDC via Sm3+ and Nd3+ co-doped ceria strategy, and further fabricated it into the nanocrystalline SNDC electrolyte. Various experimental characterizations were carried out to investigate the phase structure, microstructure, electrical and electrochemical properties, as well as fuel cell performances of the nanocrystalline SNDC and pure CeO2 electrolytes. The surface properties of the materials were studied to understand its conduction behavior. Remarkably, the Sm3+ and Nd3+ co-doped ceria exhibited high ionic conductivity and displayed excellent fuel cell performance of 1070.31 mW·cm−2 at 550 °C. Here the mechanisms on the greatly enhanced electrical property is also discussed.

2. Experimental

2.1. Fabrication of Materials

Sm3+ and Nd3+ co-doped CeO2 (Sm0.075Nd0.075Ce0.885O2-δ, SNDC) and pure CeO2 powders were prepared by glycine-nitrate method. Stoichiometric amounts of Ce (NO3)3·6H2O (≥99%), Sm2O3 (99.9%), Nd2O3 (99.9%), C2H5NO2 (99.5~100.5%), HNO3 (65~68%) were used as original materials. The corresponding mass of Sm2O3 and Nd2O3 were weighed and dissolved completely in an appropriate amount of concentrated nitric acid to form nitrate solution, respectively. Further, Ce (NO3)3·6H2O was dissolved in distilled water. Then, they were mixed together to obtain a mixed solution, and an appropriate amount of glycine (C2H5NO2) was added to the solution at the ratio of glycine to metal cation was 1.2:1. The mixed solution was heated and stirred slowly in a constant temperature magnetic stirrer until it formed a glutinous colloid and finally boiled and spontaneously ignited, resulting in a fluffy yellowish powder. The precursor powders were calcined at 800 °C for 2 h to remove the residual organic matter in the sample, and the cubic fluorite structure SNDC powder sample was obtained. CeO2 powders were also prepared by the similar process.

2.2. Fabrication of Fuel Cells

The two types of fuel cells were prepared with the nanocrystalline structure SNDC and CeO2 electrolytes, respectively. Foam-Ni-NCAL was used as the electrode layer, and SNDC or CeO2 powders was used as electrolyte layer. The foam-Ni-NCAL electrode layer was prepared using commercial Ni0.8Co0.15Al0.05LiO2-δ (NCAL) oxide powder (Tianjin Bamo Science and Technology Joint Stock Limited, Tianjin, China) and nickel foam (Ni-foam). The Ni-foam was first made into a round shape with a diameter of 13 mm using a punch. The NCAL powders, terpineol and alcohol were mixed into slurry, and the slurry was coated onto the Ni-foam and dried at 120 °C to form the electrode layer (foam-Ni-NCAL) of the cell. Then a piece of the foam-Ni-NCAL electrode was placed at the bottom of the mold, then 0.32 g SNDC electrolyte powder was weighed and spread evenly as the middle layer, and then another foam-Ni-NCAL electrode was placed on the SNDC powder. Finally, the three layers with electrodes and electrolyte were pressed under 450 MPa into a single cell constructed in a symmetrical configuration of foam-Ni-NCAL/SNDC/NCAL-Ni-foam. The effective electrode area of the cell was 0.64 cm2. The thickness and diameter of the cell are 2 mm and 13 mm, respectively. Hydrogen and air were passed into the electrode for measurement as fuel and oxidant, respectively. The foam-Ni-NCAL/CeO2/NCAL-Ni-foam cell with the nanocrystalline structure CeO2 electrolyte was also made by the same method, as described above.

2.3. Characterizations

The phase structures of CeO2 and SNDC samples were determined through a powder X-ray diffraction (XRD, MiniFlex 600, Rigaku Corporation, Rigaku, Japan) at room temperature and 2θ varying from 20° to 80° by steps of 10°. Raman spectra analysis was performed by using a Horiba Raman scope (Raman, Horiba Jobin Yvon U1000, HORIBA Scientific, Paris, France) equipped with an Olympus LMPlan optical microscope and a charge-coupled device (CCD) camera. The microstructural characterization was carried out using scanning electron microscopy (SEM, Phenom Pro, Phenom-World B.V., Eindhoven, Netherlands), High resolution transmission Electron Microscope (HR-TEM, Titan G2 60-300, FEI, Hillsboro, OR, USA) and Energy dispersive X-ray analysis (EDS, X-MaxN150, Oxford Instruments, Oxford, UK). The oxidation states and surface chemical properties of CeO2 and SNDC samples were studied by X-ray photoelectron spectroscopy (XPS, ESCALAB-250Xi, Thermo-fisher Scientific Co., Thermo-fisher Scientific Co., Waltham, MA, USA). The current–voltage performances of the symmetrical cells were tested at temperatures from 450 to 550 °C using an electronic load (ITECH DC ELECTRONIC LOAD, IT8511, ITECH Electrical Co., Ltd., Nanjing, China), H2 and air were supplied as the fuel and the oxidant, respectively. The flow rates of both H2 and air were 120 mL/min. The electrochemical impedance spectra (EIS) measurements were determined on the symmetric cells under open-circuit conditions using Zahner Zennium electrochemical workstation (EIS, Thales Z2.29 USB, Zahner Zennium, Germany Zahner electrochemistry Company, Kronach, Germany). The frequency range of measured EIS of the cells was 0.1–106 Hz with an AC amplitude of 5 mV.

3. Results and Discussion
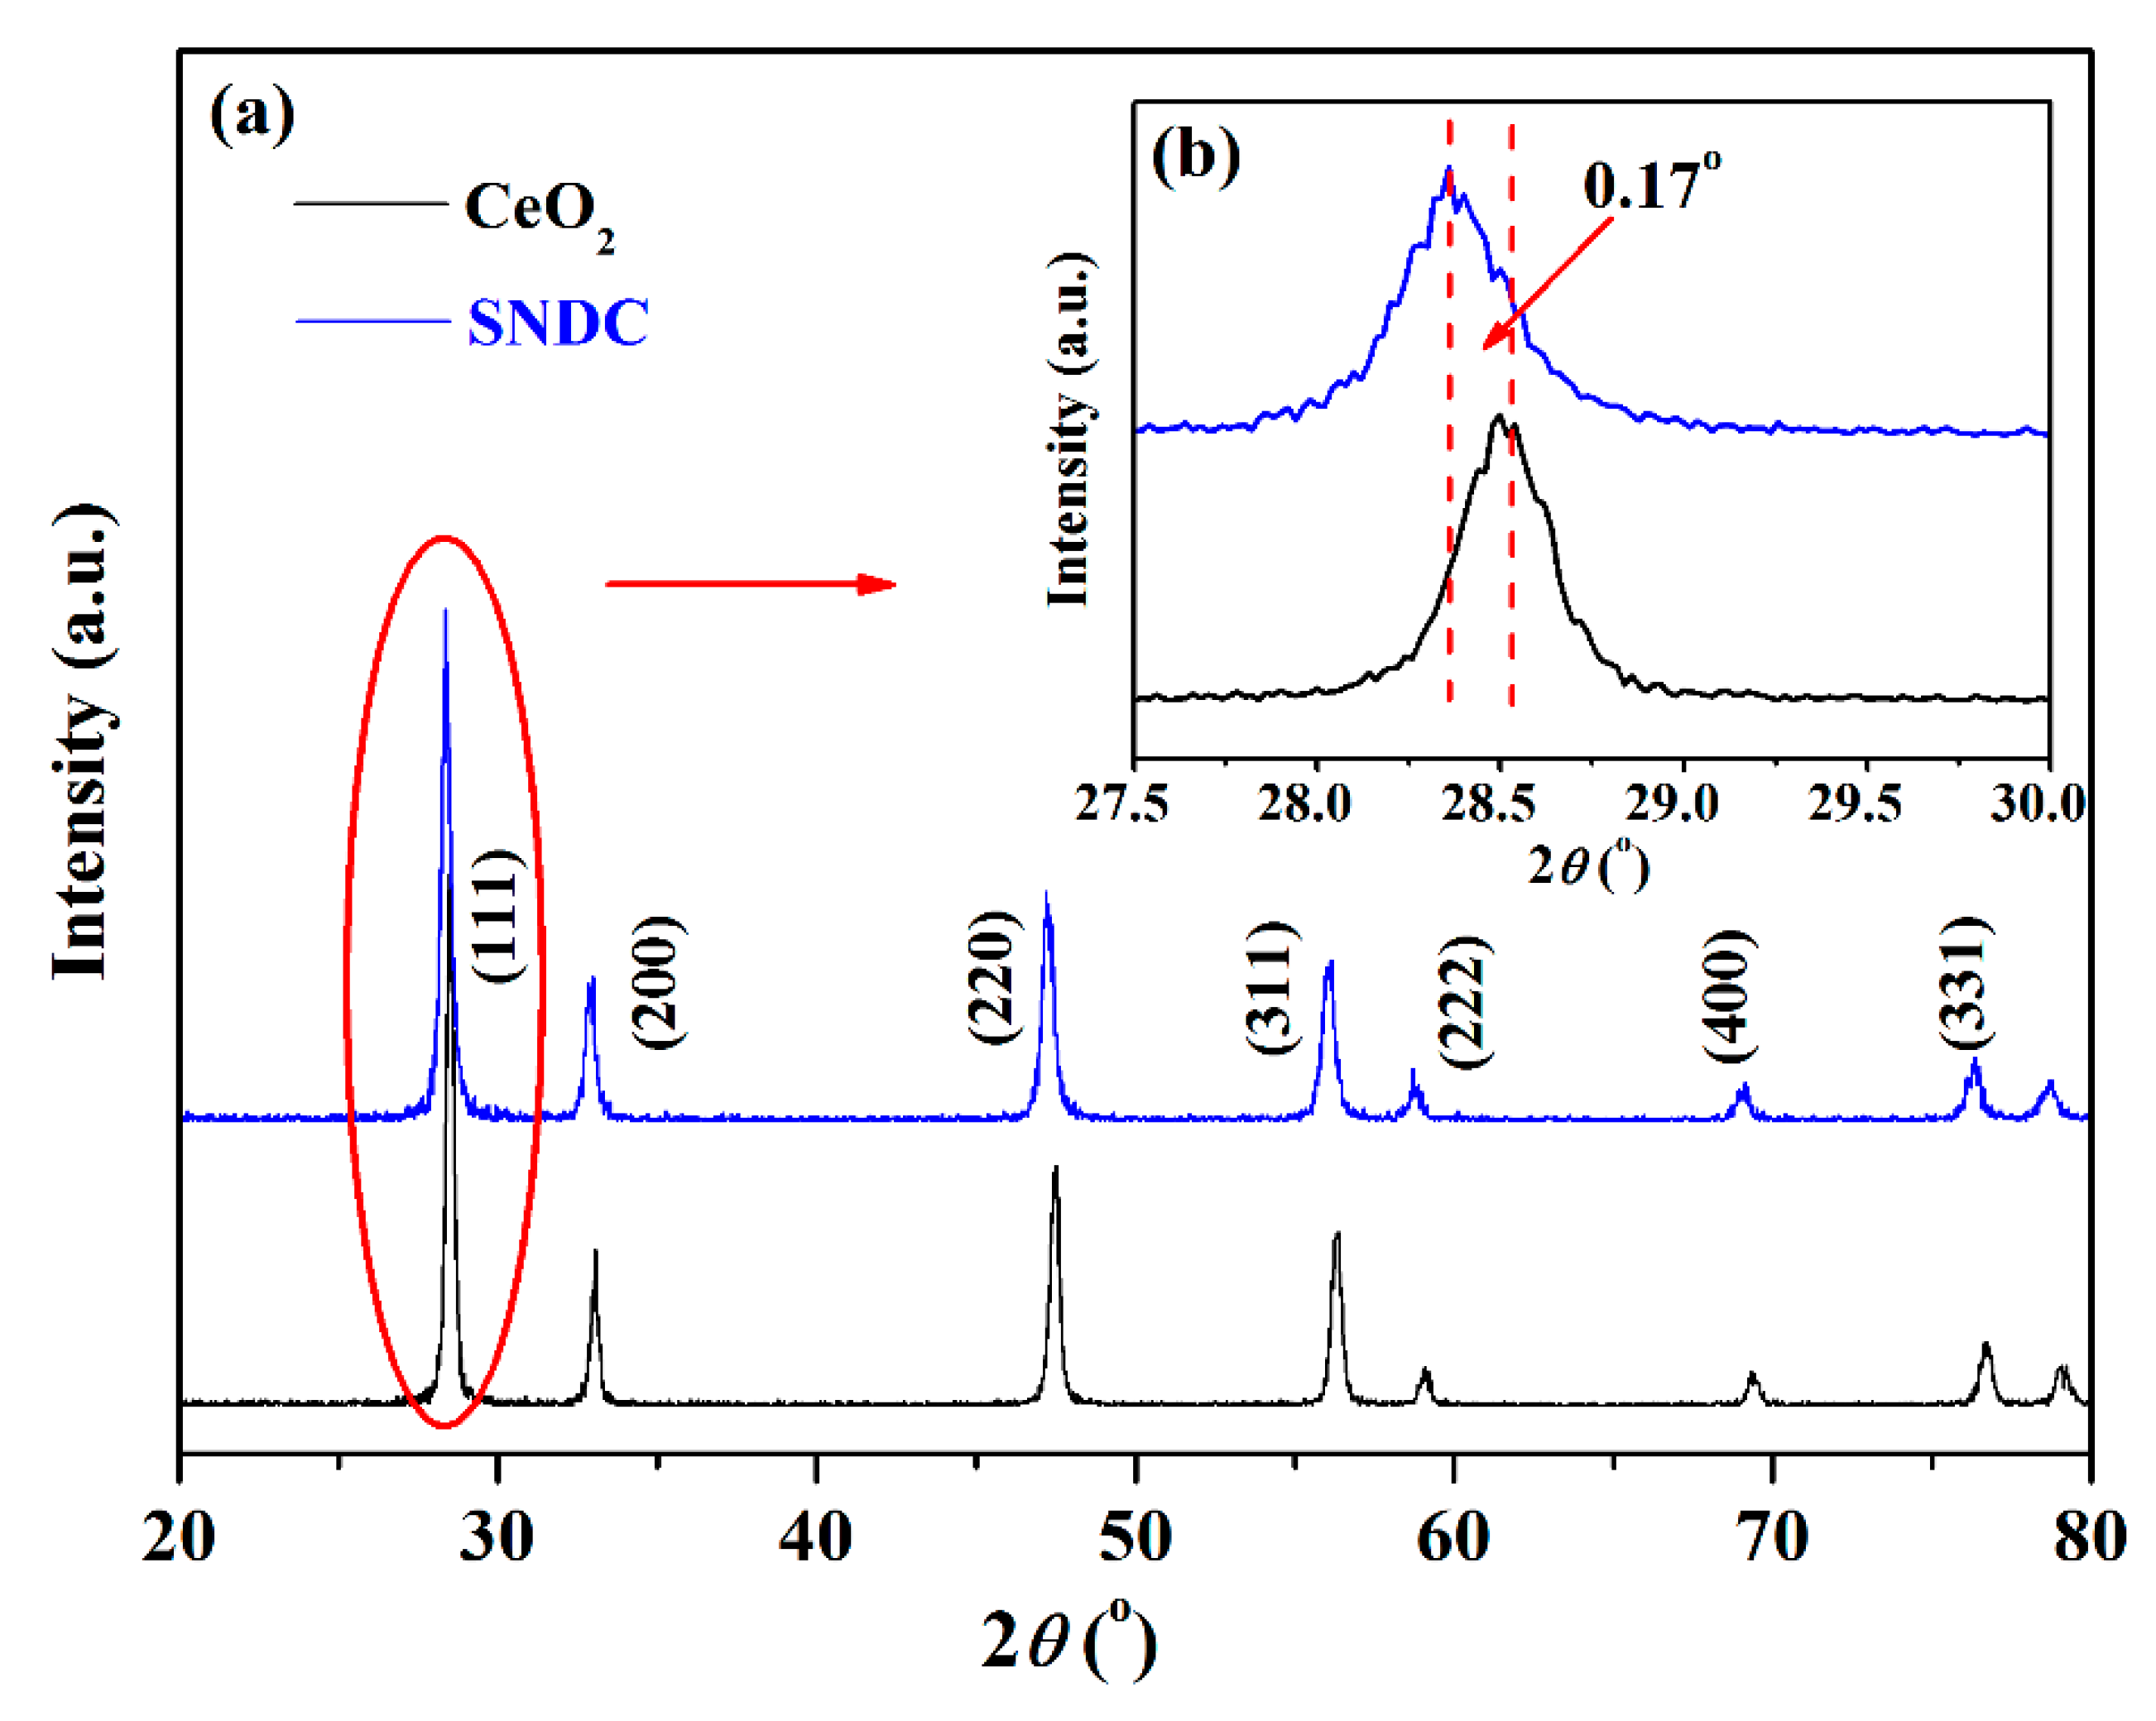
3.1. Results of XRD

The phase structures of the CeO2 and SNDC materials sintered at 800 °C for 2 h were analyzed by X-ray diffraction experiments. The testing range of 2θ varied from 20° to 80°. As shown in Figure 1, the diffraction peaks located at 2θ = 28.5°, 33.1°, 47.4°, 56.3°, 59.1°, 69.4° and 76.6°, can be assigned to the (111), (200), (220), (311), (222), (400) and (331) indexed characteristic peaks with cubic fluorite structure of CeO2 according to PDF#43-1002 [13]. The Co-doped SNDC electrolyte materials still have the same phase structure as CeO2, both of which belong to cubic fluorite phase, indicating that Sm3+ and Nd3+ have successfully replaced the position of Ce4+ in the lattice and traces of impurity phase are not observed. Moreover, the peak position of SNDC is slightly shifted to lower angle (Figure 1b). According to the Bragg formula, the crystal lattice becomes larger after doping, which is mainly attributed to the lattice expansion caused by the bigger ionic radius of Sm3+ (1.079 Å) and Nd3+ (1.109 Å) substitutions at Ce4+ (0.97 Å) sites [11,22].

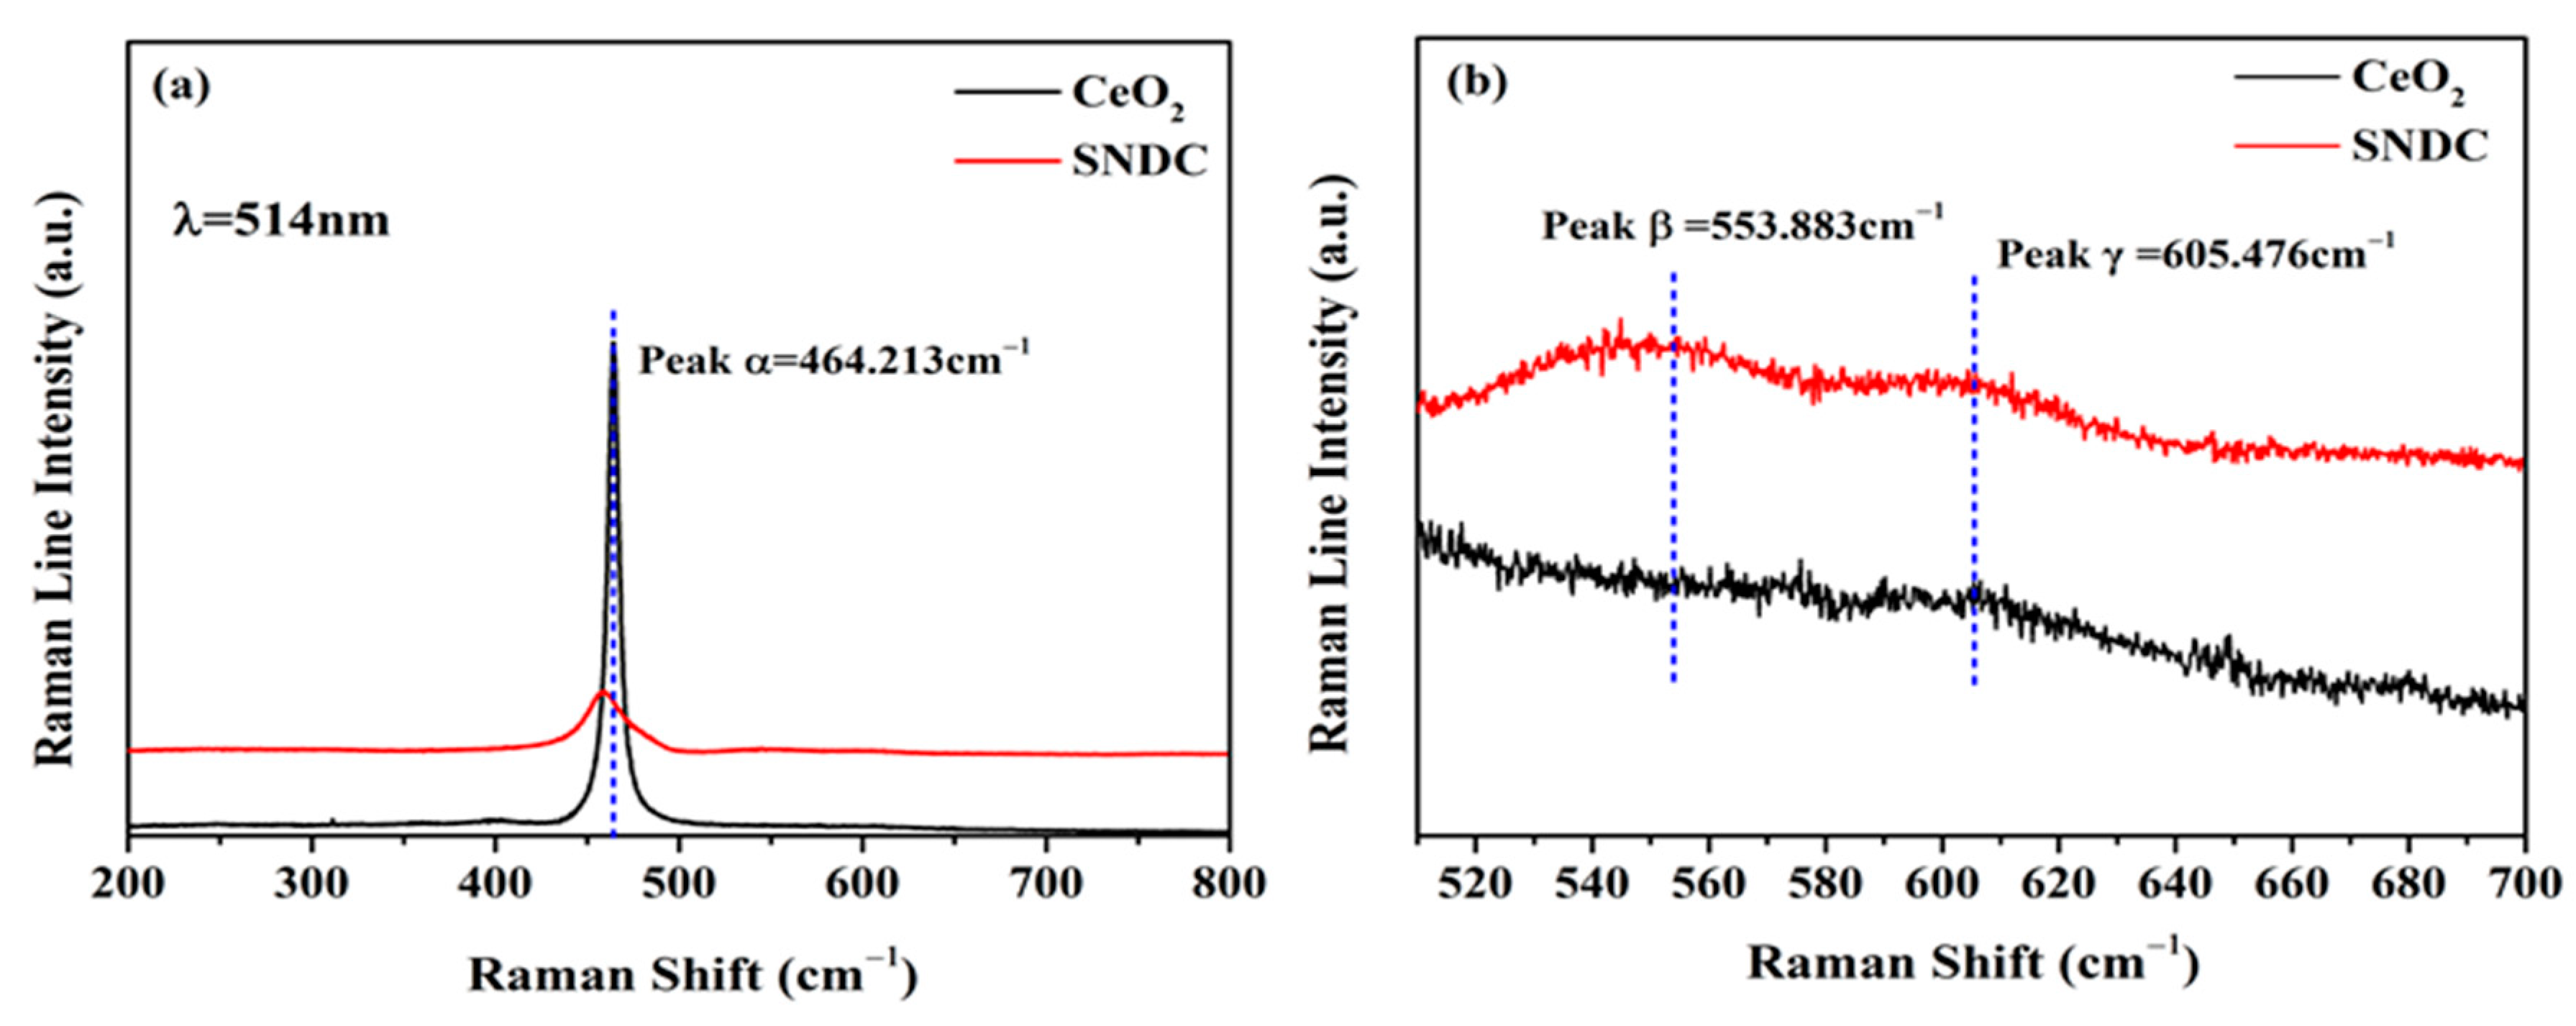
3.2. Raman Spectra Analysis

Raman spectroscopy is used to reveal deeply the presence of oxygen vacancies caused by the change in the structure of the lattice chemical expansion owing to producing stresses of constrictions by the dopant cation. Figure 2a shows the Raman spectra of the pure CeO2 and SNDC samples from 200–800 cm−1. The results of the Raman spectra are obtained and analyzed by using the excitation laser line of 514 nm. It is known that the CeO2 has a cubic fluorite structure, and belongs to the Fm-3 m space group. As depicted in Figure 2a, pure CeO2 has only a single allowed Raman mode and shows a strong band at about 464.2 cm−1 (Peak α), which has F2g symmetry and can be assigned to a symmetric breathing mode of the oxygen atoms around Ce-O8 vibration unit. In comparison to pure CeO2, the Sm3+ and Nd3+ Co-doped sample (SNDC) has shown a small systematic shift of the F2g mode towards lower frequency, and the F2g peak becomes wider and its intensity also becomes weaker. As reported, the shift of the F2g mode maybe result from the expansion of ceria lattice and the increase of oxygen vacancies, while the shape change in the Raman line is mainly related to the lattice distortion of CeO2 induced by the substitution of Sm3+ and Nd3+ ions [11,23,24,25]. In addition, in the Sm3+ and Nd3+ co-doped ceria sample, two additional weak second order peaks at about 553.9 cm−1 (Peak β) and 605.5 cm−1 (Peak γ) are detected (Figure 2b), which can be attributed to defect spaces owing to extrinsic oxygen vacancies or structural defects caused by Sm3+ and Nd3+ dopants in ceria lattice [26,27].

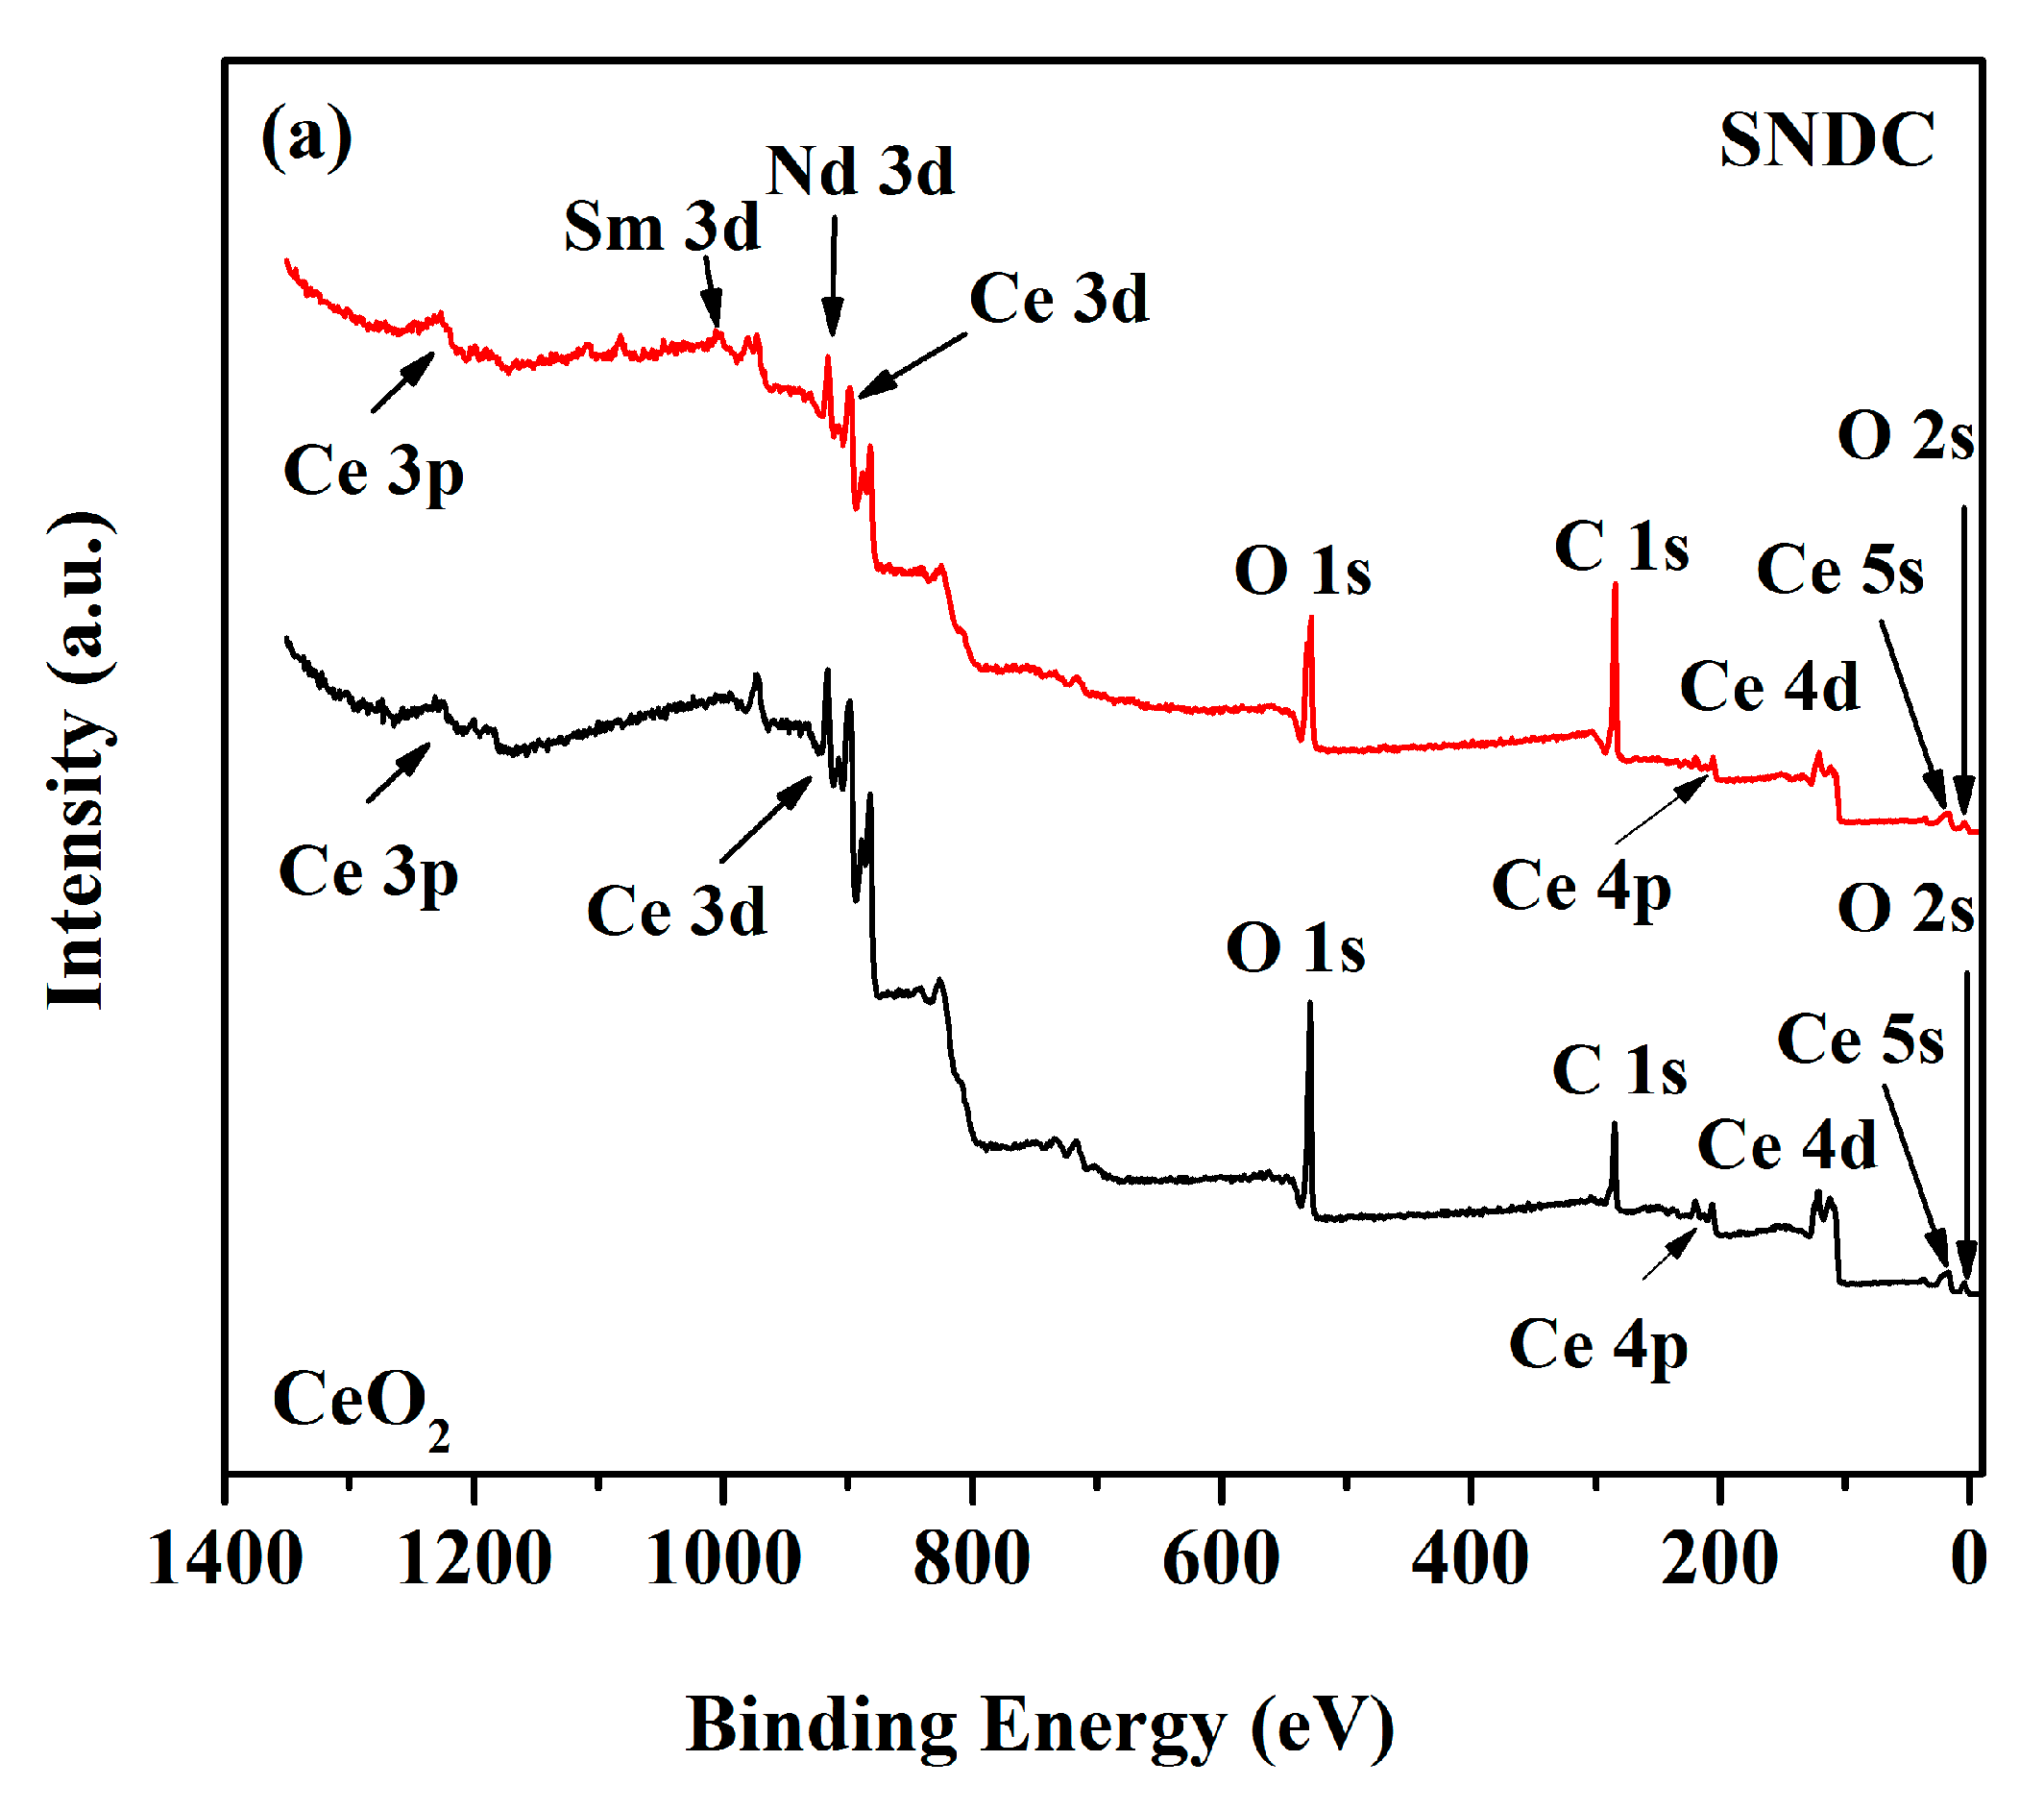
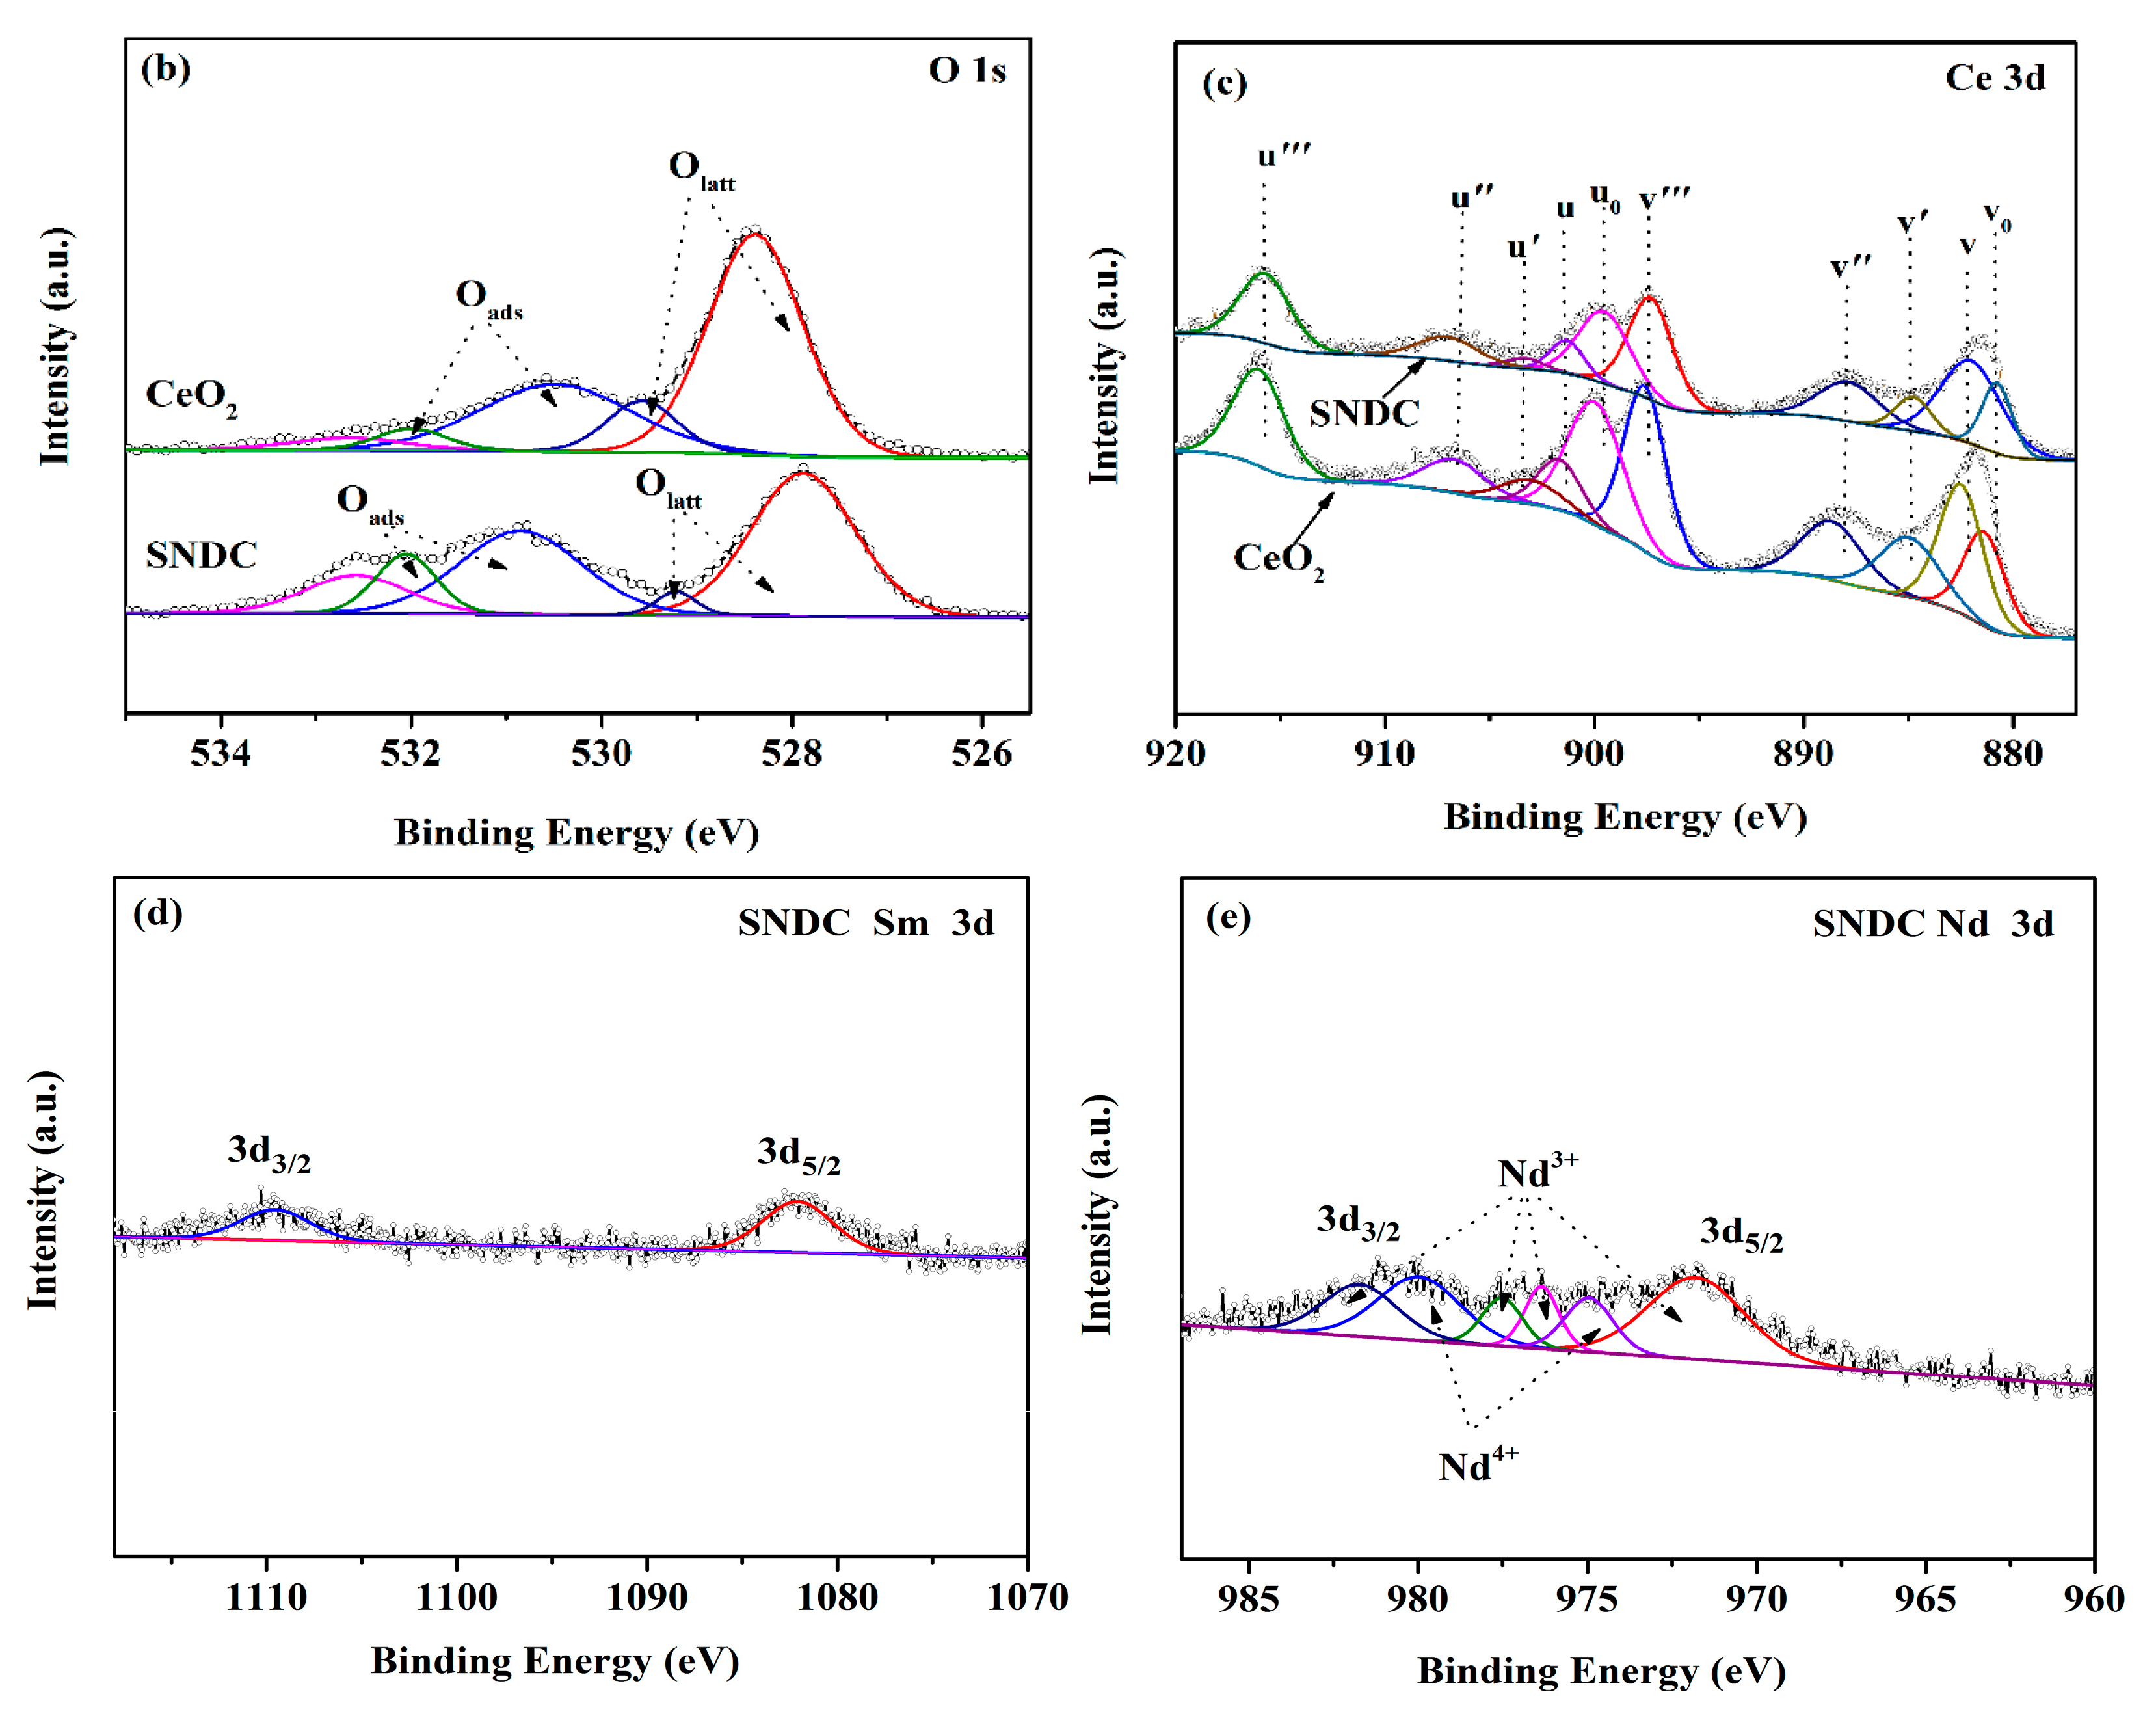
3.3. X-ray Photoelectron Spectroscopy (XPS) Analysis

XPS is employed to analyze the element valence states so as to study the surface chemical properties of CeO2 and SNDC samples. Figure 3a shows the XPS full spectra of samples, and it is clear that there are Ce, Sm, Nd, O, and C characteristics in SNDC samples. In order to determine the chemical state, the core-level spectra of O 1s, Sm 3d, Nd 3d and Ce 3d are discussed in detail, and the multi-component XPS correlation peaks are analyzed by Shirley-type background subtraction method. The three peaks of oxygen are related to the divergence of chemical environment in the sample, which are divided into lattice oxygen, defect oxygen and oxygen vacancy [28]. The O 1s XPS core-level spectra of the CeO2 and SNDC samples (Figure 3b) shows two types of different oxygen species features, including the chemically adsorbed oxygen species (Oads) and the lattice oxygen (Olatt) [29]. In general, the peak at 527.2–529.4 eV are attributed to Olatt (O2−), while the signal of the binding energy at 529.5–532.1 eV corresponds to the oxide defects or the surface oxygen species (Oads) adsorbed on the oxygen vacancies (i.e., O, OH, and CO3 2−) [30]. Usually, once the doped Sm3+ and Nd3+ are incorporated into the ceria lattice, the related Ce−O−Sm or Ce−O−Nd bonds are formed, which makes the migration process from the inner lattice oxygen to the surface lattice oxygen easier because of a slight change in electro-negativity of the guest and host ions [11,31]. In Sm3+ and Nd3+ co-doped CeO2, it is interesting to observe that the Oads/Olatt value in the SNDC sample is 0.84, which is greater than the value of un-doped CeO2 (0.32). This indicates that the lattice oxygen in the double-doped sample is significantly reduced and the oxygen ion transfer number is increased. Figure 3c shows the Ce 3d core-level spectra with Ce 3d5/2 and Ce 3d3/2 states of SNDC and pure CeO2 samples. The spectra deconvolution reveals that the presences of the peaks mainly result from Ce 3d5/2 and Ce 3d3/2 contributions, and the “v” and “u” peaks correspond to Ce 3d5/2 and Ce 3d3/2 states, respectively [16,32,33]. Moreover, the peaks labelled with v, v″, v″′, and u, u″, u″′ are due to cerium ions in the 4+ state, while v0, v′, and u0, u′ are assigned to 3+ ions [27,34], which clearly indicate the coexistence of Ce4+ and Ce3+ ions on the surface of the samples. It has been reported that the existence of Ce3+ is generally associated with the formation of oxygen vacancies and a higher Ce3+ concentration implies larger amounts of oxygen vacancies [35]. As shown in Figure 3c, the sum of the spectral peak areas related to the Ce3+ increases in SNDC compared with CeO2, implying that higher Ce3+ ion concentration can be obtained in SNDC sample [36], which facilitates the redox cycles between Ce3+ and Ce4+, and results in more oxygen vacancies on the surface. Figure 3d,e shows the Sm3d and Nd 3d XPS spectra of the as-prepared SNDC sample. In the case of Sm 3d spectra (Figure 3d), two single peaks are fitted with a pair of Sm 3d5/2 (located at 1109.62 eV) and Sm 3d3/2 (located at 1082.08 eV) spin-orbit coupling components by only considering the spin-orbit splitting. The XPS results for the Nd 3d spectra (Figure 3e) fitted into the distinguishable peaks show that the oxidation states of Nd in the compound are 3+ and 4+ states, and Nd3+ and Nd4+ coexist in the sample. More importantly, it clearly shows that the spectra peak area of Nd3+ is obviously larger than that of Nd4+. This suggests that the oxidation state of Nd3+ is dominant in the SNDC sample. As reported, with the increase of temperature, the high valence cation will be reduced to low valence cation, resulting in the formation of more oxygen vacancies [37,38]. This is very beneficial to the migration of oxygen ions and the improvement in ionic conductivity and electrochemical performance of SOFCs.

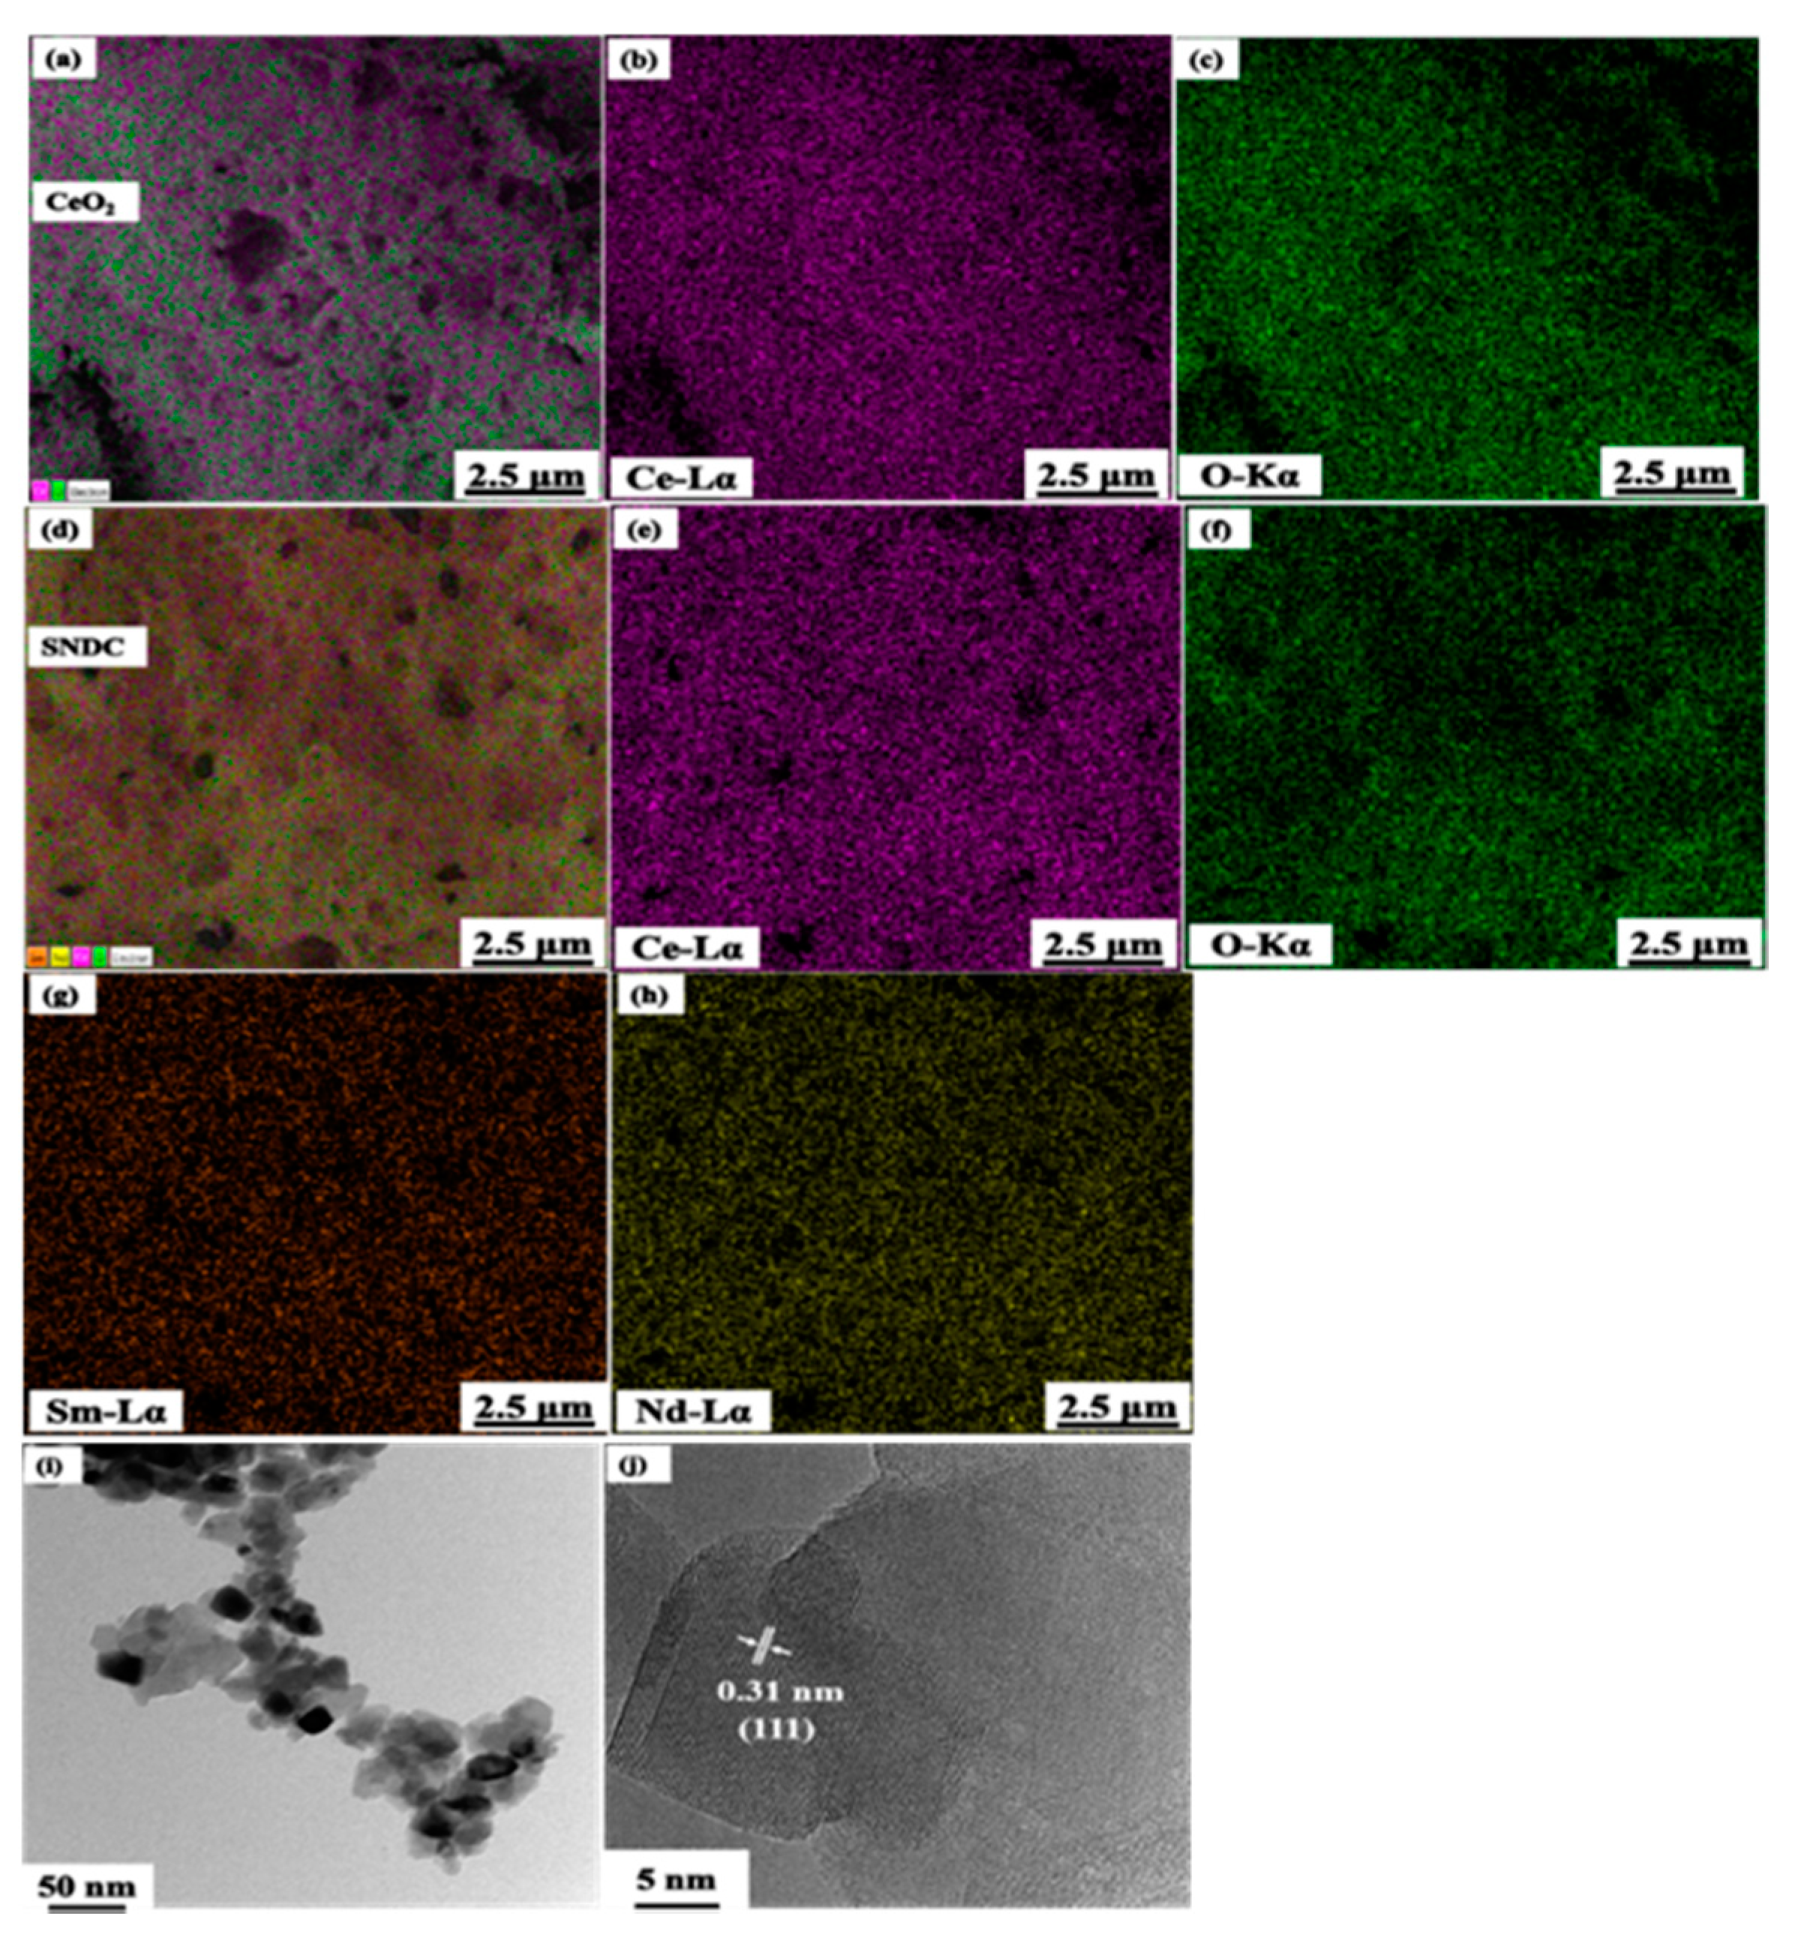
3.4. EDX and HR-TEM Analysis

The EDX element analysis of pure CeO2 and SNDC samples is presented in Figure 4a–h. A similar distribution of elements can be observed for the pure CeO2 (Figure 4a–c) and SNDC (Figure 4d–h). This demonstrates the homogeneous Sm3+ and Nd3+ ions distribution in the CeO2 lattice. This result provides good agreement with the XRD results of SNDC sample. It also confirms that the Sm3+ and Nd3+ ions have been successfully doped into the CeO2 lattice through co-doped approach, instead of forming second phases. Figure 4i shows the HR-TEM images of nanocrystalline SNDC powder prepared by the glycine-nitrate method. As shown, the SNDC powders are consisted of nano-sized particles and have some agglomeration. The sample exhibits large domains of SNDC, with a certain ordered framework, and non-uniform nanoparticles with a crystallite size ranging from 20 to 40 nm, interconnected to each other. Figure 4j shows the HR-TEM images at larger magnification of the raw nanocrystalline SNDC powder. It shows that the SNDC is highly crystalline and display an interplanar spacing of 0.31 nm, corresponding to the (111) lattice planes of SNDC.

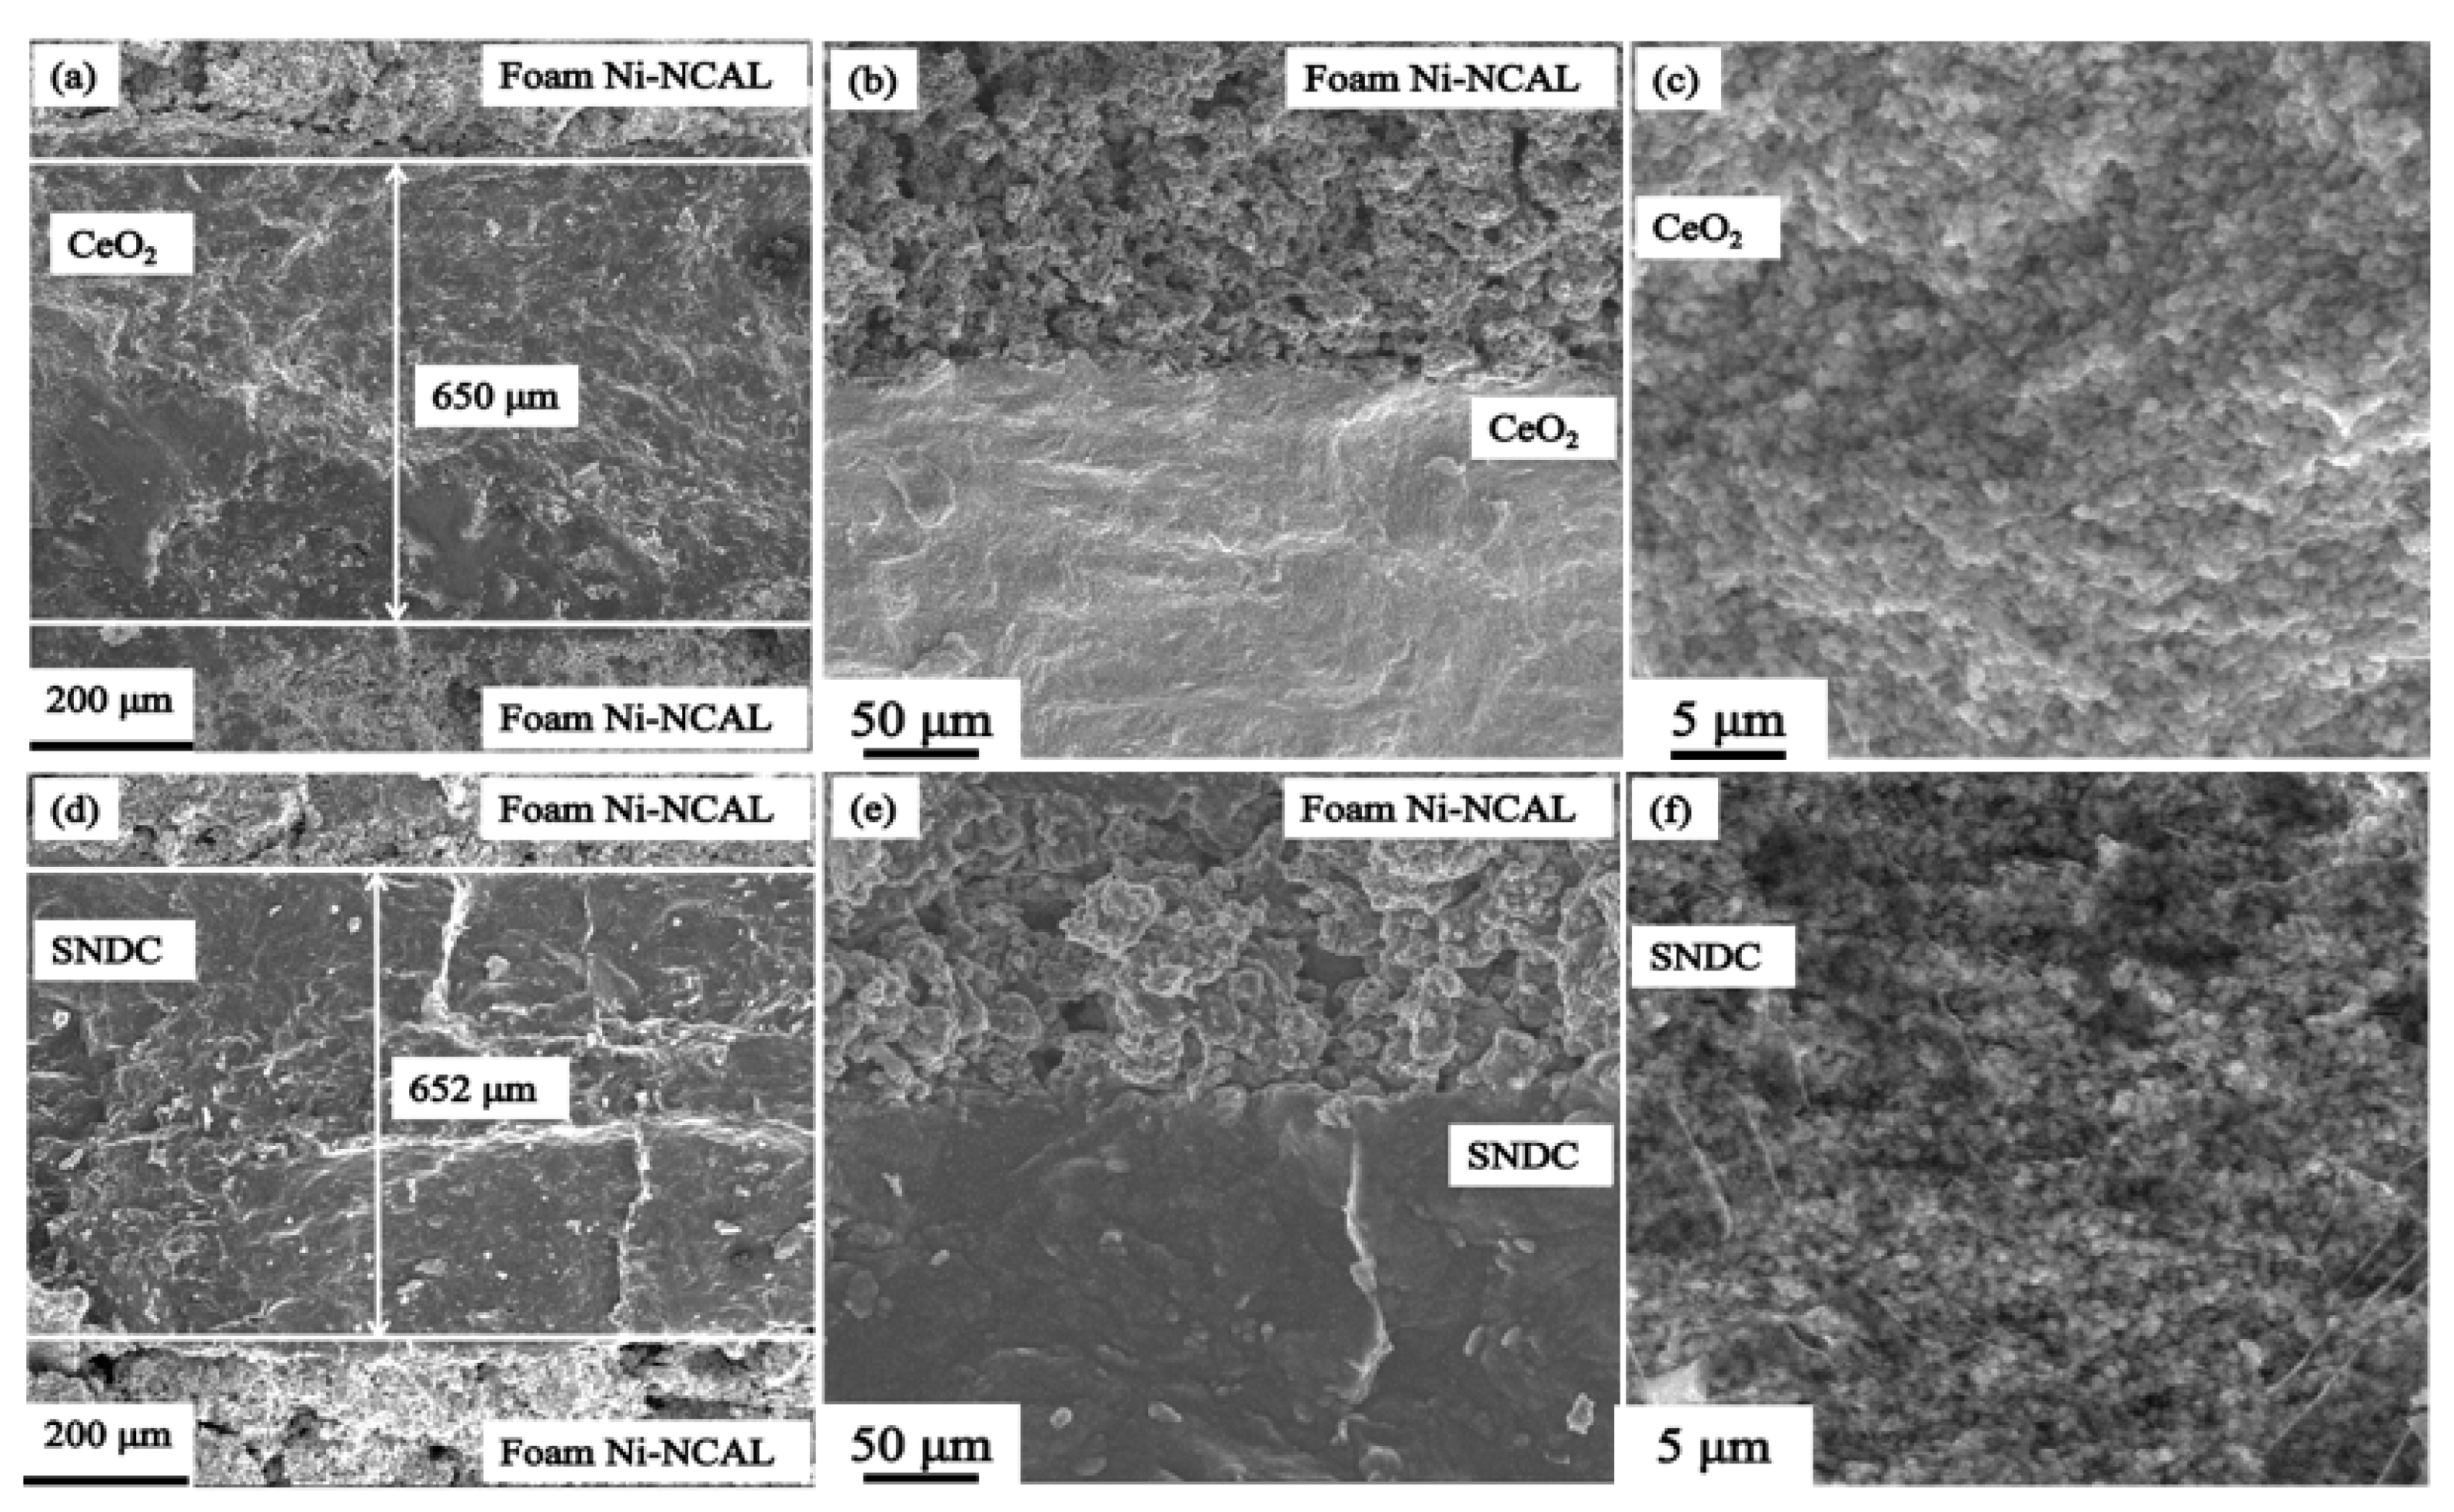
3.5. Fuel Cell Performance Analysis

Figure 5a,b shows I–V and I–P characteristics for single cells with nanocrystalline structure CeO2 and SNDC electrolytes and the corresponding simple schematic diagram of the cell. As reported previously, the open circuit voltages (OCVs) of cells increase rapidly at the beginning of the test and then stays above 1 V, which is closed to the value of SOFC reported in the literature [21], indicating that the nanoelectrolytes are effective at separating H2 and air from each side of the cell. The achieved OCVs of the cell for the nanocrystalline structure SNDC electrolyte (Figure 5a) reach the 1.154, 1.148 and 1.141 V at 450, 500 and 550 °C, respectively, which are more than those (1.14, 1.133 and 1.078 V at corresponding temperatures) of cell with the nanocrystalline structure CeO2 electrolyte (Figure 5b). The higher OCVs indicated that the nanocrystalline structure CeO2 and SNDC, as the electrolytes of cells, can prevent the ceria electronic current leakage and achieve better performance. Correspondingly, the peak power densities of reach 406.25, 634.38, and 1070.31 mW·cm−2 for the nanocrystalline SNDC, but those of the nanocrystalline CeO2 cell were 309.38, 562.50, and 804.69 mW·cm−2, respectively. The peak power densities are increased by an average of about 26% compared with those of CeO2 cell. The significant enhancement of the power density reflects higher ionic conductivity of the SNDC electrolyte and lower electrode polarization resistance.
In order to investigate the electrochemical mechanism in the cells, the SEM microstructure and EIS analysis were carried out. Figure 6 shows the cross-sectional SEM images of the two symmetrical cells with a foam Ni–NCAL/electrolyte/NCAL–Ni foam structure after the measurement. From the Figure 6, it can be observed the two cells have all similar microstructures. The symmetric foam Ni-NCAL electrodes show porous structure and closely combined with electrolytes (Figure 6b,e), while the nanocrystalline electrolytes have no obvious pores, and both pure CeO2 and SNDC electrolytes present approximately 650 μm thick (Figure 6a,d). From Figure 6c,f, the pure CeO2 and SNDC electrolytes display the nanocrystalline microstructures, and the nanocrystalline electrolyte particles are below 50 nm. However, the SNDC exhibits even smaller nanocrystalline particles. Therefore, the significant difference in electrochemical performance of the cells can be attributed to the change in ionic conductance caused by the lattice expansion after double-doping.
Figure 7a,b shows the impedance spectra of the cells with the nanocrystalline structure CeO2 and SNDC electrolytes under H2/air condition at 450–550 °C. The equivalent circuit obtained according to the impedance spectrum fitting is shown in the Figure 7c. The formula used for fitting is R0 (Q1R1) (Q2R2), where R0 is the overall ohmic resistance, R1 and R2 correspond to the high and low frequency resistance arcs from the electrode, respectively, and Q is a constant phase element. The high frequency (R1, Q1) arc is usually attributed to ion charge transfer process and the low frequency (R2, Q2) arc is commonly associated with oxygen dissociation and surface diffusion processes. The high-frequency intercept on the real axis represents the ohmic resistance (R0). The difference between the high- and low-frequency intercepts on the real axis is related to the electrode polarization resistance (Rp). It can be seen from Figure 7 that at 550 °C, the R0 value for the CeO2 cell was 0.12 Ω·cm2, and that for SNDC cell was 0.11 Ω·cm2, while the Rp value for the CeO2 cell was 0.55 Ω·cm2, and that for SNDC cell was 0.44 Ω·cm2. Obviously, compared with CeO2 cell, SNDC cell has smaller R0 and Rp values. In particular, the Rp value of SNDC cell is much lower than the Rp value of the CeO2 cell. Since the two cells adopt a foam Ni–NCAL/electrolyte/NCAL–Ni foam symmetrical structure and both use foam Ni–NCAL as the electrode, the intrinsic property of these electrodes should be the same. Moreover, the NCAL is an electron conductor, and the NCAL combined with the nickel foam has also high conductivity. Therefore, the R0 mainly originates from the electrolytes, and the differences between their Rp are most likely owing to the difference in the nanocrystalline electrolytes used. Combined with the results of the Raman Spectra and XPS analysis, it can be seen that the difference in Rp of the two electrolytes can be attributed to the different electrochemical performance in the three-phase interface caused by Sm3+ and Nd3+ dopants in ceria lattice. After double doping, the active site of the interface between electrolyte and electrode increases, and the three-phase interface increases, which eventually leads to the decrease of the Rp of the cell. In addition, as for SNDC, the ionic activity increases with the increase of test temperature, so the Rp shows a decreasing trend. The lower R0 in SNDC indicates that the SNDC electrolyte has higher ionic conductivity than that of the pure CeO2. In ceria-based electrolyte, the O2− transport relies on the charge transfer process during the redox process. The XPS analysis has shown that the Ce3+ ion concentration increases in SNDC. Therefore, at the surface of the SNDC particles, oxygen ion transfer can be facilitated by the electron exchange resulting from the redox between Ce3+/Ce4+. As reported, the oxygen reduction reaction (ORR) process was closely associated with the electrode polarization loss of LT-SOFCs [39]. In this study, the lithiated transition metal oxide (NCAL) was employed as symmetrical electrodes. The NCAL in SOFCs exhibits superior catalytic activity for ORR in cathode and hydrogen oxidation reaction (HOR) in anode [40]. The symmetrical NCAL electrodes can improve the anodic HOR process, while enhancing the cathodic ORR process, and can generate more active oxygen species (e.g., O2−), which accumulate at the triple-phase boundary. The higher O2− ionic conductivity in SNDC electrolyte promotes the transport of the active oxygen species (O2−) through the SNDC electrolyte. This reduces the electrode/electrolyte interfacial polarization loss, thus provides superior power out performance.

4. Conclusions

We have successfully prepared Sm3+ and Nd3+ co-doped CeO2 (SNDC) and pure CeO2 nanocrystalline electrolytes, and evaluated the chemical properties in low temperature solid oxide fuel cells. It has been found that the SNDC and CeO2 electrolytes exhibit the nanocrystalline microstructures with a size of below 50 nm. The coexistence of Ce4+ and Ce3+ ions is on the surface of samples, and the SNDC has higher Ce3+ concentration compared with the pure CeO2, implying higher oxygen vacancies and oxygen ionic conductivity in SNDC, which is also confirmed by Raman spectra analysis. The fuel cell based on the nanocrystalline SNDC electrolyte can achieve excellent electrochemical performance. The peak power density of SNDC cell reaches 1070.31 mW·cm−2 at 550 °C, which is about 33% higher than that (804.69 mW·cm−2) of CeO2. This is mainly attributed to the high ionic conductivity of SNDC caused by Co-doping. The fuel cell with the nanocrystalline SNDC electrolyte can obtain high power output performance, suggesting the promising potential applications for LT-SOFCs.

Author Contributions

J.L. participated in original draft preparation, the data measurement, writing—review and editing of the manuscript; C.Z. participated in the experimental plan, investigation, analysis, writing—review and editing of the manuscript; D.Z., X.J., Y.Z., J.Y., X.L. and M.Y. participated in the review and editing of the manuscript. All authors have read and agreed to the published version of the manuscript.

Funding

This work was financially supported by the National Natural Science Foundation of China (Nos. 62064010 and 51262020) and the Natural Science Foundation of Inner Mongolia Autonomous Region (2020MS05004).

Data Availability Statement

Data is available upon the reasonable request from the corresponding author.

Acknowledgments

The authors would like to thank Zhu Bin’s research team for providing the cell performance-testing device.

Conflicts of Interest

The authors declare no conflict of financial interest or personal relationships influencing the work reported in this paper.

References

  1. Loureiro, F.J.A.; Macedo, D.A.; Nascimento, R.M.; Cesário, M.R.; Grilo, J.P.F.; Yaremchenko, A.A.; Fagg, D.P. Cathodic polarisation of composite LSCF-SDC IT-SOFC electrode synthesised by one-step microwave self-assisted combustion. J. Eur. Ceram. Soc. 2019, 39, 1846–1853. [Google Scholar] [CrossRef]
  2. Zhao, Y.; Ju, Y.; Liu, J.; Shuai, M.; Zhang, P.; Zhu, C. Performance evaluation of BaCo0.7Nb0.2Ta0.1O3 − δ cathode for intermediate-temperature solid oxide fuel cells. Mater. Lett. 2019, 238, 301–304. [Google Scholar] [CrossRef]
  3. Xia, C.; Mi, Y.; Wang, B.; Lin, B.; Chen, G.; Zhu, B. Shaping triple-conducting semiconductor BaCo0.4Fe0.4Zr0.1Y0.1O3-delta into an electrolyte for low-temperature solid oxide fuel cells. Nat. Commun. 2019, 10, 1707–1715. [Google Scholar] [CrossRef]
  4. Hou, J.; Bi, L.; Qian, J.; Zhu, Z.; Zhang, J.; Liu, W. High performance ceria–bismuth bilayer electrolyte low temperature solid oxide fuel cells (LT-SOFCs) fabricated by combining co-pressing with drop-coating. J. Mater. Chem. A 2015, 3, 10219–10224. [Google Scholar] [CrossRef] [Green Version]
  5. Campbell, C.T.; Peden, C.H.F. Chemistry—Oxygen vacancies and catalysis on ceria surfaces. Science 2005, 309, 713–714. [Google Scholar] [CrossRef] [PubMed]
  6. Cai, Y.; Chen, Y.; Akbar, M.; Jin, B.; Tu, Z.; Mushtaq, N.; Wang, B.; Qu, X.; Xia, C.; Huang, Y. A Bulk-Heterostructure Nanocomposite Electrolyte of Ce0.8Sm0.2O2-δ–SrTiO3 for Low-Temperature Solid Oxide Fuel Cells. Nano-Micro Lett. 2021, 13, 46–60. [Google Scholar] [CrossRef]
  7. Li, H.; Lu, G.; Wang, Y.; Guo, Y.; Guo, Y. Synthesis of flower-like La or Pr-doped mesoporous ceria microspheres and their catalytic activities for methane combustion. Catal. Commun. 2010, 11, 946–950. [Google Scholar] [CrossRef]
  8. Katta, L.; Vinod Kumar, T.; Durgasri, D.N.; Reddy, B.M. Nanosized Ce1 − xLaxO2 − δ/Al2O3 solid solutions for CO oxidation: Combined study of structural characteristics and catalytic evaluation. Catal. Today 2012, 198, 133–139. [Google Scholar] [CrossRef]
  9. Shirbhate, S.; Nayyar, R.N.; Ojha, P.K.; Yadav, A.K.; Acharya, S. Exploration of Atomic Scale Changes during Oxygen Vacancy Dissociation Mechanism in Nanostructure Co-Doped Ceria: As Electrolytes for IT-SOFC. J. Electrochem. Soc. 2019, 166, F544–F554. [Google Scholar] [CrossRef]
  10. Rangaswamy, A.; Sudarsanam, P.; Reddy, B.M. Rare earth metal doped CeO2-based catalytic materials for diesel soot oxidation at lower temperatures. J. Rare Earths 2015, 33, 1162–1169. [Google Scholar] [CrossRef]
  11. Liu, Y.; Fan, L.; Cai, Y.; Zhang, W.; Wang, B.; Zhu, B. Superionic Conductivity of Sm3+, Pr3+, and Nd3+ Triple-Doped Ceria through Bulk and Surface Two-Step Doping Approach. ACS Appl. Mater. Interfaces 2017, 9, 23614–23623. [Google Scholar] [CrossRef] [PubMed]
  12. Fuentes, R.O.; Baker, R.T. Structural, morphological and electrical properties of Gd0.1Ce0.9O1.95 prepared by a citrate complexation method. J. Power Sources 2009, 186, 268–277. [Google Scholar] [CrossRef]
  13. Liu, Y.; Mushtaq, M.N.; Zhang, W.; Teng, A.; Liu, X. Single-phase electronic-ionic conducting Sm3+/Pr3+/Nd3+ triple-doped ceria for new generation fuel cell technology. Int. J. Hydrogen Energy 2018, 43, 12817–12824. [Google Scholar] [CrossRef]
  14. Wang, B.; Wang, Y.; Fan, L.; Cai, Y.; Xia, C.; Liu, Y.; Raza, R.; van Aken, P.A.; Wang, H.; Zhu, B. Preparation and characterization of Sm and Ca co-doped ceria–La0.6Sr0.4Co0.2Fe0.8O3 − δsemiconductor–ionic composites for electrolyte-layer-free fuel cells. J. Mater. Chem. A 2016, 4, 15426–15436. [Google Scholar] [CrossRef]
  15. Banerjee, S.; Devi, P.S.; Topwal, D.; Mandal, S.; Menon, K. Enhanced Ionic Conductivity in Ce0.8Sm0.2O1.9: Unique Effect of Calcium Co-doping. Adv. Funct. Mater. 2007, 17, 2847–2854. [Google Scholar] [CrossRef]
  16. Rauf, S.; Zhu, B.; Shah, M.A.K.Y.; Tayyab, Z.; Attique, S.; Ali, N.; Mushtaq, N.; Asghar, M.I.; Lund, P.D.; Yang, C.P. Low-temperature solid oxide fuel cells based on Tm-doped SrCeO2-δ semiconductor electrolytes. Mater. Today Energy 2021, 20, 100661–100672. [Google Scholar] [CrossRef]
  17. Arabacı, A. Citrate/nitrate combustion synthesis and electrical properties of rare earth co-doped Ce0.8Gd0.2 − xNdxO1.90 electrolyte materials. Mater. Sci. Eng. B 2020, 260, 114646–114652. [Google Scholar] [CrossRef]
  18. Omar, S.; Wachsman, E.; Nino, J. Higher conductivity Sm3+ and Nd3+ co-doped ceria-based electrolyte materials. Solid State Ion. 2008, 178, 1890–1897. [Google Scholar] [CrossRef]
  19. Jaiswal, N.; Upadhyay, S.; Kumar, D.; Parkash, O. Sm3+ and Sr2+ co-doped ceria prepared by citrate–nitrate auto-combustion method. Int. J. Hydrogen Energy 2014, 39, 543–551. [Google Scholar] [CrossRef]
  20. Takamura, H.; Kobayashi, J.; Takahashi, N.; Okada, M. Electrical conductivity of ceria nanoparticles under high pressure. J. Electroceramics 2008, 22, 24–32. [Google Scholar] [CrossRef]
  21. Chen, G.; Sun, W.; Luo, Y.; He, Y.; Zhang, X.; Zhu, B.; Li, W.; Liu, X.; Ding, Y.; Li, Y.; et al. Advanced Fuel Cell Based on New Nanocrystalline Structure Gd0.1Ce0.9O2 Electrolyte. Acs Appl Mater Interfaces 2019, 11, 10642–10650. [Google Scholar] [CrossRef]
  22. Stambouli, A.B.; Traversa, E. Solid oxide fuel cells (SOFCs): A review of an environmentally clean and efficient source of energy. Renew. Sustain. Energy Rev. 2002, 6, 433–455. [Google Scholar] [CrossRef]
  23. Guo, M.; Lu, J.; Wu, Y.; Wang, Y.; Luo, M. UV and visible Raman studies of oxygen vacancies in rare-earth-doped ceria. Langmuir 2011, 27, 3872–3877. [Google Scholar] [CrossRef]
  24. Solis, C.; Balaguer, M.; Serra, J.M. In Situ Raman Characterization of SOFC Materials in Operational Conditions: A Doped Ceria Study. Membranes 2020, 10, 148. [Google Scholar] [CrossRef] [PubMed]
  25. Jampaiah, D.; Tur, K.M.; Ippolito, S.J.; Sabri, Y.M.; Tardio, J.; Bhargava, S.K.; Reddy, B.M. Structural characterization and catalytic evaluation of transition and rare earth metal doped ceria-based solid solutions for elemental mercury oxidation. RSC Adv. 2013, 3, 12963–12974. [Google Scholar] [CrossRef]
  26. Lee, Y.C.; Li, K.-D.; Lu, C.-H.; Shen, J.-H.; Teoh, L.G.; Chiang, G.W. Synthesis, Structural and Optical Characterization of Sol–Gel-Derived Y-Doped Mesoporous CeO2. J. Electron. Mater. 2013, 42, 2549–2555. [Google Scholar] [CrossRef]
  27. He, D.; Hao, H.; Chen, D.; Liu, J.; Yu, J.; Lu, J.; Liu, F.; Wan, G.; He, S.; Luo, Y. Synthesis and application of rare-earth elements (Gd, Sm, and Nd) doped ceria-based solid solutions for methyl mercaptan catalytic decomposition. Catal. Today 2017, 281, 559–565. [Google Scholar] [CrossRef]
  28. Liu, J.; Jin, F.; Yang, X.; Niu, B.; Li, Y.; He, T. YBaCo2O5+δ-based double-perovskite cathodes for intermediate-temperature solid oxide fuel cells with simultaneously improved structural stability and thermal expansion properties. Electrochim. Acta 2019, 297, 344–354. [Google Scholar] [CrossRef]
  29. Wang, W.; Zhang, X.; Zhang, D.; Zeng, Q.; Jiang, Y.; Lin, B. Highly promoted performance of triple-conducting cathode for YSZ-based SOFC via fluorine anion doping. Ceram. Int. 2020, 23964–23971. [Google Scholar] [CrossRef]
  30. Wang, B.; Zhu, B.; Yun, S.; Zhang, W.; Xia, C.; Afzal, M.; Cai, Y.; Liu, Y.; Wang, Y.; Wang, H. Fast ionic conduction in semiconductor CeO2-δ electrolyte fuel cells. Npg Asia Mater. 2019, 11, 51–62. [Google Scholar] [CrossRef] [Green Version]
  31. Li, J.; Hou, J.; Xi, X.; Lu, Y.; Li, M.; Fan, Y.; Wang, L.; Wang, L.; Fu, X.-Z.; Luo, J.-L. Cogeneration of ethylene and electricity in symmetrical protonic solid oxide fuel cells based on a La0.6Sr0.4Fe0.8Nb0.1Cu0.1O3—δ electrode. J. Mater. Chem. A 2020, 8, 25978–25985. [Google Scholar] [CrossRef]
  32. Deshpande, S.; Patil, S.; Kuchibhatla, S.V.N.T.; Seal, S. Size dependency variation in lattice parameter and valency states in nanocrystalline cerium oxide. Appl. Phys. Lett. 2005, 87, 133113–133116. [Google Scholar] [CrossRef]
  33. Borchert, H.; Borchert, Y.; Kaichev, V.V.; Prosvirin, I.P.; Alikina, G.M.; Lukashevich, A.I.; Zaikovskii, V.I.; Moroz, E.M.; Paukshtis, E.A.; Bukhtiyarov, V.I.; et al. Nanostructured, Gd-Doped Ceria Promoted by Pt or Pd:  Investigation of the Electronic and Surface Structures and Relations to Chemical Properties. J. Phys. Chem. B 2005, 109, 20077–20086. [Google Scholar] [CrossRef] [PubMed]
  34. Shahed, S.M.F.; Hasegawa, T.; Sainoo, Y.; Watanabe, Y.; Isomura, N.; Beniya, A.; Hirata, H.; Komeda, T. STM and XPS study of CeO2(111) reduction by atomic hydrogen. Surf. Sci. 2014, 628, 30–35. [Google Scholar] [CrossRef]
  35. Shen, Q.; Wu, M.; Wang, H.; He, C.; Hao, Z.; Wei, W.; Sun, Y. Facile synthesis of catalytically active CeO2 for soot combustion. Catal. Sci. Technol. 2015, 5, 1941–1952. [Google Scholar] [CrossRef]
  36. Hu, H.; Lin, Q.; Zhu, Z.; Liu, X.; Zhu, B. Time-dependent performance change of single layer fuel cell with Li0.4Mg0.3Zn0.3O/Ce0.8Sm0.2O2—δ composite. Int. J. Hydrogen Energy 2014, 39, 10718–10723. [Google Scholar] [CrossRef]
  37. Jin, F.; Xu, H.; Long, W.; Shen, Y.; He, T. Characterization and evaluation of double perovskites LnBaCoFeO 5 + δ (Ln = Pr and Nd) as intermediate-temperature solid oxide fuel cell cathodes. J. Power Sources 2013, 243, 10–18. [Google Scholar] [CrossRef]
  38. Rivera-López, F.; Pérez, M. X-ray photoelectron spectroscopy: Surface and depth profiling studies of glasses doped with Nd and Yb ions. Surf. Interface Anal. 2012, 44, 927–930. [Google Scholar] [CrossRef]
  39. Shimada, H.Y.T.; Suzuki, T.; Sumi, H.; Hamamoto, K.; Fujishiro, Y. High power density cell using nanostructured Sr-doped SmCoO3 and Sm-doped CeO2 composite powder synthesized by spray pyrolysis. J. Power Sources 2016, 302, 308–314. [Google Scholar] [CrossRef] [Green Version]
  40. Chen, G.; Sun, W.; Luo, Y.; Liu, H.; Geng, S.; Yu, K.; Liu, G. Investigation of layered Ni0.8Co0.15Al0.05LiO2 in electrode for low-temperature solid oxide fuel cells. Int. J. Hydrogen Energy 2018, 43, 417–425. [Google Scholar] [CrossRef]
Figure 1. X-ray diffraction patterns of (a) CeO2 and SNDC powders and (b) magnified (111) crystal face of the CeO2 and SNDC powders.
Nanomaterials 11 02231 g001
Figure 2. Raman spectra of (a) CeO2 and SNDC samples from 200 to 800 cm−1 and (b) magnified view with the Raman shift ranging from 510 to 700 cm−1.
Nanomaterials 11 02231 g002
Figure 3. (a) XPS survey spectra; (b) O 1s core level XPS spectra and (c) Ce 3d core level XPS spectra of CeO2 and SNDC samples; (d) Sm 3d core level XPS spectra and (e) Nd 3d core level XPS spectra of SNDC sample.
Nanomaterials 11 02231 g003aNanomaterials 11 02231 g003b
Figure 4. EDX element mapping of (ac) CeO2 and (dh) SNDC materials; (i,j) HR-TEM images at different magnifications of SNDC material.
Nanomaterials 11 02231 g004
Figure 5. Typical I−V and I−P curves of fuel cells based on (a) CeO2 and (b) SNDC electrolyte operated at 450–550 °C in H2/air and the corresponding simple schematic diagram of the cell.
Nanomaterials 11 02231 g005
Figure 6. Cross-sectional SEM images of the cells with the (a) CeO2 and (d) SNDC electrolytes, the interface of (b) foam Ni-NCAL/CeO2 and (e) foam Ni-NCAL/SNDC, and the magnified (c) CeO2 and (f) SNDC electrolyte.
Nanomaterials 11 02231 g006
Figure 7. Electrochemical impedance spectra of the cells with nanocrystalline structure (a) CeO2 and (b) SNDC electrolytes measured at 450–550 °C; (c) the empirical equivalent circuit of the impedance.
Nanomaterials 11 02231 g007
Publisher’s Note: MDPI stays neutral with regard to jurisdictional claims in published maps and institutional affiliations.

