
Green Afterglow of Undoped SrAl2O4

School of Microelectronics and Control Engineering, Changzhou University, Changzhou 213164, China
*
Author to whom correspondence should be addressed.
Nanomaterials 2021, 11(9), 2331; https://doi.org/10.3390/nano11092331
Submission received: 5 August 2021
/
Revised: 3 September 2021
/
Accepted: 6 September 2021
/
Published: 9 September 2021
Abstract
:Undoped SrAl2O4 nanocrystals were obtained via solution combustion using urea as fuel. The afterglow properties of undoped SrAl2O4 were investigated. Green afterglow from undoped SrAl2O4 is visible to the human eye when the 325 nm irradiation of a helium–cadmium laser (13 mW) is ceased. The afterglow spectrum of undoped SrAl2O4 is peaked at about 520 nm. From the peak temperature (321 K) of the broad thermoluminescence glow curve, the trap depth of trap levels in undoped SrAl2O4 is estimated to be 0.642 eV using Urbach’s formula. Based on first-principles density functional calculations, the bandstructures and densities of states are derived for oxygen-deficient SrAl2O4 and strontium-deficient SrAl2O4, respectively. Our results demonstrate that the green afterglow of undoped SrAl2O4 originates from the midgap states introduced by oxygen and strontium vacancies. The observation of green afterglow from undoped SrAl2O4 helps in gaining new insight in exploring the afterglow mechanisms of SrAl2O4-based afterglow materials.
1. Introduction
Since the report of green afterglow of Eu2+ and Dy3+ codoped SrAl2O4 in 1996, the afterglow properties of Eu2+ and an auxiliary trivalent rare-earth ion (Re3+) codoped SrAl2O4 have been intensively investigated due to the advantages of long afterglow time [1,2,3,4,5,6]. After intensive studies over the past 25 years, it is widely accepted that Eu2+ is the luminescent center of the afterglow for Eu2+ and Re3+ codoped SrAl2O4 phosphors [1,2,7,8,9]. However, this belief has recently been challenged by the following facts: (i) green afterglows peaking at about 520 nm are observed in Dy3+ doped SrAl2O4 and in Tb3+ doped SrAl2O4 [3,4,10,11]; (ii) Finley et al. suggested that the long afterglow of SrAl2O4:Eu2+ stems from native defects in the lattice of SrAl2O4 on the basis of their density functional studies on charged vacancies in SrAl2O4 and SrAl2O4:Eu2+ [12]; and (iii) blue and blue–green afterglows are recorded in a variety of undoped materials, among which include HfO2 [13], Mg2SnO4 [14], CaAl2O4 [15,16], boric oxide [17], and SrSO4 [18]. These challenging facts suggest that the native defects in SrAl2O4, namely the oxygen and strontium vacancies, are likely to be the origin of the afterglow. If so, undoped SrAl2O4 should exhibit green afterglow since native defects such as oxygen and strontium vacancies are already present in undoped SrAl2O4 at room temperature. A literature survey indicates that there is no report on the afterglow of undoped SrAl2O4 so far. The lack of study on the afterglow of undoped SrAl2O4 makes most of the afterglow mechanisms presented so far vulnerable to serious flaws. Therefore, it is necessary to explore the afterglow features of undoped SrAl2O4.
In this work, undoped SrAl2O4 phosphors were obtained via solution combustion in order to explore their afterglow properties. Undoped SrAl2O4 phosphors are found to exhibit green afterglow when the 325 nm irradiation from a helium–cadmium laser (13 mW) is turned off. The electronic structures of oxygen-deficient SrAl2O4 and strontium-deficient SrAl2O4 are derived using density functional theory (DFT) calculations. Our experimental and computational data show that the green afterglow of undoped SrAl2O4 stems from the oxygen and strontium vacancies in the lattice of SrAl2O4.
2. Materials and Methods
2.1. Synthesis of Undoped SrAl2O4 Phosphors
SrAl2O4 nanocrystals were prepared by solution combustion technique. All reagents were in analytical grade, details on the chemical suppliers are available elsewhere [3,4,10,11]. Stoichiometric amounts of Sr(NO3)2·4H2O (0.02 mol) and Al(NO3)3·9H2O (0.04 mol) were dissolved in deionized water (100 mL) to form a transparent solution. Urea (0.6 mol) and H3BO3 (0.002 mol) were added into the solution to work as the fuel of combustion and flux, respectively. The solution had been aged at 40 °C for two weeks before it was transferred into an alumina crucible for combustion. The firing temperature in an air-filled furnace was 740 °C. The resultant solids were ground into fine powders with a pestle in a mortar.
2.2. Phase and Morphology of Undoped SrAl2O4
The X-ray diffractogram (XRD) of the prepared sample was measured with an X-ray diffractometer (model D/max 2500 PC, Rigaku Corporation, Akishima, Japan). The wavelength of the X-ray radiation was 0.15405 nm. The morphology and the energy dispersive X-ray (EDX) spectrum of undoped SrAl2O4 phosphors were analyzed with the scanning electron microscope (SEM) (model S–4800, Hitachi, Tokyo, Japan). The morphology and the lattice of undoped SrAl2O4 nanocrystals were determined with a transmission electron microscope (TEM) (model JEOL JEM–2100, Japan Electronics Corp., Akishima, Japan).
2.3. Steady-State Photoluminescence (PL) and PL Decay Curves of Undoped SrAl2O4
The steady-state PL spectrum of undoped SrAl2O4 was measured with the spectrophotometer (Tianjin Gangdong Ltd., Tianjin, China). A helium–cadmium laser (Kimmon Electric Co. Ltd., Tokyo, Japan) was employed to provide the excitation source. The emission wavelength of the laser was 325 nm, and the excitation power of the laser was 13 mW. The PL decay curves were measured on a picosecond fluorescence lifetime spectrometer (LifeSpec II, Edinburgh Instruments, Edinburgh, UK) utilizing a time correlated single photon counting method. Pulsed light excitation at 320 nm was provided by a picosecond pulsed light emitting diode. At the repetition rate of 10 MHz, the pulse width of the pulsed light was about 860 ps. For each PL decay curve, the pulse duration of the pulsed light source was fixed at 100 ns. Details on the PL decay characterization could be found elsewhere [19,20,21]. Both the steady-state PL and the PL decay curves of undoped SrAl2O4 were measured at room temperature.
2.4. Afterglow Spectrum and Thermoluminescence (TL) Glow Curve of Undoped SrAl2O4
With the same PL spectrophotometer, the afterglow spectrum of undoped SrAl2O4 phosphors was recorded immediately after the ultraviolet irradiation from the helium–cadmium laser (325 nm, 13 mW) was blocked off. The TL glow curve of undoped SrAl2O4 was measured on a TL meter constructed according to the scheme given by Yamashita et al. [22]. Undoped SrAl2O4 powders were exposed to the ultraviolet irradiation at 254 nm for 5 min before the TL measurement was started. The TL signals of undoped SrAl2O4 phosphors were recorded as the phosphors were heated from 283 to 483 K at a rate of 2 K/s.
2.5. Electron Paramagnetic Resonance (EPR) Measurement of Undoped SrAl2O4
The X-band EPR spectrum was measured at room temperature using an X-band EPR spectrometer (JEOL JES–FA200, Japan Electronics Corp., Akishima, Japan) with a 100 kHz magnetic field modulator. The magnetic field was monitored with a gaussmeter, and the magnetic field was swept from 3465 to 3565 G with a sweep width of 100 G. The resonance frequency of its cavity was 9.585 GHz, and the microwave power was 20 mW.
2.6. Band Structures and Densities of States of Defect-Rich SrAl2O4
Density functional calculations of the band structures and the densities of states of defect-rich SrAl2O4 were performed using the density functional theory (DFT) module (Quantumwise Atomistix ToolKit 11.8 package, Copenhagen, Denmark). The exchange–correlation functional was treated within the generalized gradient approximation (GGA) scheme by the Perdew–Burke–Ernzerhof (PBE) potential [23]. Taken from the Inorganic Crystal Structure Database (ICSD), the lattice parameters of monoclinic SrAl2O4 (a = 0.8447 nm, b = 0.8816 nm, c = 0.5163 nm, and β = 93.42°) were used in the present calculations (ICSD number 26466). The considered electronic configurations were 4s24p65s2 for Sr, 2s22p4 for O, and 3s23p1 for Al. A supercell with dimensions of 1 × 1 × 2 was constructed for defect-free SrAl2O4. Such a supercell was composed of 8 Sr, 16 Al, and 32 O sites. When one oxygen site was vacant, oxygen-deficient SrAl2O4 resulted. The resultant SrAl2O4 was denoted as SrAl2O3.875 in this work. Similarly, strontium-deficient SrAl2O4 resulted when one strontium site was removed from the supercell. The resultant SrAl2O4 was denoted as Sr0.875Al2O4 in this work. Double zeta single polarized basis sets were chosen for each element. The cut-off energy for the plane waves was 75 Hartree. The Monkhorst–Pack scheme k-points grid sampling was set at 5 × 5 × 5 for the Brillouin zone. The Brillouin zone sampling and the kinetic energy cutoff were sufficient to guarantee an excellent convergence for the calculated band structures. Details on the density functional calculations were available elsewhere [15,16,24,25].
3. Results and Discussion
3.1. XRD Pattern and Morphology of Undoped SrAl2O4
Figure 1a depicts the XRD pattern of undoped SrAl2O4 and its Rietveld analysis. In Figure 1a, the raw XRD data are represented by the open circles (in black), and the Rietveld diffractogram of the undoped SrAl2O4 is represented by the green solid curve. As can be seen in Figure 1a, the XRD profile exhibits distinct peaks at 2θ = 19.95, 22.74, 28.386, 29.275, 29.922, and 35.113°. These peaks match well with the data registered in the Joint Committee on Powder Diffraction Standards (JCPDS) data file (JCPDS card number 34–0379) for monoclinic SrAl2O4 [3,4,6,10,11]. Hence, according to the data registered in JCPDS card number 34–0379, these peaks can be attributed to the X-ray reflections from crystallographic planes (001), (120), (–211), (220), (211), and (013) of monoclinic SrAl2O4, respectively. Thus, the monoclinic phase of SrAl2O4 is confirmed by the XRD pattern in Figure 1a. Using the program FULLPROF Suite 2014, detailed structural information of undoped SrAl2O4 can be extracted via the Rietveld refinement method, and the lattice parameters derived from the Rietveld refinement are a = 0.8427 ± 0.0002 nm, b = 0. 8826 ± 0.0002 nm, c = 0.5131 ± 0.0001 nm, and β = 93.237 ± 0.007°. A comparison of these data with those registered in the ICSD for monoclinic SrAl2O4 (ICSD #26466) reveals that the unit cell parameters of undoped SrAl2O4 are close to those of reference SrAl2O4 (a = 0.8447 nm, b = 0.8816 nm, c = 0.5163 nm, β = 93.42°). Monoclinic SrAl2O4 is known to have the stuffed tridymite structure with the space group P21 and Z = 4. Figure 1b illustrates the schematic view of the monoclinic SrAl2O4 along the c-direction. As can be seen clearly in Figure 1b, monoclinic SrAl2O4 has a three-dimensional network of corner-sharing AlO4 tetrahedra, and channels are present in the a- and c-directions. Sr2+ ions are located in these channels. Figure 1c displays the unit cell of monoclinic SrAl2O4. There are two crystallographically different sites for Sr2+, which are labeled as Sr1 and Sr2 in Figure 1c. The environments around the two nonequivalent Sr sites differ only by a slight distortion of their square planes [26,27].
Figure 2 represents the SEM and TEM micrographs of undoped SrAl2O4. As shown in Figure 2a, the phosphors are in the form of micrometer-sized agglomerates. The largest agglomerate in Figure 2a is about 80 μm in diameter, whilst the smallest one is around 5 μm in diameter. The average particle sizes of the agglomerates are estimated to be 20 μm by means of particle size analyzer. Figure 2b displays the TEM micrograph of an agglomerate of undoped SrAl2O4. As can be seen in Figure 2b, this agglomerate is about 300 nm in length and 120 nm in width. In particular, some nanocrystals are discernible in this agglomerate, and the sizes of CaAl2O4 nanocrystals in the agglomerates are less than 30 nm in dimension. Figure 3c shows a high-resolution TEM micrograph of one SrAl2O4 nanocrystal. As shown in Figure 2c, the spacing between two adjacent planes is 0.305 nm, which agrees reasonably with the distance between two adjacent (220) crystal planes of SrAl2O4. The clarity of the fringe patterns in the high-resolution TEM micrograph indicates that the synthesized product crystallizes in a single phase. Therefore, an agglomerate of undoped SrAl2O4 is composed of a large number of SrAl2O4 nanocrystals [14,15,28].
3.2. EDX Spectrum and Element Mapping of Undoped SrAl2O4
The EDX spectrum of undoped SrAl2O4 is depicted in Figure 3a. As can be seen in Figure 3a, the characteristic X-ray emissions of O(Kα), Al(Kα), and Sr(Lα1) are located at 0.525, 1.486, and 1.806 keV, respectively. Additionally, the X-ray emissions of Au(Mα1) and Au(Lα1) are identified at 2.122 and 9.713 keV, respectively. As documented previously, the presence of Au element in the specimen is due to the Au sputtering for the convenience of SEM characterization [10,29]. Without considering the element Au, the data in Figure 3a confirm the presence of elements Sr, Al, and O in the synthesized compound. Element mappings are important for displaying element distributions in inorganic materials [30]. Figure 3b shows the electronic image of the selected area of undoped SrAl2O4, while Figure 3c–e represent the EDX elemental mappings of O, Sr, and Al for the selected area of undoped SrAl2O4. The mappings demonstrate that the spatial distribution of each element in undoped SrAl2O4 is uniformly distributed.
It is important to assure that the undoped SrAl2O4 is not contaminated by a trace of Eu2+. Similar to our previous work on undoped CaAl2O4, we measured the X-ray fluorescence spectrum of undoped SrAl2O4 under the synchrotron radiation at the energy of 6.99 keV (4W1B endstation, Beijing synchrotron Radiation Facility) [15]. The characteristic X-ray emissions of Eu(Lα1) and Eu(Lα2) at about 5.84 keV cannot be detected in our undoped SrAl2O4. Similarly, not even a trace of the Eu2+ or Eu3+ species could be observed at 6980 eV (for Eu2+) or 6988 eV (for Eu3+) can be observed in the X-ray absorption spectrum at the LIII edge of Eu. Both the X-ray fluorescence and the X-ray absorption analyses demonstrate the absence of Eu2+ in undoped SrAl2O4.
3.3. Steady-State PL Spectrum of Undoped SrAl2O4
The steady-state PL spectrum of undoped SrAl2O4 in wavelength scale is given in Figure 4a. The excitation wavelength is 325 nm. As shown in Figure 4a, the PL spectrum of undoped SrAl2O4 in wavelength scale is apparently composed of more than one PL band. As mentioned by Mooney et al., the PL spectrum presented in energy scale provides better physical insight [31]. Employing the Jacobian transformation, the PL spectrum in Figure 4a is properly converted into the data in the unit of energy, and the resultant data are shown in Figure 4b. It is found that the PL spectrum in Figure 4b can be deconvoluted into two Gaussian bands. One of the Gaussian bands was centered at 2.63 eV (471.6 nm) while the other was centered at 3.13 eV (396.4 nm). SrAl2O4 is known as an insulator with a bandgap of 6.52 eV [32,33,34,35]. The incident photon energy of the ultraviolet excitation in this work is only 3.82 eV, which is also limited to trigger the band–edge recombination of SrAl2O4. Thus, the broad-band emissions in the PL spectrum in Figure 4b can only be originated from the defect related emissions of SrAl2O4. In SrAl2O4, oxygen vacancy and strontium vacancy are the two kinds of most common intrinsic defects. Considering the release of a large volume of reducing gases (i.e., CO and NH3) during the combustion synthesis, anion vacancy (i.e., oxygen vacancy) is the most favorable defect, whilst cation vacancy is the second most favorable defect in undoped SrAl2O4. As documented in the literature, oxygen vacancy related emissions are reported for a number of host materials, among which include CaAl2O4 [17,18,28], SrAl2O4 [3,4,10,11], BaAl2O4 [36], SrSO4 [18,25], HfO2 [13], Mg2SnO4 [14], ZnWO4 [30,37], and ZnMoO4 [38]. In the case of SrAl2O4, Kamada et al. reported that the broad PL spectrum of undoped SrAl2O4 is comprised of 3 subbands peaking at 250, 360, and 490 nm when excited at 180 nm (6.9 eV) [33], Nazarov et al. reported that the broad PL spectrum of undoped SrAl2O4 consists of 4 subbands peaking at 250, 375, 450, and 520 nm when excited at 8 eV [39]. These experimental results show that the emission bands in Figure 4b are related to the intrinsic defects in SrAl2O4. In other words, the oxygen vacancy and strontium vacancy in the lattice of SrAl2O4 should take the responsibility for the two PL subbands in Figure 4b. Figure 4c illustrates the ultraviolet–vacuum ultraviolet synchrotron radiation excitation spectrum of undoped SrAl2O4. The emission wavelength is fixed at 520 nm. As can be seen in Figure 4c, intense absorptions take place when the excitation wavelength is shorter than 190 nm, indicating the absorption across the bandgap of SrAl2O4. In addition to the intense absorption across the bandgap, a weak but broad absorption band can be identified in the range of 250–400 nm. Peaking at about 340 nm, this weak absorption band can be ascribed to the intrinsic defects in SrAl2O4.
It is important to note here that both oxygen and cation vacancies in oxides can be in several charge states. For example, in the case of oxygen vacancy, they can be doubly positively charged when no electron is trapped (F2+ center), singly positively charged when one electron is trapped (F+ center), or neutral when two electrons are trapped (F-center). As reported by González et al., both the F+ and the F centers in MgO absorb essentially at the same energy of around 5 eV, but their PL peaks are located at 3.2 (F+ center) and 2.3 eV (F center), respectively [40]. In the case of oxygen-type vacancies (F+ and F centers), photoexcitation leads either to intracenter excitation of the F-type centers or to electron transition from valence band to appropriate unoccupied states within the band gap, and the photoconversions of F+ to F centers in MgO and Al2O3 are addressed [40,41,42]. In our case, the oxygen vacancy in undoped SrAl2O4 can also have three charge states: doubly positively charged oxygen vacancy when no electron is trapped, positively charged oxygen vacancy when one electron is trapped, and neutral oxygen vacancy when two electrons are trapped. It is understandable that the oxygen vacancies with different charge state exhibit absorption bands in the ultraviolet spectral region and emission bands in the visible spectral region.
Among the oxygen vacancies with different charges states (F, F+, and F2+ centers), each of them has the possibility of acting as the luminescence center of PL for undoped SrAl2O4. Upon the continuous irradiation of the ultraviolet laser (325 nm, 13 mW), no obvious change in the PL profile can be observed for undoped SrAl2O4, suggesting no noticeable photoconversion between the different charged states of oxygen vacancy [40,43]. Note that in undoped SrAl2O4, charged oxygen vacancies should be thermodynamically stable and energetically feasible. Finley et al. calculated the formation energies of charged oxygen vacancies in undoped SrAl2O4 as a function of Fermi level at the oxygen-poor limit to mimic the most probable experimental conditions for the synthesis of the SrAl2O4. Their calculations suggested that: (i) the most energetically favorable vacancy charge state is either a doubly positively charged oxygen vacancy (F2+ center) or a neutral oxygen vacancy (F center); (ii) the singly positively charged oxygen vacancy is the least energetically favorable for the anion defects; and (iii) all of the oxygen vacancies with 4 eV above the valence band should have a 2+ charge, whereas the vacancies near the conduction band are likely to be neutral vacancies [12]. Figure 4b shows that each peak energy of the two PL bands in the PL spectrum is less than 3.2 eV, thus the studies performed by Finley et al. suggest that the doubly positively charged oxygen vacancy in SrAl2O4 is likely responsible for the recorded PL as shown in Figure 4b.
3.4. Afterglow Spectrum and Afterglow Decay Profile of Undoped SrAl2O4
Figure 5a represents the afterglow spectrum of undoped SrAl2O4. Obviously, this afterglow spectrum is broad in profile with its peak at about 520 nm. It is known that the chromaticity coordinates of the afterglow can be derived through using the data in the afterglow spectrum [43,44]. In the International Commission on Illumination (CIE) 1931 XYZ color space, the chromaticity coordinates of the afterglow are derived to be (0.193, 0.488) for the undoped SrAl2O4. Hence, the afterglow color of undoped SrAl2O4 can be depicted as green in the CIE color diagram. The insets in Figure 5a illustrate the photographs of the undoped SrAl2O4 when the irradiation of the ultraviolet laser is turned on (left) and off (right). The inset at the right side of Figure 5a verifies the green color of the afterglow of undoped SrAl2O4. The green afterglow of undoped SrAl2O4 is visible to the human eye in the dark for about 10 s. Figure 5b depicts the afterglow decay profile of undoped SrAl2O4. This afterglow decay profile was taken after the phosphors were exposed to the 325 nm irradiation of the ultraviolet laser for 5 min. As can be seen in Figure 5b, it takes about 60 s for the luminance of the afterglow to reach the threshold value of 0.32 mcd/m2. Insets in Figure 5b depict the afterglow photographs of the undoped SrAl2O4 taken at 0, 5, and 10 s after the extinction of the irradiation of the ultraviolet laser. Figure 5c shows the afterglow spectra of undoped SrAl2O4 measured at different delays times after the removal of the ultraviolet illumination of the He-Cd laser (325 nm, 13 mW). These afterglow spectra were acquired with the PL spectrophotometer coupled with a CCD camera. As shown in Figure 5c, the profile of the afterglow spectrum does not change over time, but the peak intensity of the afterglow spectrum decreases with the time. The longer the time is delayed, the lower the peak intensity is of the afterglow spectrum. Additionally, no obvious shift in the peak position of the afterglow spectra can be detected when the delay time increases from 1 to 6 s.
The green afterglow of undoped SrAl2O4 is quite similar to those of Eu2+ singly doped SrAl2O4 [32] and Eu2+ and Dy3+ codoped SrAl2O4 [1,2,5,6]. It is worth noting that the undoped SrAl2O4 in this work is free of Eu2+ contamination. Consequently, the green afterglow of undoped SrAl2O4 highlights the possibility of intrinsic defects in SrAl2O4, acting as the luminescence center of green afterglow.
3.5. TL Glow Curve of Undoped SrAl2O4
The activation energies (i.e., trap depths) of trapping levels in undoped SrAl2O4 can be determined by analyzing its TL glow curve. Figure 6 represents the TL glow curve of undoped SrAl2O4 in the temperature range of 283–473 K. The temperature rising rate is 2 K/min. Obviously, one broad band appears in the temperature range of 283–400 K, while the other band is present at high temperatures (>430 K). As can be seen in Figure 6, the TL glow curve in the range of 283–400 K is broad and asymmetric in profile with a peak at around 321 K. The half width temperatures at the low and high temperature sides are 301 and 369 K, respectively, which yields the geometry factor of the TL glow curve of 0.70. Apparently, this value of geometry factor is much larger than that of the second order kinetics (0.52). Thus, the broad TL glow curve suggests a continuous distribution of trap levels in undoped SrAl2O4, rather than a few discrete trap levels. Interestingly, Nazarov et al. reported oxygen defects related TL peak at 325 K for Eu2+ doped SrAl2O4 (1 mol%) [39]. To further estimate the trap depths in undoped SrAl2O4, a deconvolution of the TL glow curve with general order kinetics is carried out using a computer program given by Chung et al. [45]. Unfortunately, it is found that this TL glow curve cannot be described satisfactorily by using the general order kinetics to model the traps in undoped SrAl2O4. Based on the TL peak temperature, one can use Urbach’s formula to roughly estimate the trap depth for undoped SrAl2O4. The trap depth estimated in this way is 0.642 eV for undoped SrAl2O4. Figure 6b illustrates the TL emission spectrum of undoped SrAl2O4 measured at different temperatures. As shown in Figure 6b, the TL emission spectrum gains its intensity as the temperature increases from 280 to 320 K. Further increase in the temperature renders the TL emission spectrum to lose its intensity.
The afterglow lifetime of an afterglow material is sensitively influenced by the activation energy of a trap. Previous studies show that the ideal trap depth of a trap should be in the range of 0.4–1.0 eV [1,2,12]. If a trap is shallower than 0.4 eV, electrons in this trap will be easily depopulated at room temperature, which prevents experimental observation of afterglow from an afterglow material. As a contrast, a trap that is deeper than 1.0 eV will not allow electrons to be released at room temperature. An ideal trap is assumed to be about 0.65 eV because it is deep enough to trap an electron effectively but not too deep to prevent slow release at room temperature [1,2,18]. Obviously, the trap depth of the trap in undoped SrAl2O4 is close to the ideal value, but why is the afterglow of undoped SrAl2O4 still short-lived? It is noticed that the intensity of the TL glow curve of undoped SrAl2O4 is about two orders of magnitude lower than that of Eu2+ doped SrAl2O4 (1 mol%). The low TL intensity indicates very low trap concentration in undoped SrAl2O4. Consequently, the low population density of electron traps in undoped SrAl2O4 is one of the reasons why undoped SrAl2O4 has a short-lived afterglow.
3.6. Band Structures and Densities of States of Defect-Rich SrAl2O4
Oxygen and strontium vacancies are two kinds of common point defects in SrAl2O4, and they tend to generate midgap states in the bandgap of SrAl2O4. In the Supporting Materials, the first Brillouin zone of the monoclinic lattice of SrAl2O4 is given as a separate figure (Figure S1). Calculation of the band structure of CaAl2O4 crystal is performed for the high-symmetry points Г, B, D, Z, C, Y, A, E, and along the lines between them in the Brillouin zone (Figure S1). Figure 7a represents the DFT calculated band structures and densities of states of defect-free SrAl2O4. In the DFT calculations, the exchange–correlation functional was treated within the GGA scheme by the PBE potential. It can be seen in Figure 7a that the bandgap of defect-free SrAl2O4 is calculated to be 4.29 eV. Additionally, the plot of densities of states shows clearly that the bandgap of SrAl2O4 is free of any midgap states. As documented in the literature, Liu et al. and Nazarov et al. calculated the band structures and the densities of states of monoclinic SrAl2O4 by treating the exchange–correlation functional within the GGA scheme, and their bandgap values were reported to be 4.49 and 4.52 eV, respectively [46,47]. Clearly, our calculated bandgap value (4.29 eV) is consistent with those reported data. However, these calculated bandgap values are significantly underestimated when compared to the experimental bandgap value of SrAl2O4 (6.52 eV) [32,33,34,35]. To overcome the problem of bandgap underestimation, scissors operator is implemented to correct the significantly underestimated bandgap by shifting the conduction bands upwards so that the bandgap of defect-free SrAl2O4 is adjusted to be 6.52 eV. After scissors operation, the calculated band structures and densities of states of defect-free SrAl2O4 are shown in Figure S2a.
The cut-off energy for the plane waves was 75 Hartree, which equals to 2040.75 eV and seems very large. In our case, the cut-off energy of 75 Hartree is applied to the entire assembly of the 56 atoms (i.e., 8 Sr atoms, 16 Al atoms and 32 O atoms) in the 1 × 1 × 2 supercell. On one hand, setting the value of cut-off energy depends on the number of atoms in the cell. The more atoms there are in the cell, the higher the cut-off energy is for the cell. As documented in the literature, the cut-off energy of 500 eV (about 18.4 Hartree) is often chosen for a unit cell containing several atoms in the density functional calculations. Consequently, a much higher cut-off energy should be chosen for the supercell that contains 56 atoms. On the other hand, setting the value of cut-off energy depends on the accuracy of the calculation. A higher cut-off energy should be chosen for a higher accuracy. It is found that the total energy of the supercell converges to an accuracy better than 0.01 mV/atom when the cutoff energy is 75 Hartree. Additionally, the self-consistent calculation converges to an accuracy not worse than 0.2 mV/atom when the cutoff energy is 20 Hartree. In order to have an accuracy better than 0.01 mV/atom, we have set 75 Hartree as the cut-off energy for the density functional calculations in this work.
Figure 7b depicts the DFT calculated band structures and densities of states of oxygen-deficient SrAl2O4 (i.e., SrAl2O3.785). As shown in Figure 7b, the calculated bandgap of the oxygen deficient SrAl2O4 is 4.67 eV, and oxygen vacancy introduces midgap states in the bandgap of SrAl2O4. Peaking at EV + 2.04 eV, these defect energy levels are distributed between EV + 1.94 and EV + 2.15 eV. Using the scissors operator to overcome the problem of bandgap underestimation, the bandgap of oxygen-deficient SrAl2O4 is adjusted to be 6.52 eV, in the meanwhile the oxygen vacancy introduced defect energy levels are distributed from EV + 2.69 eV to EV + 2.99 eV. After scissors operation by multiplying the defect and conduction energy levels with a scale factor of 1.396, the calculated band structures and densities of states of oxygen-deficient SrAl2O4 are shown in Figure S2b. These defect energy levels can be clearly identified in the plot of density of states, which exhibits a prominent peak at EV + 2.84 eV. Employed DFT with a hybrid exchange and correlation functional, Finley et al. reported that oxygen vacancies form favorably at energies more than 2 eV above the valence band of SrAl2O4 [12]. At this point, the energy level of oxygen vacancy derived from our density functional calculation (EV + 2.84 eV) is consistent with that reported by Finley et al.
Figure 7c illustrates the DFT calculated band structures and densities of states of strontium-deficient SrAl2O4 (i.e., Sr0.875Al2O4). As shown in Figure 7c, the calculated bandgap of strontium-deficient SrAl2O4 is 4.30 eV. The defect energy levels generated by strontium vacancy are distributed between EV + 0.10 eV and EV + 0.40 eV. Clearly, the defect energy levels of strontium-deficient SrAl2O4 are distributed closely to the top of the valence band of SrAl2O4. From the plot of density of states, we can see that the peak of the density of states of these defect energy levels is located at EV + 0.30 eV. After the scissors operation to overcome the bandgap overestimation problem, the bandgap of strontium-deficient SrAl2O4 is adjusted to 6.52 eV whilst the defect energy levels generated by strontium vacancy are distributed between EV + 0.15 and EV + 0.61 eV. In the density of states plot, the peak of the density of states of these defect energy levels is adjusted to EV + 0.45 eV. After scissors operation by multiplying the defect and conduction energy levels with a scale factor of 1.516, the calculated band structures and densities of states of strontium-deficient SrAl2O4 are shown in Figure S2c. Employed DFT with a hybrid exchange and correlation functional, Finley et al. reported that strontium vacancies form favorably at energies less than 1 eV above the valence band [12]. At this point, our calculated energy level of strontium vacancy (EV + 0.45 eV) agrees well with that reported by Finley et al.
These intrinsic defects in SrAl2O4 are well known to work as luminescence centers of PL [15,16]. Moreover, they can also work as carrier traps. Being positively charged, oxygen vacancy can work as an electron trap because it attracts electron around it. Similarly, strontium vacancy can work as a hole trap because it is negatively charged [5]. Therefore, these intrinsic defects will play important roles in the PL and afterglow of undoped SrAl2O4.
3.7. EPR Spectrum of Undoped SrAl2O4
The presence of oxygen vacancies in undoped SrAl2O4 can be evidenced by EPR spectroscopy, which provides information on chemical species with unpaired electrons. Figure 8 illustrates the EPR spectrum of undoped SrAl2O4 measured at room temperature. The microwave frequency is 9.856 GHz. From its crossover point, the center field of this resonance is determined to be 3515.5 G, and then the gyromagnetic g value of the signal is determined to be 2.0032. It is known that the g value of free electron is 2.0023. Apparently, the g value derived in this work for undoped SrAl2O4 is close to that of free electrons. Holsa et al. pointed out that even undoped CaAl2O4 contains trapped electrons, probably in oxygen vacancies [48]. Our recent studies showed that trapped electrons are present in undoped SrSO4 and undoped CaAl2O4 [15,18]. Consequently, Figure 8 demonstrates that unpaired electrons are present in undoped SrAl2O4. Moreover, these unpaired electrons probably originate from electrons trapped in positively charged oxygen vacancies.
Because F+ center contains unpaired electrons, the concentration of F+ center in undoped SrAl2O4 can be quantitatively determined by doubly integrating the first derivative EPR spectrum. After subtraction of a background EPR signal, the concentration of F+ centers within undoped SrAl2O4 can be determined by comparing the double integration of the EPR signal to that of a reference standard (MnO powder). The number of spins in the reference standard is 3.34 × 10¹⁹ spins/g. The spin density is determined to be around 3.0 × 10¹⁶ spins/g for undoped SrAl2O4. Thus, the concentration of F+ center in undoped SrAl2O4 is around 8.4 × 1015 cm−3. However, the concentrations of F or F2+ centers in SrAl2O4 cannot be determined with the EPR technique, since neither F nor F2+ has an unpaired electron. Thus, the study of the concentration of charged states of oxygen vacancies in SrAl2O4 demands dedicated research efforts through experiments.
3.8. Intrinsic Defects Related PL and Afterglow Mechanisms for SrAl2O4
The intrinsic defects related PL and afterglow mechanisms are displayed in Figure 9 for undoped SrAl2O4. As sketched in Figure 9, the midgap states of oxygen and strontium vacancies are located at EV + 2.84 eV and EV + 0.45 eV, respectively. An electron trap is presented in the middle of Figure 9 to show the possible role played by oxygen vacancy in undoped SrAl2O4. Upon the photoexcitation of the ultraviolet light at 325 nm (3.82 eV), a fraction of excitation energy is absorbed by SrAl2O4 lattice since practical SrAl2O4 contains various kinds of intrinsic defects (process ①). Non-radiative relaxations take place when hot electrons are captured by the oxygen vacancies (process ②) or by the electron traps (process ③) present in SrAl2O4. According to the mechanisms proposed in Figure 9, three different paths become available for the subsequent radiative recombinations: (i) the electrons captured at oxygen vacancy recombine radiatively with holes in the valence band of SrAl2O4, resulting in a broad PL band with its peak energy determined by the energy level of the oxygen vacancy in the bandgap of SrAl2O4 (process ④); (ii) the electrons captured at oxygen vacancy recombine radiatively with holes trapped at the strontium vacancy, yielding another broad PL band with its peak energy determined by the energy difference between the oxygen and strontium vacancies in the bandgap of SrAl2O4 (process ⑤); and (iii) upon thermal stimulation and/or photon stimulation, the electrons are released from electron traps (process ⑥) to recombine radiatively with holes trapped at the strontium vacancy (process ⑤). The third path is a combined process that is coupled with the processes ⑥ and ⑤. This combined process results in a luminescence band which is identical to that of the second path.
When the photoexcitation is stopped, processes ①–④ are terminated immediately, but processes ⑥ and ⑤ are kept working. Under thermal activation, electrons trapped at the electron traps can be released (process ⑥), and an afterglow can be resulted if the detrapped electrons recombine radiatively with holes trapped at the strontium vacancy (process ⑤). Hence, according to Figure 9, green afterglow can be expected for undoped SrAl2O4. Clearly, this afterglow mechanism involves the gradual release of electrons from electron traps (i.e., oxygen vacancies) followed by electron migration to strontium vacancies. Consequently, the couple of oxygen and strontium vacancies can be ascribed to be the luminescence center of the green afterglow of undoped SrAl2O4.
If the proposed mechanisms in Figure 9 are reasonable, we can expect that: (i) the PL spectrum of undoped SrAl2O4 should consist of two subbands; (ii) one PL subband should be peaked at about 2.39 eV (518 nm) while the other PL subband should be peaked at about 2.84 eV (436 nm); and (iii) the afterglow of undoped SrAl2O4 should be peaked at 2.39 eV (518 nm). Qualitatively speaking, the record of two subbands in the PL spectrum of undoped SrAl2O4 (in Figure 4) and the observation of green afterglow peaking at 2.38 eV (520 nm) (in Figure 5) have matched well with the expectations. Quantitatively speaking, the peak energies of the two PL subbands, namely 2.63 eV (471.6 nm) for the first subband and 3.13 eV (396.4 nm) for the second subband in Figure 4, have fallen far short of our expectations (i.e., 2.39 eV for the first subband and 2.84 eV for the second subband). The maximum difference between the experimental peaking energy and the expected one is 0.29 eV. Two factors might be responsible for the discrepancies. The first factor is that the inherent limitation of the DFT calculations makes it difficult to exactly determine the defect energy levels for solids. The second factor is that the weak PL subband peaking at about 2.63 eV generates significant error in the PL deconvolution.
Once the solid is synthesized, the energy levels of oxygen and calcium vacancies in the bandgap of SrAl2O4 are stable over time if the crystal structure of defect-containing SrAl2O4 does not evolve with time. Generally speaking, changes of the energy levels in the bandgap of SrAl2O4 take place only when the crystal structure of defect-containing SrAl2O4 is modified by subsequently treatments, such as thermal annealing at elevated temperatures and high-energy particle irradiation. As a contrast to the stable energy levels, the population of intrinsic defects is strongly affected by the synthesis method and subsequent treatments of the material. The stability of the energy levels of these defects in SrAl2O4 over time has been evidenced by the unchanged profile of the steady-state PL spectrum, even after storage of the sample at room temperature for a couple of years. In spite of the good stability of the defect energy levels, any electron which exists in the energy levels is in a meta-stable state and will decay with time via trap levels or defect energy levels in the band gap. The decay of electron via the trap is evidenced by the afterglow decay curve shown in Figure 5b. For the electrons in the energy levels of oxygen vacancy, they depopulate over time, and the decay of electron via the energy levels of oxygen and strontium vacancies is discussed in the following section.
3.9. PL Decay Curves of Undoped SrAl2O4
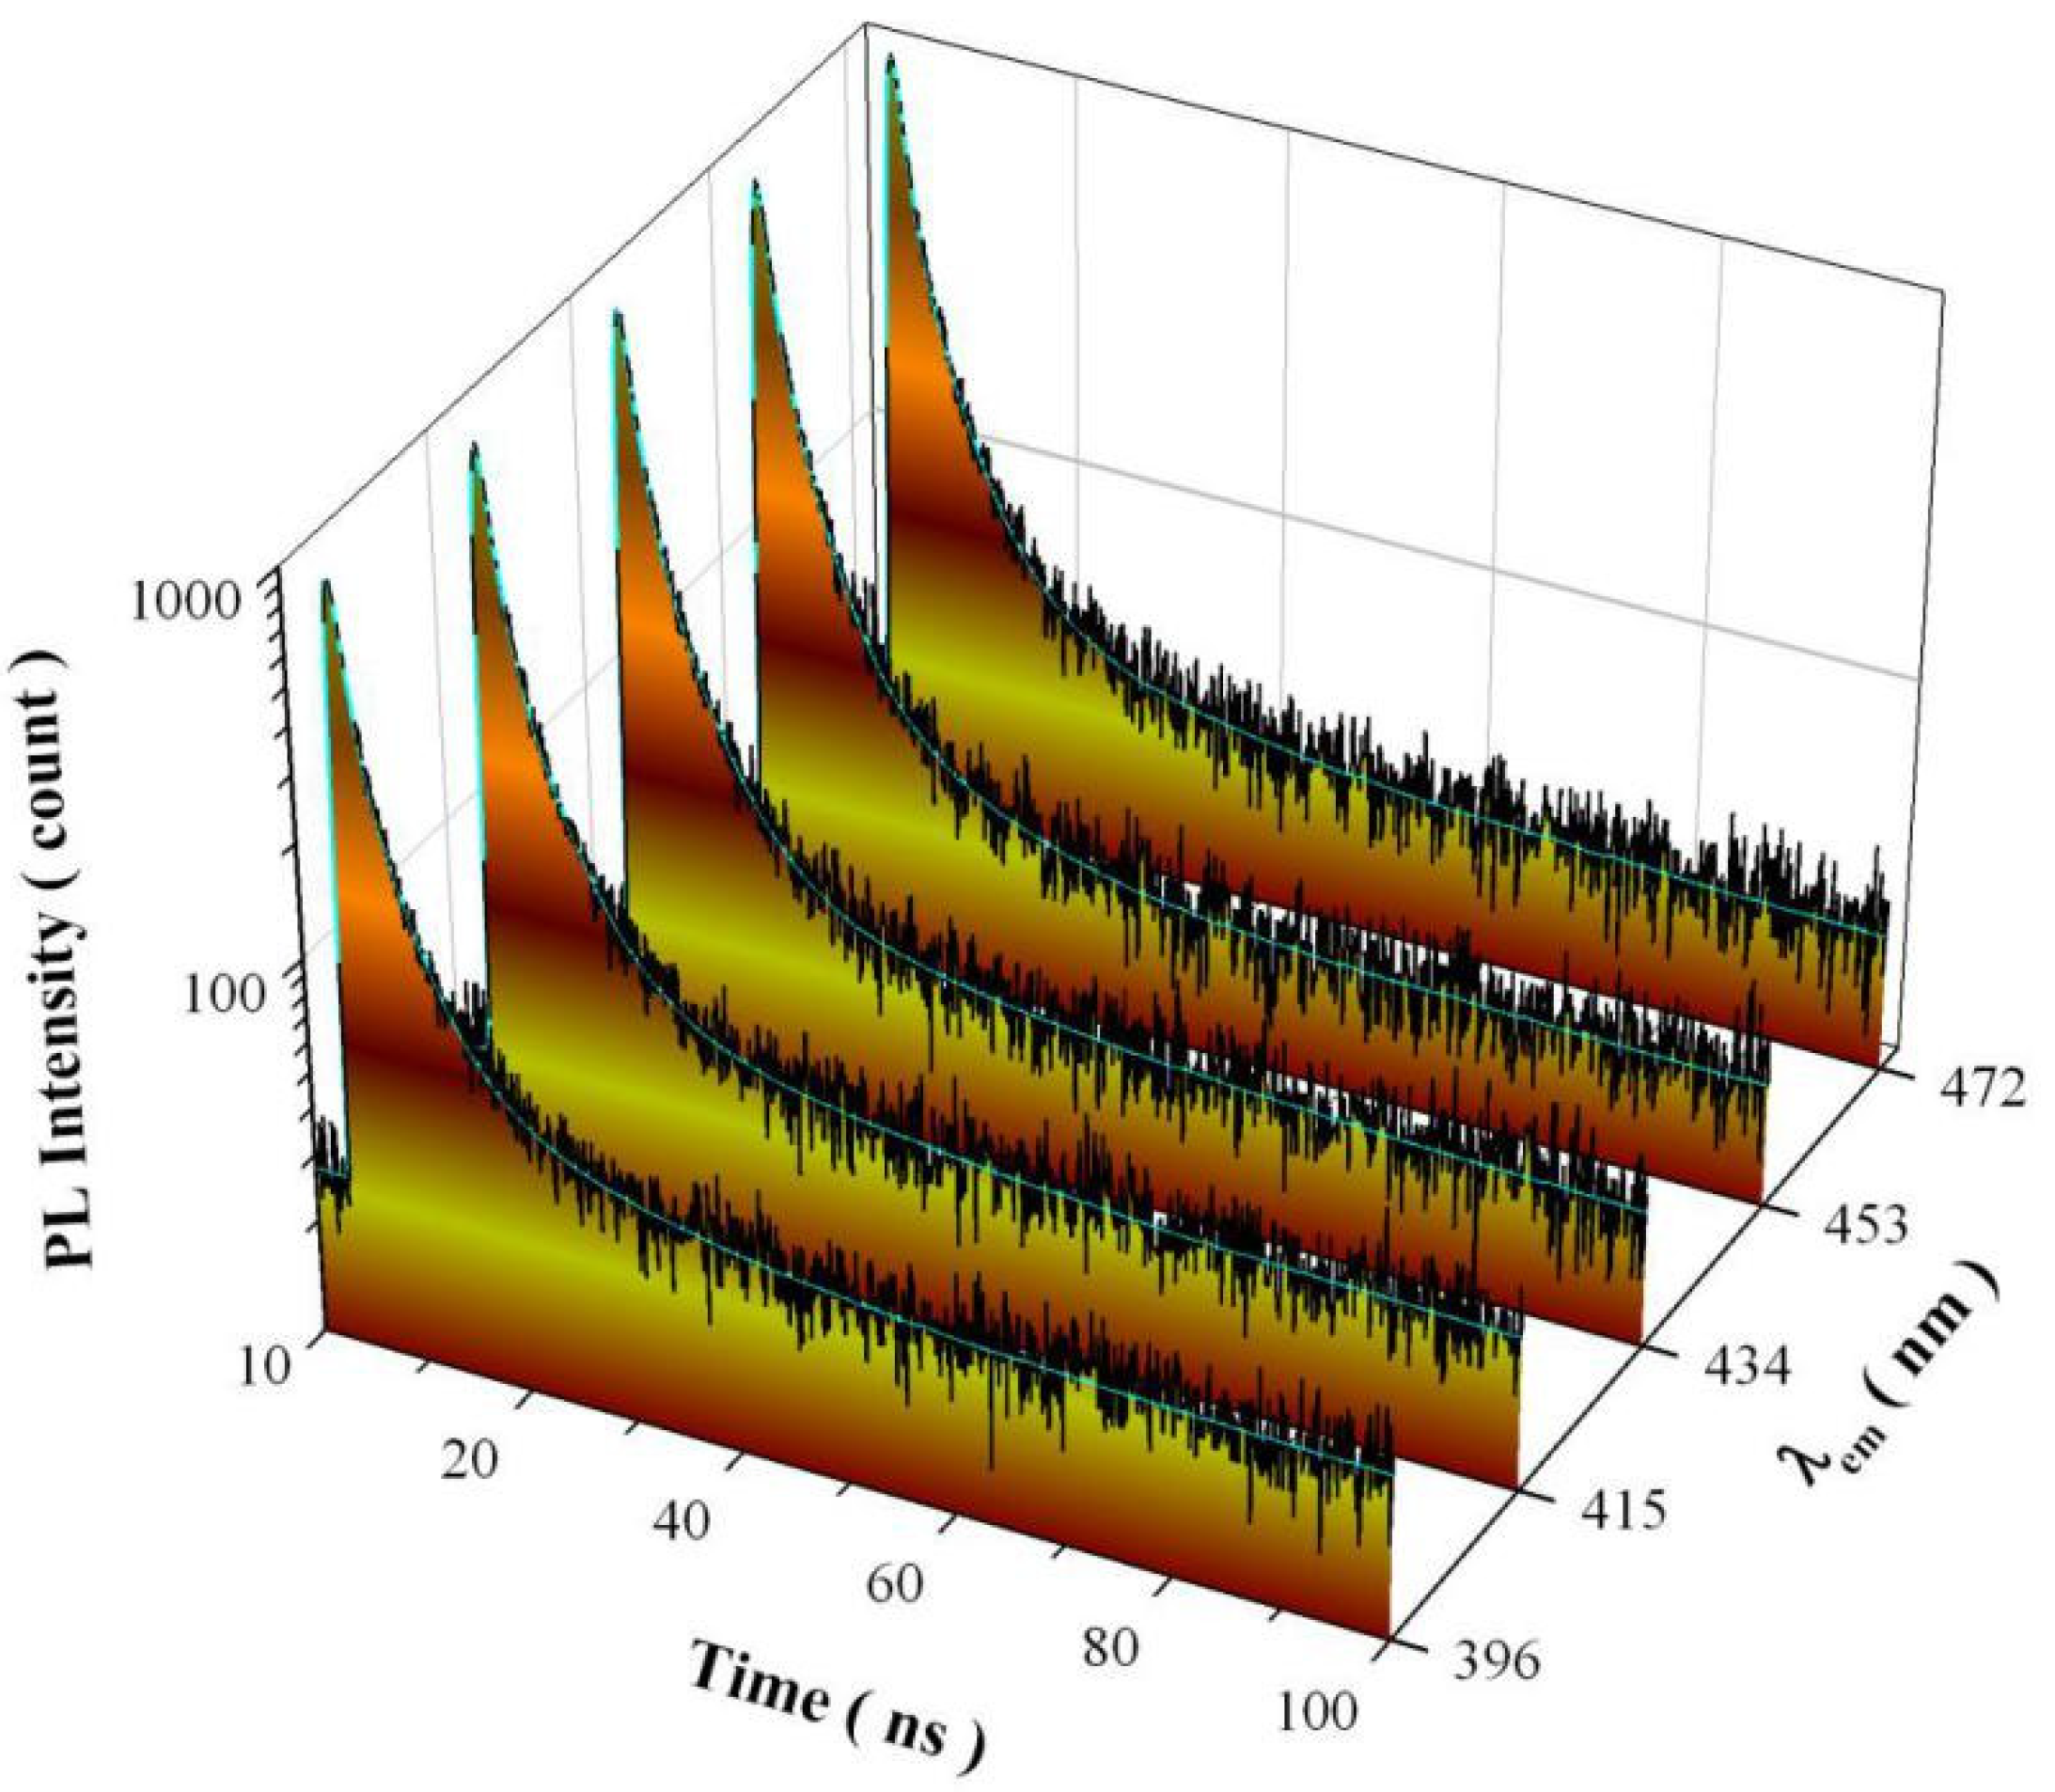
As discussed above, undoped SrAl2O4 possesses three distinctly different paths for radiative recombination, which are namely described by process ④, process ⑤, and the combined process of ⑥ with ⑤. If so, there should be three decay components in the PL decay curve of undoped SrAl2O4. Figure 10 shows the PL decay curves (black) and exponential reconvolution fits (cyan) of undoped SrAl2O4 at detection wavelengths of 396, 415, 434, 453, and 472 nm, respectively. The excitation is the 320 nm pulsed light with a pulse period of 100 ns. Instrument response function is measured for each PL decay curve. Our exponential reconvolution analysis reveals that each PL decay curve is best described by a tri-exponential decay model. Exponential reconvolution fitting parameters of the PL decay curves are summarized in Table 1 for undoped SrAl2O4. As can be seen in Table 1, there are three exponential decay components in each PL decay curve. For example, the time constants of the three exponential decays are 0.914, 3.705, and 18.335 ns for the PL decay of undoped SrAl2O4 measured at the detection wavelength of 396 nm. As described previously, the average lifetime can be calculated with parameters of the pre-exponential factors and time constants [18,21]. The averaged lifetime is calculated to be 6.49 ns for the PL decay curve of undoped SrAl2O4 measured at the detection wavelength of 396 nm. As the detection wavelength increases from 396 to 472 nm, the averaged lifetime of the PL decay curve varies in the range of 4.65–6.49 ns. Thus, the data in Figure 10 confirm the presence of three distinctly different recombination channels for the radiative recombinations in undoped SrAl2O4.
4. Summary
Undoped SrAl2O4 nanocrystals were prepared via the sol–gel combustion to investigate their PL and afterglow properties. The steady-state PL spectrum of undoped SrAl2O4 can be deconvoluted into two subbands peaking at 2.63 eV (472 nm) and 3.13 eV (396 nm), respectively. When the 325 nm irradiation of the helium–cadmium laser (13 mW) is turned off, the green afterglow from undoped SrAl2O4 is visible to the human eye, and it takes about 60 s for the luminance of the afterglow to reach the threshold value of 0.32 mcd/m2. The afterglow spectrum of undoped SrAl2O4 is broad in profile peaking at about 520 nm. The TL glow curve of undoped SrAl2O4 exhibits a broad profile with a peak at about 321 K. The trap depth is estimated to be 0.642 eV using Urbach’s formula. On the basis of density functional calculations for oxygen-deficient SrAl2O4 and strontium-deficient SrAl2O4, the midgap states introduced by oxygen and strontium vacancies are located at 2.84 eV and 0.45 eV above the valence band of SrAl2O4, respectively. Our data have demonstrated that both the PL and the afterglow of undoped SrAl2O4 are correlated with the oxygen and strontium vacancies in SrAl2O4. These findings help in exploring the afterglow mechanisms of SrAl2O4-based afterglow materials.
Supplementary Materials
The following are available online at https://www.mdpi.com/article/10.3390/nano11092331/s1, Figure S1: The first Brillouin zone for the monoclinic lattice of SrAl2O4. Figure S2: DFT calculated band structures and densities of states of SrAl2O4 after scissors operation: (a) defect-free SrAl2O4; (b) oxygen deficient SrAl2O4 (i.e., SrAl2O3.875); and (c) strontium-deficient SrAl2O4 (i.e., Sr0.875Al2O4). The exchange–correlation functional was treated within the GGA scheme by the Perdew–Burke–Ernzerhof potential.
Author Contributions
Methodology, Y.-M.H.; Formal Analysis, B.-G.Z.; Investigation, B.-G.Z.; Writing—Original Draft Preparation, B.-G.Z.; Writing—Review & Editing, Y.-M.H.; Funding Acquisition, Y.-M.H. Both authors have read and agreed to the published version of the manuscript.
Funding
This research was funded by National Natural Science Foundation of China under grant numbers 11574036 and 11604028.
Data Availability Statement
The data presented in this study are available on request from the corresponding author.
Conflicts of Interest
The authors declare no conflict of interest.
References
- Matsuzawa, T.; Aoki, Y.; Takeuchi, N.; Murayama, Y. A new long phosphorescent phosphor with high brightness, SrAl2O4: Eu2+,Dy3+. J. Electrochem. Soc. 1996, 143, 2670–2673. [Google Scholar] [CrossRef]
- Van den Eeckhout, K.; Smet, P.F.; Poelman, D. Persistent luminescence in Eu2+-doped compounds: A review. Materials 2010, 3, 2536–2566. [Google Scholar] [CrossRef] [Green Version]
- Huang, Y.M.; Ma, Q.L. Long afterglow of trivalent dysprosium doped strontium aluminate. J. Lumin. 2015, 160, 271–275. [Google Scholar] [CrossRef]
- Ma, Q.L.; Zhai, B.G.; Huang, Y.M. Effect of sol-gel combustion temperature on the luminescent properties of trivalent Dy doped SrAl2O4. Ceram. Int. 2015, 41, 5830–5835. [Google Scholar] [CrossRef]
- Vitola, V.; Millers, D.; Bite, I.; Smits, K.; Spustaka, A. Recent progress in understanding the persistent luminescence in SrAl2O4: Eu, Dy. Mater. Sci. Technol. 2019, 35, 1661–1677. [Google Scholar] [CrossRef]
- Wang, L.; Shang, Z.; Shi, M.; Cao, P.; Yang, B.; Zou, J. Preparing and testing the reliability of long–afterglow SrAl2O4: Eu2+, Dy3+ phosphor flexible films for temperature sensing. RSC Adv. 2020, 10, 11418. [Google Scholar] [CrossRef] [Green Version]
- Aitasalo, T.; Dereń, P.; Hölsä, J.; Jungner, H.; Krupa, J.C.; Lastusaari, M.; Legendziewicz, J.; Niittykoski, J.; Stręk, W.J. Persistent luminescence phenomena in materials doped with rare earth ions. J. Solid State Chem. 2003, 171, 114. [Google Scholar] [CrossRef]
- Dorenbos, P. Mechanism of persistent luminescence in Eu2+ and Dy3+ codoped aluminate and silicate compounds. J. Electrochem. Soc. 2005, 152, H107–H110. [Google Scholar] [CrossRef] [Green Version]
- Clabau, F.; Rocquefelte, X.; Jobic, S.; Deniard, P.; Whangbo, M.H.; Garcia, A.; Le Mercier, T. Mechanism of phosphorescence appropriate for the long-lasting phosphors Eu2+–doped SrAl2O4 with codopants Dy3+ and B3+. Chem. Mater. 2005, 17, 3904–3912. [Google Scholar] [CrossRef]
- Zhai, B.G.; Yang, L.; Ma, Q.L.; Liu, X.; Huang, Y.M. Mechanism of the prolongation of the green afterglow of SrAl2O4: Dy3+ caused by the use of H3BO3 flux. J. Lumin. 2017, 181, 78–87. [Google Scholar] [CrossRef]
- Zhai, B.G.; Huang, Y.M. Green photoluminescence and afterglow of Tb doped SrAl2O4. J. Mater. Sci. 2017, 52, 1813–1822. [Google Scholar] [CrossRef]
- Finley, E.; Tehrani, A.M.; Brgoch, J. Intrinsic defects drive persistent luminescence in monoclinic SrAl2O4:Eu2+. J. Phys. Chem. C 2018, 122, 16309–16314. [Google Scholar] [CrossRef]
- Pejakovic, D.A. Studies of the phosphorescence of polycrystalline hafnia. J. Lumin. 2010, 130, 1048–1054. [Google Scholar] [CrossRef]
- Behrh, G.K.; Isobe, M.; Massuyeau, F.; Serier-Brault, H.; Gordon, E.E.; Koo, H.-J.; Whangbo, M.-H.; Gautier, R.; Jobic, S. Oxygen-vacancy-induced midgap states responsible for the fluorescence and the long-lasting phosphorescence of the inverse spinel Mg (Mg, Sn) O4. Chem. Mater. 2017, 29, 1069–1075. [Google Scholar] [CrossRef]
- Zhai, B.G.; Huang, Y.M. Blue afterglow from undoped CaAl2O4. Europhys. Lett. 2019, 127, 17001. [Google Scholar] [CrossRef]
- Zhai, B.G.; Xu, H.; Zhuo, F.; Huang, Y.M. Annealing temperature dependent photoluminescence and afterglow of undoped CaAl2O4. J. Alloys Compd. 2020, 821, 153563. [Google Scholar] [CrossRef]
- Zhou, Z.; Jiang, K.; Chen, N.; Xie, Z.; Lei, B.; Zhuang, J.; Zhang, X.; Liu, Y.; Hu, C. Room temperature long afterglow from boron oxide: A boric acid calcined product. Mater. Lett. 2020, 276, 128226. [Google Scholar] [CrossRef]
- Zhai, B.G.; Xu, H.; Zhang, Q.; Huang, Y.M. Blue photoluminescence and cyan-colored afterglow of undoped SrSO4 nanoplates. ACS Omega 2021, 6, 10129–10140. [Google Scholar] [CrossRef]
- Zhai, B.G.; Ma, Q.L.; Yang, L.; Huang, Y.M. Synthesis and optical properties of Tb-doped pentazinc dimolybdate pentahydrate. Results Phys. 2017, 7, 3991–4000. [Google Scholar] [CrossRef]
- Zhai, B.G.; Ma, Q.L.; Yang, L.; Huang, Y.M. Effects of sintering temperature on the morphology and photoluminescence of Eu3+ doped zinc molybdenum oxide hydrate. J. Nanomater. 2018, 2018, 7418508. [Google Scholar] [CrossRef] [Green Version]
- Huang, Y.M.; Li, M.Y.; Yang, L.; Zhai, B.G. Eu2+ and Eu3+ doubly doped ZnWO4 nanoplates with superior photocatalytic performance for dye degradation. Nanomaterials 2018, 8, 765. [Google Scholar] [CrossRef] [Green Version]
- Yamashita, N.; Hamada, T.; Takada, M.; Katsuki, M.; Nakagawa, M. Photoluminescence and thermoluminescence of MgSO4, CaSO4, SrSO4 and BaSO4 powder phosphors activated with Tb3+. Jpn. J. Appl. Phys. 2001, 40, 6732–6736. [Google Scholar] [CrossRef]
- Perdew, J.P.; Burke, K.; Ernzerhof, M. Generalized gradient approximation made simple. Phys. Rev. Lett. 1996, 77, 3865–3868. [Google Scholar] [CrossRef] [Green Version]
- Chen, L.L.; Zhai, B.G.; Huang, Y.M. Rendering visible-light photocatalytic activity to undoped ZnO via intrinsic defects engineering. Catalysts 2020, 10, 1163. [Google Scholar] [CrossRef]
- Zhai, B.G.; Liu, D.; He, Y.; Yang, L.; Huang, Y.M. Tuning the photoluminescence of Eu2+ and Eu3+ co-doped SrSO4 through post annealing technique. J. Lumin. 2018, 194, 485–493. [Google Scholar] [CrossRef]
- Botterman, J.; Joos, J.J.; Smet, P.F. Trapping and detrapping in SrAl2O4: Eu, Dy persistent phosphors: Influence of excitation wavelength and temperature. Phys. Rev. B 2014, 90, 085147. [Google Scholar] [CrossRef] [Green Version]
- Ryu, H.; Bartwal, K.S. Defect structure and its relevance to photoluminescence in SrAl2O4: Eu2+, Nd3+. Phys. B Condens. Matter 2009, 404, 1714–1718. [Google Scholar] [CrossRef]
- Zhai, B.G.; Xu, H.; Huang, Y.M. Annealing temperature dependent afterglow of Tb3+ doped CaAl2O4. Opt. Mater. 2021, 112, 110739. [Google Scholar] [CrossRef]
- Zhai, B.G.; Ma, Q.L.; Huang, Y.M. Instability of the characteristic emissions of dopant Tb in ZnO hexagonal pyramids. J. Electron. Mater. 2017, 46, 947–957. [Google Scholar] [CrossRef]
- Zhai, B.G.; Yang, L.; Zhou, F.F.; Shi, J.S.; Huang, Y.M. Strong photo-oxidative capability of ZnWO4 nanoplates with highly exposed {0–11} facets. Catalysts 2019, 9, 178. [Google Scholar] [CrossRef] [Green Version]
- Mooney, J.; Kambhampati, P. Get the basics right: Jacobian conversion of wavelength and energy scales for quantitative analysis of emission spectra. J. Phys. Chem. Lett. 2013, 4, 3316–3318. [Google Scholar] [CrossRef]
- Palilla, F.C.; Levine, A.K.; Tomkus, M.R. Fluorescent properties of alkaline earth aluminates of the type MAl2O4 activated by divalent europium. J. Electrochem. Soc. 1968, 115, 642. [Google Scholar] [CrossRef]
- Kamada, M.; Murakami, J.; Ohno, N. Excitation spectra of a long-persistent phosphor SrAl2O4: Eu, Dy in vacuum ultraviolet region. J. Lumin. 2000, 87–89, 1042–1044. [Google Scholar] [CrossRef]
- Duan, X.; Yi, L.; Zhang, X.; Huang, S. Size–dependent optical properties of nanoscale and bulk long persistent phosphor SrAl2O4: Eu2+, Dy3+. J. Nanomater. 2015, 2015, 298692. [Google Scholar] [CrossRef] [Green Version]
- Hassinen, J.; Hölsä, J.; Niittykoski, J.; Laamanen, T.; Lastusaari, M.; Malkamäki, M.; Novák, P. UV–VUV spectroscopy of rare earth doped persistent luminescence materials. Opt. Mater. 2009, 31, 1751–1754. [Google Scholar] [CrossRef]
- Zhai, B.G.; Ma, Q.L.; Xiong, R.; Li, X.Z.; Huang, Y.M. Blue-green afterglow of BaAl2O4: Dy3+ phosphors. Mater. Res. Bull. 2016, 75, 1–6. [Google Scholar] [CrossRef]
- Zhai, B.G.; Yang, L.; Huang, Y.M. Intrinsic defect engineering in Eu3+ doped ZnWO4 for annealing temperature tunable photoluminescence. Nanomaterials 2019, 9, 99. [Google Scholar] [CrossRef] [Green Version]
- Zhai, B.G.; Yang, L.; Ma, Q.L.; Huang, Y.M. Growth of ZnMoO4 nanowires via vapor deposition in air. Mater. Lett. 2017, 188, 119–122. [Google Scholar] [CrossRef]
- Nazarov, M.; Mammadova, S.; Spassky, D.; Vielhauer, S.; Abdullayeva, S.; Huseynov, A.; Jabbarov, R. SrAl2O4: Eu2+ (1%) luminescence under UV, VUV and electron beam excitation. Opt. Mater. 2018, 75, 448–452. [Google Scholar] [CrossRef]
- González, R.; Monge, M.A.; Muñoz Santiuste, J.E.; Pareja, R.; Chen, Y.; Kotomin, E.; Kukla, M.M.; Popov, A.I. Photoconversion of F-type centers in thermochemically reduced MgO single crystals. Phys. Rev. B 1999, 59, 4786–4790. [Google Scholar] [CrossRef] [Green Version]
- Kotomin, E.A.; Popov, A.I.; Stashans, A. A novel model for F+ to F photoconversion in corundum crystals. J. Phys. Condens. Matter. 1994, 6, L569–L573. [Google Scholar] [CrossRef]
- Monge, M.A.; González, R.; Muñoz Santiuste, J.E.; Pareja, R.; Chen, Y.; Kotomin, E.A.; Popov, A.I. Photoconversion and dynamic hole recycling process in anion vacancies in neutron-irradiated MgO crystals. Phys. Rev. B 1999, 60, 3787–3791. [Google Scholar] [CrossRef]
- Ma, Q.L.; Xiong, R.; Huang, Y.M. Tunable photoluminescence of porous silicon by liquid crystal infiltration. J. Lumin. 2011, 131, 2053–2057. [Google Scholar] [CrossRef]
- Ma, Q.L.; Zhai, B.G.; Huang, Y.M. Sol–gel derived ZnO/porous silicon composites for tunable photoluminescence. J. Sol–Gel Sci. Technol. 2012, 64, 110–116. [Google Scholar] [CrossRef]
- Chung, K.S.; Lee, J.I.; Kim, J.L. A computer program for the deconvolution of the thermoluminescence glow curves by employing the interactive trap model. Radiat. Meas. 2012, 47, 766–769. [Google Scholar] [CrossRef]
- Liu, B.; Gu, M.; Liu, X.; Huang, S.; Ni, C. Theoretical study of structural, electronic, lattice dynamical and dielectric properties of SrAl2O4. J. Alloys Compd. 2011, 509, 4300–4303. [Google Scholar] [CrossRef]
- Nazarov, M.; Brik, M.G.; Spassky, D.; Tsukerblat, B.; Nor Nazida, A.; Ahmad-Fauzi, M.N. Structural and electronic properties of SrAl2O4: Eu2+ from density functional theory calculations. J. Alloys Compd. 2013, 573, 6–10. [Google Scholar] [CrossRef]
- Hölsä, J.; Aitasalo, T.; Jungner, H.; Lastusaari, M.; Niittykoski, J.; Spano, G. Role of defect states in persistent luminescence materials. J. Alloys Compd. 2004, 374, 56–59. [Google Scholar] [CrossRef]
Figure 1.
(a) XRD pattern of undoped SrAl2O4 and its Rietveld refinement. Open circles: raw data; solid green curve: Rietveld diffractogram; solid pink curve: residue. (b) A supercell of SrAl2O4 consisting of Sr2+ ions situated in the channels of AlO4 tectrahedra. (c) Unit cell of SrAl2O4 showing the two crystallographically different Sr sites.
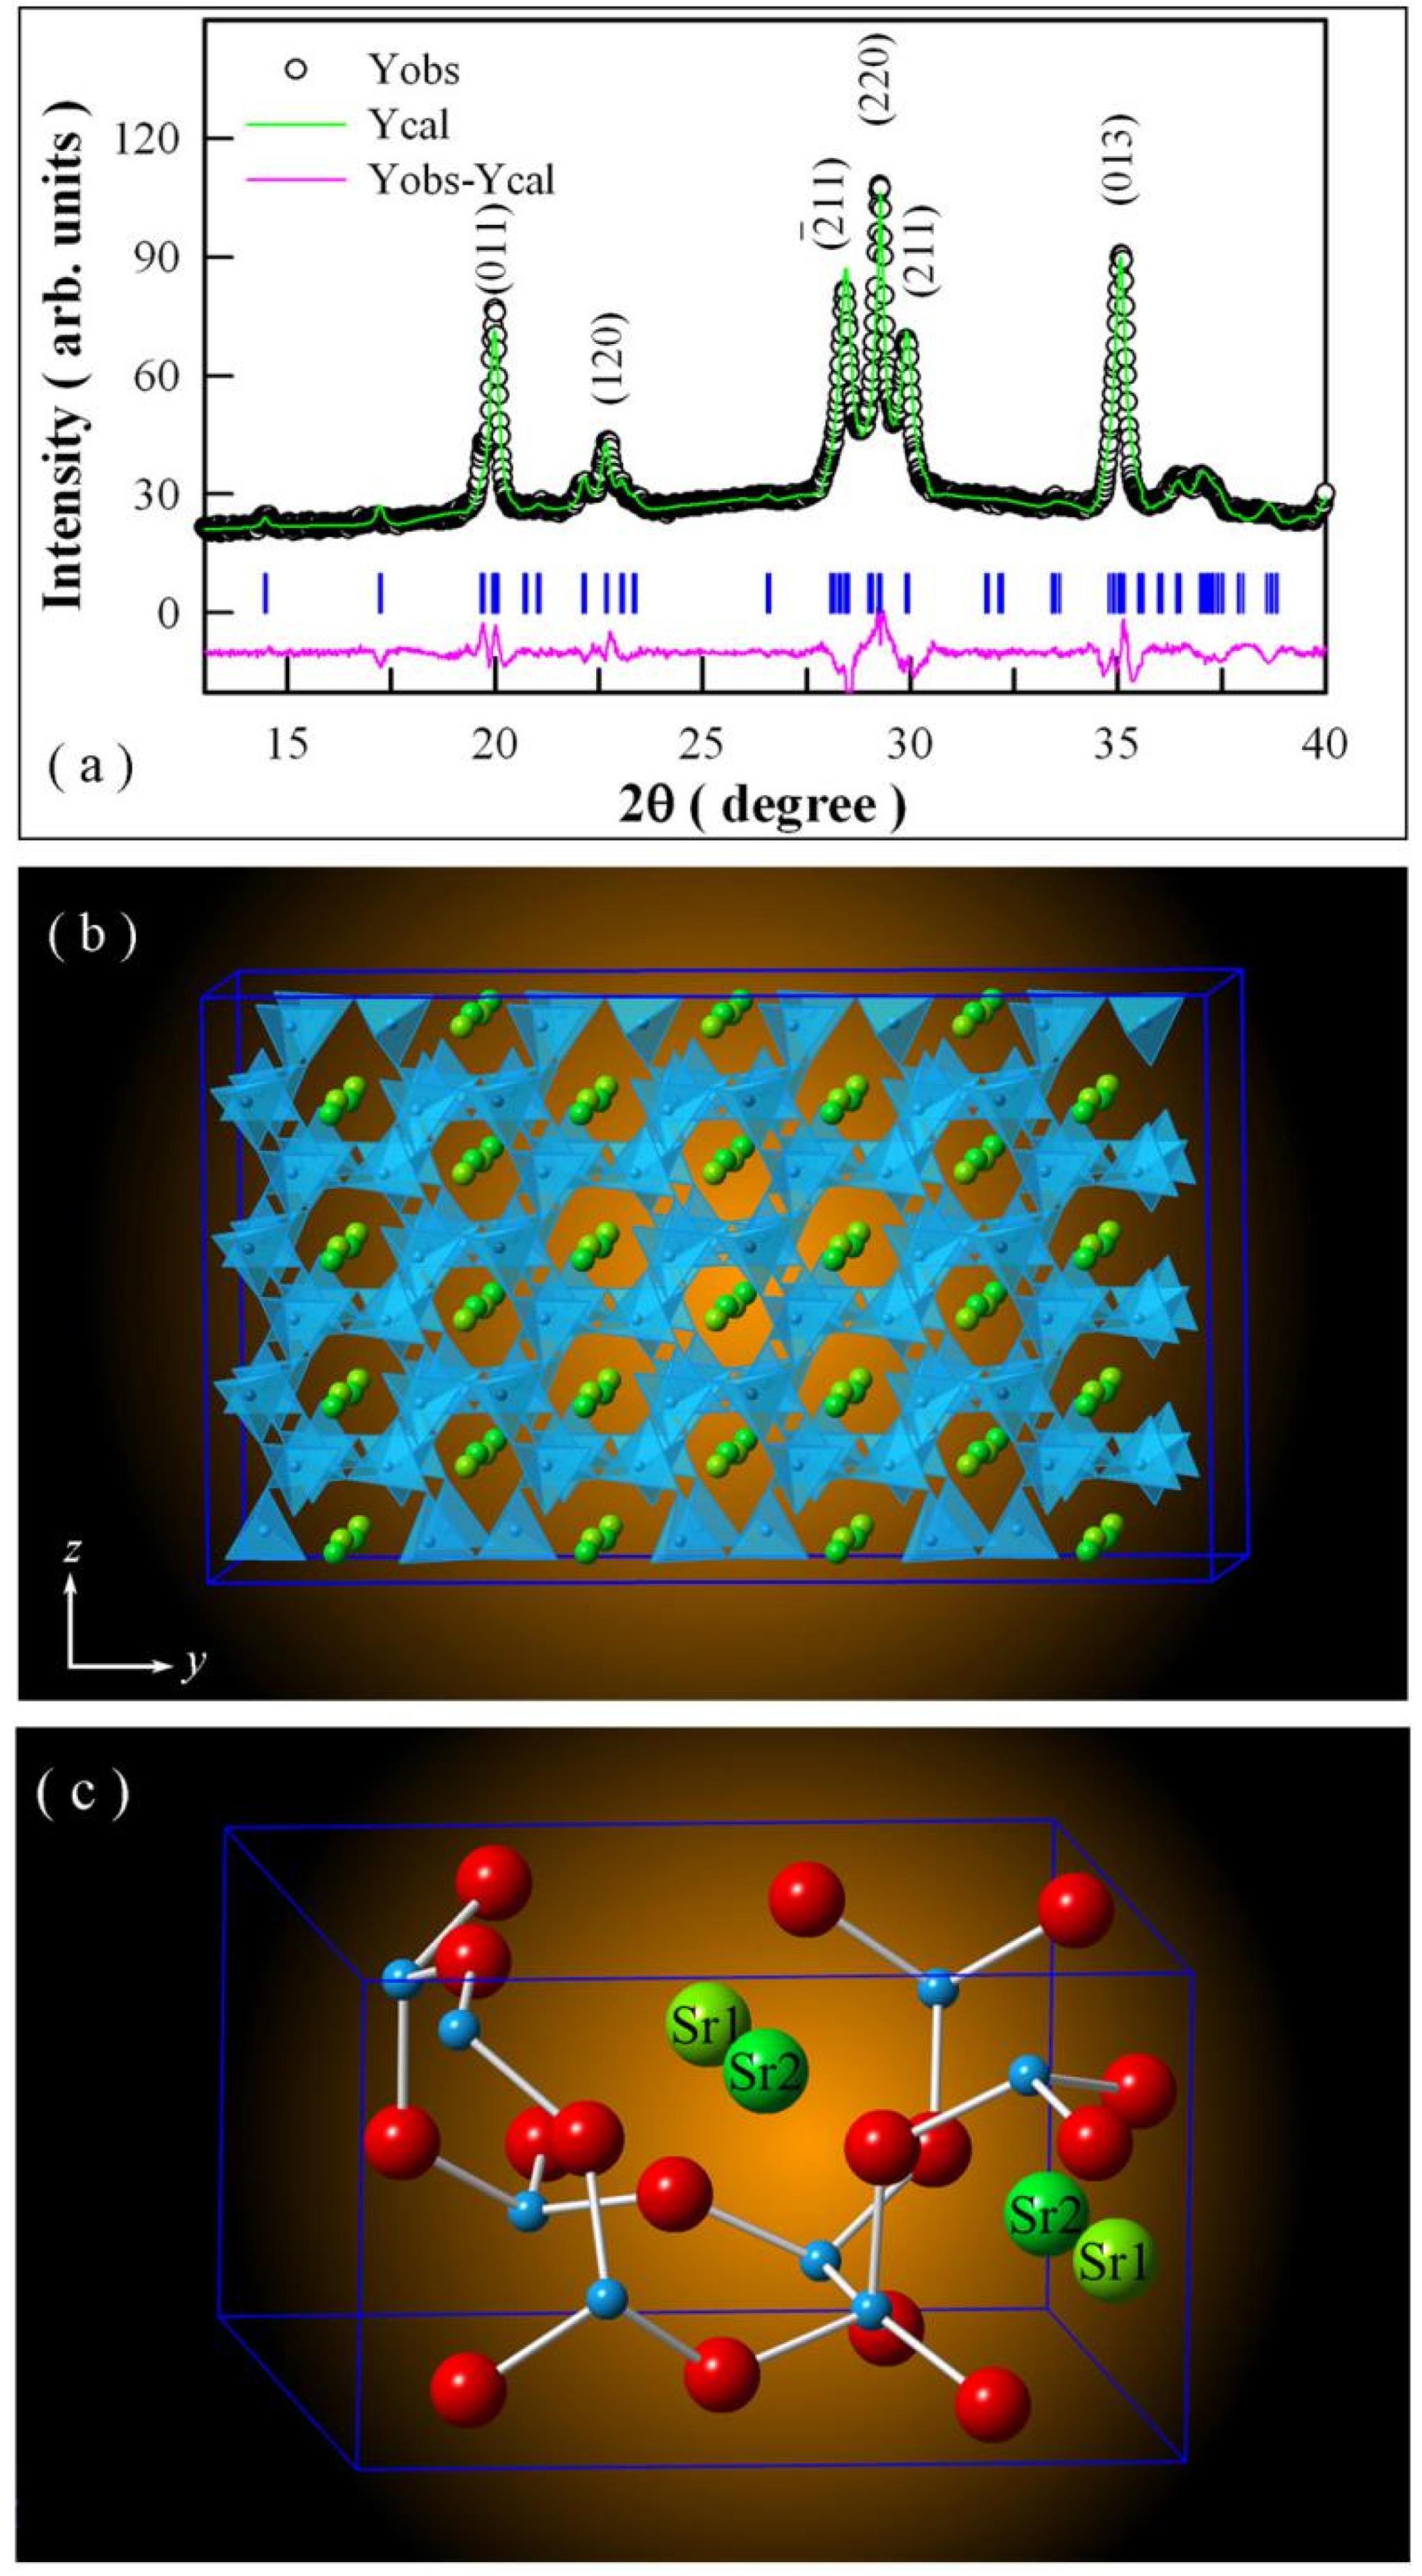
Figure 2.
(a) SEM micrograph of undoped SrAl2O4 showing the agglomerates; (b) TEM micrograph of undoped SrAl2O4 showing nanocrystals in an agglomerate; (c) High-resolution TEM micrograph of undoped SrAl2O4 showing the lattice of SrAl2O4 nanocrystals in an agglomerate.
Figure 2.
(a) SEM micrograph of undoped SrAl2O4 showing the agglomerates; (b) TEM micrograph of undoped SrAl2O4 showing nanocrystals in an agglomerate; (c) High-resolution TEM micrograph of undoped SrAl2O4 showing the lattice of SrAl2O4 nanocrystals in an agglomerate.
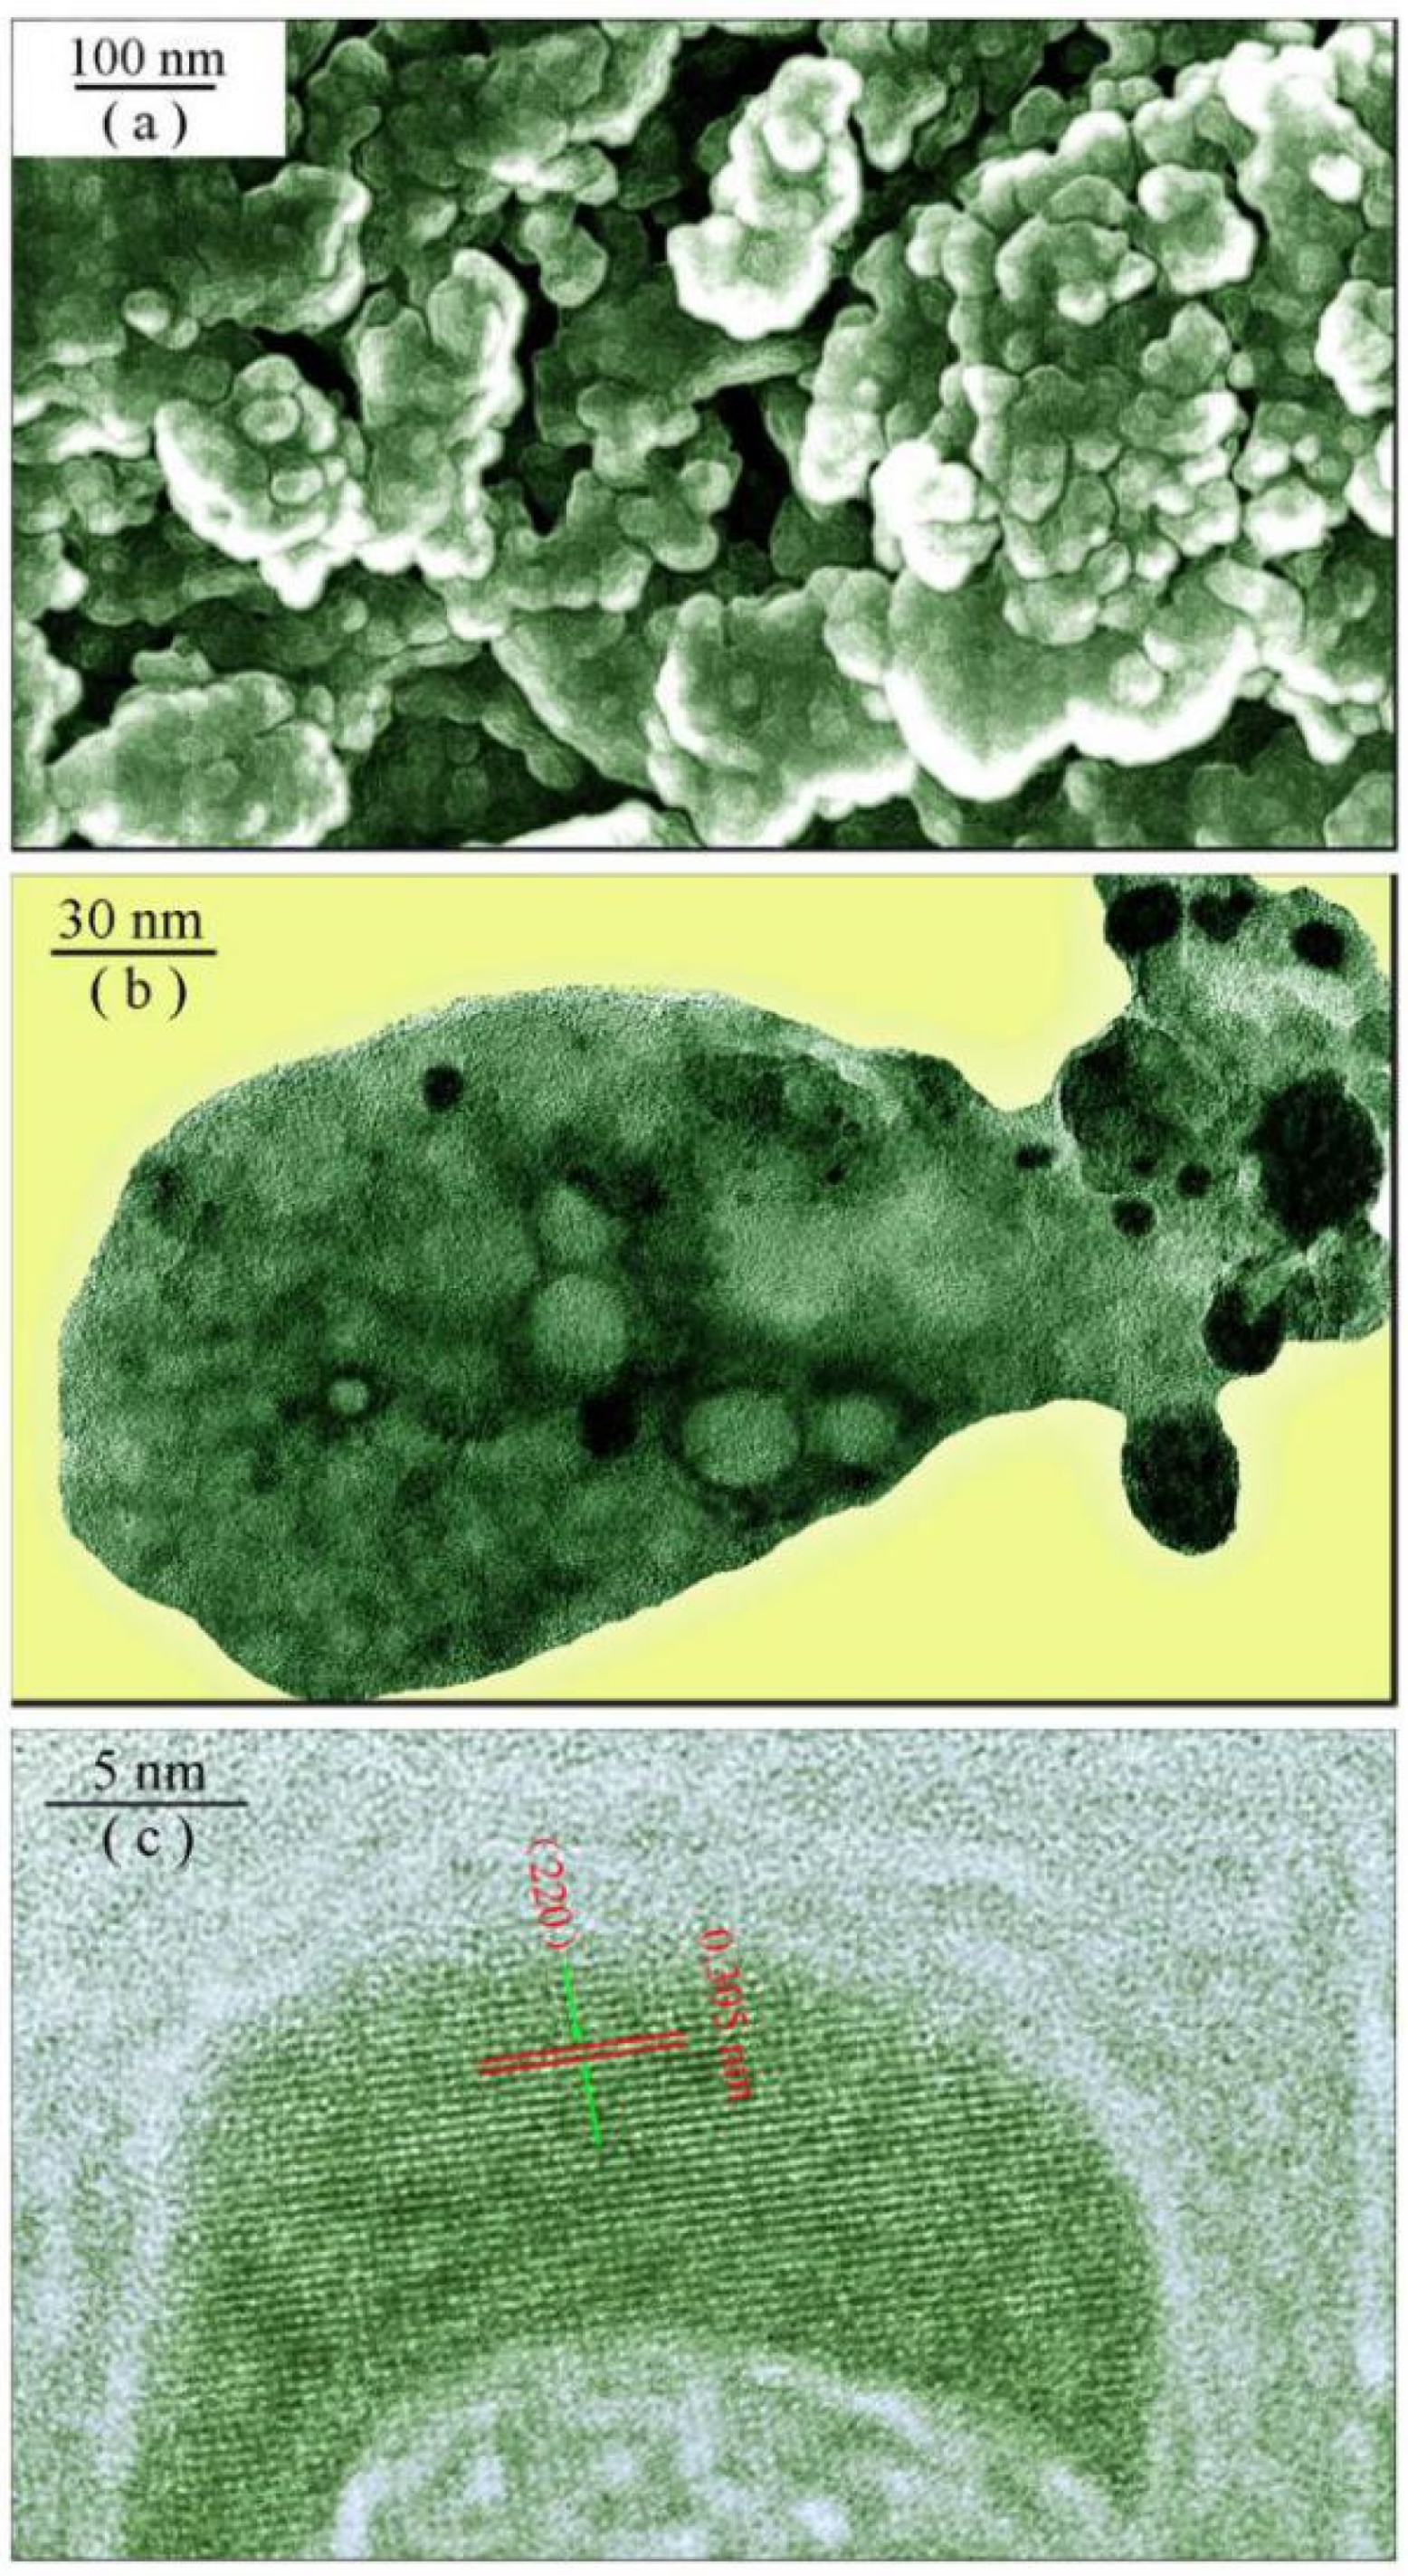
Figure 3.
EDX spectrum and elemental mapping of undoped SrAl2O4 phosphors: (a) EDX spectrum; (b) electronic image of the selected area for elemental mapping; (c) Sr map; (d) Al map; and (e) O map.
Figure 3.
EDX spectrum and elemental mapping of undoped SrAl2O4 phosphors: (a) EDX spectrum; (b) electronic image of the selected area for elemental mapping; (c) Sr map; (d) Al map; and (e) O map.
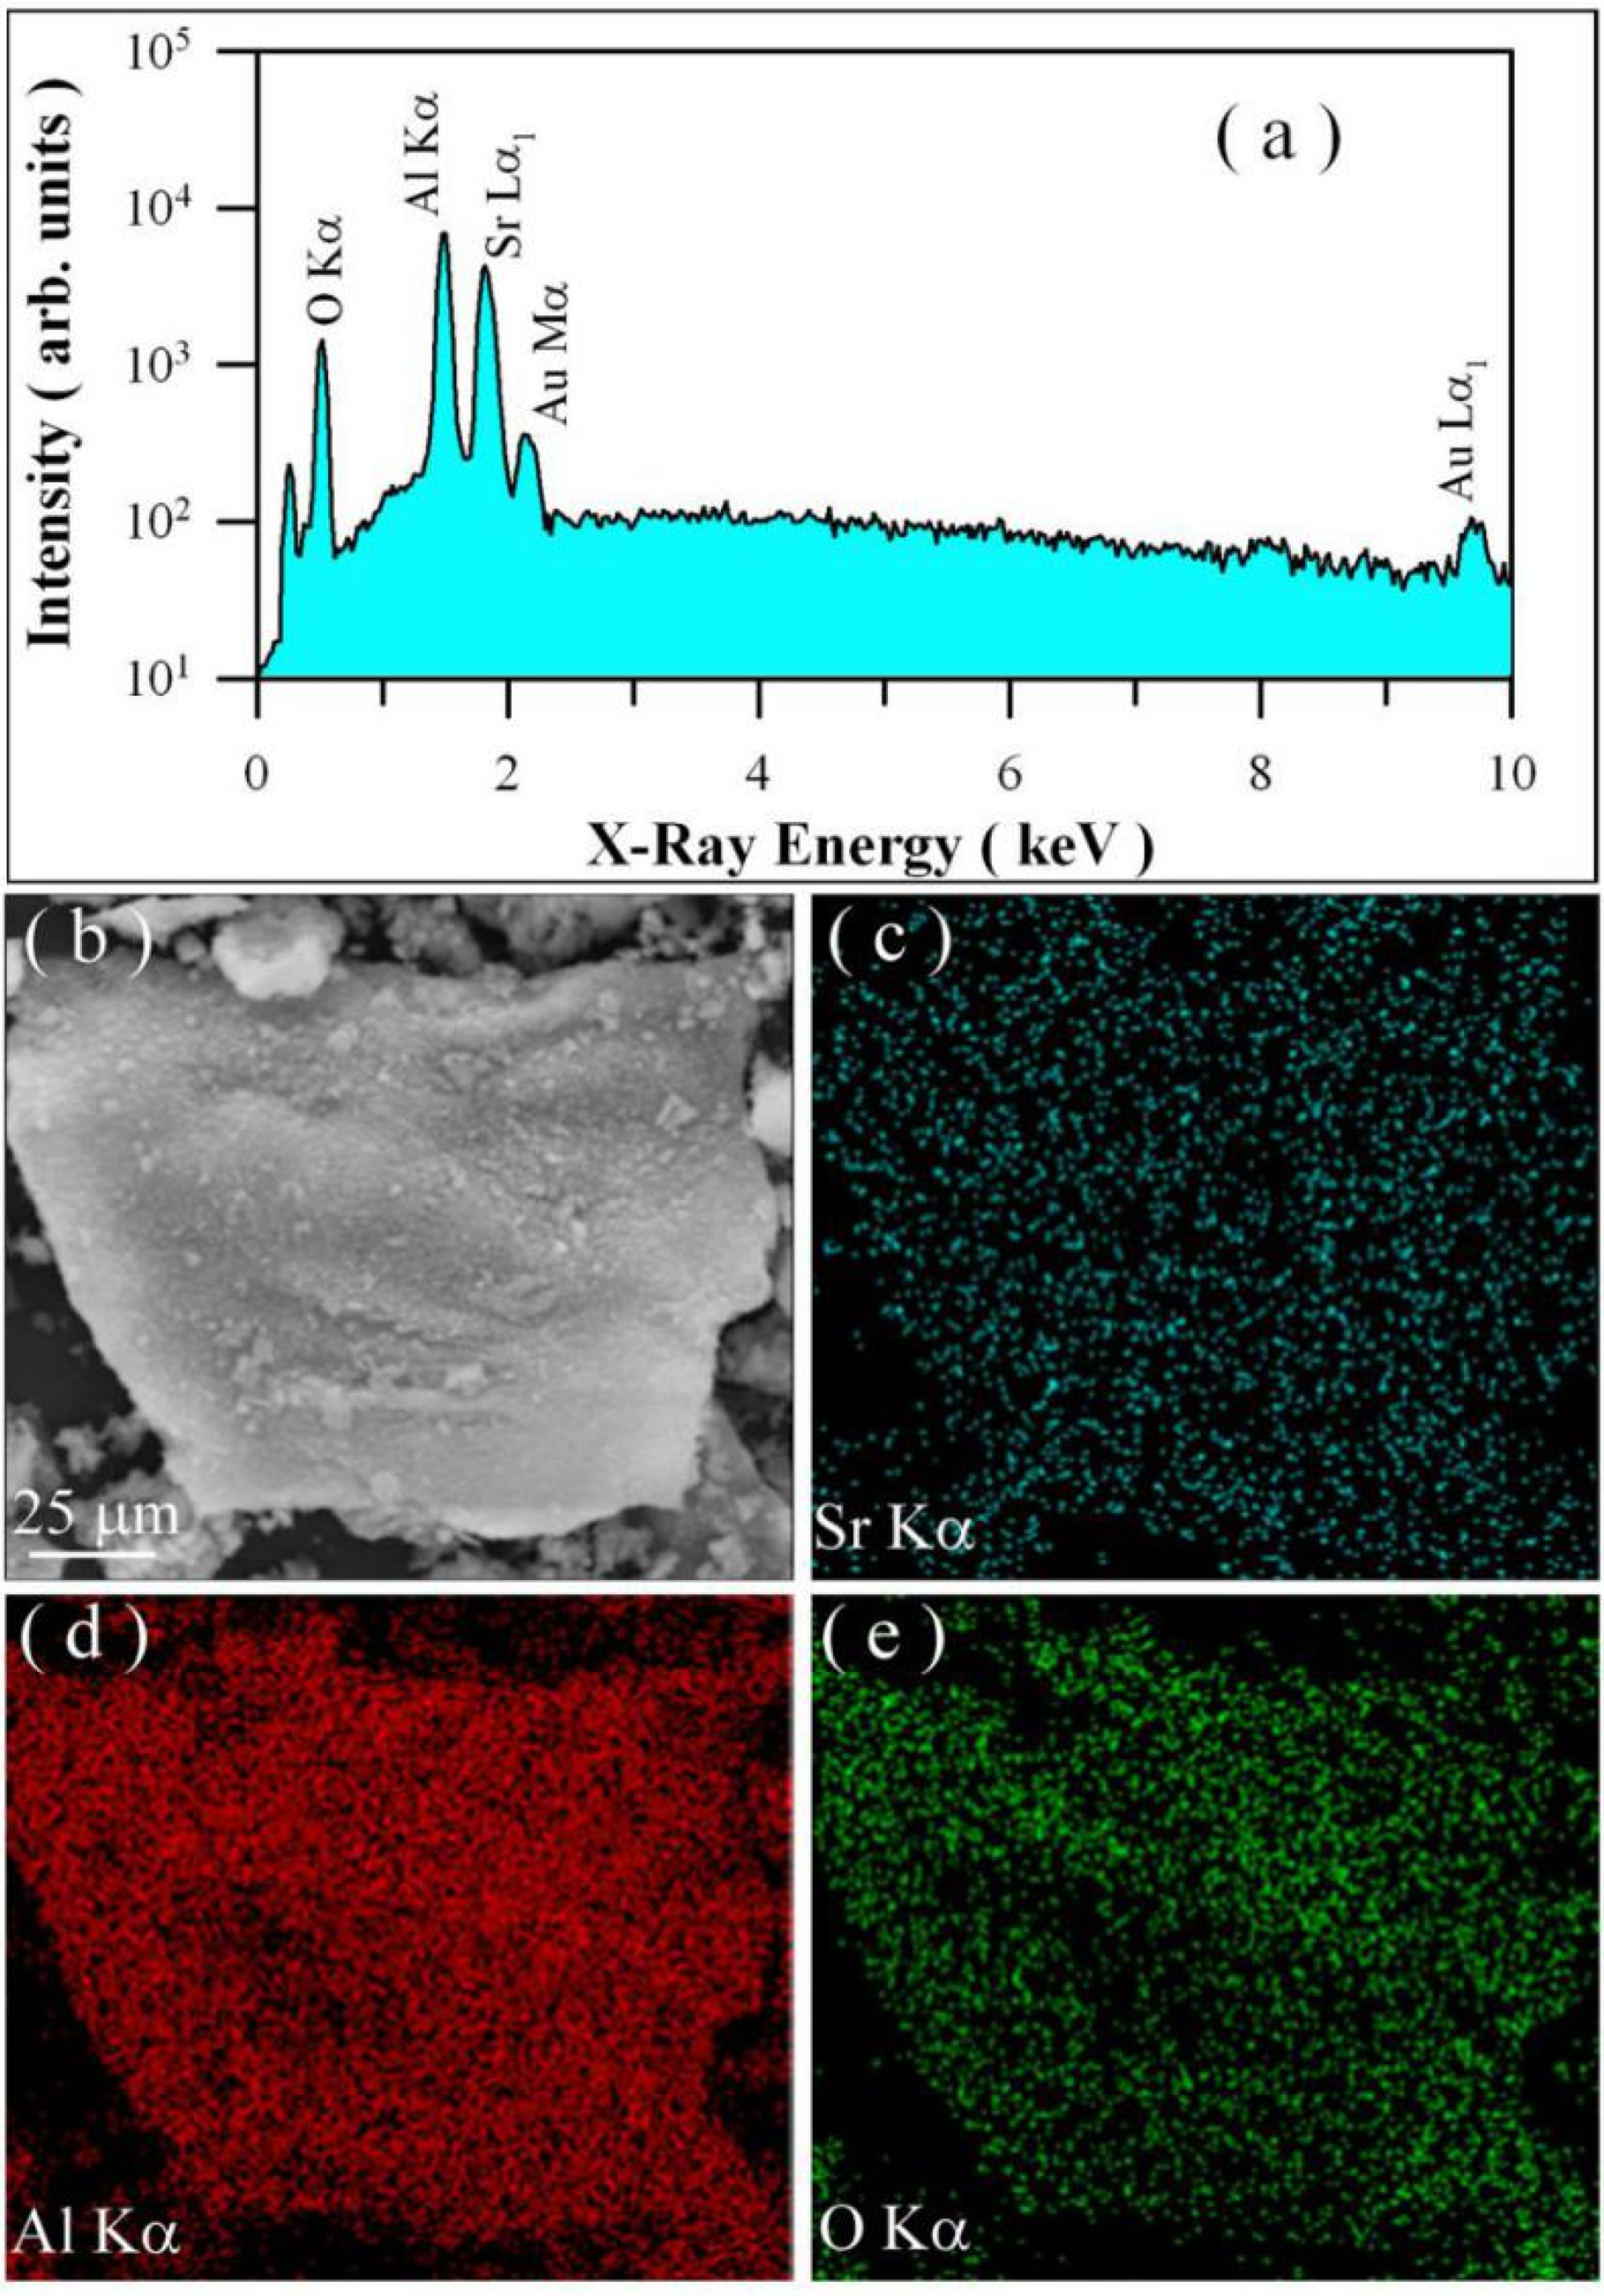
Figure 4.
(a) Steady-state PL spectrum of undoped SrAl2O4 in wavelength scale; (b) Steady-state PL spectrum of undoped SrAl2O4 in energy scale; and (c) Ultraviolet–vacuum ultraviolet synchrotron radiation excitation spectrum of undoped SrAl2O4 at room temperature. The emission wavelength is 520 nm.
Figure 4.
(a) Steady-state PL spectrum of undoped SrAl2O4 in wavelength scale; (b) Steady-state PL spectrum of undoped SrAl2O4 in energy scale; and (c) Ultraviolet–vacuum ultraviolet synchrotron radiation excitation spectrum of undoped SrAl2O4 at room temperature. The emission wavelength is 520 nm.
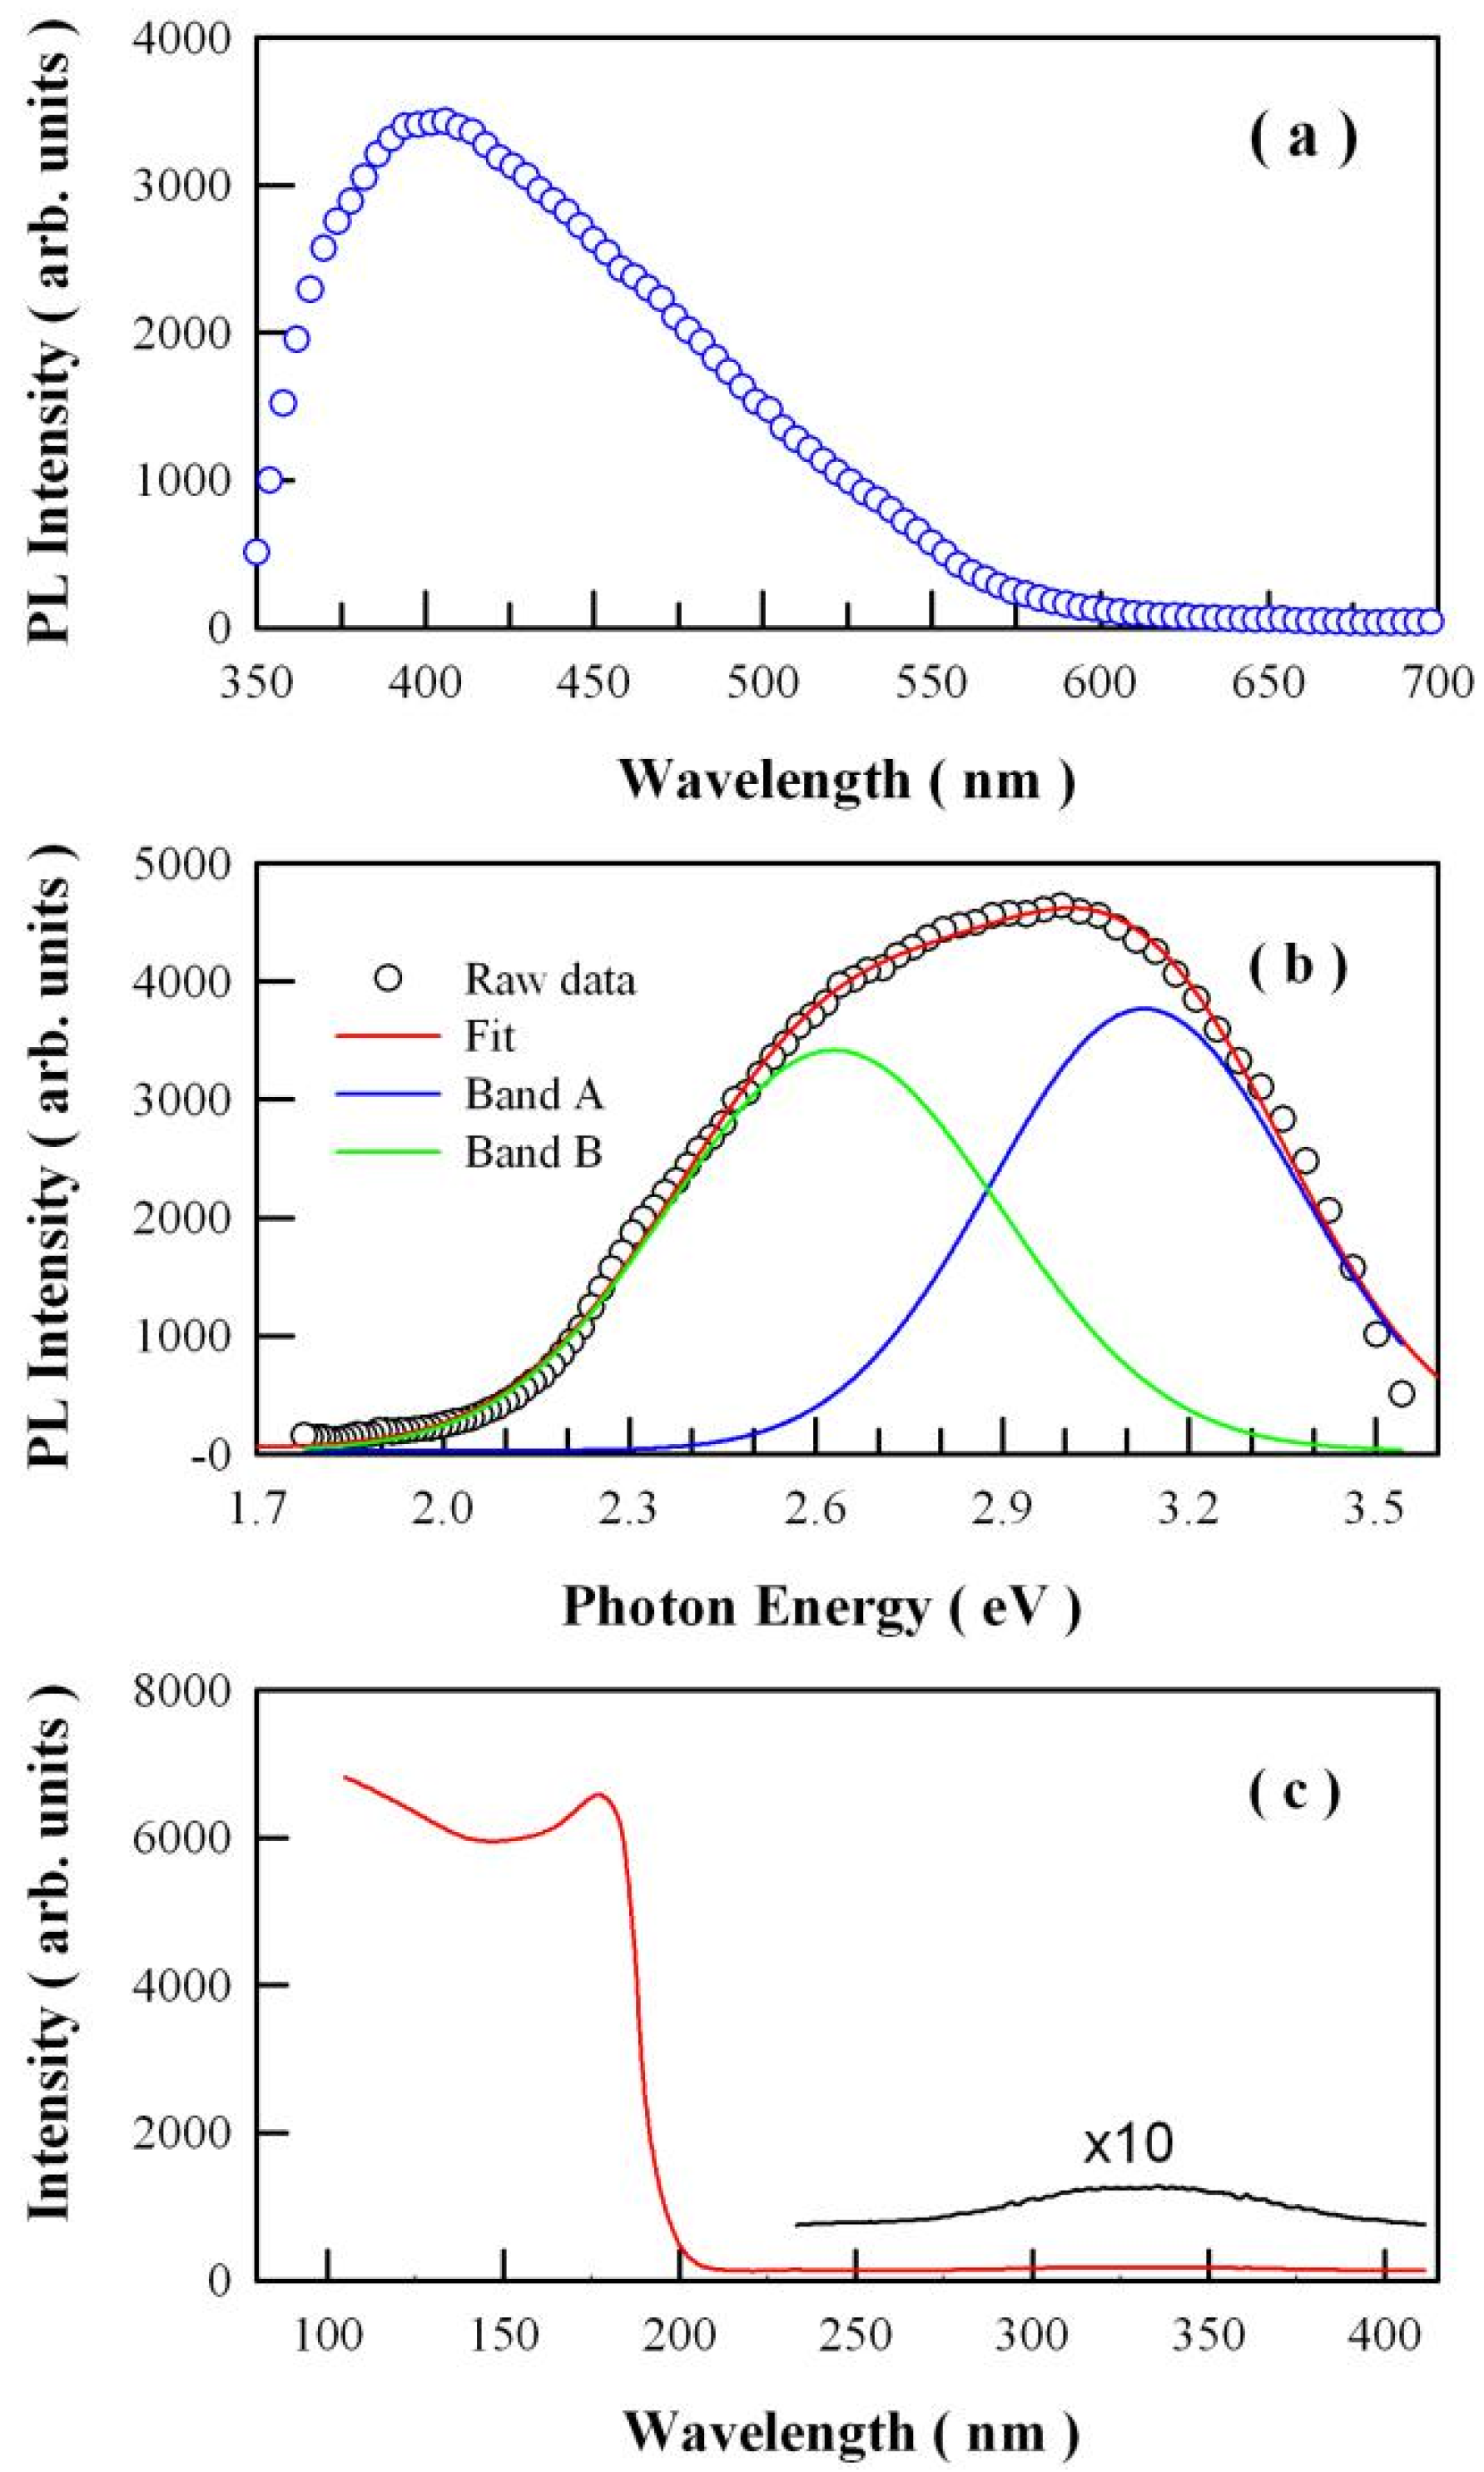
Figure 5.
(a) Afterglow spectrum of undoped SrAl2O4. Insets in the top panel: photographs of the undoped SrAl2O4 when the irradiation of an ultraviolet laser (325 nm, 13 mW) is turned on (left) and off (right). (b): Afterglow decay profile of undoped SrAl2O4, which was taken after exposure to ultraviolet laser of 325 nm for 5 min. Insets in the middle panel: afterglow photographs of the undoped SrAl2O4 taken at 0, 5, and 10 s after the extinction of the irradiation of the ultraviolet laser. (c) Afterglow spectra of undoped SrAl2O4 measured at different delay times after the extinction of the ultraviolet illumination of the He-Cd laser.

Figure 6.
(a) Thermoluminescence glow curve of undoped SrAl2O4 and its deconvolution with general order kinetics. The temperature rising rate was 2 K/min. (b) Thermoluminescence emission spectrum of undoped SrAl2O4 measured at different temperatures.
Figure 6.
(a) Thermoluminescence glow curve of undoped SrAl2O4 and its deconvolution with general order kinetics. The temperature rising rate was 2 K/min. (b) Thermoluminescence emission spectrum of undoped SrAl2O4 measured at different temperatures.
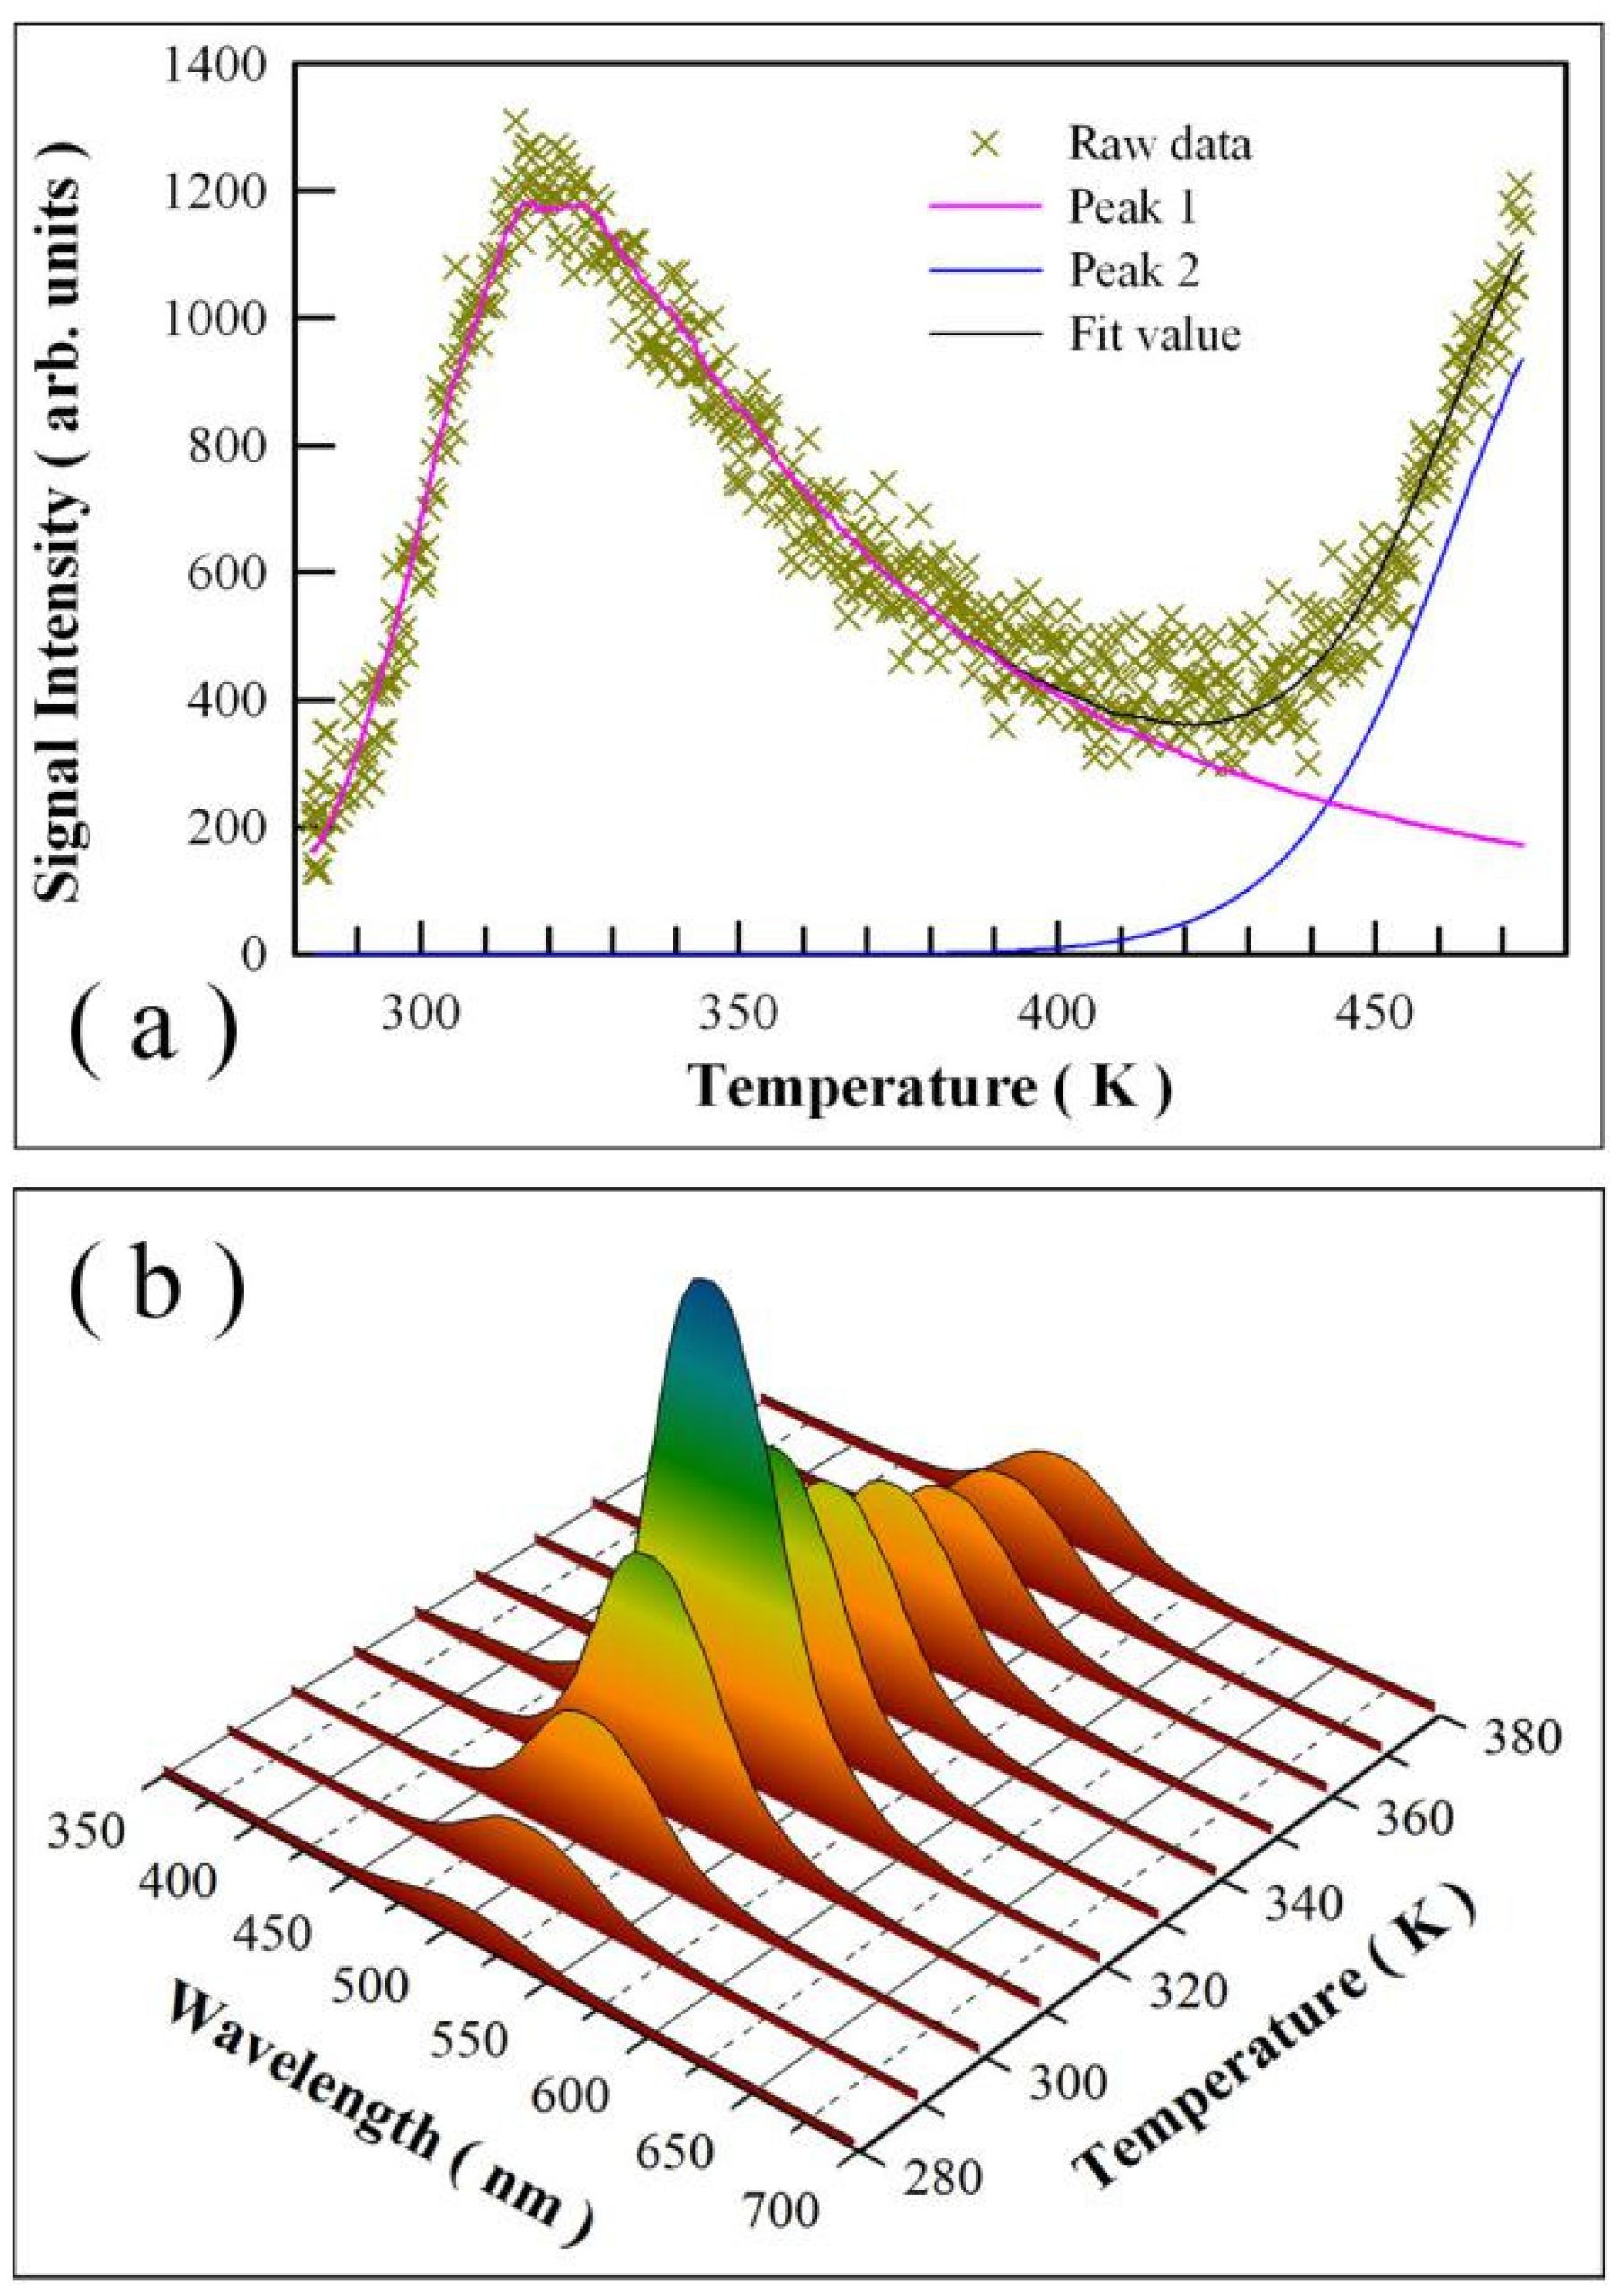
Figure 7.
DFT calculated band structures and densities of states of SrAl2O4: (a) defect-free SrAl2O4; (b) oxygen deficient SrAl2O4 (i.e., SrAl2O3.875); and (c) strontium-deficient SrAl2O4 (i.e., Sr0.875Al2O4). The exchange–correlation functional was treated within the GGA scheme by the Perdew–Burke–Ernzerhof potential.
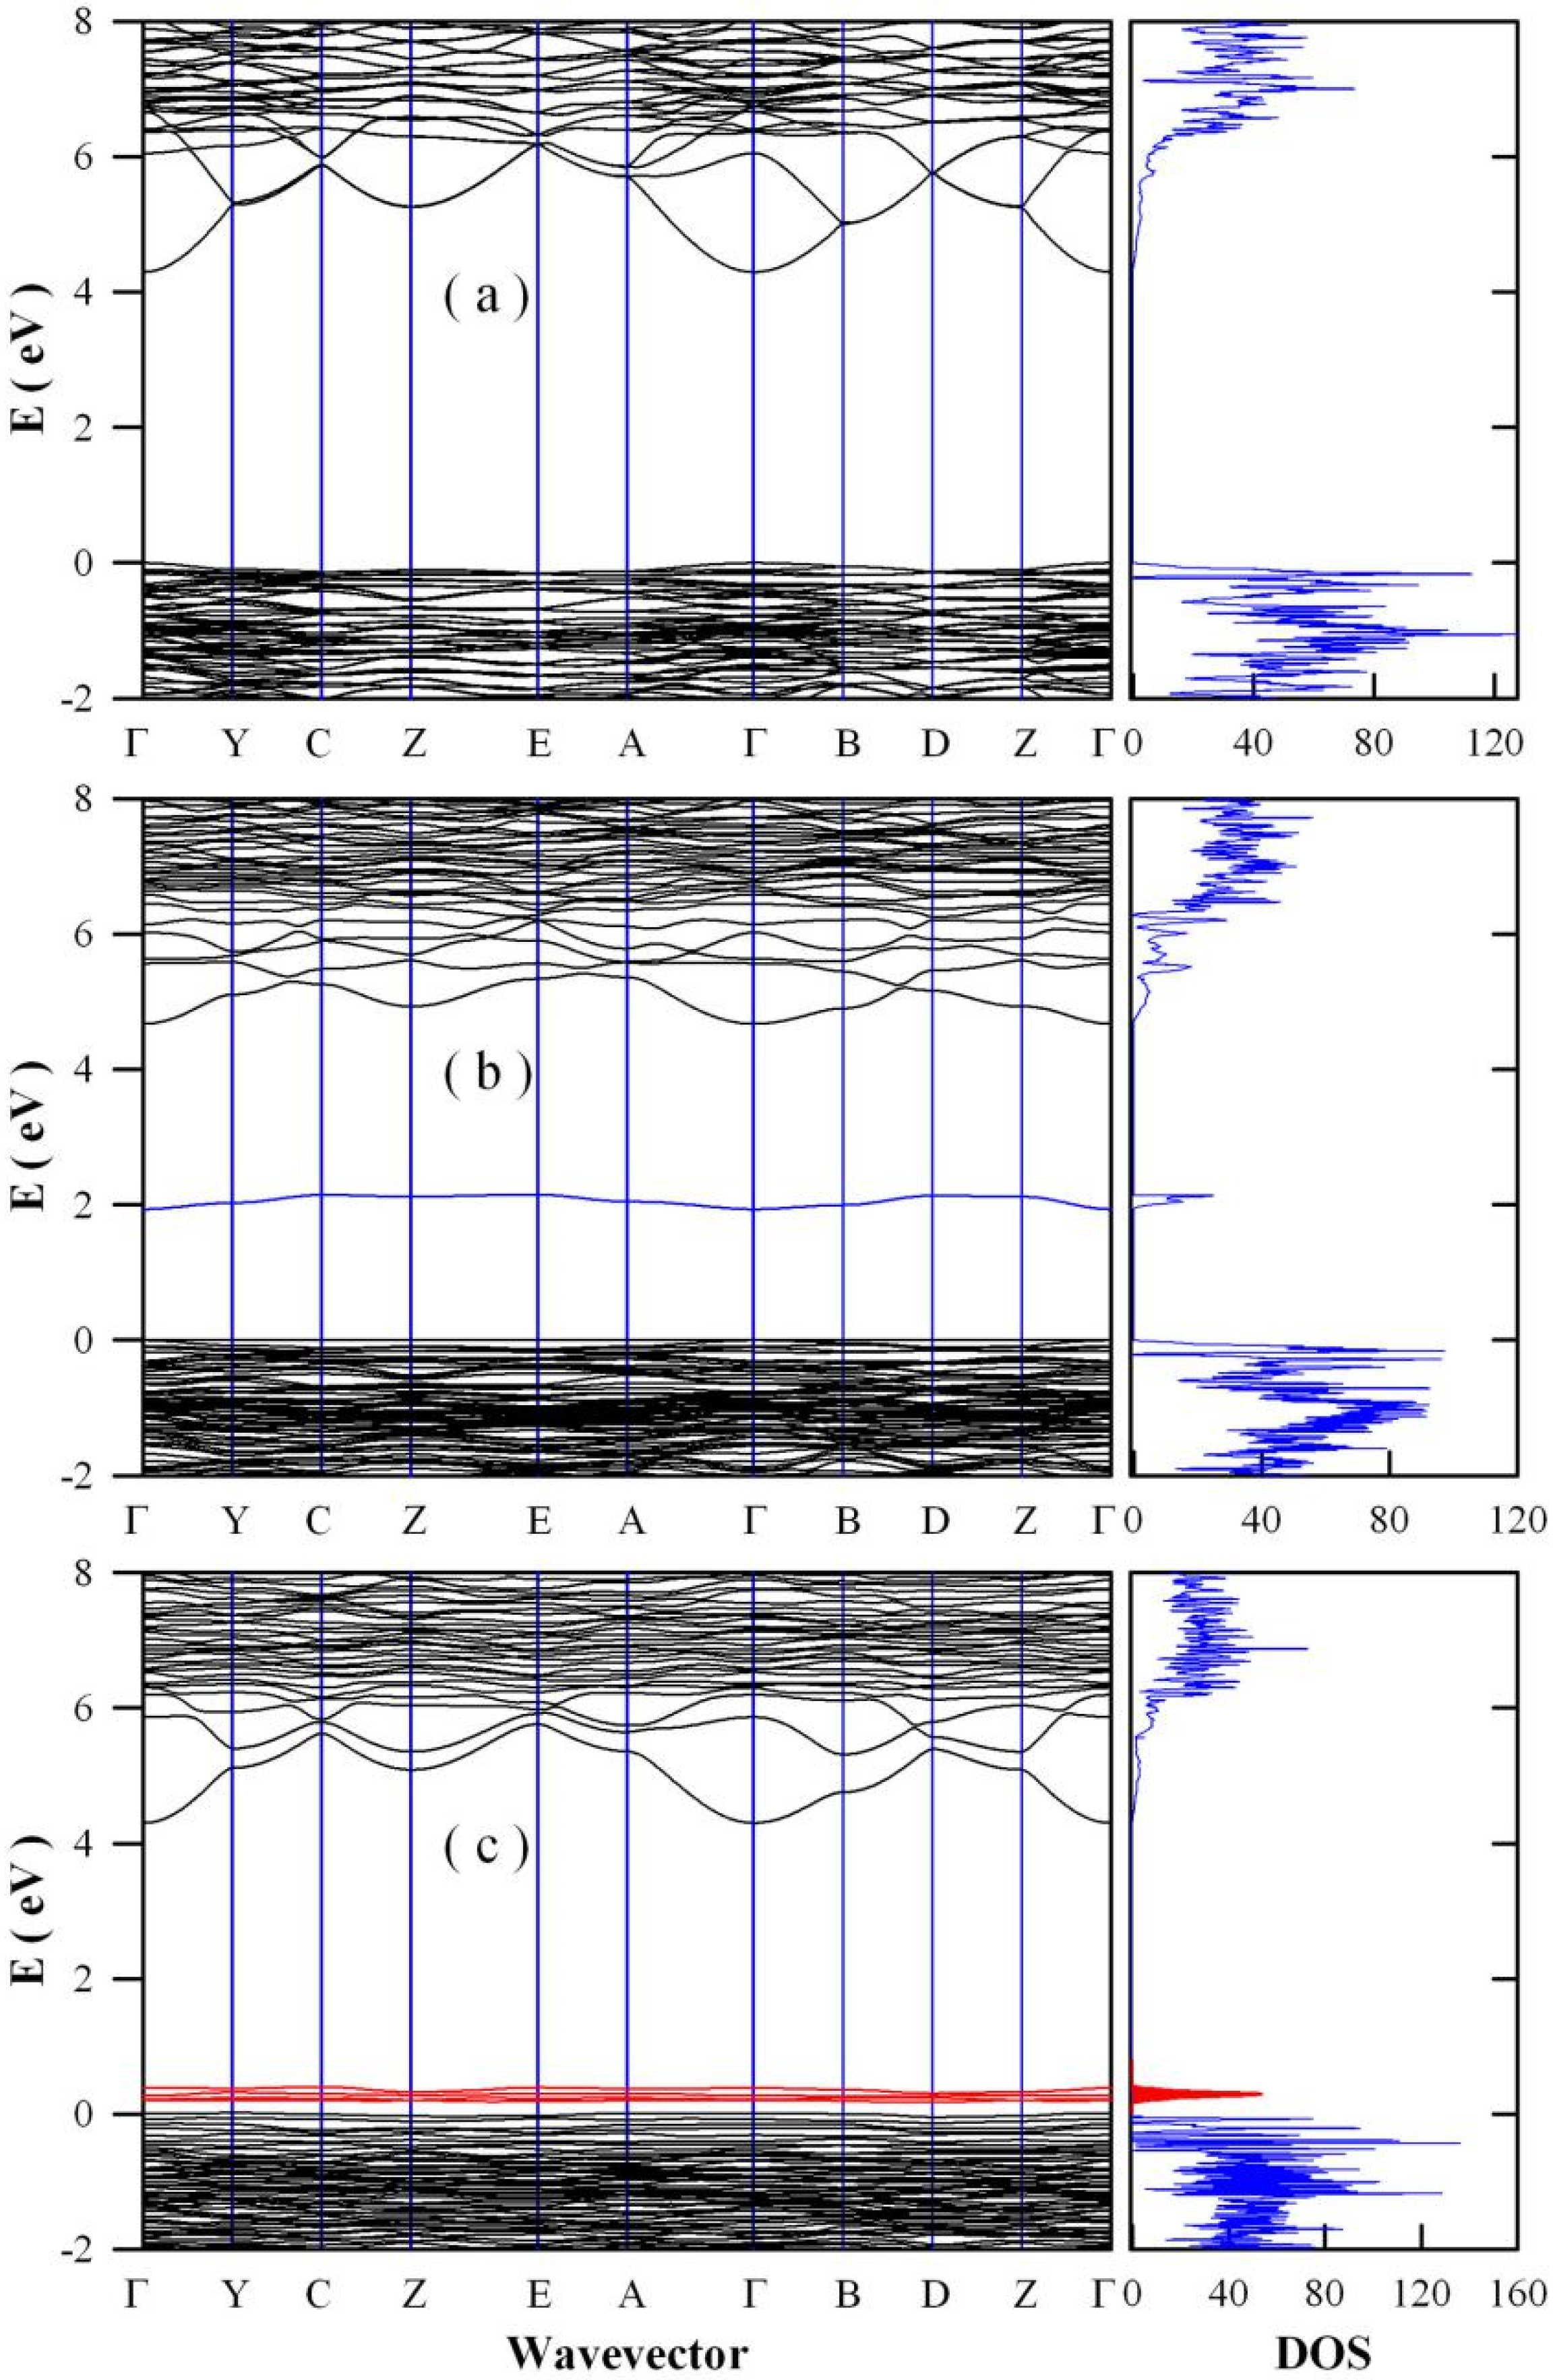
Figure 8.
EPR spectrum of undoped SrAl2O4 measured at room temperature. Microwave frequency: 9.856 GHz; microwave power: 20 mW.
Figure 8.
EPR spectrum of undoped SrAl2O4 measured at room temperature. Microwave frequency: 9.856 GHz; microwave power: 20 mW.
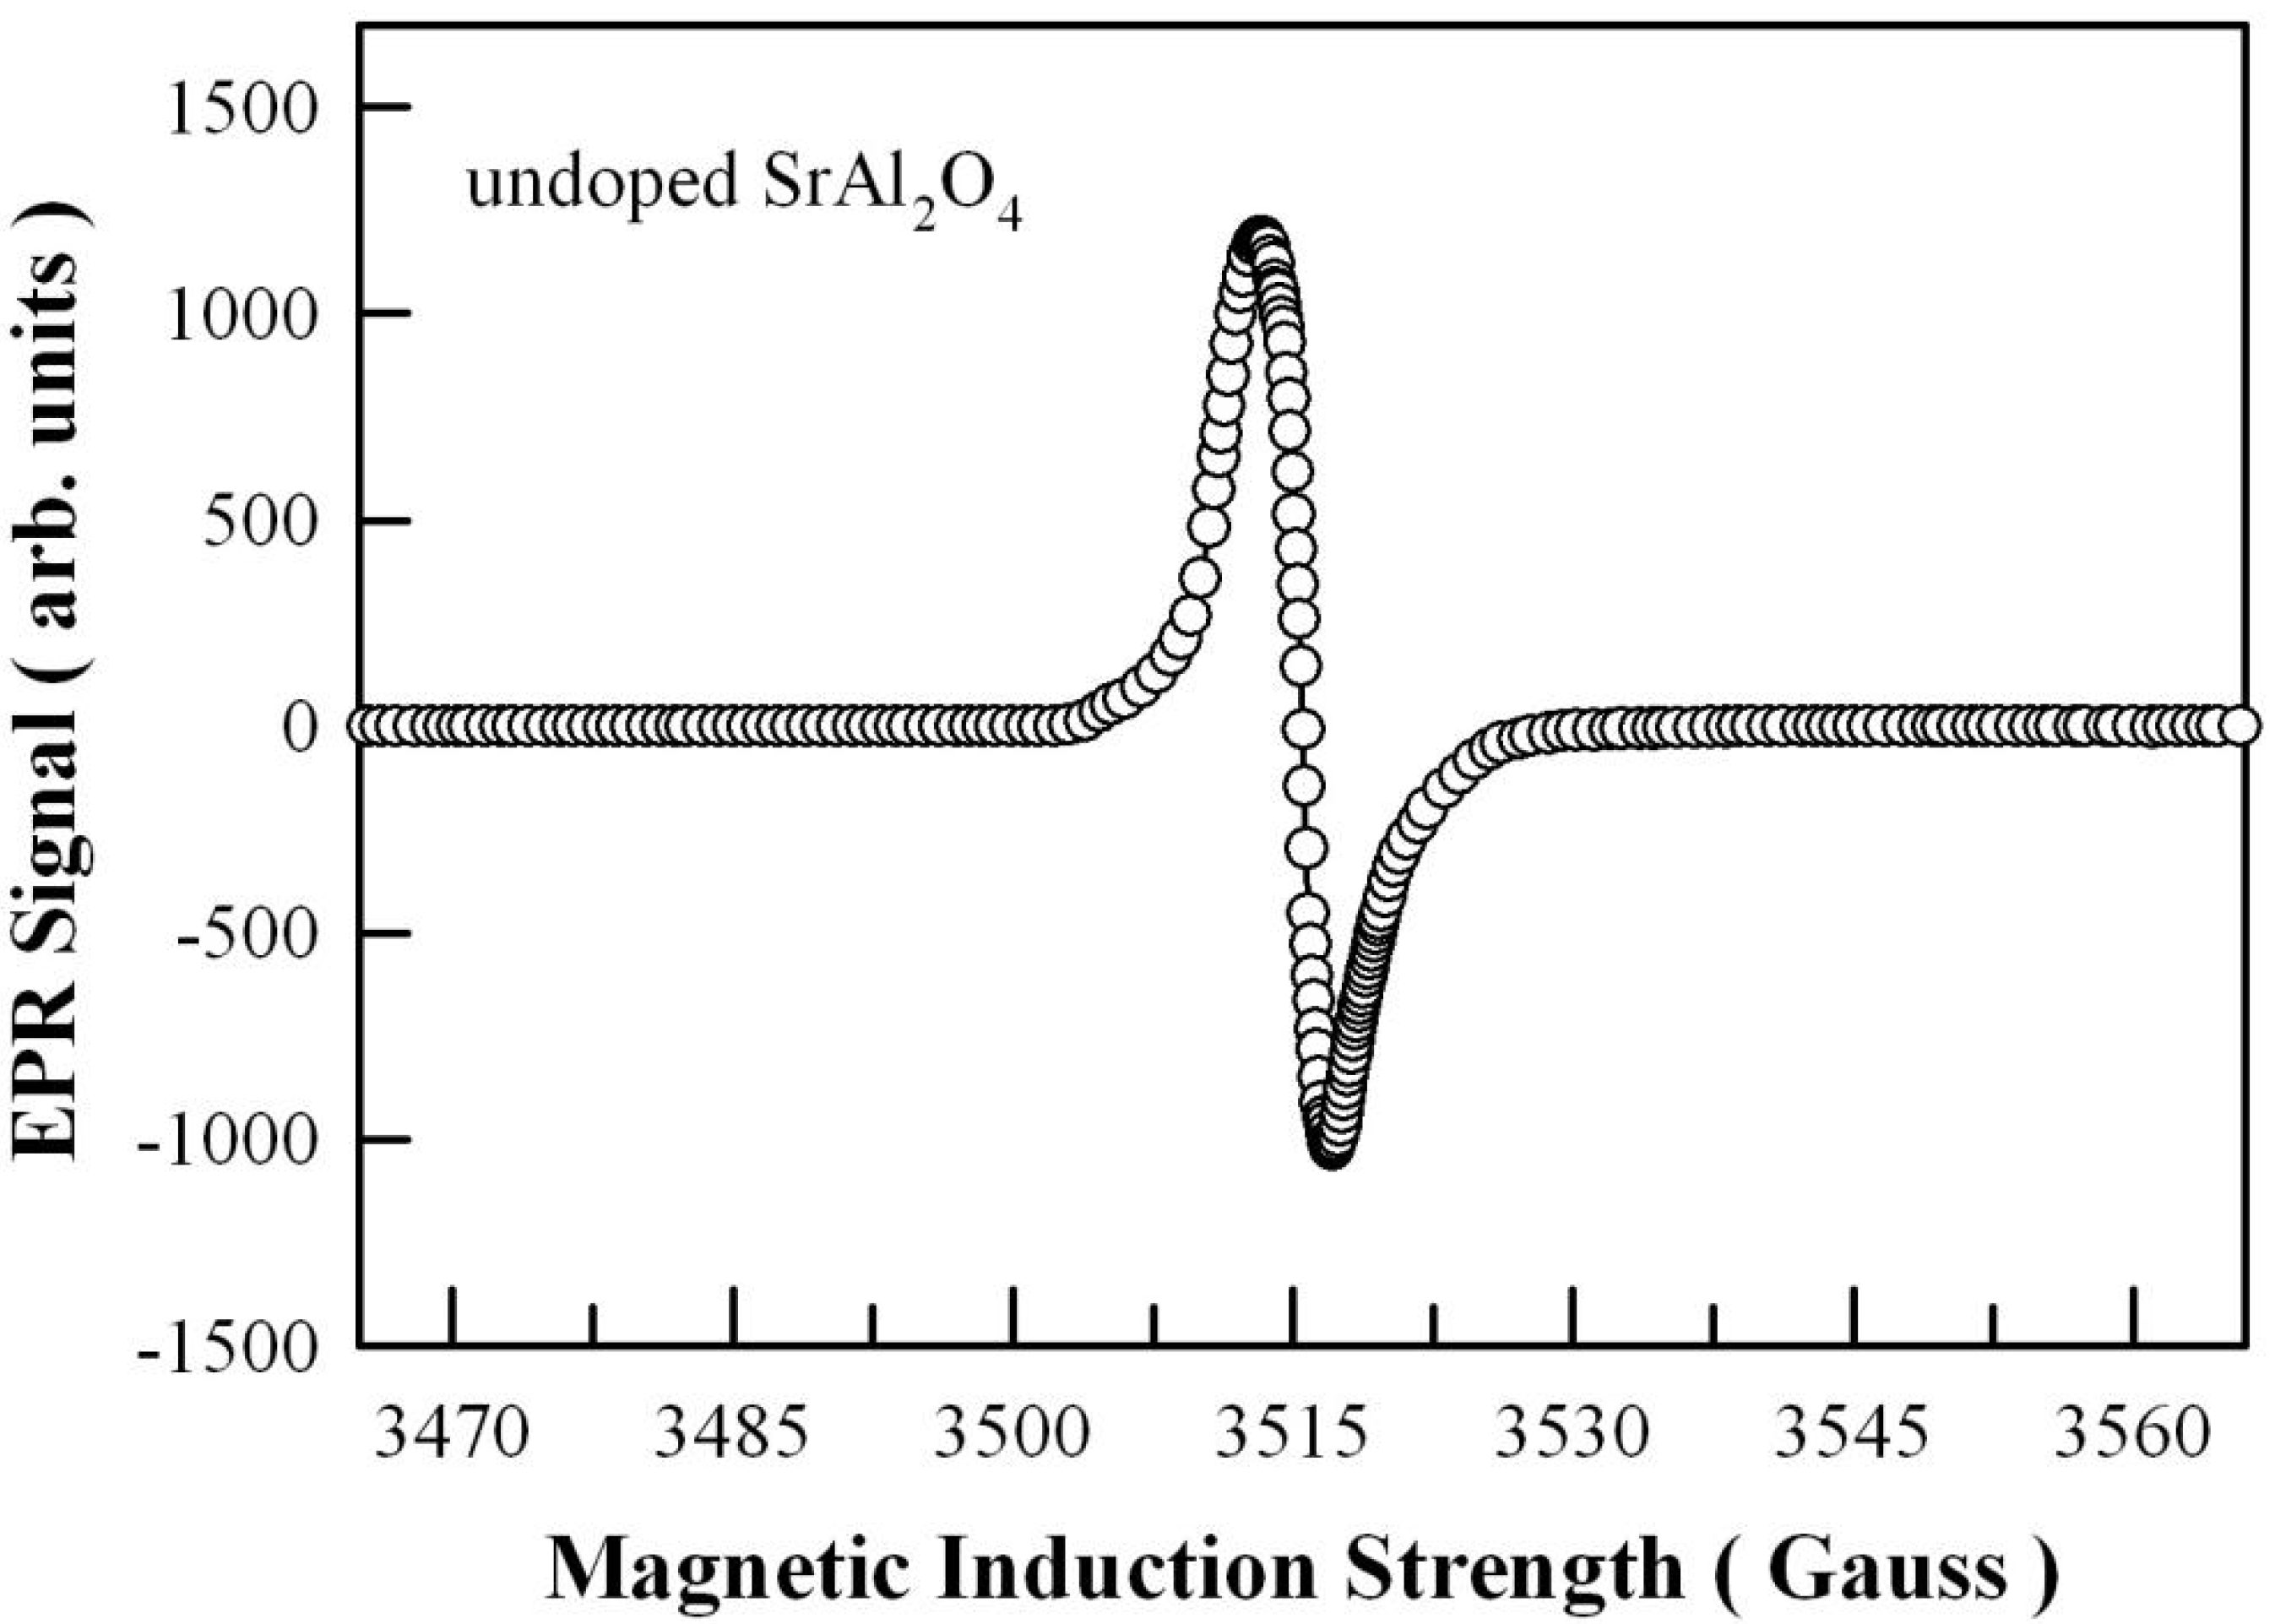
Figure 9.
Schematic illustration of the PL and afterglow mechanisms of undoped SrAl2O4. Process ①: absorption of the excitation energy by intrinsic defects in SrAl2O4. Process ②: non-radiative relaxation of hot electrons to oxygen vacancies in SrAl2O4. Process ③: non-radiative relaxation of hot electrons to electron traps (oxygen vacancies) in SrAl2O4. Process ④: radiative recombination of electrons captured at oxygen vacancy with holes in the valence band of SrAl2O4, resulting in a broad PL band. Process ⑤: radiative recombination of electrons captured at oxygen vacancies with holes captured at strontium vacancies, yielding another PL band. Process ⑥: thermal release of electrons from electron traps in SrSO4, followed by radiative recombination via process ⑤ to yield the green afterglow.
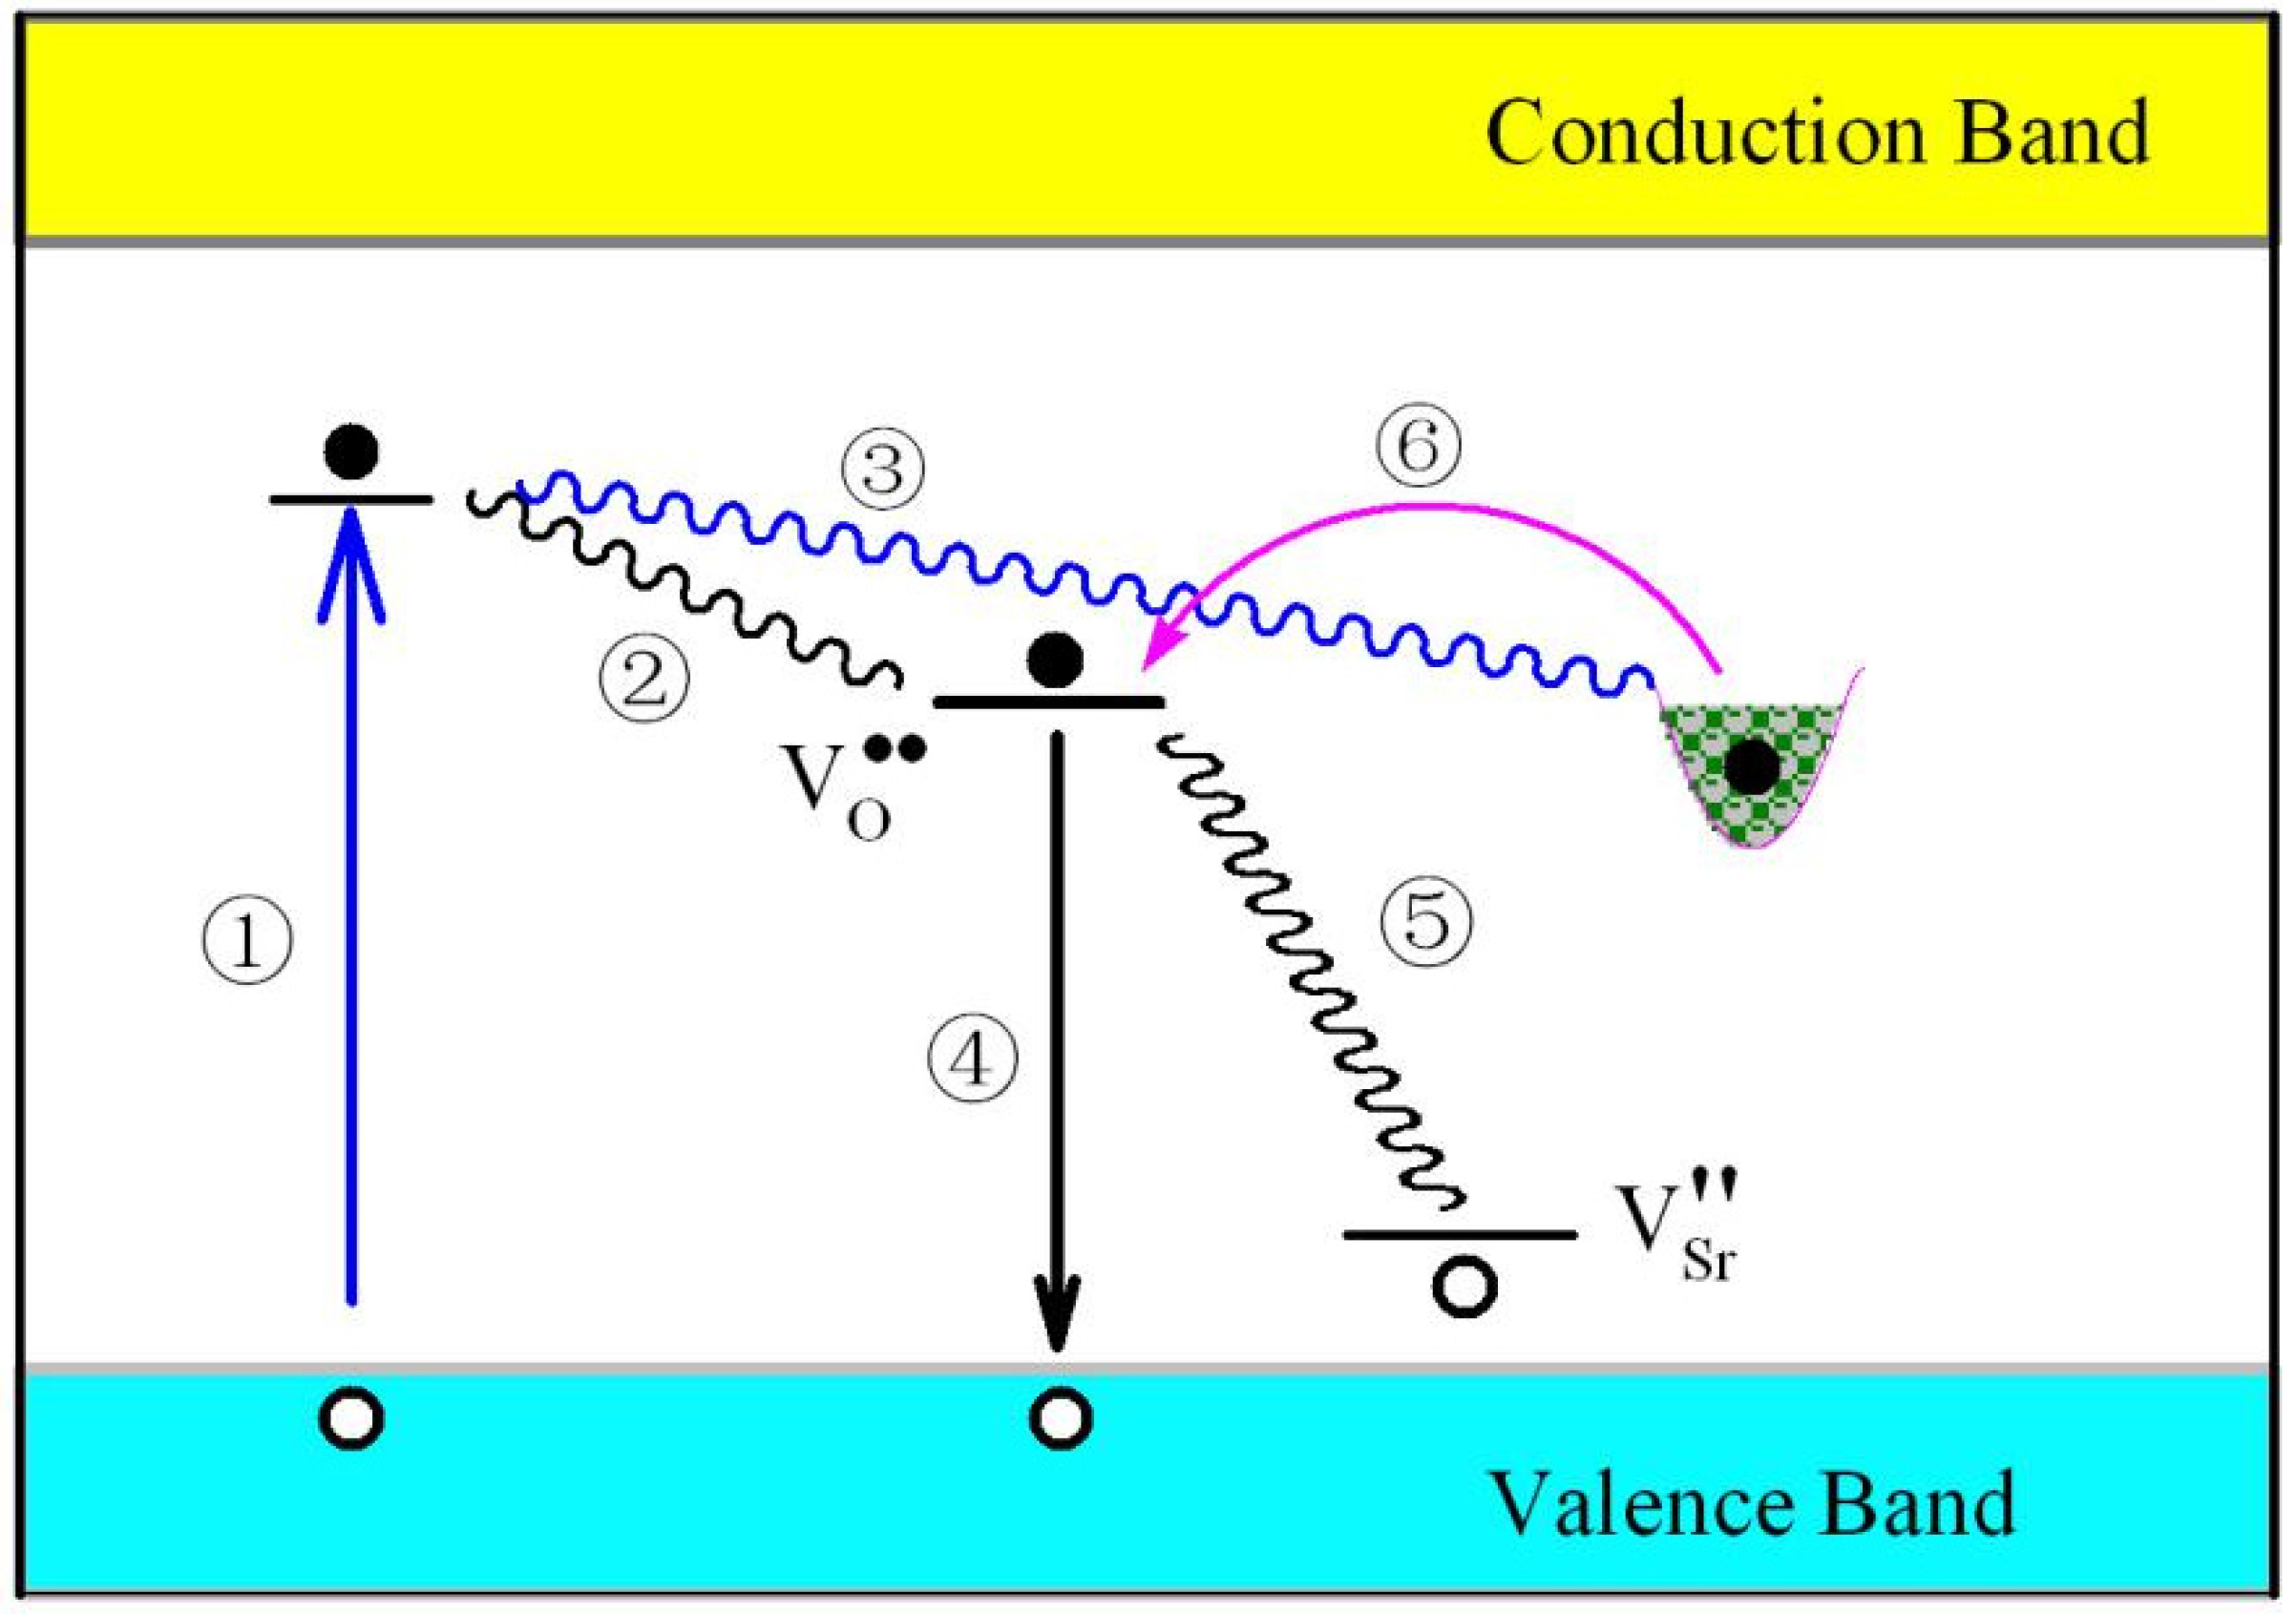
Figure 10.
PL decay curves (black) and exponential reconvolution fits (cyan) of undoped SrAl2O4 at different detection wavelengths. The excitation was the 320 nm pulsed light with a pulse period of 100 ns.
Figure 10.
PL decay curves (black) and exponential reconvolution fits (cyan) of undoped SrAl2O4 at different detection wavelengths. The excitation was the 320 nm pulsed light with a pulse period of 100 ns.

Table 1.
Exponential reconvolution fitting parameters of the PL decay curves of undoped SrAl2O4 at different emission wavelengths (λem). The excitation is the 320 nm pulsed light with a pulse period of 100 ns.
Table 1.
Exponential reconvolution fitting parameters of the PL decay curves of undoped SrAl2O4 at different emission wavelengths (λem). The excitation is the 320 nm pulsed light with a pulse period of 100 ns.
| λem (nm) | A0 | I1 | τ1 (ns) | I2 | τ2 (ns) | I3 | τ3 (ns) | τavg (ns) | χ2 |
|---|---|---|---|---|---|---|---|---|---|
| 396 | 27.825 | 0.130 | 0.9140 | 0.062 | 3.7050 | 0.006 | 18.3353 | 6.49 | 0.982 |
| 415 | 25.736 | 0.125 | 1.0759 | 0.054 | 4.2216 | 0.003 | 22.6141 | 6.14 | 0.969 |
| 434 | 22.908 | 0.135 | 1.0909 | 0.056 | 4.3042 | 0.002 | 23.3102 | 5.25 | 1.026 |
| 453 | 21.369 | 0.109 | 0.7717 | 0.076 | 3.0503 | 0.008 | 11.9451 | 4.65 | 0.939 |
| 472 | 22.942 | 0.120 | 1.0084 | 0.062 | 3.9454 | 0.004 | 19.6329 | 5.92 | 1.033 |
Publisher’s Note: MDPI stays neutral with regard to jurisdictional claims in published maps and institutional affiliations. |
© 2021 by the authors. Licensee MDPI, Basel, Switzerland. This article is an open access article distributed under the terms and conditions of the Creative Commons Attribution (CC BY) license (https://creativecommons.org/licenses/by/4.0/).
Share and Cite
MDPI and ACS Style
Zhai, B.-G.; Huang, Y.-M. Green Afterglow of Undoped SrAl2O4. Nanomaterials 2021, 11, 2331. https://doi.org/10.3390/nano11092331
AMA Style
Zhai B-G, Huang Y-M. Green Afterglow of Undoped SrAl2O4. Nanomaterials. 2021; 11(9):2331. https://doi.org/10.3390/nano11092331
Chicago/Turabian StyleZhai, Bao-Gai, and Yuan-Ming Huang. 2021. "Green Afterglow of Undoped SrAl2O4" Nanomaterials 11, no. 9: 2331. https://doi.org/10.3390/nano11092331
Note that from the first issue of 2016, this journal uses article numbers instead of page numbers. See further details here.