Article

Long-Term Exposure of MoS2 to Oxygen and Water Promoted Armchair-to-Zigzag-Directional Line Unzippings

Department of Chemistry, Yonsei University, Seoul 03722, Korea
*
Author to whom correspondence should be addressed.
These authors contributed equally to this work.
Nanomaterials 2022, 12(10), 1706; https://doi.org/10.3390/nano12101706
Submission received: 2 May 2022 / Revised: 14 May 2022 / Accepted: 15 May 2022 / Published: 17 May 2022
(This article belongs to the Section 2D and Carbon Nanomaterials)

Abstract

:
Understanding the long-term stability of MoS2 is important for various optoelectronic applications. Herein, we show that the long-term exposure to an oxygen atmosphere for up to a few months results in zigzag (zz)-directional line unzipping of the MoS2 basal plane. In contrast to exposure to dry or humid N2 atmospheres, dry O2 treatment promotes the initial formation of line defects, mainly along the armchair (ac) direction, and humid O2 treatment further promotes ac line unzipping near edges. Further incubation of MoS2 for a few months in an O2 atmosphere results in massive zz-directional line unzipping. The photoluminescence and the strain-doping plot based on two prominent bands in the Raman spectrum show that, in contrast to dry-N2-treated MoS2, the O2-treated MoS2 primarily exhibits hole doping, whereas humid-O2-treated MoS2 mainly exists in a neutral charge state with tension. This study provides a guideline for MoS2 preservation and a further method for generating controlled defects.

Graphical Abstract

1. Introduction

Molybdenum disulfide (MoS2) is a representative of the transition metal dichalcogenide (TMDC) MX2 family which has sandwiched layer structures with the transition metal M (groups four, five, and six atoms) located between chalcogen atoms X (S, Se, and Te). Owing to the presence of a band gap associated with its few-atom-thick layers held together by van der Waals forces, MoS2 possesses interesting optical [1,2,3], spin–valley polarization [4,5], and catalytic properties [6,7,8]. In the context of its optical properties, neutral MoS2 displays two features known as A (~1.89 eV) and B (~2.08 eV) excitons [1,2,9], which are associated with direct transitions from the highest spin-split valence bands to the lowest conduction bands. Furthermore, the A exciton has subcomponents in the form of a charge-neutral exciton band Ao at 1.89 eV and a lower-lying charged exciton (trion) band A at 1.86 eV, whose relative intensities and positions are dependent on the doping [10,11,12] and strain (ε) [11,13,14,15,16] of MoS2. Applications of the optoelectronic properties of MoS2 require an understanding of its long-term stability.
MoS2 is amenable to both electron (n) or hole (p) doping [10,11] and it can possess strain (ε) [11,13,14,15,16]. The effects of environmentally abundant oxygen and water on the optoelectronic properties of MoS2 have been studied [17,18,19], but how these species affect the doping and ε properties of MoS2 under ambient conditions remains largely unknown, and this is an important issue. Treatments under harsh oxidative conditions such as with oxygen plasma [18], UV-ozone [20], and high-temperature annealing (>300 °C) [18,21,22] are known to induce oxidation of the basal plane of MoS2. Following these treatments, the basal plane of MoS2 exhibits reduced photoluminescence (PL), while edges and cracked regions display increased PL, suggesting that oxidation plays different roles in governing the properties of the basal plane and periphery. Moreover, O2 incubation of up to one year leads to random cracks and defects [19]. In contrast, physisorption of oxygen by MoS2 activated at 450 °C under vacuum results in a large basal-plane PL enhancement [17] caused by MoS2-to-O2 charge transfer. Because chemisorbed oxygen modulates the optical properties of MoS2 differently from physisorbed oxygen, it is important to gain an understanding of how chemical oxidation controls the doping and ε, which in turn govern the band-gap structure of MoS2 [12].
Theoretical study [23] suggests that the basal plane of MoS2 exhibits a large kinetic barrier (i.e., 1.6 eV) for O2 chemisorption, whereas vacancies (i.e., sulfur vacancies) at the surface of MoS2 reduce the barrier to 0.8 eV. The experimentally determined activation energy for bulk MoS2 oxidation (0.54 eV and 0.79 eV) [22,24] is somewhat lower than the theoretically predicted value. However, recent scanning tunneling microscope measurements [25] show that point-like oxygen-substitution reactions producing oxygenated MoS2 occur spontaneously, even under ambient conditions. Along with the fact that Mo-terminated edges of MoS2 readily react with O2 [26], these findings indicate that oxygenated MoS2 possesses various point defects which are randomly distributed over the plane.
The investigation described below was designed to address this issue. For this purpose, chemical vapor deposition (CVD)-grown MoS2 crystals were exposed to four different conditions for two weeks: N2, N2 with 75% relative humidity (N2-75RH), O2, and O2 with 75% relative humidity (O2-75RH). Using various methods, including Raman spectroscopy, photoluminescence (PL) spectroscopy, and atomic force microscopy (AFM), we observed that the basal plane of MoS2 possessing tensile strain (εT) associated with its preparation using CVD, undergoes zigzag (zz)-directional unzipping upon long-term exposure to an oxygen atmosphere. Specifically, during the initial phases of exposure to O2 and O2-75RH, MoS2 crystals display initial macroscopic armchair (ac)-directional micrometer-scale defects near triangular edges. Following increased exposure times of up to a few months, the initial ac-directional defects near the periphery change into zz-directional unzipping in the basal plane. This unique unzipping behavior is associated with the susceptibility of S defects in the basal plane to tension caused by oxidation. Moreover, Raman and PL spectroscopic studies show that changes occurring in the optoelectronic properties of MoS2 upon chemical oxidation are a consequence of changes in εT and doping.

2. Materials and Methods

2.1. Materials and Instrumentation

MoO3 (product no. 267856, ACS reagents, purity ≥ 99.5%) and sulfur (product no. 13803, purity ≥ 99.5%) were purchased from Sigma-Aldrich (St. Louis, MO, USA). Sulfur was further recrystallized using vacuum sublimation at ca. 10−3 torr, as described previously [27]. Sodium cholate (SC), with a purity of over 98%, was purchased from TCI (Tokyo, Japan) and used as a surfactant and an adhesion promoter to a silicon substrate. Deionized water with a resistivity greater than 18 MΩ was used. All gases, including N2, Ar, and O2 with purities of over 99.99% were obtained from Donga Gas (Jinju, Korea). The 285-nm thick SiO2/Si substrates (lot no. 7400397-601, Shin-Etsu, Tokyo, Japan) were spin-coated with MoO3 and converted to MoS2. The as-received wafer was cut into pieces of size 1.0 × 1.0 cm2 and further rinsed with methanol, acetone, and isopropanol while undergoing bath sonication, then subjected to drying with a N2 stream. Optical microscope (OM) images were obtained using an upright fluorescence microscope (BX-51, Olympus, Tokyo, Japan) with a CMOS camera (3.6 μm/pixel, 1280 × 1024 pixels, part no. DCC1645C, Thorlabs, Newton, NJ, USA) and a light-emitting diode light source (cold white color, part no. MCWHL2, Thorlabs) with an optional dichroic cube set (MWG, Olympus), which could image the 660 nm PL of MoS2. SEM images were acquired using field-emission SEMs (SU8000, Hitachi or 7610f-plus, JEOL Ltd., Tokyo, Japan) operating at an acceleration voltage of 5 kV.

2.2. Precursor Preparation

MoS2 growth involved the use of SC as adhesion promoter and surfactant for MoO3 powder, according to the procedure described in the literature [28]. Aqueous MoO3 dispersion was prepared by sonication using SC as a surfactant. Briefly, 20 mM MoO3 was added to 1 wt. % SC in 100 mL of water. The suspension was subjected to bath sonication for 1 h (70 W, Branson1519, Brookfield, CT, USA) followed by tip sonication for 2 h (300 W amplitude, probe tip diameter: 13 mm, VCX 750, Sonics and Materials, Newtown, CT, USA). The dispersion was centrifuged using a table-top centrifuge (Wisespin CF-10, Daihan Scientific Co, Ltd., Wonju-si, Korea) to collect an 80% supernatant. 100 μL of the MoO3 dispersion was spin-coated at 3000 rpm for 80 s by drop-casting on precleaned SiO2 on a Si substrate. Sulfur was prepared by vacuum sublimation. Briefly, 1 g of sulfur was placed at the bottom of a sublimation kit with a cold finger. The sublimation temperature was set to 200 °C under vacuum (10−3 torr).

2.3. Growth of MoS2 Crystal

MoS2 was prepared by using a hot-wall CVD apparatus [29] operating at atmospheric pressure, with the aforementioned spin-coated MoO3 and the sublimed sulfur powder as precursors, modified from the previous study [27]. Prior to the MoS2 growth, a quartz tube in a tube furnace was pre-annealed for 30 min at 1000 °C with a 20 standard cubic centimeter per min (sccm) Ar flow to remove any physisorbed water, in a CVD chamber. After cooling, the MoO3 spin-coated substrate was loaded into the hot zone of a tube furnace with the SiO2 side face up, and an alumina boat containing 30 mg of sulfur was placed in an upstream position. Crystal growth was conducted at 750 °C for 20 min, at which time the alumina boat containing the sulfur reached ~220 °C. The substrate was then cooled to room temperature.

2.4. Environmental Control of MoS2

Four different environments (i.e., N2, N2-75RH, O2, and O2-75RH) were prepared using a Schlenk line technique and a septum-capped vial, with precautions as follows. For the N2-75RH or O2-75RH environments, a vial containing saturated brine solution maintaining 75RH [30] was bubbled with the N2 (or O2) for 90 min using a syringe to remove any O2 dissolved in the solution. For the N2 or O2 environments, a vial containing a moisture-absorbing silica gel was initially flame-dried thoroughly with a hand-held torch while a vacuum (10−3 torr) was pulled, and the sample was subsequently treated with a cycle of N2 (or O2) purging/vacuum, at least four times. Each sample was incubated for two weeks prior to any measurements. A further one month of incubation was conducted for observation of long-term changes.

2.5. Raman and PL Measurements

The samples were loaded into an environmental chamber (TS1000V-17/3 with T96-S, Linkam Scientific Instruments Ltd., Redhill, UK) which allowed observation of the sample through a coverslip while measurements were made. Raman and PL spectra were obtained using a micro-Raman spectroscopy setup with a backscattering geometry, as described in the literature [27,29,31]. Briefly, a spectrometer (Triax 320 with 1800 gr/mm) and coverslip-tolerant 40× objective (UPlanSApo, N.A.: 0.95, Olympus) were utilized to obtain the Raman and PL spectra. Calibration for Raman spectroscopy was conducted with multiple Hg/Ar lamp peaks using a light source (HG-1, Ocean Optics, Oxford, UK), according to the procedure described in the literature [29]. The Si peak at 520.89 cm−1 was used as an internal reference and an intensity-normalizing peak. Laser power was maintained below 0.06 mW to minimize any light-induced damage. The obtained Raman and PL spectra were further deconvoluted with Lorentzian fitting. Especially in the PL spectra, A°, A, and B excitons were fitted to an unrestricted position and area.

2.6. Construction of Coordination System for ε–n Plot

The Raman origin ((E12g, A1g) = (385.3 cm−1, 404.8 cm−1)) for the ε and n plot was taken from the values derived from suspended MoS2 in the literature [11]. Biaxial ε vs. n coordinates were introduced by modification of the εn diagram described previously [32,33,34], as in the case of graphene [35]. Since CVD-grown MoS2 exhibits biaxial εT [36], biaxial εT and Raman responses were utilized [11]. The changes in in-plane vibration E12gωE) and out-of-plane vibration A1g (ΔωA) and their variations were ΔωE = −5.2 cm−1/% and ΔωA = −1.7 cm−1/%. Using the formula γ = [ωω0]/[2εω0], we determined the Grüneisen parameters γ for the Raman modes to be γE12g = 0.68 and γA1g = 0.21, with the slope per ε or ΔωAωE = 0.35 [11]. In the case of n, vibrational changes in E12g and A1g and their extents were ΔωE = 0.21 cm−1 and ΔωA = 1.97 cm−1 per 1 × 1012 cm−2, with the slope of n with ΔωAωE = 9.4 [35].

2.7. AFM Measurements
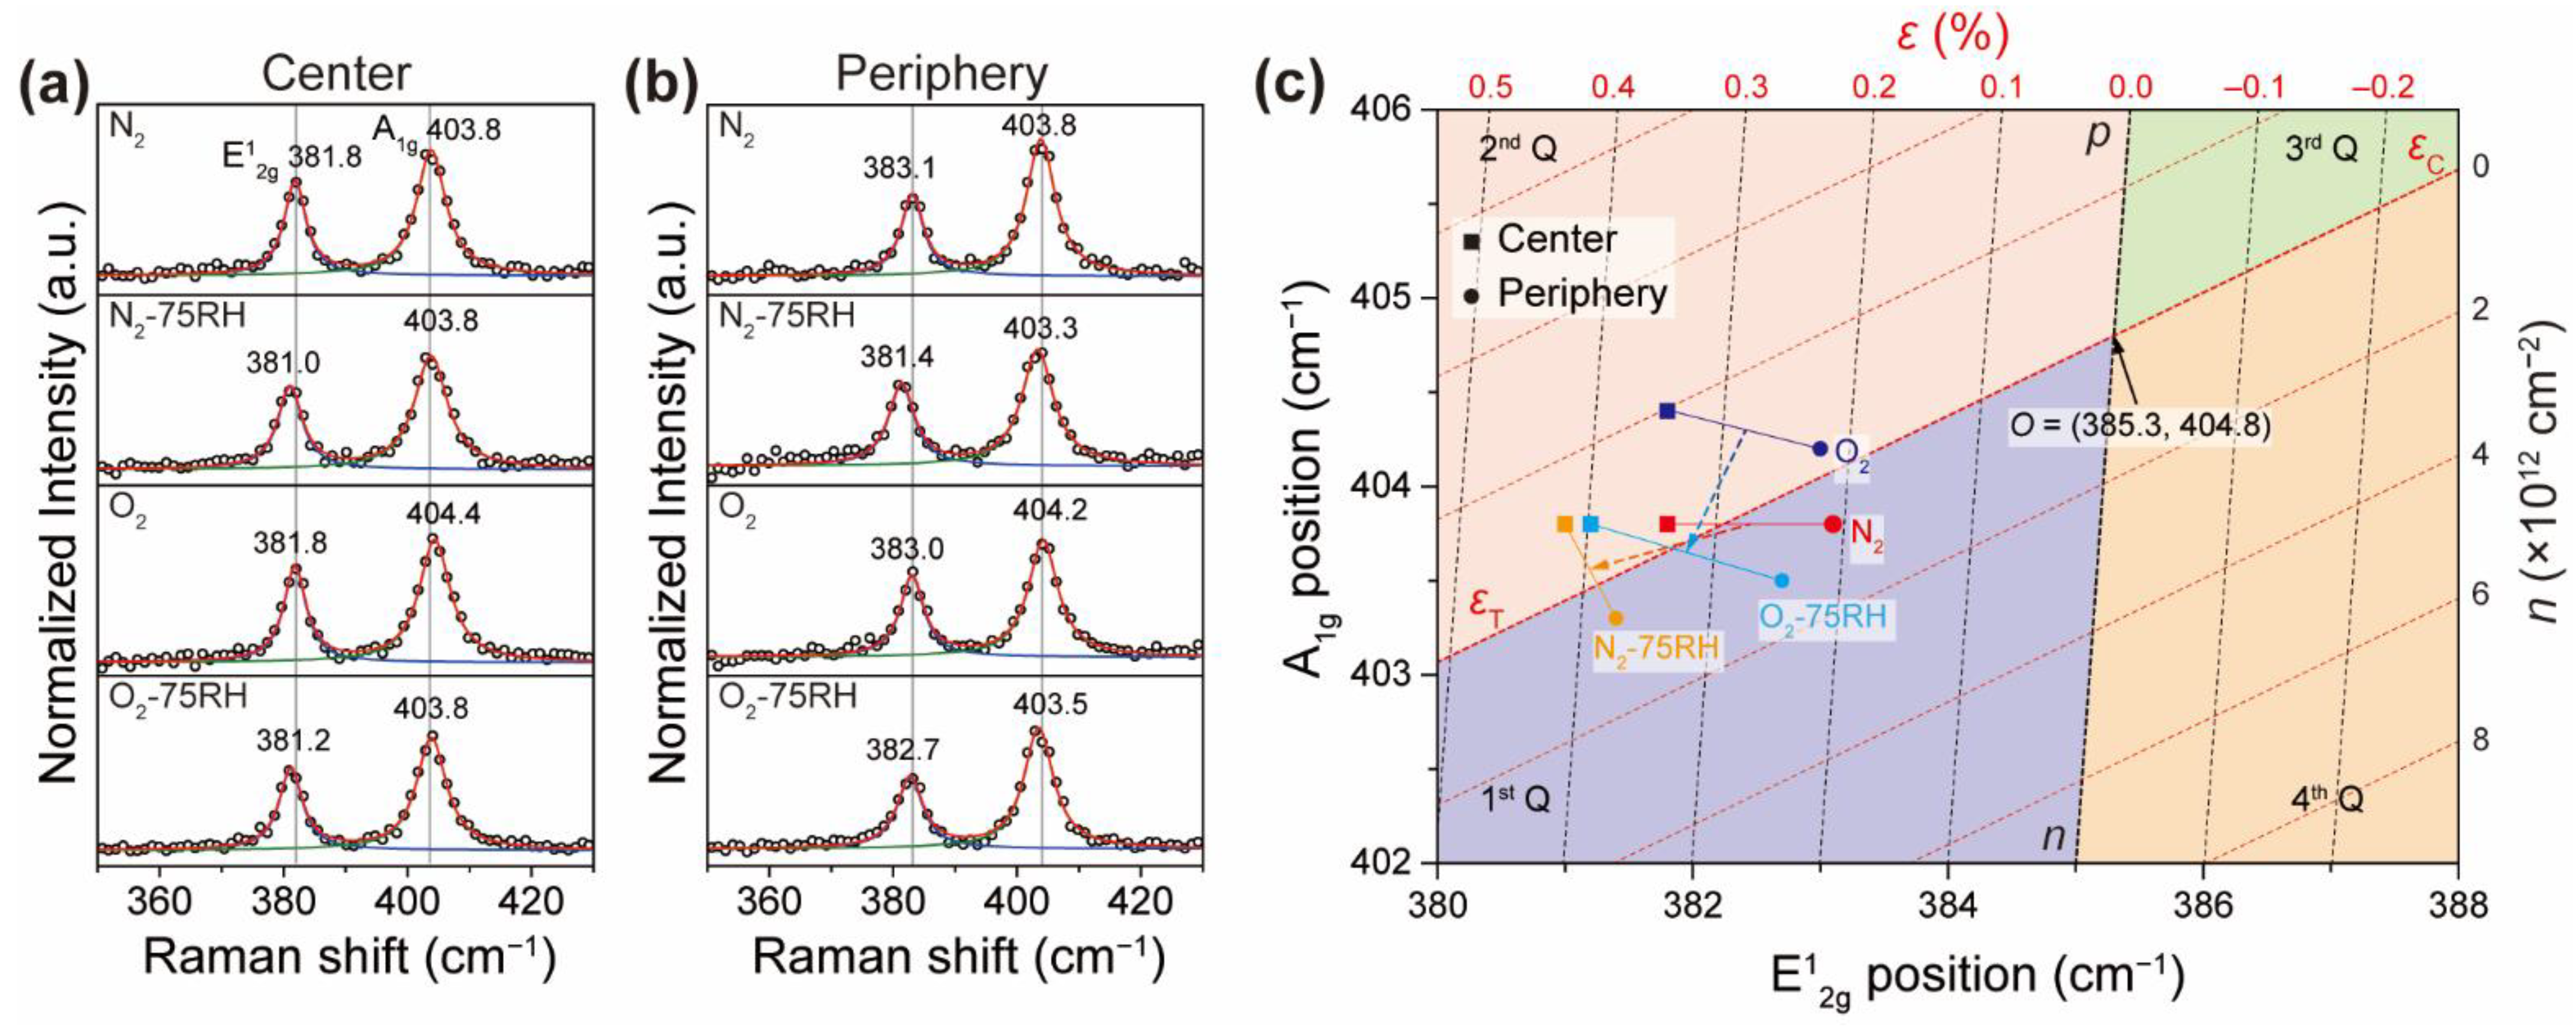
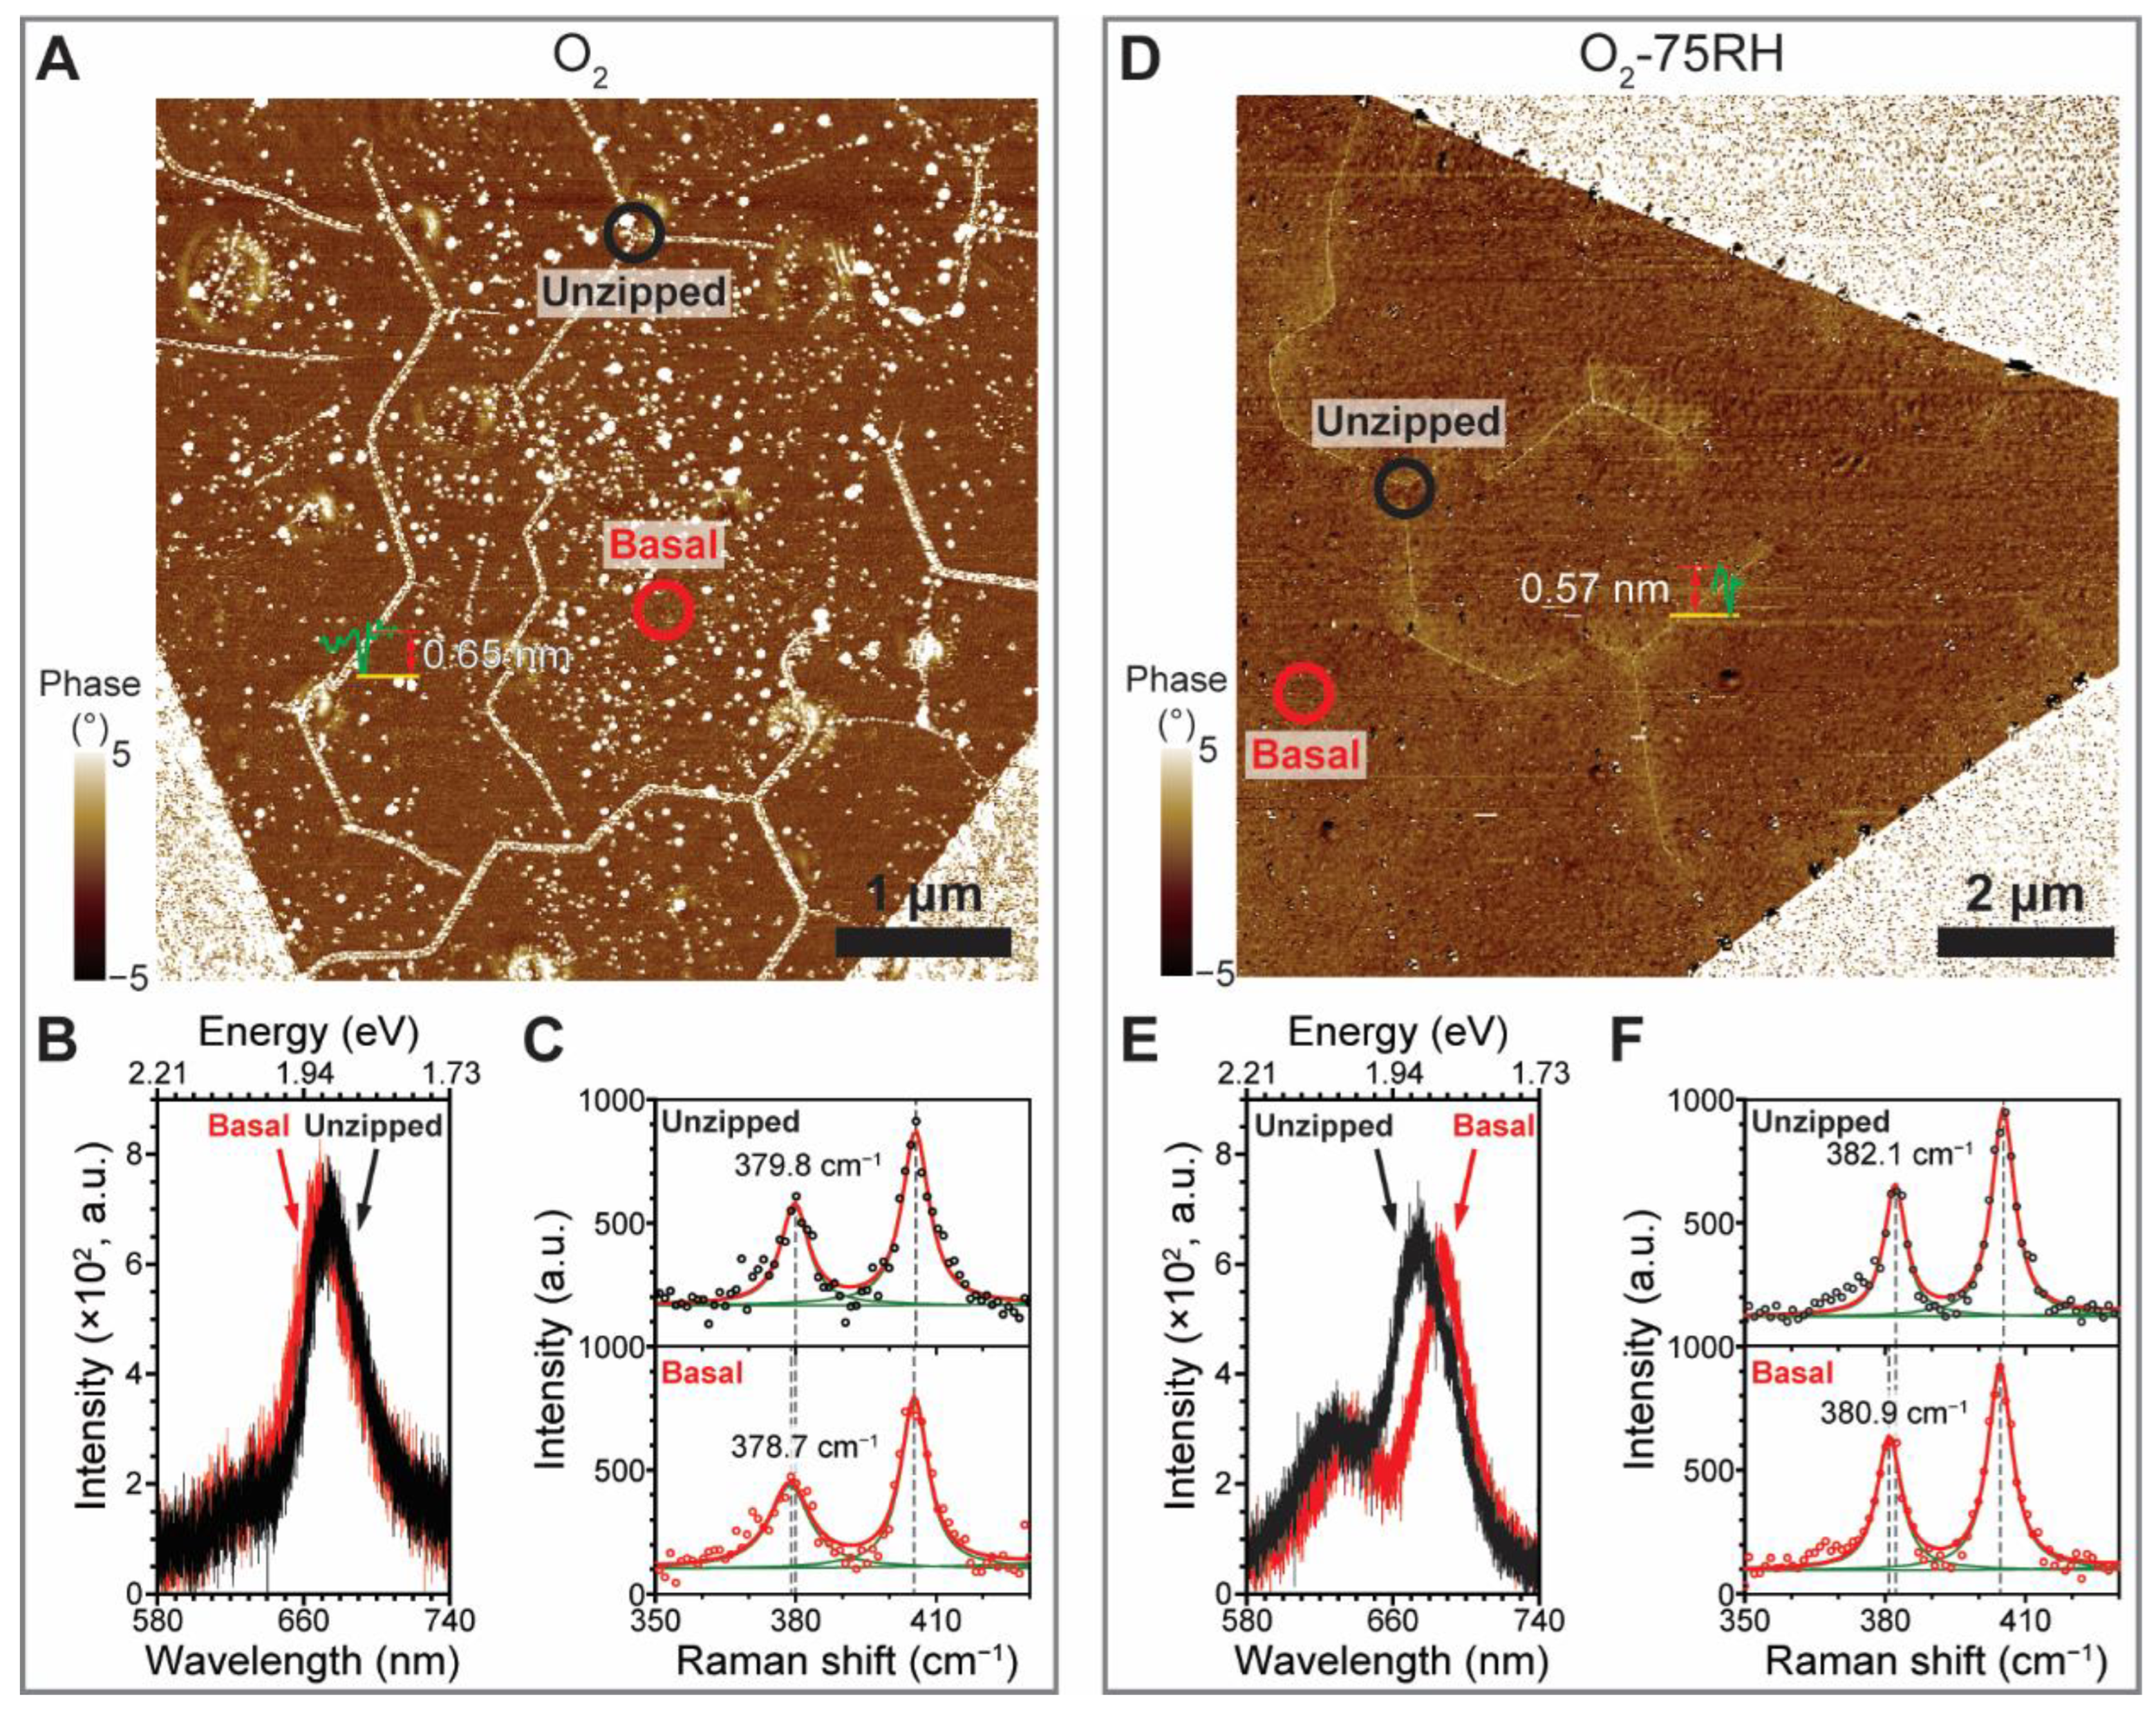
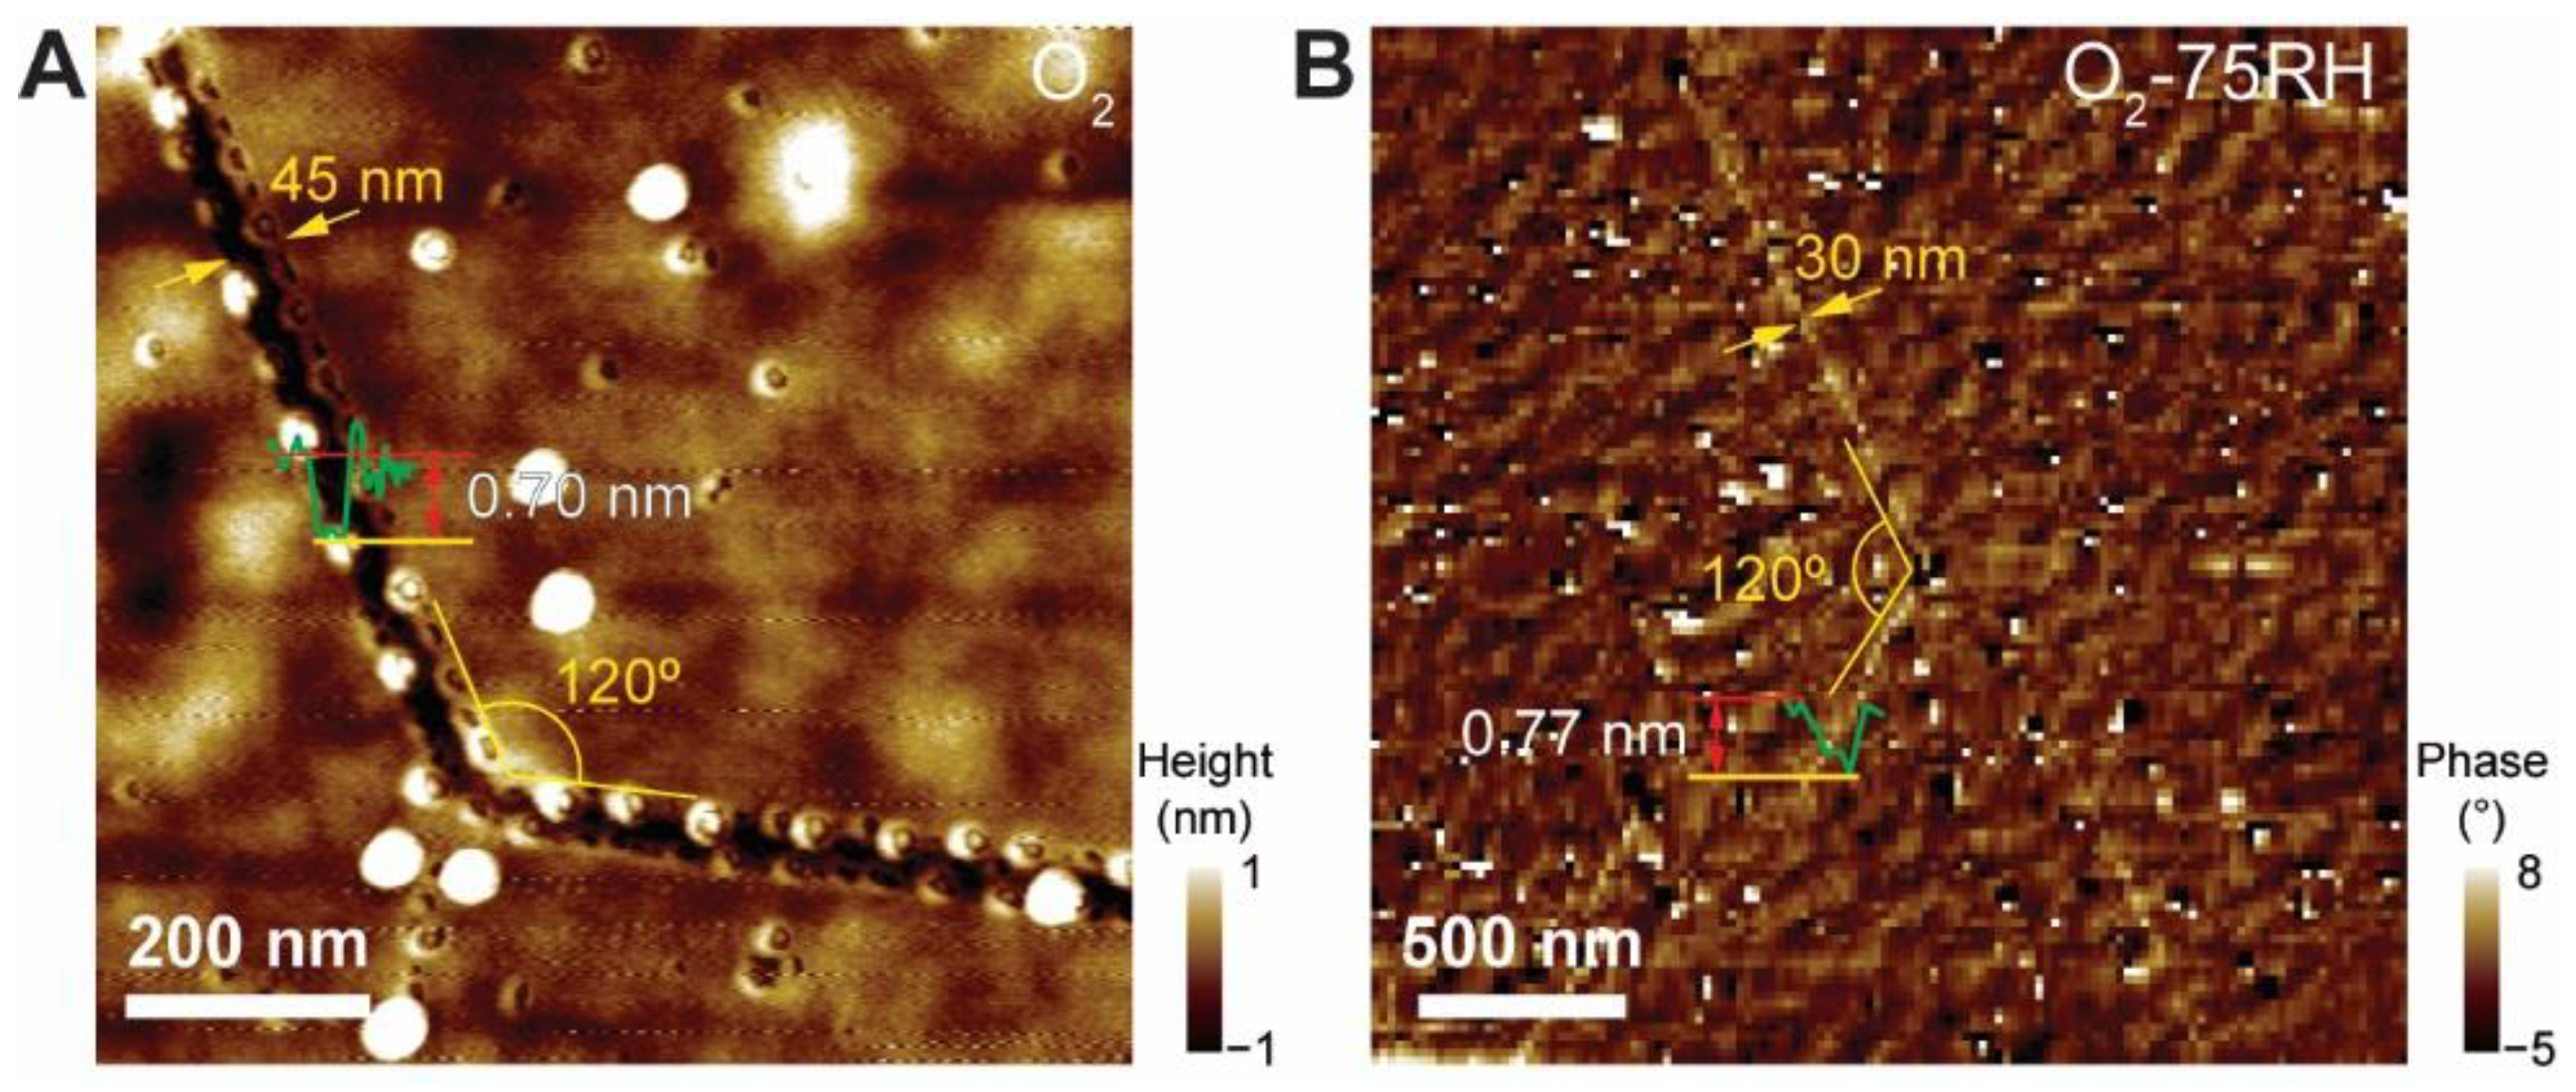
AFM height and phase images were obtained by using a tapping mode with an NX-10 AFM (Park Systems, Suwon, Korea). Al-coated silicon cantilevers (force constant: 37 N/m, resonance frequency: 300 kHz, ACTA-20, App Nano, Mountain View, CA, USA) were used. Typically, 512 × 512 pixels for a 40 μm length were routinely acquired at a speed of 0.2 Hz. The XEI program (Park Systems, Korea) was used to flatten topographies along the fast axis of scan using a polynomial, by excluding speckles of size 5 nm.

3. Results

CVD-grown triangular MoS2 crystals were single crystals terminated with zz edges [37] and were used to probe the effects of oxidation reactions on the morphological and optoelectronic properties. The MoS2 crystals were grown by CVD, using the procedure developed in our previous investigation [27], starting with MoO3 and sublimed sulfur (see Materials and Methods section). First, a well-dispersed aqueous MoO3 dispersion containing 1 wt. % sodium cholate (SC) as a surfactant and adhesion promoter [28] was spin-coated onto a 285 nm thick SiO2/Si substrate. After annealing at 1000 °C to eliminate adsorbates, a quartz tube was loaded with the MoO3-coated substrate and a boat containing freshly sublimed sulfur. A 20 sccm Ar flow was used as a carrier gas and the temperature of the hot zone was raised to 750 °C for 20 min, to promote MoO3 reduction with sulfur. The growth of the MoS2 crystals was terminated by cooling the tube to room temperature for 40 min while maintaining the Ar flow.
The Initial characterization of the as-grown MoS2 as a control was conducted using various methods, including optical microscopy (OM), atomic force microscopy (AFM), photoluminescence (PL) imaging/spectroscopy, and Raman spectroscopy (see Figure 1A–E). Inspection of the representative CVD-grown MoS2 via the OM image (Figure 1A) shows the MoS2 crystal as a ca. 46 μm long equilateral triangle with uniform contrast. The corresponding AFM height image (Figure 1B) shows that the crystal has a clean surface and a 0.70 nm edge height, indicating a monolayer of MoS2 [37]. Notably, the PL image (Figure 1C) shows a gradient of PL brightening from the center to the peripheral regions. Other researchers [16,36] have found that such gradual PL intensity (IPL) and peak position (λ) changes, as well as shifts in the Raman bands in CVD-grown MoS2, occur when proceeding from the center to the peripheral regions owing to differences in tensile strain (εT) caused by thermal expansion coefficient differences between the Si substrate and the MoS2. Since biaxial εT shifts the excitonic A band by −99 meV/% [11], the observed λ of 675 nm in the PL spectrum at the center (Figure 1D) suggests the presence of substantial εT (i.e., 0.4%) compared to that at peripheral regions where the λ is ca. 660 nm. The positions of the two characteristic Raman bands of the in-plane vibration E12g and out-of-plane vibration A1g are known to be sensitive to εT, and E12g undergoes larger downfield shifts compared to A1g with increasing εT [11,13,14,15,16,38]. The Raman spectrum of the central MoS2 region (Figure 1E) contains E12g at 383.1 cm−1 and A1g at 406.2 cm−1 [39], whereas the spectra at the peripheries contain upshifted 383.6 cm−1 and 406.8 cm−1 bands, which is in good agreement with reported spectra of MoS2 under εT. The results suggest that εT is a major contributor to the anisotropy present in the PL and Raman spectra of the as-prepared MoS2 crystal. Immediately after characterization, the MoS2 crystals were incubated under the four different atmospheres N2, N2-75RH, O2, and O2-75RH for two weeks (see Figure S1A in the Supplementary Materials (SM) for schematics of the environmental incubation processes).
The effects of various environments on the morphology of MoS2 were first examined using AFM (Figure 2a–d). All crystals under the four conditions have triangular shapes and heights (white traces) varying from 0.6 to 0.85 nm, indicating monolayer MoS2. While the N2 and N2-75RH samples (Figure 2a,b) have topographies similar to the as-grown material, surprisingly, the MoS2 subjected to an O2 atmosphere (Figure 2c) displays few micrometer-long directional line defects originating from the edges. These defects are more visible in the phase image (Figure S2C,D), compared to those from N2-treated samples. Notably, the angles of the line defects against zz edges were ca. 30, 90, and 150° (see inset of Figure 2c), suggesting ac-directional line defects. This result contrasts with the report in [19] that aging of CVD-grown MoS2 and WS2 under ambient environmental conditions leads to random cracks and defects. This result suggests that the conditions for CVD growth affect the oxidative defects. Furthermore, the O2-75RH-treated sample (Figure 2d) shows that unzipping occurs from the edges in the ac directions. The inset in Figure 2d shows that unzipping, instead of occurring at ac line defects, occurs at the edges, and that crack directions are at 120° from each other (see red arrows for the intersection). This result suggests that dry and humid O2 oxidations promote stepwise transformations in the MoS2 crystal, from line defects to eventual unzipping.
Because unzipping typically begins at the mechanically weakest points, the line defects and the subsequent unzipping are likely to be correlated with the εT of the MoS2, which in turn is associated with the optical properties of the MoS2 crystal. Figure 3A–D show the corresponding PL images of the samples. The images show that the IPL for the N2-treated crystal gradually increases from the center to the periphery, suggesting that the εT behavior is similar to that of as-prepared MoS2. Interestingly, the N2-75RH sample (Figure 3B) has a uniform IPL at both the center and periphery. A humid environment is known to form entrapped water between graphene and the substrate [40,41,42] or MoS2 and the substrate [43]. To confirm that such entrapped water is related to the uniform IPL, AFM height measurements of the basal plane from the N2-75RH sample (Figure S3A) were made. Water was entrapped evenly over the sample, and water entrapped regions is 0.5 nm thick and a few micrometers wide (Figure S3B) were entrapped between the MoS2 and the substrate. This was a phenomenon not seen in the N2-treated sample. These results are in agreement with the previous study, which demonstrated that a monolayer of water adhered under the MoS2 surface to a thickness of ~0.5 nm [43], as seen in other two-dimensional materials such as graphene [40,41,42]. This result suggests that the increased height induced by water and the subsequent strain might increase εT and lead to the observed uniform IPL over the MoS2 crystal.
The PL image from the O2-treated sample (Figure 3C) shows that IPL gradually increased from the periphery to the center, a trend that is opposite to that occurring in the N2-treated sample. The low IPL near the periphery overlaps with the AFM-observed line defects present in the O2-treated MoS2. These results suggest that, unlike for samples treated using harsh oxidations [18,20,22], physisorbed O2 at the center of the crystal actually results in an enhancement of IPL, which is in accordance with the previous report [17]. In contrast, chemically oxygenated species evidenced by line defects form near the periphery and result in the reduced IPL. Similar to the O2 sample, the crystal incubated under the O2-75RH condition (Figure 3D) displays an IPL that is brighter at the center and dimmer and more irregular at the periphery. Such spatial inhomogeneity originates from unzipping and folding of the MoS2, as evidenced by comparing the PL and AFM images.
Qualitative information was gained about doping and εT by analyzing the PL spectra from the central (Figure 3E) and peripheral (Figure 3F) regions of the incubated MoS2 crystals. Inspection of the spectra of the basal planes (Figure 3E) treated using humidified atmospheres (i.e., N2-75RH and O2-75RH) show that the λ values of the A bands display a bathochromic shift from 24 to 32 meV compared with those treated with N2 and O2 only. Moreover, the basal plane of the O2-treated sample exhibits an IPL about 11 times larger than that of the crystal exposed to N2. The spectra from the peripheries (Figure 3F) show that while the peripheral IPLs of the O2 and O2-75RH samples were lower than those associated with the basal plane, the peripheral IPL of the N2 sample was increased and that of N2-75RH was unchanged. These results suggest that the center and periphery of the MoS2 crystal experience different degrees of doping and εT.
The λ and IPL of Ao and A peaks in the PL spectra of MoS2 are dependent upon ε and n, and this serves as a foundation for deciphering the roles that O2 and H2O play in forming peripheral defects and unzipping [12,36]. To elucidate these values, the PL spectra at the central positions of the MoS2 crystals were deconvoluted using Lorentzians (shaded area), as shown in Figure S4. As evidenced by the dashed lines, the λ values and peak areas of Ao and A underwent a systematic change for crystals treated using each condition. For example, among the four samples, the dry N2- and O2-treated samples exhibited the most blue-shifted λ values for the Ao and A peaks, suggesting that they are associated with a smaller εT. In addition, the λ values of the Ao and A (Figure 3G) bands of samples treated using humid atmospheres exhibited proportional red shifts. A comparison of the relative areas of the Ao and A bands (Figure 3F), which provides information about the charge state of MoS2 [10], shows that peak areas are much greater in the spectra of O2 and O2-75RH samples. Moreover, the comparison shows that water induces an increase in the population of the charge-neutral Ao state, and O2 causes an increase in the area of the charged A state. This result is opposite to that of a previous study suggesting that water has a p-doping effect [43], and suggests that water promotes neutral exciton formation while physisorbed O2 facilitates trion formation. Similar analysis of the PL spectra of peripheral regions (Figure S5A–C) shows that analogous but lesser shifts in λ occur (Figure S5B) and that the relative areas of Ao and A bands are relatively smaller compared to those in the spectra of basal planes. These observations in peripheral regions are in line with doping created by line defects and unzipping [19].
Raman spectroscopy is a powerful tool for gaining an understanding of the quantitative ε and n- or p-doping density of MoS2, because these parameters are closely related to chemical bond strengthening or weakening, which alters the vibrational behavior. A previous study [35] showed that ε and n contributions in graphene are quantitatively associated with two Raman bands (i.e., G and 2D modes). A similar concept has been utilized to evaluate ε and n for monolayer MoS2 [32,33,34]. To apply this treatment, we chose the frequencies from the spectra of suspended MoS2 as an origin for the unperturbed, pristine state [44,45]. Utilizing the published values for ε and n of monolayer MoS2 [11,46], an εn coordinate system in units of % and 1 × 1012 cm−2 (Figure 4c) was devised in a coordinate framework comprising two prominent Raman bands (E12g, A1g). Specifically, Figure 4c is a plot of ε (black dashed line) and n (red dashed line), with an origin O = (E12g, A1g) = (385.3, 404.8), corresponding to pristine MoS2. In addition, εC values are compressive strains, and n and p denote n and p doping, respectively. Representative crystal spectra acquired from the center and periphery are shown in Figure 4a,b. It is noteworthy that Raman bands near 275 cm−1 corresponding to MoO3 are not present [21]. As shown in Figure 4c, the central (peripheral) position of the N2 sample displays two bands at 381.8 (383.1) and 403.8 (403.8) cm−1. In terms of strain doping, the central part has εn coordinates of (0.34, −0.4), and the peripheral part has coordinates of (0.2, 0.7). This result suggests that while εT decreases from the center to the periphery, in accordance with previous findings [27,36], a slight p- to n-doping transition occurs simultaneously. The doping of the N2-treated sample is likely to be related to the interaction of the basal MoS2 with the SiO2/Si substrate, which acts as a p dopant [29,35]. Compared to the N2-treated sample, the N2-75RH sample (orange) exhibited much higher εT values (from 0.37 to 0.42%) at both the central and peripheral positions and experienced only a negligible doping density change. This result further supports the idea of the presence of water-induced tensile strain. This result underscores the advantage of utilizing an εn plot for analyzing the spectroscopic data, because otherwise the p-doping and εT results are both included in a similar downshift in vibrational frequencies [11].
Inspection of the εn plot shows that the two prominent Raman bands (E12g and A1g) associated with the central and peripheral regions of the O2- and N2-treated MoS2 crystals exhibited nearly similar movement along the p-doping axis. This observation suggests that O2 treatment results in p-doping, which is in agreement with the occurrence of charge transfer from MoS2 to physisorbed O2 [17]. Finally, the O2-75RH treated sample has εn coordinates of (0.4, −1) and (0.25, 1) for the central and peripheral positions, respectively. The different doping densities with different signs observed for the central and peripheral regions are closely connected to the existence of peripheral unzipping and folding, which decrease εT. The increase in εT and the charge neutralization taking place in changing from O2 to O2-75RH, in conjunction with the PL results, indicate that treatments with O2 and H2O lead predominantly to p-doping and εT, respectively.
The results suggest that regardless of the environmental conditions used, MoS2 samples possess considerable εT, albeit with different doping densities. However, only O2-treated crystals experienced line defects and unzipping. This observation prompted us to perform an experiment in which MoS2 crystals were exposed to O2 and O2-75RH environments for three months. Figure 5A,D show the respective AFM phase images, facilitating the visualization of unzipping. Remarkably, both samples show zz-directional line unzipping with respect to zz-terminated edges. The O2-treated sample had a wider unzipping width compared to the O2-75RH-treated MoS2. Unzippings occurred at 120° with respect to each other. Although unzipping near the periphery is ac-directional with respect to the edge, it changes to the zz direction in the basal plane. This finding stands in stark contrast to the etched triangular pit of exfoliated MoS2 prepared by high-temperature annealing (i.e., 300 °C) [21,47] and the random cracks incubated at room temperature [19]. Inspection of the normalized PL spectra of the O2-incubated crystal (Figure 5B) shows that both unzipping and basal positions occur at ~670 nm, which corresponds to the near-absence of tension. Similarly, both Raman spectra (Figure 5C) show similar interpeak separations (i.e., ~25 cm−1). A similar unzipping behavior but associated with a larger difference in εT was observed for the O2-75RH-treated sample. In this case, the PL peak position (Figure 5E) of the unzipped region (black circle in Figure 5D) displayed a large blue shift (20 nm) compared to that from the basal plane, showing that the εT was relieved. Raman spectra analysis (Figure 5F) further supported the fact that the basal plane has a larger εT (larger interpeak separation) compared to that for the O2-treated crystal.
These defects are different from the defects that can exist in the as-grown state. Figure S6A,B show PL images of the as-prepared MoS2 sample and the same sample after incubation. Bright PL originates from the crack or unzipping regions, showing an increase in line defects. However, the existing cracks in the as-prepared sample appear to be random, in contrast to the precise zz-directional unzipping after O2-75RH treatment. The AFM phase image (Figure S6C) clearly shows that the O2-75RH-treated sample had precise turns and angles of unzipping with respect to the edges. In addition, proceeding from the edges to the center slowly changed the unzipping direction from ac to zz lines. Figure S7 shows the AFM phase images from O2- (Figure S7A–C) and O2-75RH-treated (Figure S7D–F) samples. Irrespective of the presence of H2O, nearly all the ac unzipping at the edges changed into the zz direction in the basal plane within a few micrometers. Interestingly, the width of the ac unzipping is much less than that of the zz unzipping, presumably owing to the εT difference in the central and peripheral regions. Along with the PL and Raman studies, this finding strongly supports the fact that directional unzipping is dependent on ε.
The AFM image (Figure 6A) reveals details of the zz-directional line unzipping and origin. The O2-treated sample shows 45 nm wide unzipping. The width is persistent along the unzipped segments. In addition, the 120° turns are very sharp. Since the observed typical εT is in the range of 0.2–0.4%, the width of the MoS2 grain extends by 20–40 nm, which accounts for the few unzippings with a 45 nm width. Similarly, the AFM phase image of the O2-75RH sample (Figure 6B), which has similar εT, displays somewhat similar line width (i.e., 30 nm). As evidenced by Figure S7, typical unzipping occurs in two or three lines along the 10 μm wide MoS2 crystals, in good agreement with the observed line unzipping. Moreover, MoS2 with a few layers also has similar unzipping. Figure S7A–C shows the AFM and corresponding OM images of MoS2 with a few layers. The few-layered regions have less line unzipping compared to single-layered MoS2. In addition, line unzipping is much more random, as indicated by the yellow arrows. We speculate that this effect of fewer and more random unzippings originates from the lesser εT exerted on few-layered MoS2.
The remaining question to be addressed is that of how O2 treatment causes MoS2 to unzip along the zz directions. Raman spectroscopic analysis did not show the presence of detectable signals associated with MoO3. In addition, the energy dispersive spectrum (EDS) using scanning electron microscopy (SEM) was also used to attempt to probe the nature of line defects, and this only showed strong Si and O signals from the substrate (Figure S8A–C). Mo-terminated edges readily produce oxygenated Mo. Because the Mo–O bond length (ca. 2.1 Å) [23] is shorter than that (ca. 2.4 Å) of Mo–S, additional εT should exist near the substitution defect sites, facilitating initial unzipping. Proceeding to zz unzipping seems to be associated with abundant S vacancies in CVD-grown MoS2 [48], which are expected to be much higher than the S vacancies present in exfoliated MoS2 (i.e., ranging from 5 × 10¹² to 5 × 1013 cm−2) [49]. The S vacancies accumulate and are transformed into O-substituted defects with high density up to 1 × 1015 cm−2 upon long-term exposure to ambient conditions [25]. Furthermore, the transmission electron microscopy study [50] showed that, at a high e-beam dose, S vacancies are formed owing to the excision of S atoms. Then, ac line defects up to a few tens of nanometers form as a result of the accumulation of S vacancies by adjacent S diffusion in the MoS2 sheet before forming a zz unzipping. Therefore, the formation and accumulation of S vacancies represent a possible model for the formation of directional unzipping near the center. Directional unzipping change from ac to zz is likely to be associated with a larger εT in the basal plane than at the peripheries.

4. Conclusions

In summary, in the study described above, we found that initial armchair-directional line defects and subsequent zigzag-directional line unzipping occurred upon treatment with O2. Moreover, we showed that these phenomena originate from tension in the chemical-vapor-deposition-grown monolayer MoS2 crystals, caused by the thermal expansion coefficient difference with the substrate. The O2-treated MoS2 crystal exhibited armchair-directional line defects, and the inclusion of water in the incubation atmosphere resulted in further unzipping and folding of MoS2. Raman and photoluminescence spectroscopic studies revealed that different prevailing tensions exist in MoS2 grown by CVD under the four different conditions. Oxygenated defects, along with tension, further facilitated zigzag line unzipping in the MoS2 basal plane upon long-term exposure to an O2 atmosphere. The observations provide a potential strategy for directionally selective engineering of the MoS2 basal plane as part of efforts to prepare novel building blocks such as MoS2 nanoribbons [51]. In addition, the analysis developed for assessing the net contributions of O2 and H2O utilizing a strain-doping plot should be useful for the understanding of redox and catalytic effects.

Supplementary Materials

The following supporting information can be downloaded at: https://www.mdpi.com/article/10.3390/nano12101706/s1. Figure S1: Schematics of environmental incubations for MoS2-containing substrates; Figure S2: AFM phase images of the sample; Figure S3: AFM height images of entrapped water; Figure S4: A° and A contributions to PL spectra from central regions of MoS2; Figure S5: PL spectrum analysis of the peripheral regions of MoS2 treated by different environments; Figure S6: PL image and AFM phase image of MoS2 before and after O2-75RH treatment for three months; Figure S7: The ac-to-zz directional unzipping change, proceeding from edges to center; Figure S8: EDS of selected area from zz unzipped samples.

Author Contributions

Conceptualization, writing, and supervision: S.-Y.J.; methodology: Y.S., M.P., and J.P.; funding acquisition: T.K.K., S.-Y.J. and H.S.A., All authors have read and agreed to the published version of the manuscript.

Funding

This research was funded by the Basic Science Research Program through the National Research Foundation of Korea (NRF) funded by the Ministry of Education, Science, and Technology (NRF-2022R1A2C1006932, NRF-2020R1F1A1076983 and NRF-2020R1A4A1017737).

Data Availability Statement

Not applicable.

Conflicts of Interest

The authors declare no conflict of interest.

References

  1. Splendiani, A.; Sun, L.; Zhang, Y.; Li, T.; Kim, J.; Chim, C.-Y.; Galli, G.; Wang, F. Emerging Photoluminescence in Monolayer MoS2. Nano Lett. 2010, 10, 1271–1275. [Google Scholar] [CrossRef] [PubMed]
  2. Mak, K.F.; Lee, C.; Hone, J.; Shan, J.; Heinz, T.F. Atomically Thin MoS2: A New Direct-Gap Semiconductor. Phys. Rev. Lett. 2010, 105, 136805. [Google Scholar] [CrossRef] [Green Version]
  3. Shi, H.; Yan, R.; Bertolazzi, S.; Brivio, J.; Gao, B.; Kis, A.; Jena, D.; Xing, H.G.; Huang, L. Exciton Dynamics in Suspended Monolayer and Few-Layer MoS2 2D Crystals. ACS Nano 2013, 7, 1072–1080. [Google Scholar] [CrossRef]
  4. Xiao, D.; Liu, G.-B.; Feng, W.; Xu, X.; Yao, W. Coupled Spin and Valley Physics in Monolayers of MoS2 and Other Group-VI Dichalcogenides. Phys. Rev. Lett. 2012, 108, 196802. [Google Scholar] [CrossRef] [PubMed] [Green Version]
  5. Mak, K.F.; He, K.; Shan, J.; Heinz, T.F. Control of Valley Polarization in Monolayer MoS2 by Optical Helicity. Nat. Nanotechnol. 2012, 7, 494–498. [Google Scholar] [CrossRef] [PubMed]
  6. Hinnemann, B.; Moses, P.G.; Bonde, J.; Jørgensen, K.P.; Nielsen, J.H.; Horch, S.; Chorkendorff, I.; Nørskov, J.K. Biomimetic Hydrogen Evolution:  MoS2 Nanoparticles as Catalyst for Hydrogen Evolution. J. Am. Chem. Soc. 2005, 127, 5308–5309. [Google Scholar] [CrossRef]
  7. Jaramillo, T.F.; Jørgensen, K.P.; Bonde, J.; Nielsen, J.H.; Horch, S.; Chorkendorff, I. Identification of Active Edge Sites for Electrochemical H2 Evolution from MoS2 Nanocatalysts. Science 2007, 317, 100–102. [Google Scholar] [CrossRef] [Green Version]
  8. Li, Y.; Wang, H.; Xie, L.; Liang, Y.; Hong, G.; Dai, H. MoS2 Nanoparticles Grown on Graphene: An Advanced Catalyst for the Hydrogen Evolution Reaction. J. Am. Chem. Soc. 2011, 133, 7296–7299. [Google Scholar] [CrossRef] [Green Version]
  9. Evans, B.L.; Young, P.A.; Ditchburn, R.W. Optical absorption and dispersion in molybdenum disulphide. Proc. R. Soc. Lond. A 1965, 284, 402–422. [Google Scholar] [CrossRef]
  10. Mak, K.F.; He, K.; Lee, C.; Lee, G.H.; Hone, J.; Heinz, T.F.; Shan, J. Tightly Bound Trions in Monolayer MoS2. Nat. Mater. 2013, 12, 207–211. [Google Scholar] [CrossRef]
  11. Lloyd, D.; Liu, X.; Christopher, J.W.; Cantley, L.; Wadehra, A.; Kim, B.L.; Goldberg, B.B.; Swan, A.K.; Bunch, J.S. Band Gap Engineering with Ultralarge Biaxial Strains in Suspended Monolayer MoS2. Nano Lett. 2016, 16, 5836–5841. [Google Scholar] [CrossRef] [PubMed] [Green Version]
  12. Mouri, S.; Miyauchi, Y.; Matsuda, K. Tunable Photoluminescence of Monolayer MoS2 via Chemical Doping. Nano Lett. 2013, 13, 5944–5948. [Google Scholar] [CrossRef] [PubMed] [Green Version]
  13. Castellanos-Gomez, A.; Roldán, R.; Cappelluti, E.; Buscema, M.; Guinea, F.; van der Zant, H.S.J.; Steele, G.A. Local Strain Engineering in Atomically Thin MoS2. Nano Lett. 2013, 13, 5361–5366. [Google Scholar] [CrossRef] [PubMed] [Green Version]
  14. Zhang, C.; Li, M.-Y.; Tersoff, J.; Han, Y.; Su, Y.; Li, L.-J.; Muller, D.A.; Shih, C.-K. Strain Distributions and Their Influence on Electronic Structures of WSe2–MoS2 Laterally Strained Heterojunctions. Nat. Nanotechnol. 2018, 13, 152–158. [Google Scholar] [CrossRef]
  15. Island, J.O.; Kuc, A.; Diependaal, E.H.; Bratschitsch, R.; van der Zant, H.S.J.; Heine, T.; Castellanos-Gomez, A. Precise and Reversible Band Gap Tuning in Single-Layer MoSe2 by Uniaxial Strain. Nanoscale 2016, 8, 2589–2593. [Google Scholar] [CrossRef] [Green Version]
  16. McCreary, A.; Ghosh, R.; Amani, M.; Wang, J.; Duerloo, K.-A.N.; Sharma, A.; Jarvis, K.; Reed, E.J.; Dongare, A.M.; Banerjee, S.K.; et al. Effects of Uniaxial and Biaxial Strain on Few-Layered Terrace Structures of MoS2 Grown by Vapor Transport. ACS Nano 2016, 10, 3186–3197. [Google Scholar] [CrossRef]
  17. Tongay, S.; Zhou, J.; Ataca, C.; Liu, J.; Kang, J.S.; Matthews, T.S.; You, L.; Li, J.; Grossman, J.C.; Wu, J. Broad-Range Modulation of Light Emission in Two-Dimensional Semiconductors by Molecular Physisorption Gating. Nano Lett. 2013, 13, 2831–2836. [Google Scholar] [CrossRef]
  18. Nan, H.; Wang, Z.; Wang, W.; Liang, Z.; Lu, Y.; Chen, Q.; He, D.; Tan, P.; Miao, F.; Wang, X.; et al. Strong Photoluminescence Enhancement of MoS2 through Defect Engineering and Oxygen Bonding. ACS Nano 2014, 8, 5738–5745. [Google Scholar] [CrossRef] [Green Version]
  19. Gao, J.; Li, B.; Tan, J.; Chow, P.; Lu, T.-M.; Koratkar, N. Aging of Transition Metal Dichalcogenide Monolayers. ACS Nano 2016, 10, 2628–2635. [Google Scholar] [CrossRef]
  20. Jung, C.; Yang, H.I.; Choi, W. Effect of Ultraviolet-Ozone Treatment on MoS2 Monolayers: Comparison of Chemical-Vapor-Deposited Polycrystalline Thin Films and Mechanically Exfoliated Single Crystal Flakes. Nanoscale Res. Lett. 2019, 14, 278. [Google Scholar] [CrossRef] [Green Version]
  21. Yamamoto, M.; Einstein, T.L.; Fuhrer, M.S.; Cullen, W.G. Anisotropic Etching of Atomically Thin MoS2. J. Phys. Chem. C 2013, 117, 25643–25649. [Google Scholar] [CrossRef]
  22. Grønborg, S.S.; Thorarinsdottir, K.; Kyhl, L.; Rodriguez-Fernández, J.; Sanders, C.E.; Bianchi, M.; Hofmann, P.; Miwa, J.A.; Ulstrup, S.; Lauritsen, J.V. Basal Plane Oxygen Exchange of Epitaxial MoS2 without Edge Oxidation. 2D Mater. 2019, 6, 045013. [Google Scholar] [CrossRef]
  23. Kc, S.; Longo, R.C.; Wallace, R.M.; Cho, K. Surface Oxidation Energetics and Kinetics on MoS2 Monolayer. J. Appl. Phys. 2015, 117, 135301. [Google Scholar] [CrossRef]
  24. Rao, R.; Islam, A.E.; Campbell, P.M.; Vogel, E.M.; Maruyama, B. In situ Thermal Oxidation Kinetics in Few Layer MoS2. 2D Mater. 2017, 4, 025058. [Google Scholar] [CrossRef]
  25. Pető, J.; Ollár, T.; Vancsó, P.; Popov, Z.I.; Magda, G.Z.; Dobrik, G.; Hwang, C.; Sorokin, P.B.; Tapasztó, L. Spontaneous Doping of the Basal Plane of MoS2 Single Layers through Oxygen Substitution under Ambient Conditions. Nat. Chem. 2018, 10, 1246–1251. [Google Scholar] [CrossRef]
  26. Longo, R.C.; Addou, R.; Kc, S.; Noh, J.-Y.; Smyth, C.M.; Barrera, D.; Zhang, C.; Hsu, J.W.P.; Wallace, R.M.; Cho, K. Intrinsic Air Stability Mechanisms of Two-Dimensional Transition Metal Dichalcogenide Surfaces: Basal versus Edge Oxidation. 2D Mater. 2017, 4, 025050. [Google Scholar] [CrossRef]
  27. Koo, E.; Lee, Y.; Song, Y.; Park, M.; Ju, S.-Y. Growth Order-Dependent Strain Variations of Lateral Transition Metal Dichalcogenide Heterostructures. ACS. Appl. Electron. Mater. 2019, 1, 113–121. [Google Scholar] [CrossRef]
  28. Han, G.H.; Kybert, N.J.; Naylor, C.H.; Lee, B.S.; Ping, J.; Park, J.H.; Kang, J.; Lee, S.Y.; Lee, Y.H.; Agarwal, R.; et al. Seeded Growth of Highly Crystalline Molybdenum Disulphide Monolayers at Controlled Locations. Nat. Commun. 2015, 6, 6128. [Google Scholar] [CrossRef] [Green Version]
  29. Koo, E.; Ju, S.-Y. Role of Residual Polymer on Chemical Vapor Grown Graphene by Raman Spectroscopy. Carbon 2015, 86, 318–324. [Google Scholar] [CrossRef]
  30. Brien, F.E.M.O. The Control of Humidity by Saturated Salt Solutions. J. Sci. Instrum. 1948, 25, 73. [Google Scholar] [CrossRef]
  31. Koo, E.; Kim, S.; Ju, S.-Y. Relationships between the Optical and Raman Behavior of Van Hove Singularity in Twisted Bi- and Fewlayer Graphenes and Environmental Effects. Carbon 2017, 111, 238–247. [Google Scholar] [CrossRef]
  32. Chaste, J.; Missaoui, A.; Huang, S.; Henck, H.; Ben Aziza, Z.; Ferlazzo, L.; Naylor, C.; Balan, A.; Johnson, A.T.C.; Braive, R.; et al. Intrinsic Properties of Suspended MoS2 on SiO2/Si Pillar Arrays for Nanomechanics and Optics. ACS Nano 2018, 12, 3235–3242. [Google Scholar] [CrossRef] [PubMed] [Green Version]
  33. Rao, R.; Islam, A.E.; Singh, S.; Berry, R.; Kawakami, R.K.; Maruyama, B.; Katoch, J. Spectroscopic Evaluation of Charge-Transfer Doping and Strain in Graphene/MoS2 Heterostructures. Phys. Rev. B 2019, 99, 195401. [Google Scholar] [CrossRef] [Green Version]
  34. Michail, A.; Delikoukos, N.; Parthenios, J.; Galiotis, C.; Papagelis, K. Optical Detection of Strain and Doping Inhomogeneities in Single Layer MoS2. Appl. Phys. Lett. 2016, 108, 173102. [Google Scholar] [CrossRef] [Green Version]
  35. Lee, J.E.; Ahn, G.; Shim, J.; Lee, Y.S.; Ryu, S. Optical Separation of Mechanical Strain from Charge Doping in Graphene. Nat. Commun. 2012, 3, 1024. [Google Scholar] [CrossRef] [PubMed] [Green Version]
  36. Liu, Z.; Amani, M.; Najmaei, S.; Xu, Q.; Zou, X.; Zhou, W.; Yu, T.; Qiu, C.; Birdwell, A.G.; Crowne, F.J.; et al. Strain and Structure Heterogeneity in MoS2 Atomic Layers grown by Chemical Vapour Deposition. Nat. Commun. 2014, 5, 5246. [Google Scholar] [CrossRef] [Green Version]
  37. van der Zande, A.M.; Huang, P.Y.; Chenet, D.A.; Berkelbach, T.C.; You, Y.; Lee, G.-H.; Heinz, T.F.; Reichman, D.R.; Muller, D.A.; Hone, J.C. Grains and Grain Boundaries in Highly Crystalline Monolayer Molybdenum Disulphide. Nat. Mater. 2013, 12, 554–561. [Google Scholar] [CrossRef] [Green Version]
  38. Frisenda, R.; Drüppel, M.; Schmidt, R.; Michaelis de Vasconcellos, S.; Perez de Lara, D.; Bratschitsch, R.; Rohlfing, M.; Castellanos-Gomez, A. Biaxial Strain Tuning of the Optical Properties of Single-Layer Transition Metal Dichalcogenides. Npj 2D Mater. Appl. 2017, 1, 10. [Google Scholar] [CrossRef]
  39. Lee, C.; Yan, H.; Brus, L.E.; Heinz, T.F.; Hone, J.; Ryu, S. Anomalous Lattice Vibrations of Single- and Few-Layer MoS2. ACS Nano 2010, 4, 2695–2700. [Google Scholar] [CrossRef] [Green Version]
  40. Xu, K.; Cao, P.; Heath, J.R. Graphene Visualizes the First Water Adlayers on Mica at Ambient Conditions. Science 2010, 329, 1188–1191. [Google Scholar] [CrossRef] [Green Version]
  41. Lee, D.; Ahn, G.; Ryu, S. Two-Dimensional Water Diffusion at a Graphene–Silica Interface. J. Am. Chem. Soc. 2014, 136, 6634–6642. [Google Scholar] [CrossRef] [PubMed] [Green Version]
  42. Ma, M.; Tocci, G.; Michaelides, A.; Aeppli, G. Fast Diffusion of Water Nanodroplets on Graphene. Nat. Mater. 2016, 15, 66–71. [Google Scholar] [CrossRef] [Green Version]
  43. Varghese, J.O.; Agbo, P.; Sutherland, A.M.; Brar, V.W.; Rossman, G.R.; Gray, H.B.; Heath, J.R. The Influence of Water on the Optical Properties of Single-Layer Molybdenum Disulfide. Adv. Mater. 2015, 27, 2734–2740. [Google Scholar] [CrossRef] [Green Version]
  44. Lee, J.-U.; Kim, K.; Cheong, H. Resonant Raman and Photoluminescence Spectra of Suspended Molybdenum Disulfide. 2D Mater. 2017, 2, 044003. [Google Scholar] [CrossRef] [Green Version]
  45. Yan, R.; Simpson, J.R.; Bertolazzi, S.; Brivio, J.; Watson, M.; Wu, X.; Kis, A.; Luo, T.; Hight Walker, A.R.; Xing, H.G. Thermal Conductivity of Monolayer Molybdenum Disulfide Obtained from Temperature-Dependent Raman Spectroscopy. ACS Nano 2014, 8, 986–993. [Google Scholar] [CrossRef]
  46. Chakraborty, B.; Bera, A.; Muthu, D.V.S.; Bhowmick, S.; Waghmare, U.V.; Sood, A.K. Symmetry-Dependent Phonon Renormalization in Monolayer MoS2 Transistor. Phys. Rev. B 2012, 85, 161403. [Google Scholar] [CrossRef] [Green Version]
  47. Zhou, H.; Yu, F.; Liu, Y.; Zou, X.; Cong, C.; Qiu, C.; Yu, T.; Yan, Z.; Shen, X.; Sun, L.; et al. Thickness-Dependent Patterning of MoS2 Sheets with Well-Oriented Triangular Pits by Heating in Air. Nano Res. 2013, 6, 703–711. [Google Scholar] [CrossRef]
  48. Hong, J.; Hu, Z.; Probert, M.; Li, K.; Lv, D.; Yang, X.; Gu, L.; Mao, N.; Feng, Q.; Xie, L.; et al. Exploring Atomic Defects in Molybdenum Disulphide Monolayers. Nat. Commun. 2015, 6, 6293. [Google Scholar] [CrossRef] [Green Version]
  49. Vancsó, P.; Magda, G.Z.; Pető, J.; Noh, J.-Y.; Kim, Y.-S.; Hwang, C.; Biró, L.P.; Tapasztó, L. The Intrinsic Defect Structure of Exfoliated MoS2 Single Layers Revealed by Scanning Tunneling Microscopy. Sci. Rep. 2016, 6, 29726. [Google Scholar] [CrossRef] [Green Version]
  50. Ryu, G.H.; Lee, J.; Kim, N.Y.; Lee, Y.; Kim, Y.; Kim, M.J.; Lee, C.; Lee, Z. Line-Defect Mediated Formation of Hole and Mo Clusters in Monolayer Molybdenum Disulfide. 2D Mater. 2016, 3, 014002. [Google Scholar] [CrossRef]
  51. Reiss, P.; Protière, M.; Li, L. Core/Shell Semiconductor Nanocrystals. Small 2009, 5, 154–168. [Google Scholar] [CrossRef] [PubMed]
Figure 1. The characterizations of the as-grown MoS2 grains by various methods: (A) OM image; (B) the corresponding AFM height topography; (C) PL image with emission filtered using a 660 nm bandpass filter. Scale bars: 10 μm. (D) PL spectra obtained from central and peripheral parts of MoS2 and its Lorentzian deconvolutions to indicate A°, A, and B, respectively. Dashed lines are drawn for comparison of the position. (E) The corresponding Raman spectra (circles) and its Lorentzian deconvolutions (green).
Nanomaterials 12 01706 g001
Figure 2. AFM height images of MoS2 crystals treated with: (a) N2; (b) N2-75RH; (c) O2; (d) O2-75RH. White traces are height profiles of MoS2. Inset of (c): crystallographic orientation of line defects of O2-treated MoS2, with Mo and S color-coded in green and yellow, respectively. Inset of (d): AFM height image of directional unzipping from MoS2 edges in red box in (d). Scale bar: 10 μm for (ad); 1 μm for the inset of (d).
Nanomaterials 12 01706 g002
Figure 3. PL images, spectra, and analysis at central and peripheral positions of MoS2 crystals after incubation for two weeks under each condition. PL images from: (A) N2; (B) N2-75RH; (C) O2; (D) O2-75RH samples. Scale bar: 10 μm. PL intensities of (A,B) were multiplied for visual comparison. Normalized PL spectra from (E) central, and (F) peripheral regions with respect to the 520.89 cm−1 Si peak. (G) PL peak position and (H) PL peak-area changes of Ao and A derived by each treatment from central regions.
Nanomaterials 12 01706 g003
Figure 4. Raman spectra of (a) central and (b) peripheral regions from the incubated MoS2 crystals. Excitation wavelength: 532 nm. Raman spectra were deconvoluted by Lorentzian shape analysis and normalized according to the Si peak at 520.84 cm–1 nm. (c) Plot of ε (black dashed line) and n (red dashed line) with origin O = (E12g, A1g) = (385.3, 404.8) extracted from Raman spectra of suspended MoS2 sample. Here, εT and εC stand for tensile and compressive strains, respectively, and n and p denote n and p doping, respectively. Solid lines between Raman points are drawn for grouping the same samples.
Nanomaterials 12 01706 g004
Figure 5. The zz-directional line unzipping of MoS2 induced by a three-month exposure to O2 and O2-75RH environments. (A) AFM phase image of MoS2 with O2. (B) Corresponding normalized PL spectra and (C) Raman spectra obtained from marked positions in (A). Line profile was obtained from the corresponding height image. Raman bands were deconvoluted by Lorentzian shape analysis. (D) AFM phase image of MoS2 after three-month incubations with O2-75RH. (E) Corresponding PL spectra and (F) Raman spectra obtained from marked positions in (D).
Nanomaterials 12 01706 g005
Figure 6. (A) AFM height image of line unzipping from O2-treated MoS2 sample. (B) AFM phase image of line unzipping from O2-75RH-treated MoS2 sample. It is noteworthy that the phase image was selected to display cracks. Line profile was obtained from the corresponding height image.
Nanomaterials 12 01706 g006
Publisher’s Note: MDPI stays neutral with regard to jurisdictional claims in published maps and institutional affiliations.

