
Functionalized Mesoporous Silica as Doxorubicin Carriers and Cytotoxicity Boosters

 , ,
, ,
Abstract
:
1. Introduction
2. Materials and Methods
- Cell culture
- CellTiter-Glo® assay
2.1. Synthesis of Mesoporous Silica
2.2. Drug Encapsulation
2.3. In Vitro Drug Release Study
3. Results and Discussion
3.1. Synthesis and Characterization of Mesoporous Silica
3.2. Interactions between Dox and Functional Silica
3.3. Molecular Dynamics Simulations
3.4. Fluorescence
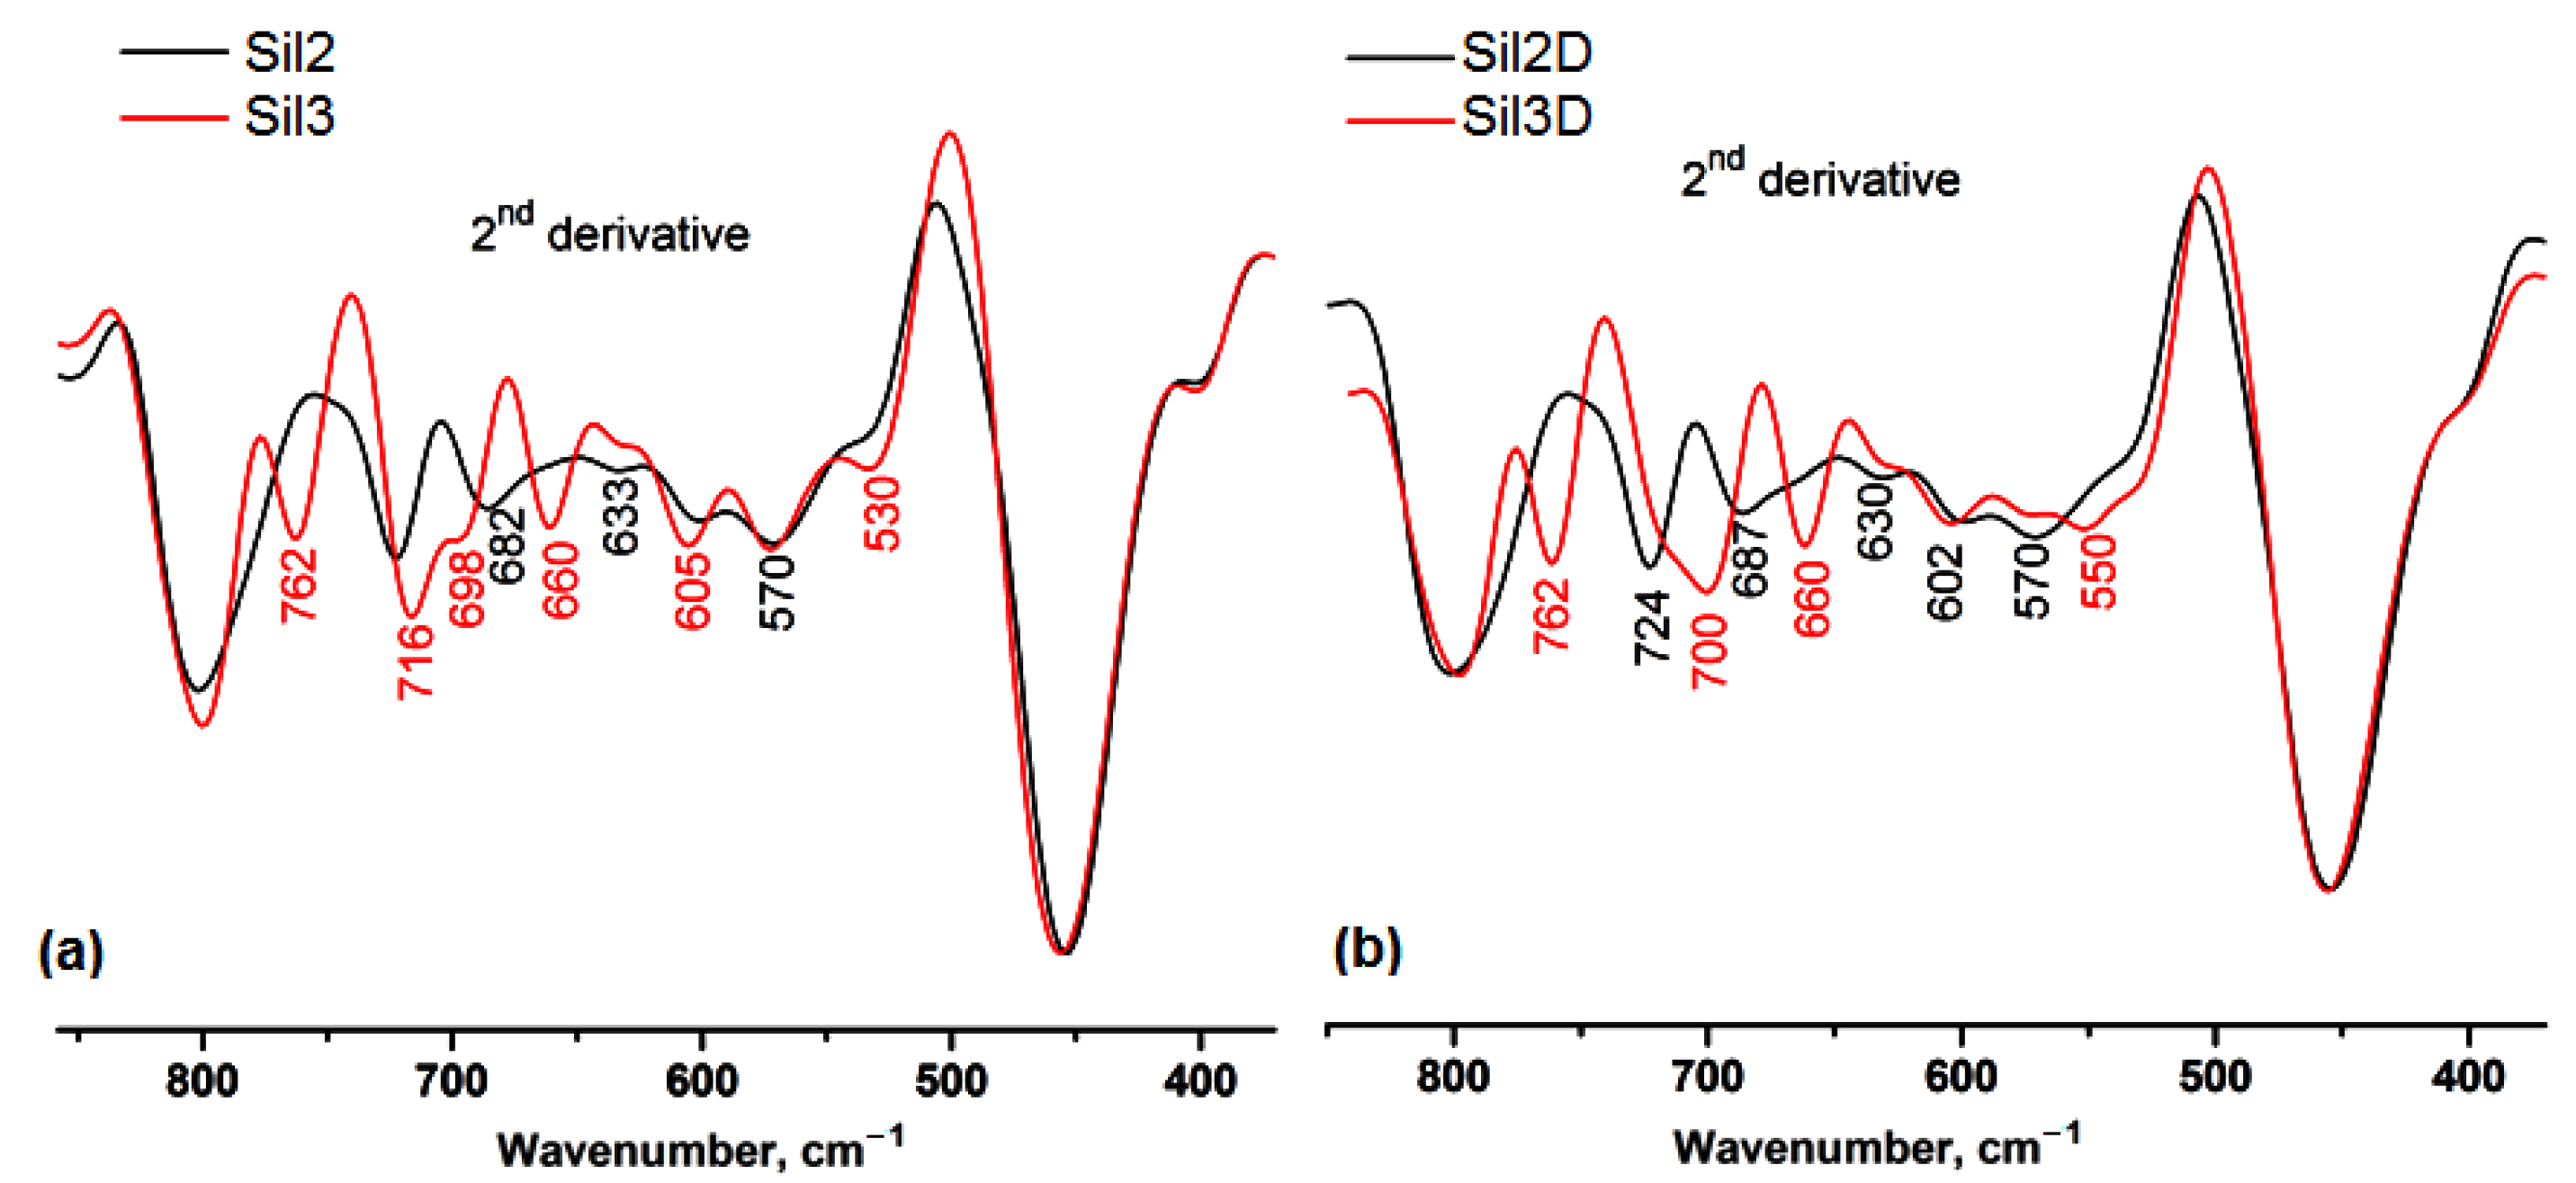
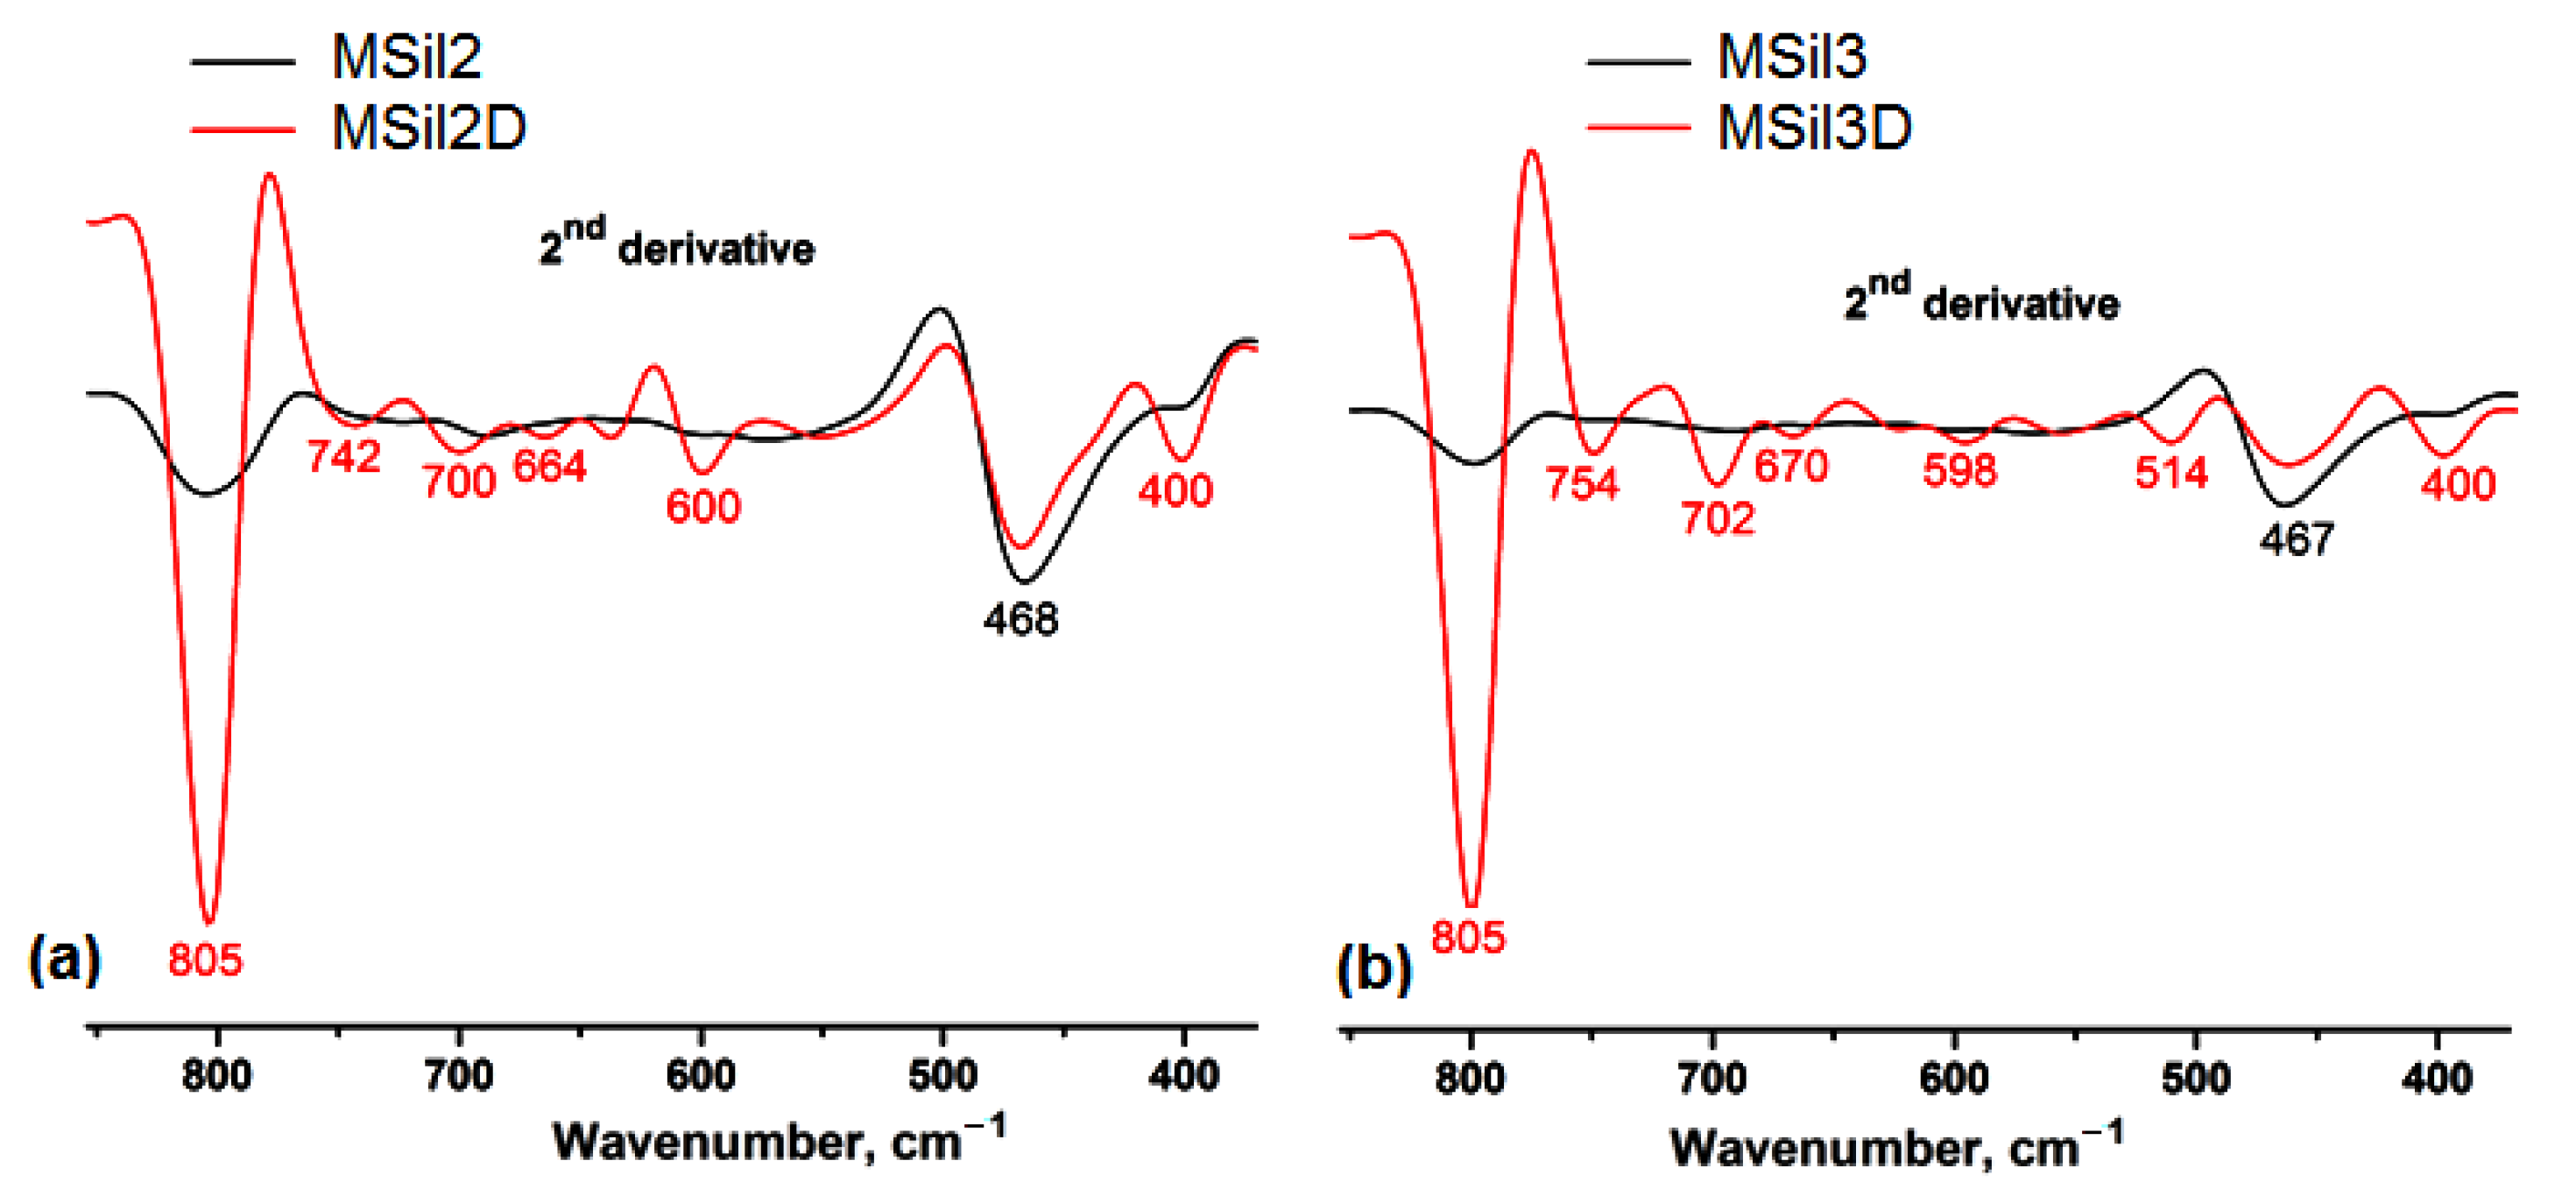
3.5. IR Spectroscopy
3.6. Encapsulation of Dox
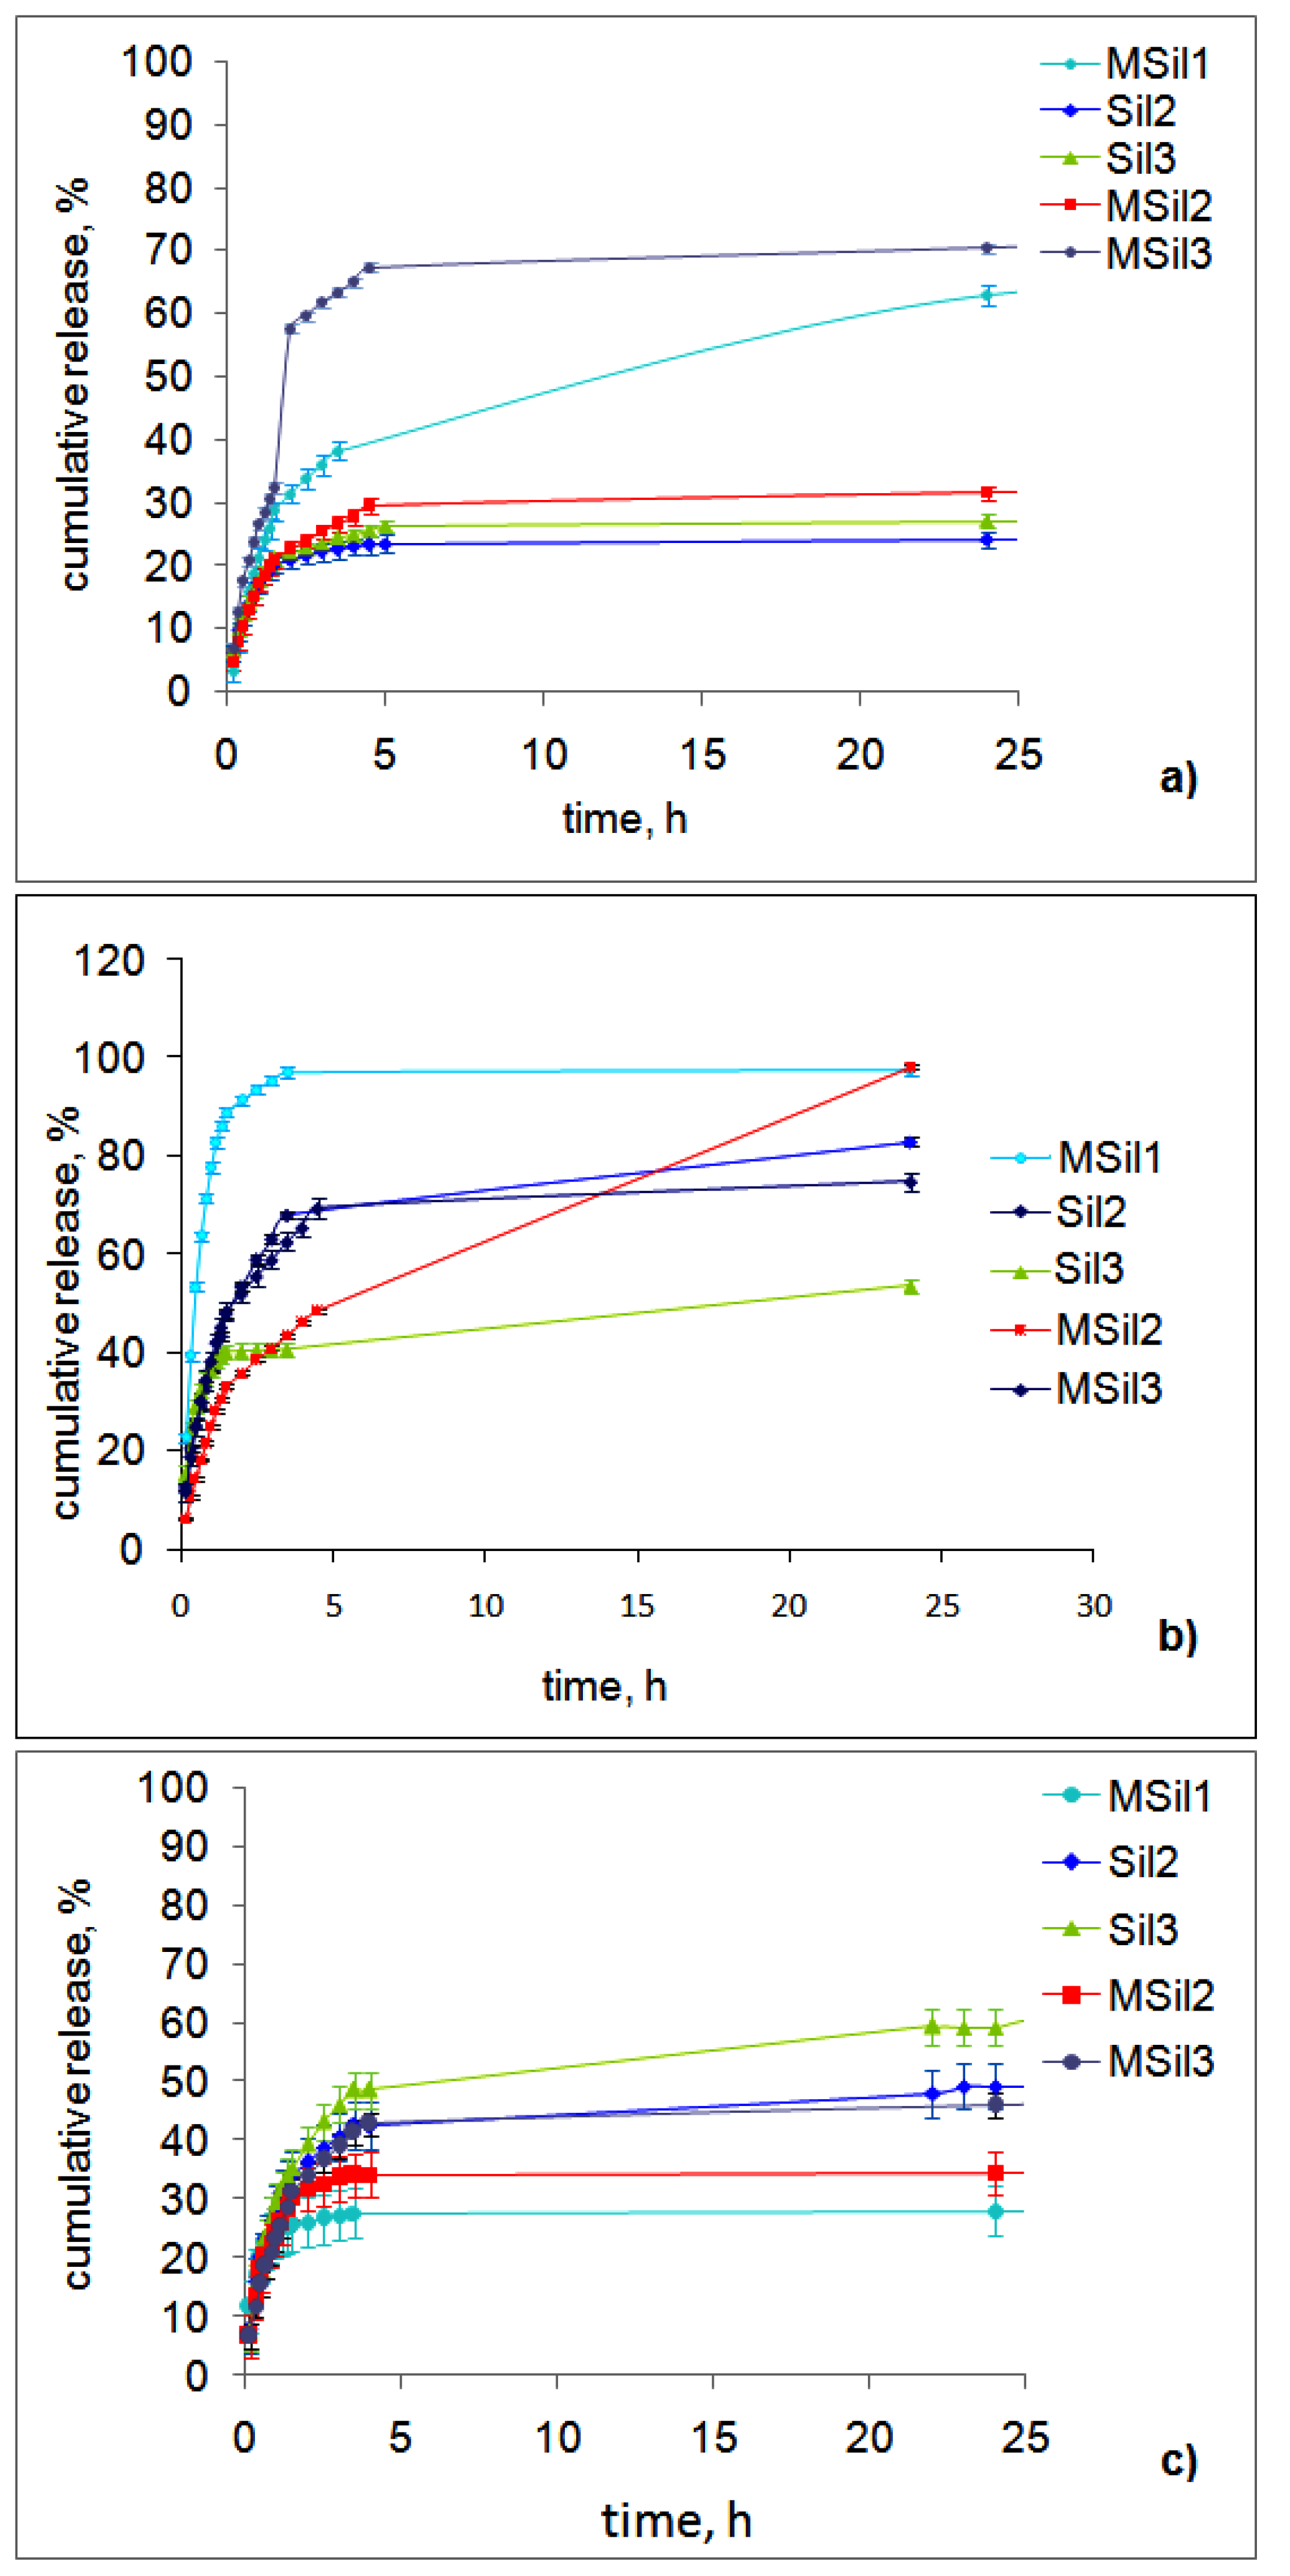
3.7. Release of Dox in Different PBS
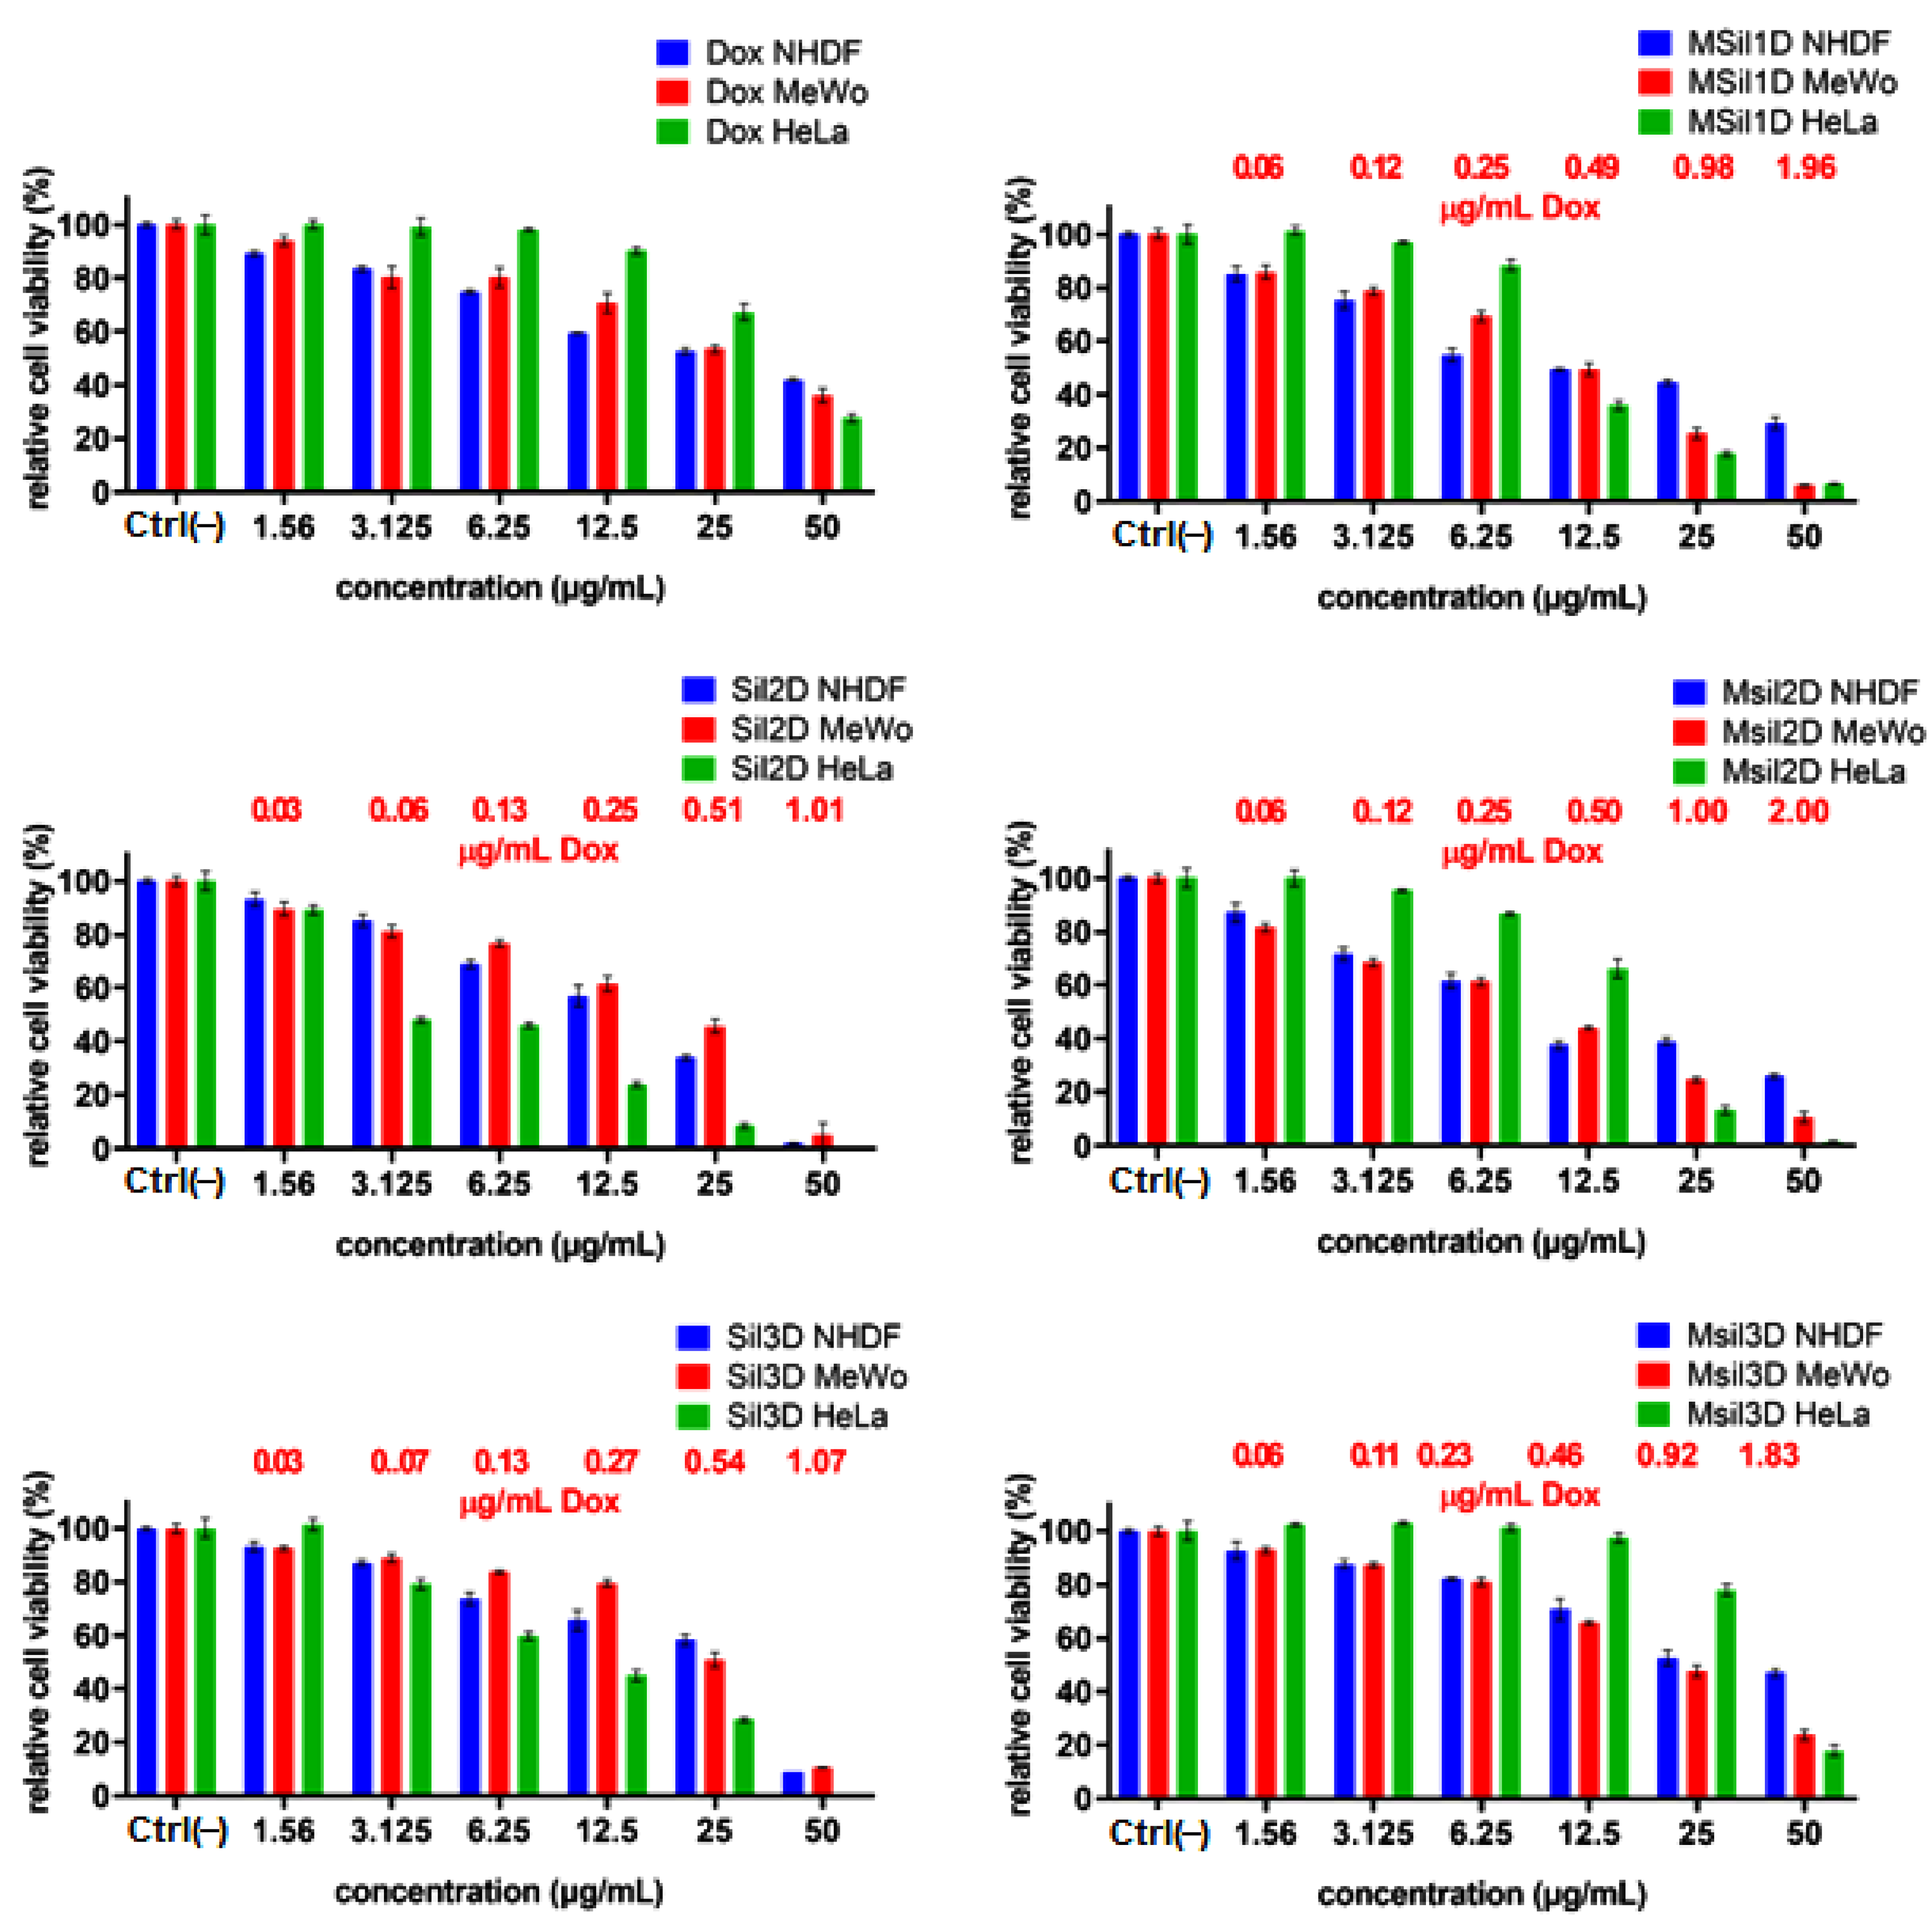
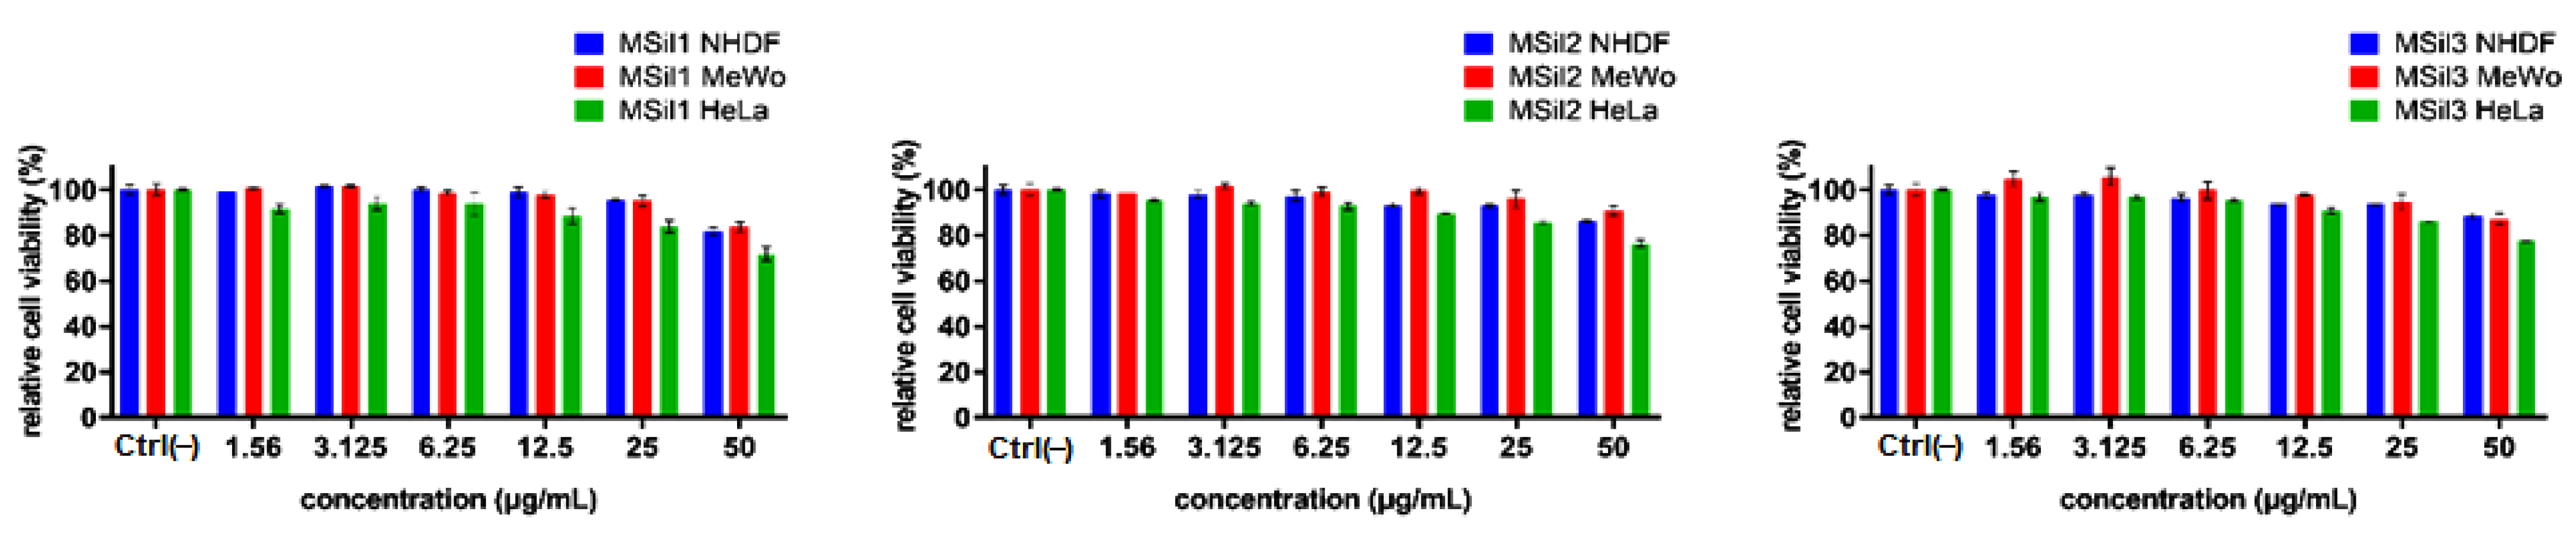
3.8. In Vitro Cytotoxicity
4. Conclusions
Supplementary Materials
Author Contributions
Funding
Data Availability Statement
Acknowledgments
Conflicts of Interest
References
- Golla, K.; Bhaskar, C.; Ahmed, F.; Kondapi, A.K. A target-specific oral formulation of doxorubicin-protein nanoparticles: Efficacy and safety in hepatocellular cancer. J. Cancer 2013, 4, 644–652. [Google Scholar] [CrossRef] [PubMed] [Green Version]
- Jain, A.K.; Swarnakar, N.K.; Das, M.; Godugu, C.; Singh, R.P.; Rao, P.R.; Jain, S. Augmented anticancer efficacy of doxorubicin-loaded polymeric nanoparticles after oral administration in a breast cancer induced animal model. Mol. Pharm. 2011, 8, 1140–1151. [Google Scholar] [CrossRef] [PubMed]
- Tupal, A.; Sabzichi, M.; Ramezani, F.; Kouhsoltani, M.; Hamishehkar, H. Dermal delivery of doxorubicin-loaded solid lipid nanoparticles for the treatment of skin cancer. J. Microencapsul. 2016, 33, 372–380. [Google Scholar] [CrossRef] [PubMed]
- Gao, F.; Wang, Q.; Yang, X. pH-responsive nanoparticles based on optimized synthetic amphiphilic poly(β-amino esters) for doxorubicin delivery. Colloid Polym. Sci. 2020, 298, 303–312. [Google Scholar] [CrossRef]
- Lien, N.T.H.; Phan, A.D.; Khanh, B.T.V.; Thuy, N.T.; Nghia, N.T.; Nhung, H.T.M.; Nhung, T.H.; Hoa, D.Q.; Duong, V.; Hue, N.M. Applications of mesoporous silica-encapsulated gold nanorods, loaded doxorubicin in chemo-photothermal therapy. ACS Omega 2020, 5, 20231–20237. [Google Scholar] [CrossRef]
- Dang, H.P.; Shafiee, A.; Lahr, C.A.; Dargaville, T.R.; Tran, P.A. Local doxorubicin delivery via 3D-Printed porous scaffolds reduces systemic cytotoxicity and breast cancer recurrence in mice. Adv. Ther. 2020, 3, 2000056. [Google Scholar] [CrossRef]
- Kirtane, A.R.; Narayan, P.; Liu, G.; Panyam, J. Polymer-Surfactant nanoparticles for improving oral bioavailability of doxorubicin. J. Pharm. Investig. 2017, 47, 65–73. [Google Scholar] [CrossRef]
- Barbé, C.J.; Bartlett, J.R.; Kong, L.; Finnie, K.S.; Lin, H.Q.; Larkin, M.; Calleja, S.; Bush, A.J. Silica Particles: A Novel Drug-Delivery System. Adv. Mater. 2004, 16, 1959–1966. [Google Scholar] [CrossRef]
- Ways, T.M.M.; Ng, K.W.; Lau, W.M.; Khutoryanskiy, V.V. Silica nanoparticles in transmucosal drug delivery. Pharmaceutics 2020, 12, 751. [Google Scholar] [CrossRef]
- Chen, N.-T.; Cheng, S.-H.; Souris, J.S.; Chen, C.-T.; Mou, C.-Y.; Lo, L.-W. Theranostic applications of mesoporous silica nanoparticles and their organic/inorganic hybrids. J. Mater. Chem. B 2013, 1, 3128–3135. [Google Scholar] [CrossRef]
- Mochizuki, C.; Nakamura, J.; Nakamura, M. Development of non-porous silica nanoparticles towards cancer photo-theranostics. Biomedicines 2021, 9, 73. [Google Scholar] [CrossRef] [PubMed]
- Niu, Y.; Tang, E.; Zhang, Q. Cytotoxic effect of silica nanoparticles against hepatocellular carcinoma cells through necroptosis induction. Toxicol. Res. 2019, 8, 1042–1049. [Google Scholar] [CrossRef] [PubMed] [Green Version]
- Castillo, R.R.; Lozano, D.; Vallet-Regí, M. mesoporous silica nanoparticles as carriers for therapeutic biomolecules. Pharmaceutics 2020, 12, 432. [Google Scholar] [CrossRef] [PubMed]
- Shen, J.; He, Q.; Gao, Y.; Shi, J.; Li, Y. Mesoporous silica nanoparticles loading doxorubicin reverse multidrug resistance: Performance and mechanism. Nanoscale 2011, 3, 4314–4322. [Google Scholar] [CrossRef]
- Ye, F.; Laurent, S.; Fornara, A.; Astolfi, L.; Qin, J.; Roch, A.; Martini, A.; Toprak, M.S.; Muller, R.N.; Muhammed, M. Uniform mesoporous silica coated iron oxide nanoparticles as a highly efficient, nontoxic MRI T2 contrast agent with tunable proton relaxivities. Contrast Media Mol. Imaging 2012, 7, 460–468. [Google Scholar] [CrossRef]
- Heggannavar, G.B.; Hiremath, C.G.; Achari, D.D.; Pangarkar, V.G.; Kariduraganavar, M.Y. Development of doxorubicin-loaded magnetic Silica−Pluronic F-127 nanocarriers conjugated with transferrin for treating glioblastoma across the blood−brain barrier using an in vitro model. ACS Omega 2018, 3, 8017–8026. [Google Scholar] [CrossRef]
- Sun, J.-H.; Zhang, W.; Zhang, D.-Y.; Shen, J.; Tan, C.-P.; Ji, L.-N.; Mao, Z.-W. Multifunctional mesoporous silica nanoparticles as efficient transporters of doxorubicin and chlorin e6 for chemo-photodynamic combinatorial cancer therapy. J.Biomater. Appl. 2017, 32, 1253–1264. [Google Scholar] [CrossRef]
- Nguyen, A.K.; Nguyen, T.H.; Bao, B.Q.; Bach, L.G.; Nguyen, D.H. Efficient self-assembly of mPEG end-capped porous silica as a redox-sensitive nanocarrier for controlled doxorubicin delivery. Int. J. Biomater. 2018, 2018, 1575438. [Google Scholar] [CrossRef]
- Hu, X.; Hao, X.; Wu, Y.; Zhang, J.; Zhang, X.; Wang, P.C.; Zou, G.; Liang, X.-J. Multifunctional hybrid silica nanoparticles for controlled doxorubicin loading and release with thermal and pH dual response. J. Mater. Chem. B 2013, 1, 1109–1118. [Google Scholar] [CrossRef]
- Pfaff, A.R.; Beltz, J.; King, E.; Ercal, N. Medicinal Thiols: Current Status and New Perspectives. Mini Rev. Med. Chem. 2020, 20, 513–529. [Google Scholar] [CrossRef]
- Partenhauser, A.; Laffleur, F.; Rohrer, J.; Bernkop-Schnürch, A. Thiolated silicone oil: Synthesis, gelling and mucoadhesive properties. Acta Biomater. 2015, 16, 169–177. [Google Scholar] [CrossRef] [PubMed] [Green Version]
- Zhang, Q.; Neoh, K.G.; Xu, L.; Lu, S.; Kang, E.T.; Mahendran, R.; Chiong, E. Functionalized mesoporous silica nanoparticles with mucoadhesive and sustained drug release properties for potential bladder cancer therapy. Langmuir 2014, 30, 6151–6161. [Google Scholar] [CrossRef] [PubMed]
- Deinavizadeh, M.; Kiasat, A.; Hooshmand, N.; Shafiei, M.; Sabaeian, M.; Mirzajani, R.; Zahraei, S.M.; Labouta, H.I.; El-Sayed, M.A. Smart NIR-light and pH responsive doxorubicin-loaded GNRs@SBA-15-SH nanocomposite for chemo-photothermal therapy of cancer. Nanophotonics 2021, 10, 3303–3319. [Google Scholar] [CrossRef]
- Hua, G.; Liu, Y.; Li, X.; Xu, P.; Luo, Y. Targeting glucose metabolism in chondrosarcoma cells enhances the sensitivity to doxorubicin through the inhibition of lactate dehydrogenase-A. Oncol. Rep. 2014, 31, 2727–2734. [Google Scholar] [CrossRef] [PubMed] [Green Version]
- Sztandera, K.; Działak, P.; Marcinkowska, M.; Stańczyk, M.; Gorzkiewicz, M.; Janaszewska, A.; Klajnert-Maculewicz, B. Sugar modification enhances cytotoxic activity of PAMAM-doxorubicin conjugate in glucose-deprived MCF-7 cells—Possible role of GLUT1 transporter. Pharm. Res. 2019, 36, 140. [Google Scholar] [CrossRef] [PubMed] [Green Version]
- Gautam, L.; Sharma, R.; Shrivastava, P.; Vyas, S. Development and Characterization of Biocompatible Mannose Functionalized Mesospheres: An Effective Chemotherapeutic Approach for Lung Cancer Targeting. AAPS PharmSciTech 2020, 21, 190. [Google Scholar] [CrossRef]
- Abri-Mehraban, F.; Zargar, S.J.; Salarizadeh, N. The effect of glucose on doxorubicin and human hemoglobin interaction: Characterization with spectroscopic techniques. Int. J. Biol. Macromol. 2021, 181, 193–201. [Google Scholar] [CrossRef]
- Elmar, K.; Vriend, G. YASARA View—Molecular graphics for all devices—From smartphones to workstations. Bioinformatics 2014, 30, 2981–2982. [Google Scholar]
- William, H.; Dalke, A.; Schulten, K. VMD: Visual molecular dynamics. J. Mol. Graph. 1996, 14, 33–38. [Google Scholar]
- Racles, C.; Zaltariov, M.; Coroaba, A.; Silion, M.; Diac, C.; Dascalu, A.; Iacob, M.; Cazacu, M. New heterogeneous catalysts containing platinum group metals recovered from a spent catalytic converter. Appl.Organomet. Chem. 2021, 35, e6417. [Google Scholar] [CrossRef]
- Racles, C.; Hamaide, T.; Ioanid, A. Siloxane surfactants in polymernanoparticles formulation. Appl.Organomet. Chem. 2006, 20, 235–245. [Google Scholar] [CrossRef]
- Higuchi, T. Mechanism of sustained-action medication. Theoretical analysis of rate of release of solid drugs dispersed in solid matrices. J. Pharm. Sci. 1963, 52, 1145–1149. [Google Scholar] [CrossRef] [PubMed]
- Korsmeyer, R.W.; Gurny, R.; Doelker, E.; Buri, P.; Peppas, N.A. Mechanisms of solute release from porous hydrophilic polymers. Int. J. Pharm. 1983, 15, 25–35. [Google Scholar] [CrossRef]
- Ritger, P.L.; Peppas, N.A. A simple equation for description of solute release I. Fickian and non-Fickian release from non-swellable devices in the form of slabs, spheres, cylinders or discs. J. Control. Release 1987, 5, 23–26. [Google Scholar] [CrossRef]
- Zeid, A.; Othman, A.L. A Review: Fundamental Aspects of Silicate Mesoporous Materials. Materials 2012, 5, 2874–2902. [Google Scholar]
- Socrates, G. Infrared and Raman Characteristic Group Frequencies: Tables and Charts, 3rd ed.; John Wiley & Sons: New York, NY, USA, 2004; pp. 54–254. [Google Scholar]
- Larkin, P.J. Infrared and Raman Spectroscopy: Principles and Spectral Interpretation, 1st ed.; Elsevier: Amsterdam, The Netherlands, 2011; pp. 10–116. [Google Scholar]
- Capeletti, L.B.; Baibich, I.M.; Butler, I.S.; dos Santos, J.H. Infrared and Raman spectroscopic characterization of some organic substituted hybrid silicas. Spectrochim. Acta A Mol. Biomol. Spectrosc. 2014, 133, 619–625. [Google Scholar] [CrossRef]
- Shao, J.; Lin, M.; Li, Y.; Li, X.; Liu, J.; Liang, J.; Yao, H. In vivo blood glucose quantification using Raman spectroscopy. PLoS ONE 2012, 7, e48127. [Google Scholar]
- Tannock, I.F.; Rotin, D. Acid pH in tumors and its potential for therapeutic exploitation. Cancer Res. 1989, 49, 4173–4384. [Google Scholar]
- Ong, S.; Zhao, X.; Eisenthal, K.B. Polarization of water molecules at a charged interface: Second harmonic studies of the silica/water interface. Chem. Phys. Lett. 1992, 191, 327–335. [Google Scholar] [CrossRef]
- Ronhovde, C.J.; Baer, J.; Larsen, S.C. Effects of pore topology and iron oxide core on doxorubicin loading and release from mesoporous silica nanoparticles. J. Nanoparticle Res. 2017, 19, 215. [Google Scholar] [CrossRef]
- Showing Metabocard for 1-Propanethiol (HMDB0034238). Available online: https://hmdb.ca/metabolites/HMDB0034238 (accessed on 18 March 2022).
- Feng, S.; Bagia, C.; Mpourmpakis, G. Determination of proton affinities and acidity constants of sugars. J. Phys. Chem. A 2013, 117, 5211–5219. [Google Scholar] [CrossRef]
- Doxorubicin. Available online: https://pubchem.ncbi.nlm.nih.gov/source/hsdb/3070 (accessed on 27 August 2021).
- Knezevic, N. Functionalized Mesoporous Silica Nanoparticles for Stimuli-Responsive and Targeted Drug Delivery. Ph.D. Thesis, Iowa State University, Ames, IA, USA, 2009. Available online: https://lib.dr.iastate.edu/etd/11019 (accessed on 22 March 2022).
- Bandak, S.; Ramu, A.; Barenholz, Y.; Gabizon, A. Reduced UV-induced degradation of doxorubicin encapsulated in polyethyleneglycol-coated liposomes. Pharm. Res. 1999, 16, 841–846. [Google Scholar] [CrossRef]
- Behera, S.K.; Mohanty, M.E.; Mohapatra, M. A fluorescence study of the interaction of anticancer drug molecule doxorubicin hydrochloride in pluronic P123 and F127 micelles. J. Fluoresc. 2021, 31, 17–27. [Google Scholar] [CrossRef] [PubMed]
- Al Tameemi, M.B.M.; Dobrinescu, R.; Marton, G.; Ott, C. Doxorubicin loaded silica nanotubes: An investigation of the release behavior. Sci. Bull. Ser. 2015, 77, 185–194. [Google Scholar]
- Roik, N.; Belyakova, L.A.; Dziazko, M.O. Adsorption of antitumor antibiotic doxorubicin on MCM-41-type silica surface. Adsorpt. Sci. Technol. 2017, 35, 86–101. [Google Scholar] [CrossRef]
- Nakamura, M.; Ishimura, K. One-pot synthesis and characterization of three kinds of Thiol-Organosilica nanoparticles. Langmuir 2008, 24, 5099–5108. [Google Scholar] [CrossRef]
- Nakamura, M.; Ozaki, S.; Abe, M.; Matsumoto, T.; Ishimura, K. One-pot synthesis and characterization of dual fluorescent thiol-organosilica nanoparticles as non-photoblinking quantum dots and their applications for biological imaging. J. Mater. Chem. 2011, 21, 4689–4695. [Google Scholar] [CrossRef]
- Wojtkowiak, J.W.; Verduzco, D.; Schramm, K.J.; Gillies, R.J. Drug resistance and cellular adaptation to tumor acidic pH microenvironment. Mol. Pharm. 2011, 8, 2032–2038. [Google Scholar] [CrossRef]
- Fallingborg, J. Intraluminal pH of the human gastrointestinal tract. Dan. Med. Bull. 1999, 46, 183–196. [Google Scholar] [PubMed]
- Janssen, M.; Crommelin, D.; Storm, G.; Hulshoff, A. Doxorubicin decomposition on storage. Effect of pH, type of buffer and liposome encapsulation. Int. J. Pharm. 1985, 23, 1–11. [Google Scholar] [CrossRef]
- Zanetti, M.R.L.; Percebom, A.M.; Ribeiro, T.A.; Dias, M.L.; Oliveira, A.P.; Júnior, E.R.; Rossi, A.L.; Soares, C.A.G.; Picciani, P.H.S. Improving in vitro biocompatibility of gold nanorods with thiol-terminated triblock copolymer. Colloid Polym. Sci. 2019, 297, 1477–1487. [Google Scholar] [CrossRef]
- Li, L.; Kang, L.; Zhao, W.; Feng, Y.; Liu, W.; Wang, T.; Mai, H.; Huang, J.; Chen, S.; Liang, Y.; et al. miR-30a-5p suppresses breast tumor growth and metastasis through inhibition of LDHA-mediated Warburg effect. Cancer Lett. 2017, 400, 89–98. [Google Scholar] [CrossRef] [PubMed]
- Schachter, D. The Source of Toxicity in CTAB and CTAB-Stabilized Gold Nanorods. Master’s Thesis, Biomedical Sciences University of Medicine and Dentistry of New Jersey, New Brunswick, NJ, USA, 2013. Available online: https://rucore.libraries.rutgers.edu/rutgers-lib/39676/ (accessed on 16 March 2022).
- Ito, E.; Yip, K.W.; Katz, D.; Fonseca, S.B.; Hedley, D.W.; Chow, S.; Xu, G.W.; Wood, T.E.; Bastianutto, C.; Schimmer, A.D.; et al. Potential use of cetrimonium bromide as an apoptosis-promoting anticancer agent for head and neck cancer. Mol. Pharmacol. 2009, 76, 969–983. [Google Scholar] [CrossRef] [Green Version]
- He, Q.; Gao, Y.; Zhang, L.; Zhang, Z.; Gao, F.; Ji, X.; Li, Y.; Shi, J. A pH-responsive mesoporous silica nanoparticles-based multi-drug delivery system for overcoming multi-drug resistance. Biomaterials 2011, 32, 7711–7720. [Google Scholar] [CrossRef] [PubMed]
- Dasari, S.; Rajendra, W.; Valluru, L. Evaluation of microbial enzymes in normal and abnormal cervicovaginal fluids of cervical dysplasia: A case control study. BioMed Res. Int. 2014, 2014, 716346. [Google Scholar] [CrossRef] [PubMed]


| Sample | Functional Group, % (Reagents) | BET Area (m2/g) | Pore Size, Å | Morphology |
|---|---|---|---|---|
| MSil1 | CH3, 27 mol% (tetraethoxysilane + methyltriethoxysilane) | 943 | 24.9 | 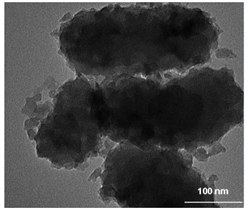 |
| MSil2 | (CH2)3SH, 10 mol% (tetraethoxysilane + 3-mercaptopropyl-trimethoxysilane) | 1319 | 19.4 | 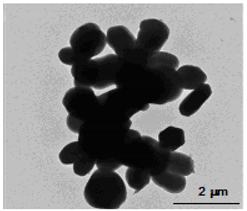 |
| MSil3 | (CH2)3S-(CH2)3-O-(CH2)2-glucose, 12 wt.% (MSil2 + AG) | n.d. | n.d. | 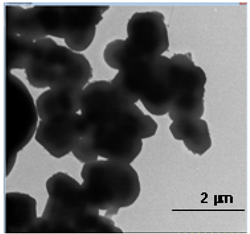 |
| Functional Group | pKa | Ref. |
|---|---|---|
| Si-OH | 4.5; 8.5 | [41] |
| (CH2)3SH | 10.2 | [43] |
| Glucose | 15.8 a | [44] |
| doxorubicin | 7.34 (phenol); 8.46 (amine); 9.46 (est.) | [45] |
| Sample | EE (%) | LC (mg/mg) |
|---|---|---|
| MSil1 | 90.05 | 117 |
| Sil2 | 89.59 | 76.4 |
| Sil3 | 89.70 | 76.5 |
| MSil2 | 173 a | 224.9 |
| MSil3 | 147.4 a | 173.8 |
| Sample | Sil2 | Sil2D | Sil3 | Sil3D | MSil1 | MSil1D | MSil2 | MSil2D | MSil3 | MSil3D |
|---|---|---|---|---|---|---|---|---|---|---|
| Zeta, mV | 39.3 | −12.3 | −15 | −17.2 | 25.5 | 14.9 | −38.7 | −39.2 | −35.7 | −46.4 |
| Sample | pH 7.4 | pH 5 | pH 2.6 | |||
|---|---|---|---|---|---|---|
| % | mg/mg Silica | % | mg/mg Silica | % | mg/mg Silica | |
| MSil1 | 66.49 | 48.1 | 67.97 | 79.5 | 28.71 | 20.4 |
| Sil2 | 24.94 | 21.4 | 56.89 | 16.8 | 49.32 | 37.7 |
| Sil3 | 29.60 | 25.9 | 76.37 | 30.2 | 61.05 | 46.7 |
| MSil2 | 34.03 | 40.5 | 79.80 a | 179.5 | 35 | 29.4 |
| MSil3 | 75.42 | 87.6 | 58.05 a | 100.9 | 48.26 | 39.9 |
| Sample | Higuchi | Korsmeyer–Peppas | ||||
|---|---|---|---|---|---|---|
| KH | R2 | n | R2 | |||
| MSil1 | 12.67 a (31.31; 8.97) b | 0.8562 (0.9988; 0.9887) | 0.581 | 0.8511 | ||
| Sil2 | 9.19 (17.09; 3.54) b | 0.8628 (0.9937; 0.988) | 0.378 | 0.9134 | ||
| Sil3 | 9.89 (17.98; 5.1) b | 0.9002 (0.9985; 0.9967) | 0.383 | 0.937 | ||
| MSil2 | 13.78 (20.46; 9.13) b | 0.9535 (0.9976; 0.9943) | 0.530 | 0.9539 | ||
| MSil3 | 39.53 (31.21; 13.36) b | 0.9463 (0.996; 0.9951) | 0.711 | 0.975 | ||
| Groups | Count | Sum | Average | Variance | ||
| MSil1 | 3 | 188.79 | 62.93 | 2.3223 | ||
| Sil2 | 3 | 72.16 | 24.05333 | 1.904933 | ||
| Sil3 | 3 | 81.33 | 27.11 | 0.9349 | ||
| MSil2 | 3 | 94.44 | 31.48 | 1.4224 | ||
| MSil3 | 3 | 211.08 | 70.36 | 0.5908 | ||
| Source of Variation | SS | df | MS | F | p-value | Fcrit |
| Between Groups | 5669.337 | 4 | 1417.334 | 987.6435 | 6.14 × 10⁻¹³ | 3.47805 |
| Within Groups | 14.35067 | 10 | 1.435067 | |||
| Total | 5683.688 | 14 | ||||
| Sample | Higuchi | Korsmeyer–Peppas | ||||
|---|---|---|---|---|---|---|
| KH | R2 | n | R2 | |||
| MSil1 | 47.93 (82.59; 12.7) a | 0.831 (0.981; 0.999) | 0.754 b (0.454) | 0.998 (0.884) | ||
| Sil2 | 38 c | 0.995 | 0.544 | 0.994 | ||
| Sil3 | 29.01; 3.87 d | 0.950; 0.983 | 0.22 | 0.779 | ||
| MSil2 | 20.17 (33.75; 17.9) d | 0.975 (0.996; 0.999) | 0.607 | 0.965 | ||
| MSil3 | 32.42 (45.3; 23.33) e | 0.969 (0.999; 0.995) | 0.518 | 0.969 | ||
| Groups | Count | Sum | Average | Variance | ||
| MSil1 | 3 | 293.18 | 97.72667 | 1.093733 | ||
| Sil2 | 3 | 210.69 | 70.23 | 3.5371 | ||
| Sil3 | 3 | 161.02 | 53.67333 | 2.107733 | ||
| MSil2 | 3 | 294.74 | 98.24667 | 0.196133 | ||
| MSil3 | 3 | 224.61 | 74.87 | 0.7357 | ||
| Source of Variation | SS | df | MS | F | p-value | Fcrit |
| BetweenGroups | 4369.558 | 4 | 1092.389 | 712.0811 | 3.14 × 10⁻¹² | 3.47805 |
| Within Groups | 15.3408 | 10 | 1.53408 | |||
| Total | 4384.898 | 14 | ||||
| Sample | Higuchi | Korsmeyer–Peppas | ||||
|---|---|---|---|---|---|---|
| KH | R2 | n | R2 | |||
| MSil1 | 9.00 (23.46; 4.19) a | 0.7755 (0.9726; 0.9685) | 0.250 | 0.8614 | ||
| Sil2 | 22.25 | 0.9407 | 0.508 | 0.9311 | ||
| Sil3 | 26.93 | 0.9738 | 0.569 | 0.9484 | ||
| MSil2 | 18 (27.2; 1.67) b | 0.899 (0.9867; 0.9598) | 0.498 | 0.9137 | ||
| MSil3 | 23.98 (29.34; 15.31) b | 0.9782 (0.9958; 0.9994) | 0.586 | 0.9767 | ||
| Groups | Count | Sum | Average | Variance | ||
| MSil1 | 3 | 86.14 | 28.71333 | 18.38893 | ||
| Sil2 | 3 | 148 | 49.33333 | 16.28923 | ||
| Sil3 | 3 | 183.19 | 61.06333 | 9.334433 | ||
| MSil2 | 3 | 104.98 | 34.99333 | 13.60693 | ||
| MSil3 | 3 | 144.79 | 48.26333 | 4.161633 | ||
| Source of Variation | SS | df | MS | F | p-value | Fcrit |
| Between Groups | 1954.379 | 4 | 488.5949 | 39.54238 | 4.24 × 10⁻⁶ | 3.47805 |
| Within Groups | 123.5623 | 10 | 12.35623 | |||
| Total | 2077.942 | 14 | ||||
Publisher’s Note: MDPI stays neutral with regard to jurisdictional claims in published maps and institutional affiliations. |
© 2022 by the authors. Licensee MDPI, Basel, Switzerland. This article is an open access article distributed under the terms and conditions of the Creative Commons Attribution (CC BY) license (https://creativecommons.org/licenses/by/4.0/).
Share and Cite
Racles, C.; Zaltariov, M.-F.; Peptanariu, D.; Vasiliu, T.; Cazacu, M. Functionalized Mesoporous Silica as Doxorubicin Carriers and Cytotoxicity Boosters. Nanomaterials 2022, 12, 1823. https://doi.org/10.3390/nano12111823
Racles C, Zaltariov M-F, Peptanariu D, Vasiliu T, Cazacu M. Functionalized Mesoporous Silica as Doxorubicin Carriers and Cytotoxicity Boosters. Nanomaterials. 2022; 12(11):1823. https://doi.org/10.3390/nano12111823
Chicago/Turabian StyleRacles, Carmen, Mirela-Fernanda Zaltariov, Dragos Peptanariu, Tudor Vasiliu, and Maria Cazacu. 2022. "Functionalized Mesoporous Silica as Doxorubicin Carriers and Cytotoxicity Boosters" Nanomaterials 12, no. 11: 1823. https://doi.org/10.3390/nano12111823
APA StyleRacles, C., Zaltariov, M.-F., Peptanariu, D., Vasiliu, T., & Cazacu, M. (2022). Functionalized Mesoporous Silica as Doxorubicin Carriers and Cytotoxicity Boosters. Nanomaterials, 12(11), 1823. https://doi.org/10.3390/nano12111823