Abstract
Organic light-emitting diodes (OLEDs) with tunable emission colors, especially white OLEDs, have rarely been observed with a single emitter in a single emissive layer. In this paper, we report a new compound featuring a D–A–D structure, 9,9′-(pyrimidine-2,5-diylbis(2,1-phenylene))bis(3,6-di-tert-butyl-9H-carbazole) (PDPC). A nondoped OLED using this compound as a single emitter exhibits unique voltage-dependent dual emission. The emission colors range from blue to orange–red with an increase in voltage, during which white electroluminescence with a Commission Internationale De L’Eclairage (CIE) coordinate of (0.35, 0.29) and a color render index (CRI) value of 93 was observed. A comparative study revealed that the dual emission simultaneously originates from the monomers and excimers of the emitter. This study provides insight into understanding the multimer-excited mechanism and developing novel color-tunable OLEDs.
1. Introduction
Organic light-emitting diodes (OLEDs) have many applications in displays and lighting due to their high efficiency, flexibility, and ultrathin thickness [1,2,3]. In particular, the application of color-tunable OLEDs is of wide-ranging demand in the fields of decoration, smart lighting, cultivating vegetables, wearable sensing equipment, etc. [4,5,6,7,8]. In general, three types of strategies have been proposed for color-tunable devices [9]: The first strategy involves the combination of two or three materials with different emissions, including deploying tandem structures that contain sub-OLED arrays and share one electrode [4,10,11,12]. The complicated structure and fabrication cost of this device, however, discourage this option. One alternative is to deposit multiple emitters in a single cell, by either layer-by-layer doping or co-doping [6,13,14,15]. Despite their facilitated fabrication, the device obtained from the latter method suffers from the asynchronous color aging of the emitters. The device with a single emitter can be a solution to this deficit.
Concerning single emitters, dual-emission capability is their fundamental requirement, meaning the compound can emit both emissions in different excited states. In addition, for better discernibility of color change, the variation trend of the emission intensities of the two peaks should be in distinctive pace with the alteration in the voltage. in addition to the emission of monomers, the emission of multimers is one of the methods for generating a lower-energy emission. Mazzeo et al. reported an A–D–A structure with double dimesitylboyl groups connected by a centering terthiophene [16]. This compound exhibited an emission in the blue region with an additional red-shifted peak, while the author attributed the latter peak to the formation of dimers. However, the maximum external quantum yield (EQE) was 0.35%, and the turn-on voltage was around 9 V.
In this paper, we present a new compound, 9,9′-(pyrimidine-2,5-diylbis(2,1-phenylene))bis(3,6-di-tert-butyl-9H-carbazole) (PDPC), featuring a donor-acceptor-donor (D–A–D) structure. Employing this compound as a single emitter, a single OLED cell with a single undoped emissive layer exhibited voltage-dependent dual emission. As the voltage increased, the emission color ranged from blue to orange–red. A comparison between the nondoped and doped OLEDs revealed that the red peak resulted from the multimerization of the emitter molecules. The maximum EQE was 0.81%, and the turn-on voltage was 5.19 V. The wide color range observed revealed that the electroluminescent (EL) emission varied from blue (CIE1931 = (0.17, 0.20)) to orangish red (CIE1931 = (0.50, 0.39)). In addition, white electroluminescence with a CIE coordinate of (0.35, 0.29) and a CRI value of 93 was observed.
2. Materials and Methods
2.1. General Information
All reaction experiments were performed under a N2 atmosphere using standard Schlenk techniques, unless specified. The organic materials investigated in this study were synthesized by the procedures described below, in which the starting materials (all solvents and reagents) were purchased from commercial sources and were used as received without further purification. (For detail: Argon: Linde plc, Dublin, Ireland; 2,5-dibromopyrimidine, palladium(II) diacetate, 2-fluorophenylboronic acid, 3,6-di-tertbutyl-9H-carbazole: Bide Pharmatech Ltd, Shanghai, China; K3PO4·3H2O, silica gel, Cs2CO3, tetrahydrofuran: China National Pharmaceutical Group Co., Ltd. (Sinopharm), Beijing, China; glycol, NaCl, petroleum ether, ethyl acetate, dichloromethane, dimethylformamide (DMF), deuterated dimethyl sulfoxide (DMSO-d6): Shanghai Titan Scientific Co., Ltd., Shanghai, China.)
2.2. Preparation of 2,5-Bis(2-fluorophenyl)pyrimidine
Under an argon atmosphere, 2.38 g (10 mmol) of 2,5-dibromopyrimidine, 0.112 g (5 wt%) of palladium(II) diacetate (preheated in an oven at 80 °C for 3 h), and 7.99 g (3 equiv., 30 mmol) of K3PO4·3H2O (dried in an oven overnight at 150 °C) were mixed with 15 mL of glycol in a 100 mL Schlenk flask, and the solution was stirred for 10 min. Then, 4.20 g (3 equiv., 30 mmol) of 2-fluorophenylboronic acid was added into the solution. Following this, 3 purges and-refills of argon were performed. The solution turned into a yellowish-orange color. The mixture was heated at 80 °C for 24 h. After the reaction cooled to room temperature, the mixture was poured into a beaker with 150 mL of water, and the precipitate was obtained by vacuum filtration. The final product was purified by column chromatography filled with silica gel. The eluent was adopted by gradually increasing the content of ethyl acetate in petroleum ether, until ca. 10%. The half-substituted byproduct was separated, and a reaction similar to that one mentioned above was stoichiometrically adopted to obtain the fully substituted product. Scheme S1 diagramed the procedure. Total yield: 1.04 g, 38.8%. 1H NMR (400 MHz, DMSO-d6) δ 9.18 (d, J = 1.5 Hz, 2H), 8.10 (td, J = 7.8, 1.9 Hz, 1H), 7.78 (td, J = 7.8, 1.8 Hz, 1H), 7.63–7.53 (m, 2H), 7.47–7.36 (m, 4H). 13C NMR (101 MHz, DMSO-d6) δ 161.86, 161.32 (d, J = 4.7 Hz), 160.64, 159.33, 158.18, and 156.84 (d, J = 3.8 Hz), 132.51 (d, J = 8.6 Hz), 131.77, 131.36 (d, J = 8.3 Hz), 130.82 (d, J = 2.8 Hz), 126.91, 125.71 (d, J = 9.3 Hz), 125.46 (d, J = 3.6 Hz), 124.63 (d, J = 3.7 Hz), 121.72 (d, J = 13.4 Hz), 116.67 (dd, J = 57.2, 22.0 Hz). The original graph for 1H and 13C spectra can be found in Figure S1 and S2.Element analysis: calcd. for C16H10F2N2: C 71.64, H 3.76, and N 10.44; found: C 71.60, H 3.81, and N 10.43.
2.3. Preparation of 9,9′-(Pyrimidine-2,5-diylbis(2,1-phenylene))bis(3,6-di-tert-butyl-9H-carbazole) (PDPC)
Before 0.537 g (2 mmol) of 2,5-bis(2-fluorophenyl)pyrimidine was added, 1.34 g (4.8 mmol, 2.4 equiv.) of3,6-di-tertbutyl-9H-carbazole, 1.96 g (6 mmol, 3 equiv.) of Cs2CO3, and 10 mL of DMF were stirred for 30 min in a 100 mL Schlenk flask under an Ar atmosphere. The solution was refluxed for 16 h after all the reactants mingled. The color of the solution turned from brown to yellow after heating. The cooled mixture was poured into a beaker with 150 mL of water, and the precipitate was obtained by vacuum filtration. The final product was collected through the recrystallization of the mixed solution of dichloromethane and ethyl acetate. Scheme S2 diagramed the procedure. Total yield: 1.25 g, 79.4%. 1H NMR (500 MHz, chloroform-d) δ 8.03 (dd, J = 12.8, 1.9 Hz, 4H), 7.97 (s, 2H), 7.72 (dd, J = 7.8, 1.6 Hz, 1H), 7.58–7.50 (m, 3H), 7.50–7.40 (m, 3H), 7.24 (ddd, J = 8.3, 6.1, 1.9 Hz, 4H), 7.12 (dd, J = 7.8, 1.7 Hz, 1H), 6.92 (d, J = 8.6 Hz, 2H), 6.80 (d, J = 8.5 Hz, 2H), 1.41 (s, 18H), 1.39 (s, 18H). 13C NMR (101 MHz, chloroform-d) δ 163.57, 155.21, 142.96, 142.30, and 139.46 (d, J = 33.0 Hz), 136.43, 135.92 (d, J = 22.9 Hz), 133.70, 131.79, and 131.15 (d, J = 16.7 Hz), 130.50, 130.06, 129.72, 129.16, 128.85, 127.87, 123.81, and 123.51 (d, J = 9.0 Hz), 123.19, 116.56, 115.89, and 109.02 (d, J = 14.0 Hz), 34.78, 32.10 (d, J = 6.6 Hz). The original graph for 1H and 13C spectra can be found in Figure S3 and S4. Element analysis: calcd. for C56H58N4: C 85.45, H 7.43, and N 7.12; found: C 85.39; H 7.43, and N 7.09.
2.4. Characterization
1H NMR and the spectra were recorded with a Bruker Avance III 400 MHz NMR spectrometer (Bruker Co., Billerica, MA, USA) with DMSO-d6 as a solvent. The chemical shifts are given in parts per million with reference to tetramethylsilane (TMS, δ = 0 ppm). The peak multiplicities are reported with the notation s (singlet), d (double), t (triplet), q (quartet), and m (multiplet). The elemental analyses (C, H, and N) were implemented with an Elementary Vario EL III elemental analyzer (Elementar Analysensysteme GmbH, Langenselbold, Germany). The thermogravimetric analysis (TGA) of the samples was performed with a METTLER TOLEDO TGA/DSC 1 STARe System (Mettler Toledo International Inc., Columbus, Oh, USA) with a heating rate of 10 °C/min under nitrogen. The UV–visible absorption spectra were determined with a PerkinElmer Lambda 365 spectrophotometer (PerkinElmer, Waltham, MA, USA) under ambient conditions. The steady-state photoluminescence and phosphorescence spectra at 300 K were measured using a Hitachi F-7000 (Hitachi Limited, Tokyo, Japan). The photoluminescence spectra at 77 K and time-resolved photoluminescent-decay experiments (lifetime) were performed with an Edinburgh Analytical instrument FLS980 (Edinburgh Analytical Instrument Limited, Livingston, UK), equipped with a xenon arc (450 W) and pulsed flash lamps. The delayed emission spectra in solution were recorded with an Ocean Optics MX2500+ (Ocean Insights, Inc., Orlando, FL, USA), equipped with a xenon arc lamp (450 W). The cyclic voltammetry (CV) analysis was performed on a CHI840D Electrochemical Analyzer (CH Instruments, Inc., Bee Cave, TX, USA), in which dichloromethane and 0.1 mol/L of tetrabutylammonium hexafluorophosphate were adopted as the solvent and electrolyte, respectively. The work, counter, and reference electrodes were glassy carbon, platinum wire, and Ag/AgNO3, respectively. The solution was pretreated with five-minute degassing by N2 before the CV test. The highest occupied molecular orbital (HOMO) was estimated as follows: HOMO = −[Eox − EFc/Fc+ + 4.8] eV.
2.5. Device Fabrication and Characterization
Glass substrates precoated with 120 nm of indium tin oxide (ITO) with a sheet resistance of 15 Ω per square were successively cleaned in an ultrasonic bath of deionized water, acetone, and isopropanol for 15 min. Then, the ITO glass substrates were dried with Ar2 steam and treated with UV-ozone for 15 min. The organic materials for the other functional layers were spin-coated onto the ITO-coated substrates at a rate of 1 Å s−1 under a high vacuum level (<2 × 10⁻⁵ Pa) using thermal evaporation in a vacuum chamber. Then, the Liq and Al were successively deposited at a rate of 0.1 and 5 Å s−1, respectively. The EL spectra, current efficiency (CE), power efficiency (PE), EQE, current–voltage–luminescence(C–V–L), and CIE of the OLEDs were recorded with an integrated optoelectronic performance test system with a calibrated spectra radiometer (TOPCON SR-UL1R) (Topcon Engineering Co., Ahmedabad, India) and Keithley 2400 source meter (Tektronix Co., Beaverton, OR, USA). All the measurements were conducted in a nitrogen-filled glove box at room temperature.
2.6. Calculation
The ground and excited states, adopting density functional theory (DFT) and time-dependent DFT (TD-DFT), were performed with Gaussian 09 software (ver. D.01, CT, USA) [17]; the cube files for the independent gradient model based on the Hirschfeld partition (IGMH), HOMO and the lowest unoccupied molecular ortibal (LUMO), and electron/hole distributions were generated from Multiwfn [18], and graphically visualized via Visual Molecular Dynamics (VMD, ver 1.9.4a, Champaign, IL, USA) [19]. The PBE/6–311(g) level for considering dispersion corrections was adopted for both ground and excited states. The molecular configuration for the ground-state calculation was taken from a crystalline structure, and vertical excited states were adopted for the calculations thereafter.
3. Results and Discussions
3.1. Single Crystal X-ray Diffraction (SC-XRD)
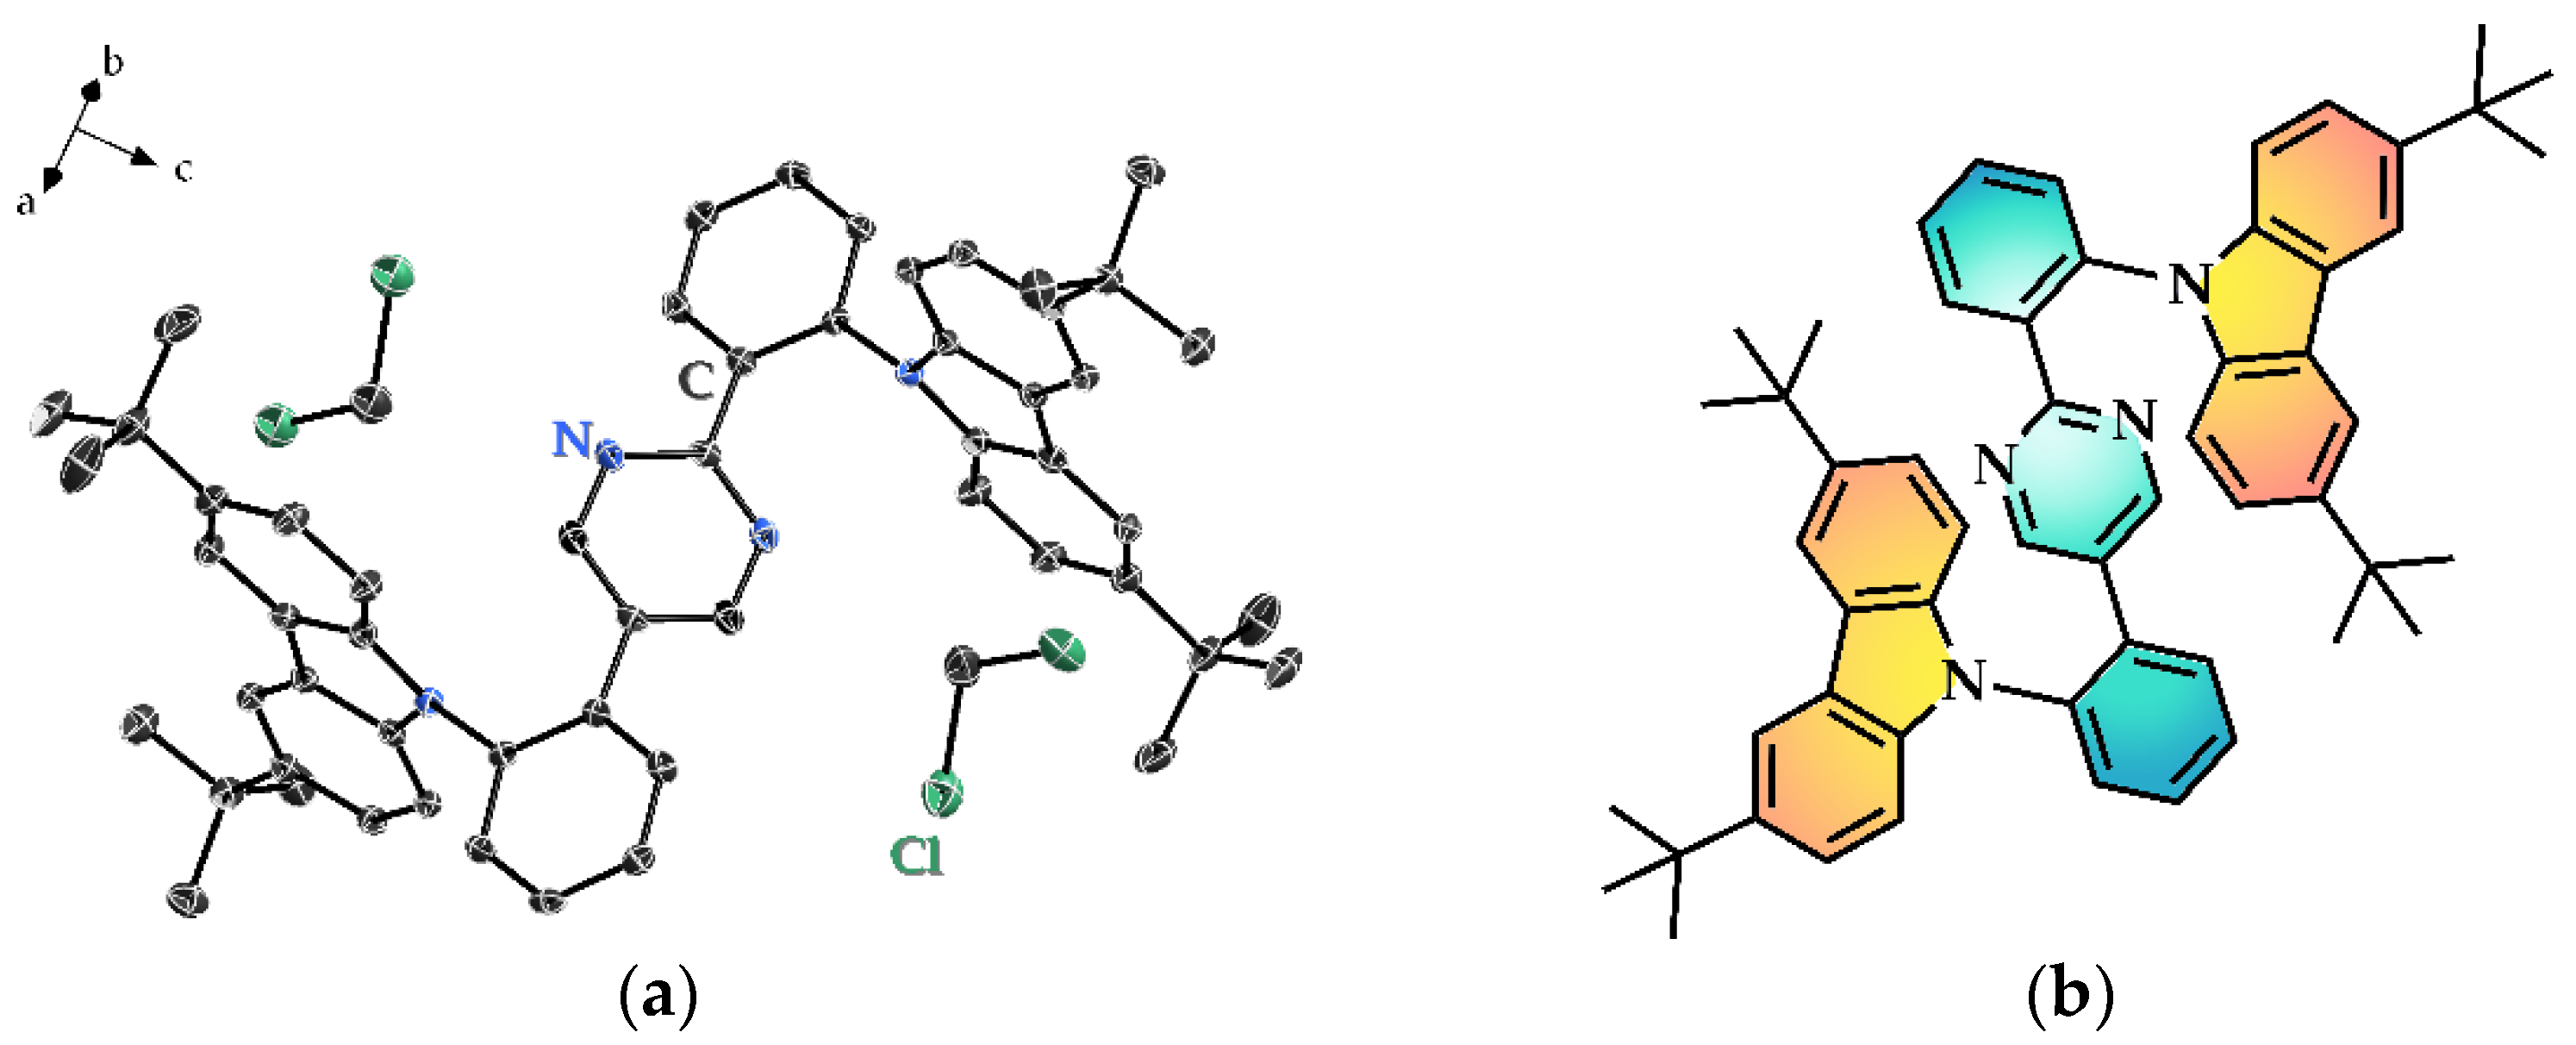
The compound PDPC crystallized in a P21/c space group, as depicted in Figure 1. The general information and bond parameters for the refinement results of the crystal diffraction were tabled in Table S1 to S3. The asymmetric unit consisted of a whole target molecule with two dichloromethane solvent molecules. While refining the structure, the residual densities on the central pyrimidine ring remained unbalanced wherever the nitrogen atoms were denoted on either side (see Figure S5a,b in Supporting Information). Given the approximate atomic numbers of C and N, which may result in a similar diffraction intensity together with the symmetric skeleton of PDPC, we postulate that both orientations—either in the form displayed in Figure S5a or Figure S5b—evenly distributed in the crystal structure (Figure S5c). The fluctuation of density residues vanished on the pyrimidine ring after the operation, supporting the hypothesis that the two positions may coexist in the crystal.
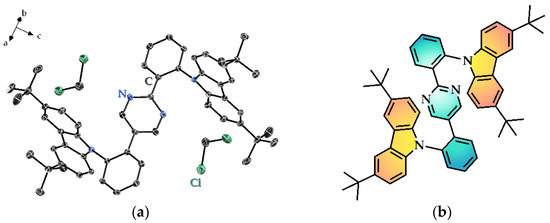
Figure 1.
(a) The asymmetric unit of the crystalline structure of PDPC. Hydrogen atoms are omitted for clarity; (b) the chemical structure of PDPC, in which the acceptor part is tinted green, while the donor counterpart orange.
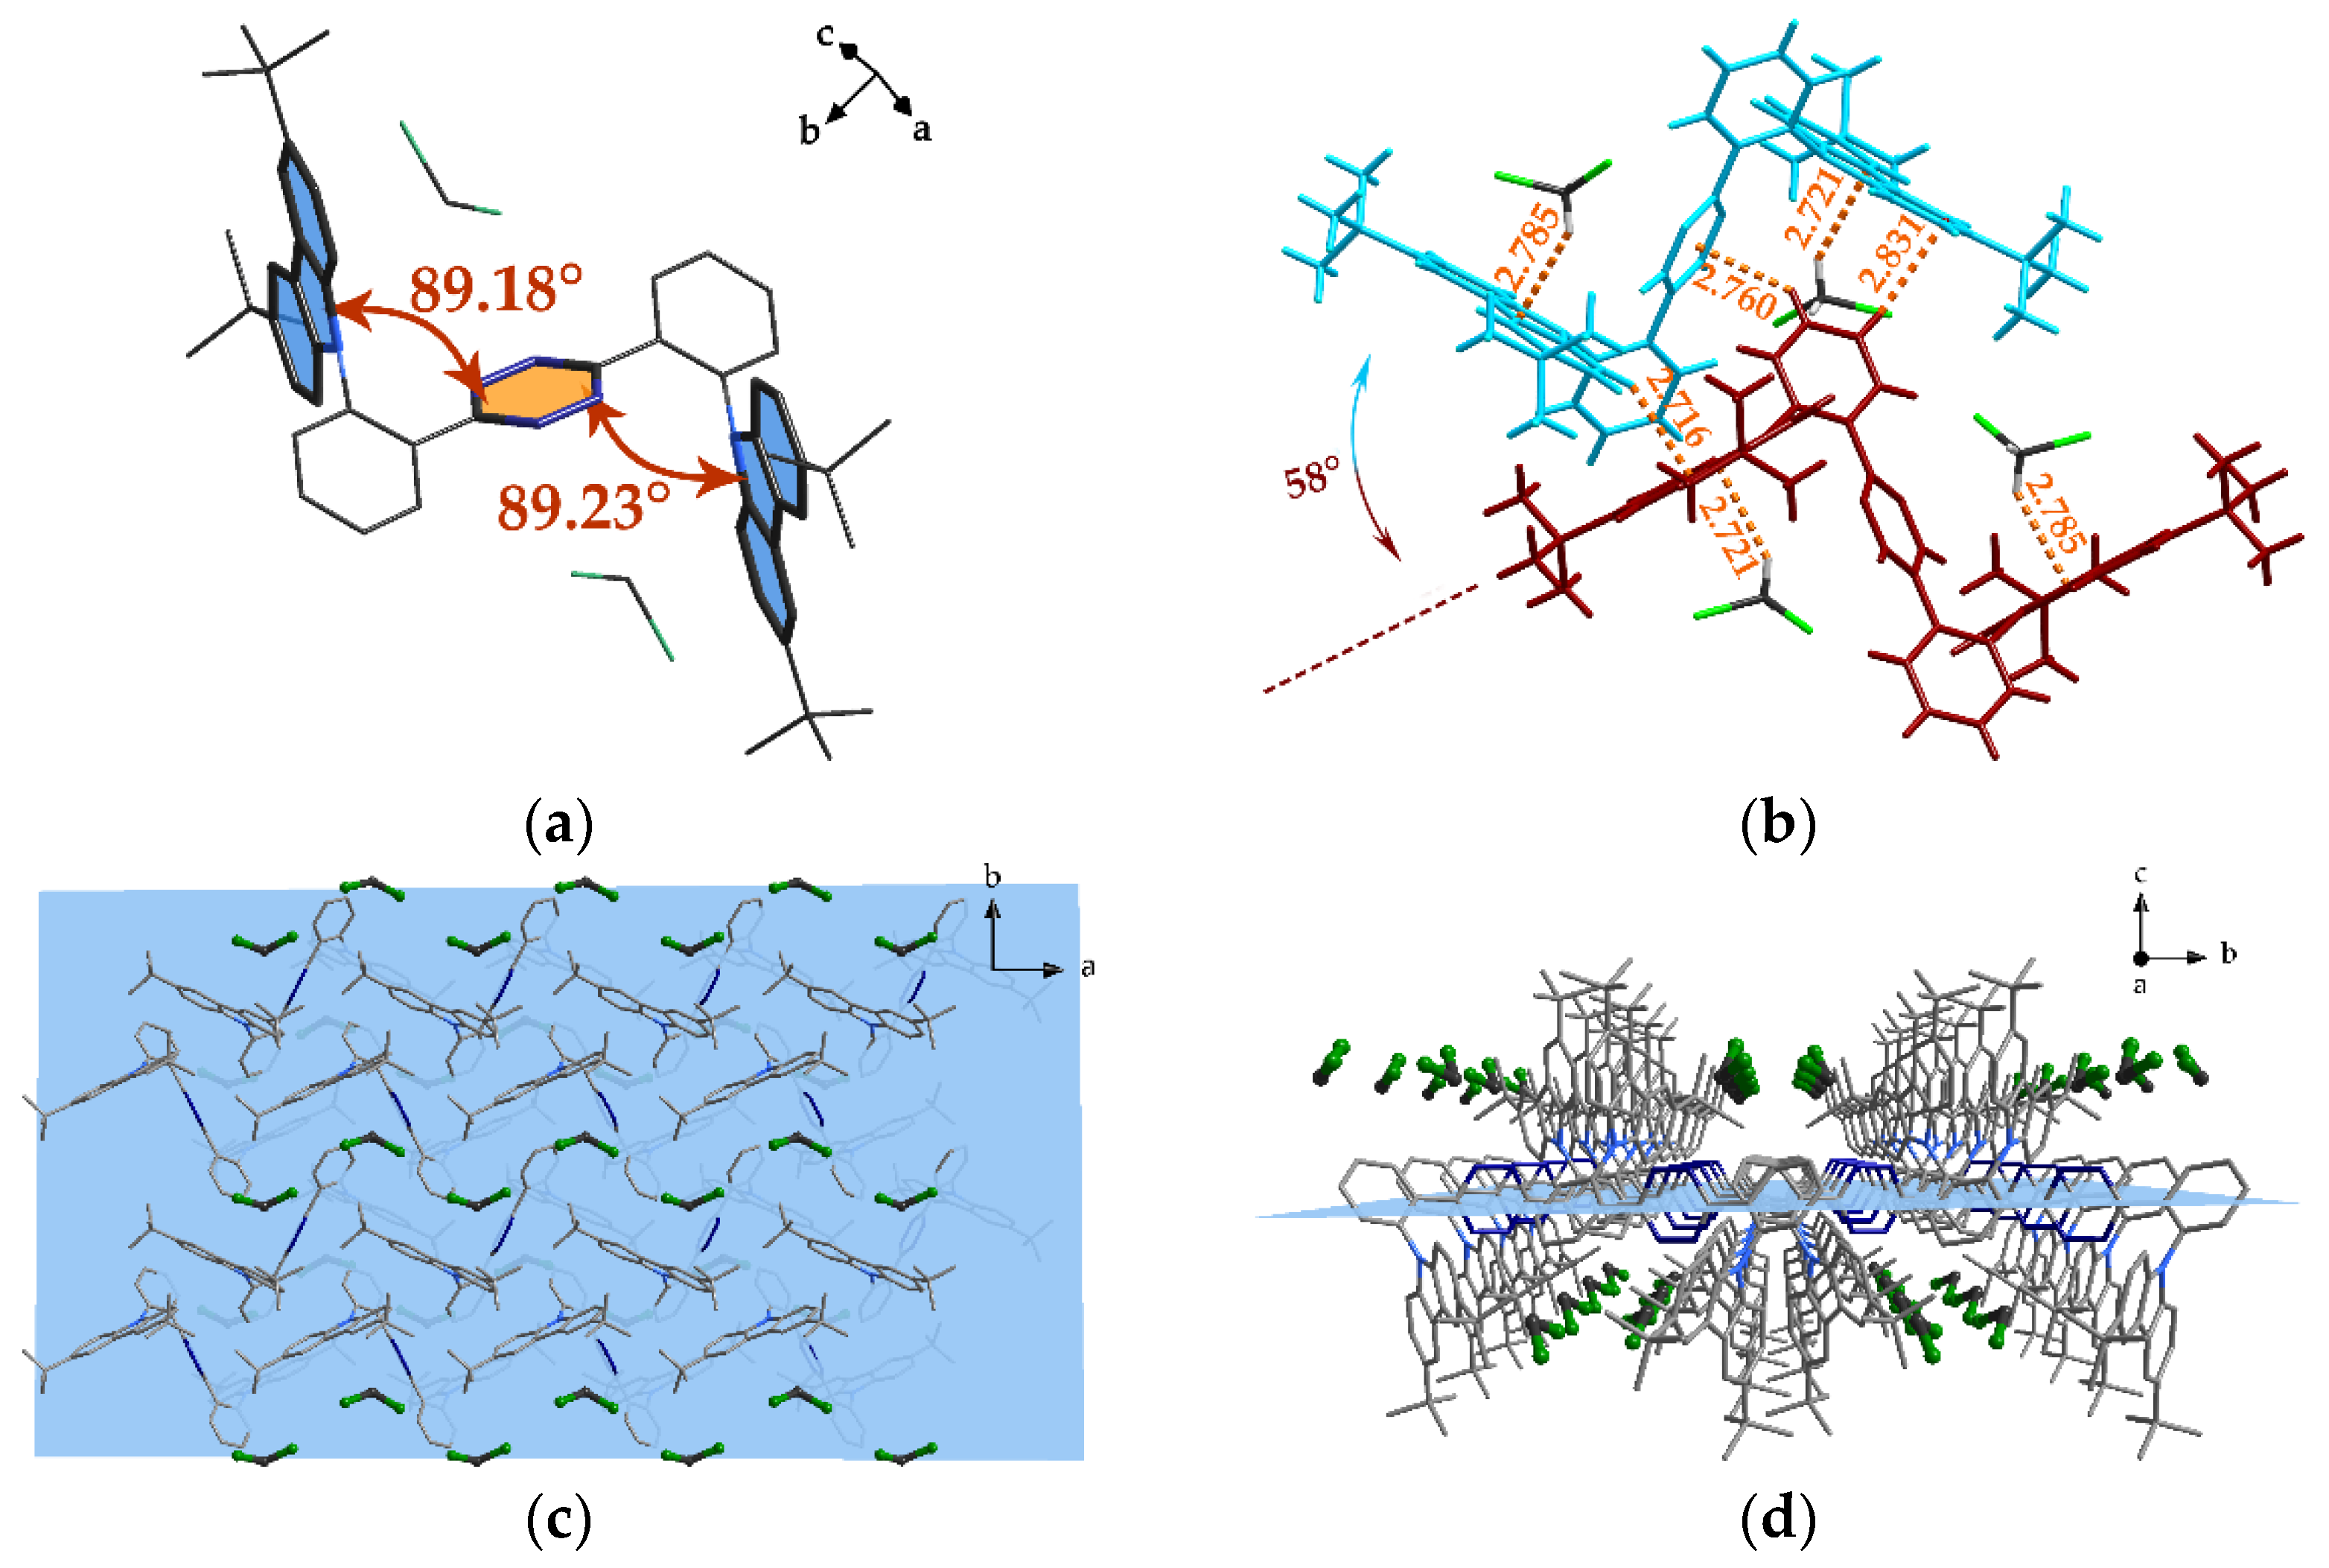
Owing to the steric hinderance of the ortho-position between the carbazole derivative group and central heterocyclic ring, the configuration of the molecule in the crystal folded to form an N-shape, in which the dihedral angle bended over 89° (Figure 2a). Another mirror-inverted molecule was stacked on the former one with a rotation angle of ca. 58° between the two carbazole planes of different molecules, capping on one of the joint phenyl rings of the first molecule, which connected the bis(tert-butyl)carbazole group with the central pyrimidine ring. Abundant intermolecular interactions, such as a substantial C-H…π secondary bond, were also found in this stacking configuration, the distance of which was measured to be between 2.72–2.83 Å (Figure 2b). A macroscopic view of the crystal revealed zig-zag tunnels walled by carbazole units. These tunnels were filled with solvent CH2Cl2 molecules, as illustrated in Figure 2c,d. To obtain a clear vision, a translucent blue plane was inserted where the central pyrimidine rings lie. Furthermore, the steric tert-butyl groups on carbazole rendered extra stability to the tunneling structure.
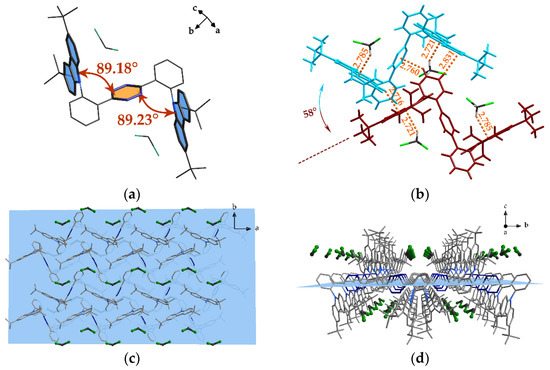
Figure 2.
(a) The dihedral angle between the central pyrimidine plane and carbazole plane in PDPC; (b) intermolecular interactions between adjacent molecules and their surrounding solvent molecules, in which the PDPC molecules are colored as red and cyan; (c,d) the PDPC molecules packed in space, viewed in the c and a directions. The blue plane indicates the horizon where the central pyrimidine rings stand. The hydrogen atoms in subfigures (a,c,d) were omitted for clarity.
3.2. UV Diffuse Reflection Analysis
The UV–Vis diffuse reflection spectrum was obtained using the crystalline powder of PDPC. As shown in Figure S6a, the absorbance of the sample revealed the bandgap of the sample to be 2.64 eV, which agrees with the photoluminescence spectra illustrated in the following section. The high energy level of the bandgap can be attributed to the twisted structure of the molecule that prevented planar components in the molecule from further conjugation.
3.3. Thermogravimetric Analysis (TGA)
The TGA curve is exhibited in Figure S6b. The slight decrease in weight before 200 °C could be attributed to the evaporation of the residue solvent molecules, while the sharp drop between 400 and 500 °C indicated the decomposition of the compound where the decomposition temperature was estimated to be around 450 °C.
3.4. Photoluminescent Properties
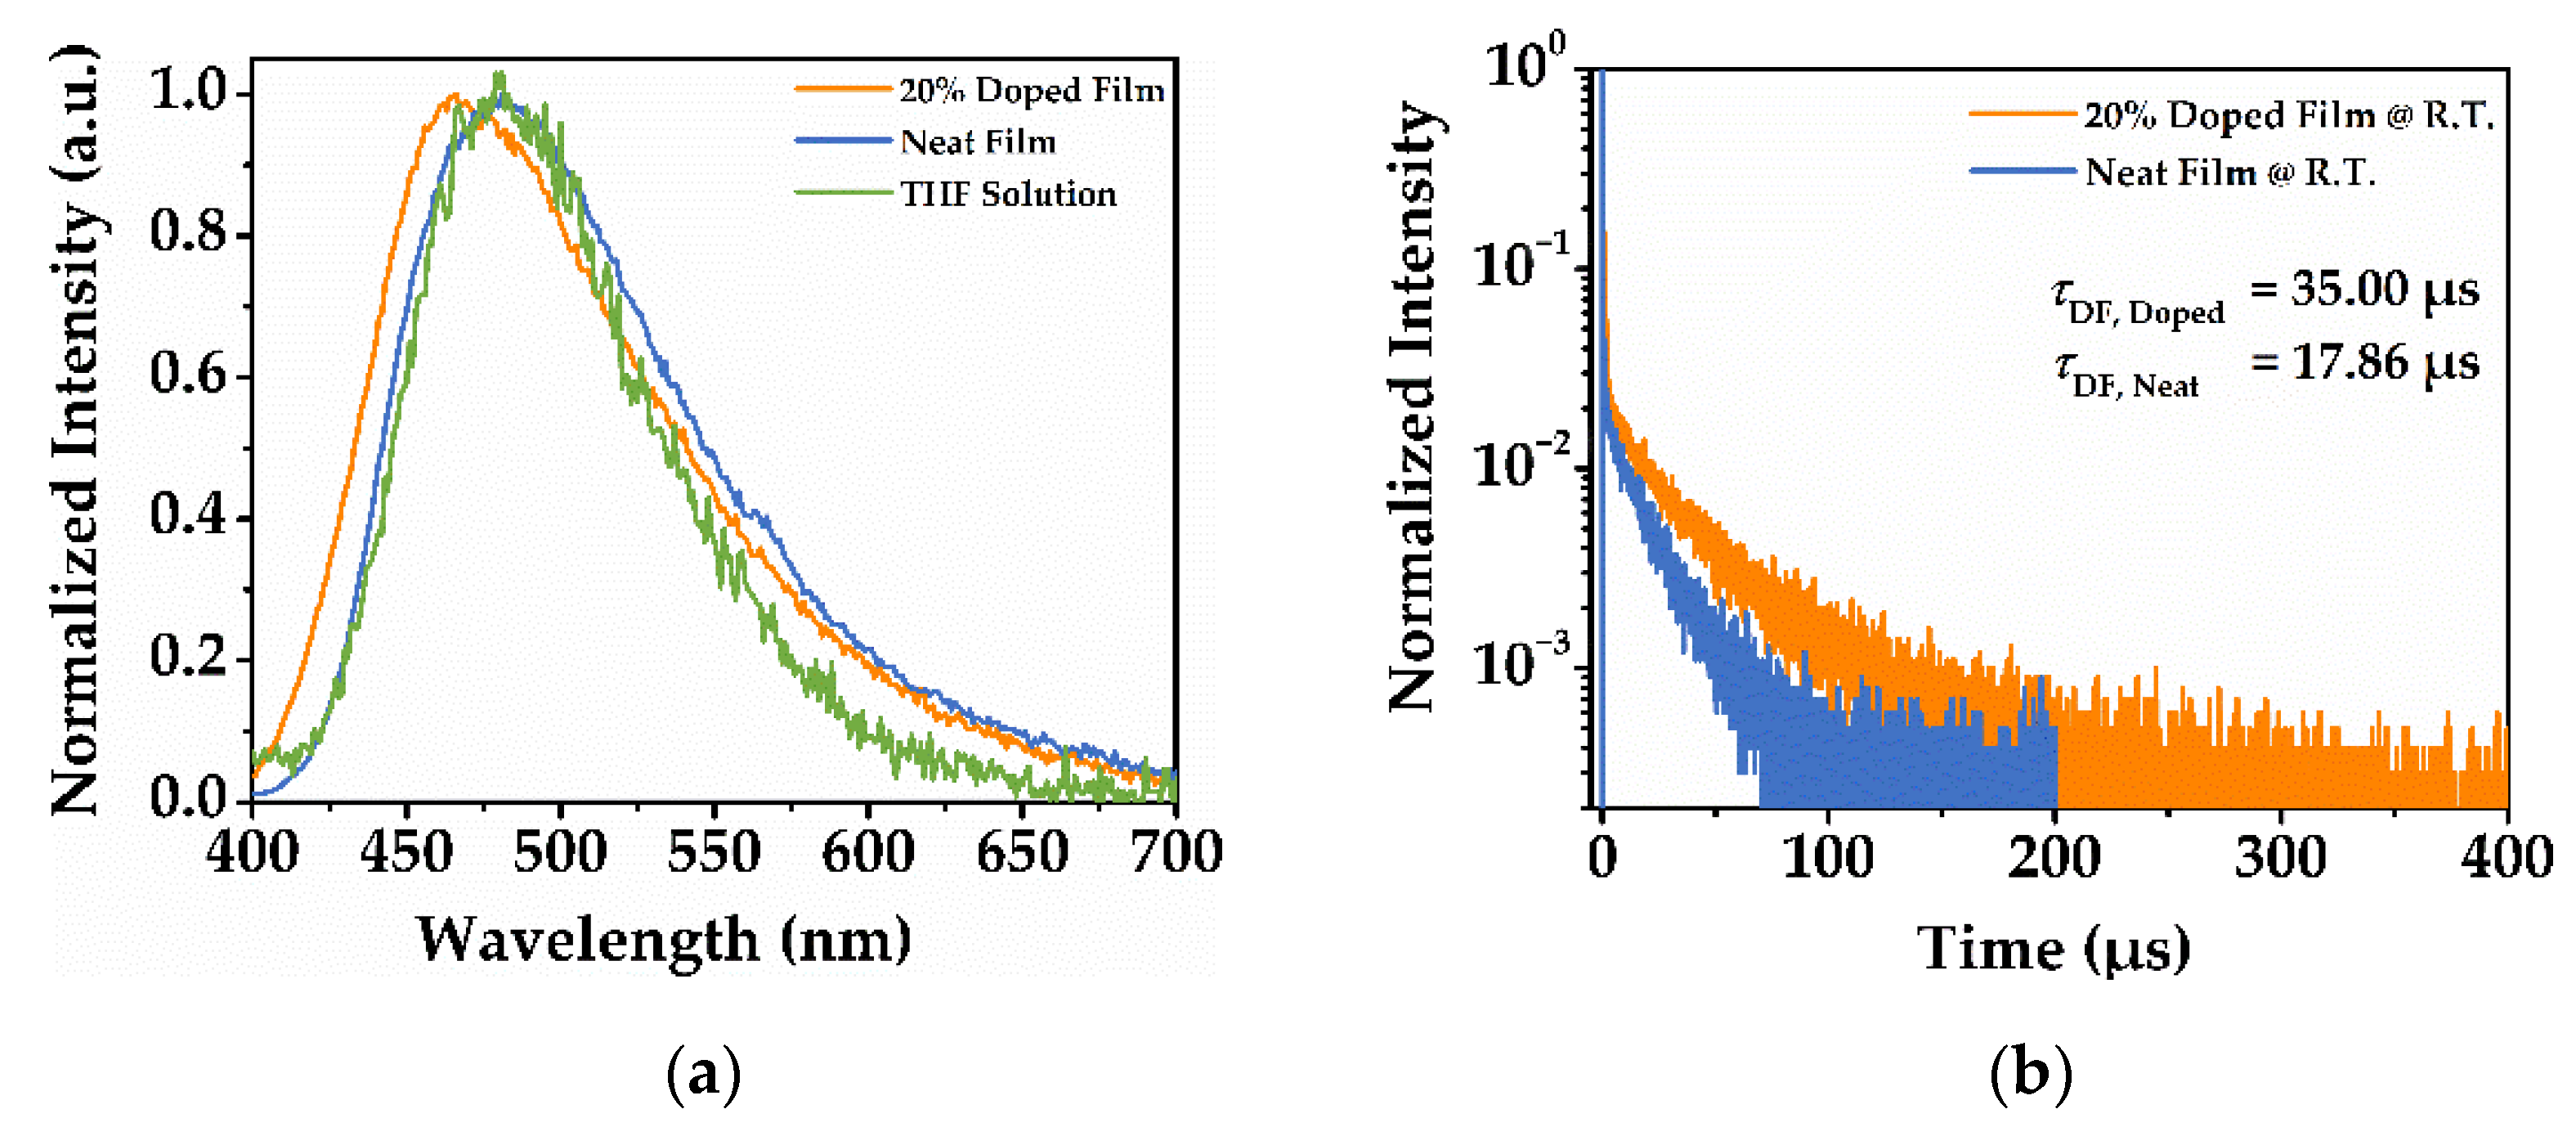
To investigate the excited-state properties of the material, the photoluminescent and electroluminescent properties of PDPC were measured. Figure 3 shows the photophysical properties of PDPC in the neat film and the 20% doping in BCPO (the structure is shown in Figure S11). The spectra of PDPC in a tetrahydrofuran solution were tested as a comparison. The photoluminescent spectra exhibited a nearly identical peak between the neat film and solution samples. However, a blue shift of around 15 nm of the emission peak was observed in the doped film sample. This was likely due to the dispersion of the PDPC molecules, which decreased the stacking and interactions between the PDPC molecules. The transient decay spectra of the films revealed the long lifetime of the photoluminescence, leading to 35.00 μs in doped film and 17.86 μs in neat film. Moreover, the lifetime of the neat film nearly halved compared with that of the doped film, indicating the concentration-induced quenching of the nondoped film. The time-resolved spectra of neat film was proven to have a thermally activated delayed fluorescent (TADF) characteristic, in which the spectra monitored during the first 10 ns remained unchanged after 100 μs. The spectra are depicted in Figure S7.
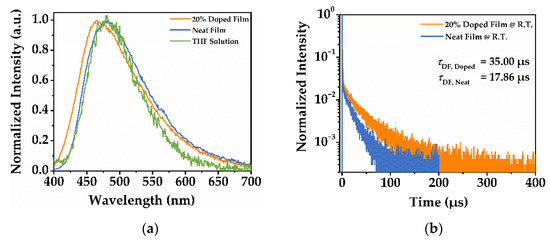
Figure 3.
(a) The photoluminescence spectra; (b) the transient decay curve of PDPC film.
The photophysical parameters were quantified, and the results are collected in Table 1 to provide further insights. The parameters were calculated based on the previous report [20]. According to the results, the PLQY of the doped film surpassed that of the neat film by a small margin. The mediocre quantum yield could be explained by the competitive nonradiative transition that suppressed the transition rate of the excitons. The inspection of the decay rate for the films unveiled the faster prompt fluorescence of the doped film, which may have resulted in a higher-efficiency S1 → S0 emission. In addition, the long-lived delayed fluorescence and small kRISC for both films lea to the conclusion that the TADF properties may not be distinct.

Table 1.
Photophysical parameters of PDPC in 20% doped and neat films.
We also tested the luminescence and life of crystalline powder PDPC, as shown in Figure S9. The product exhibited blue emission with a maximum of around 460–480 nm under an excitation of 380 nm. The peak was fitted and four Gaussian bands were found, the peaks of which were located at 461, 483, 505, and 524 nm. The correspondent transient decay curves (Figure S9b) of these subpeaks were almost identical, suggesting these emissions may have stemmed from different vibrational levels of the same excited state. The fitting results for each decay curve are presented in Table S4.
3.5. Theoretical Calculation
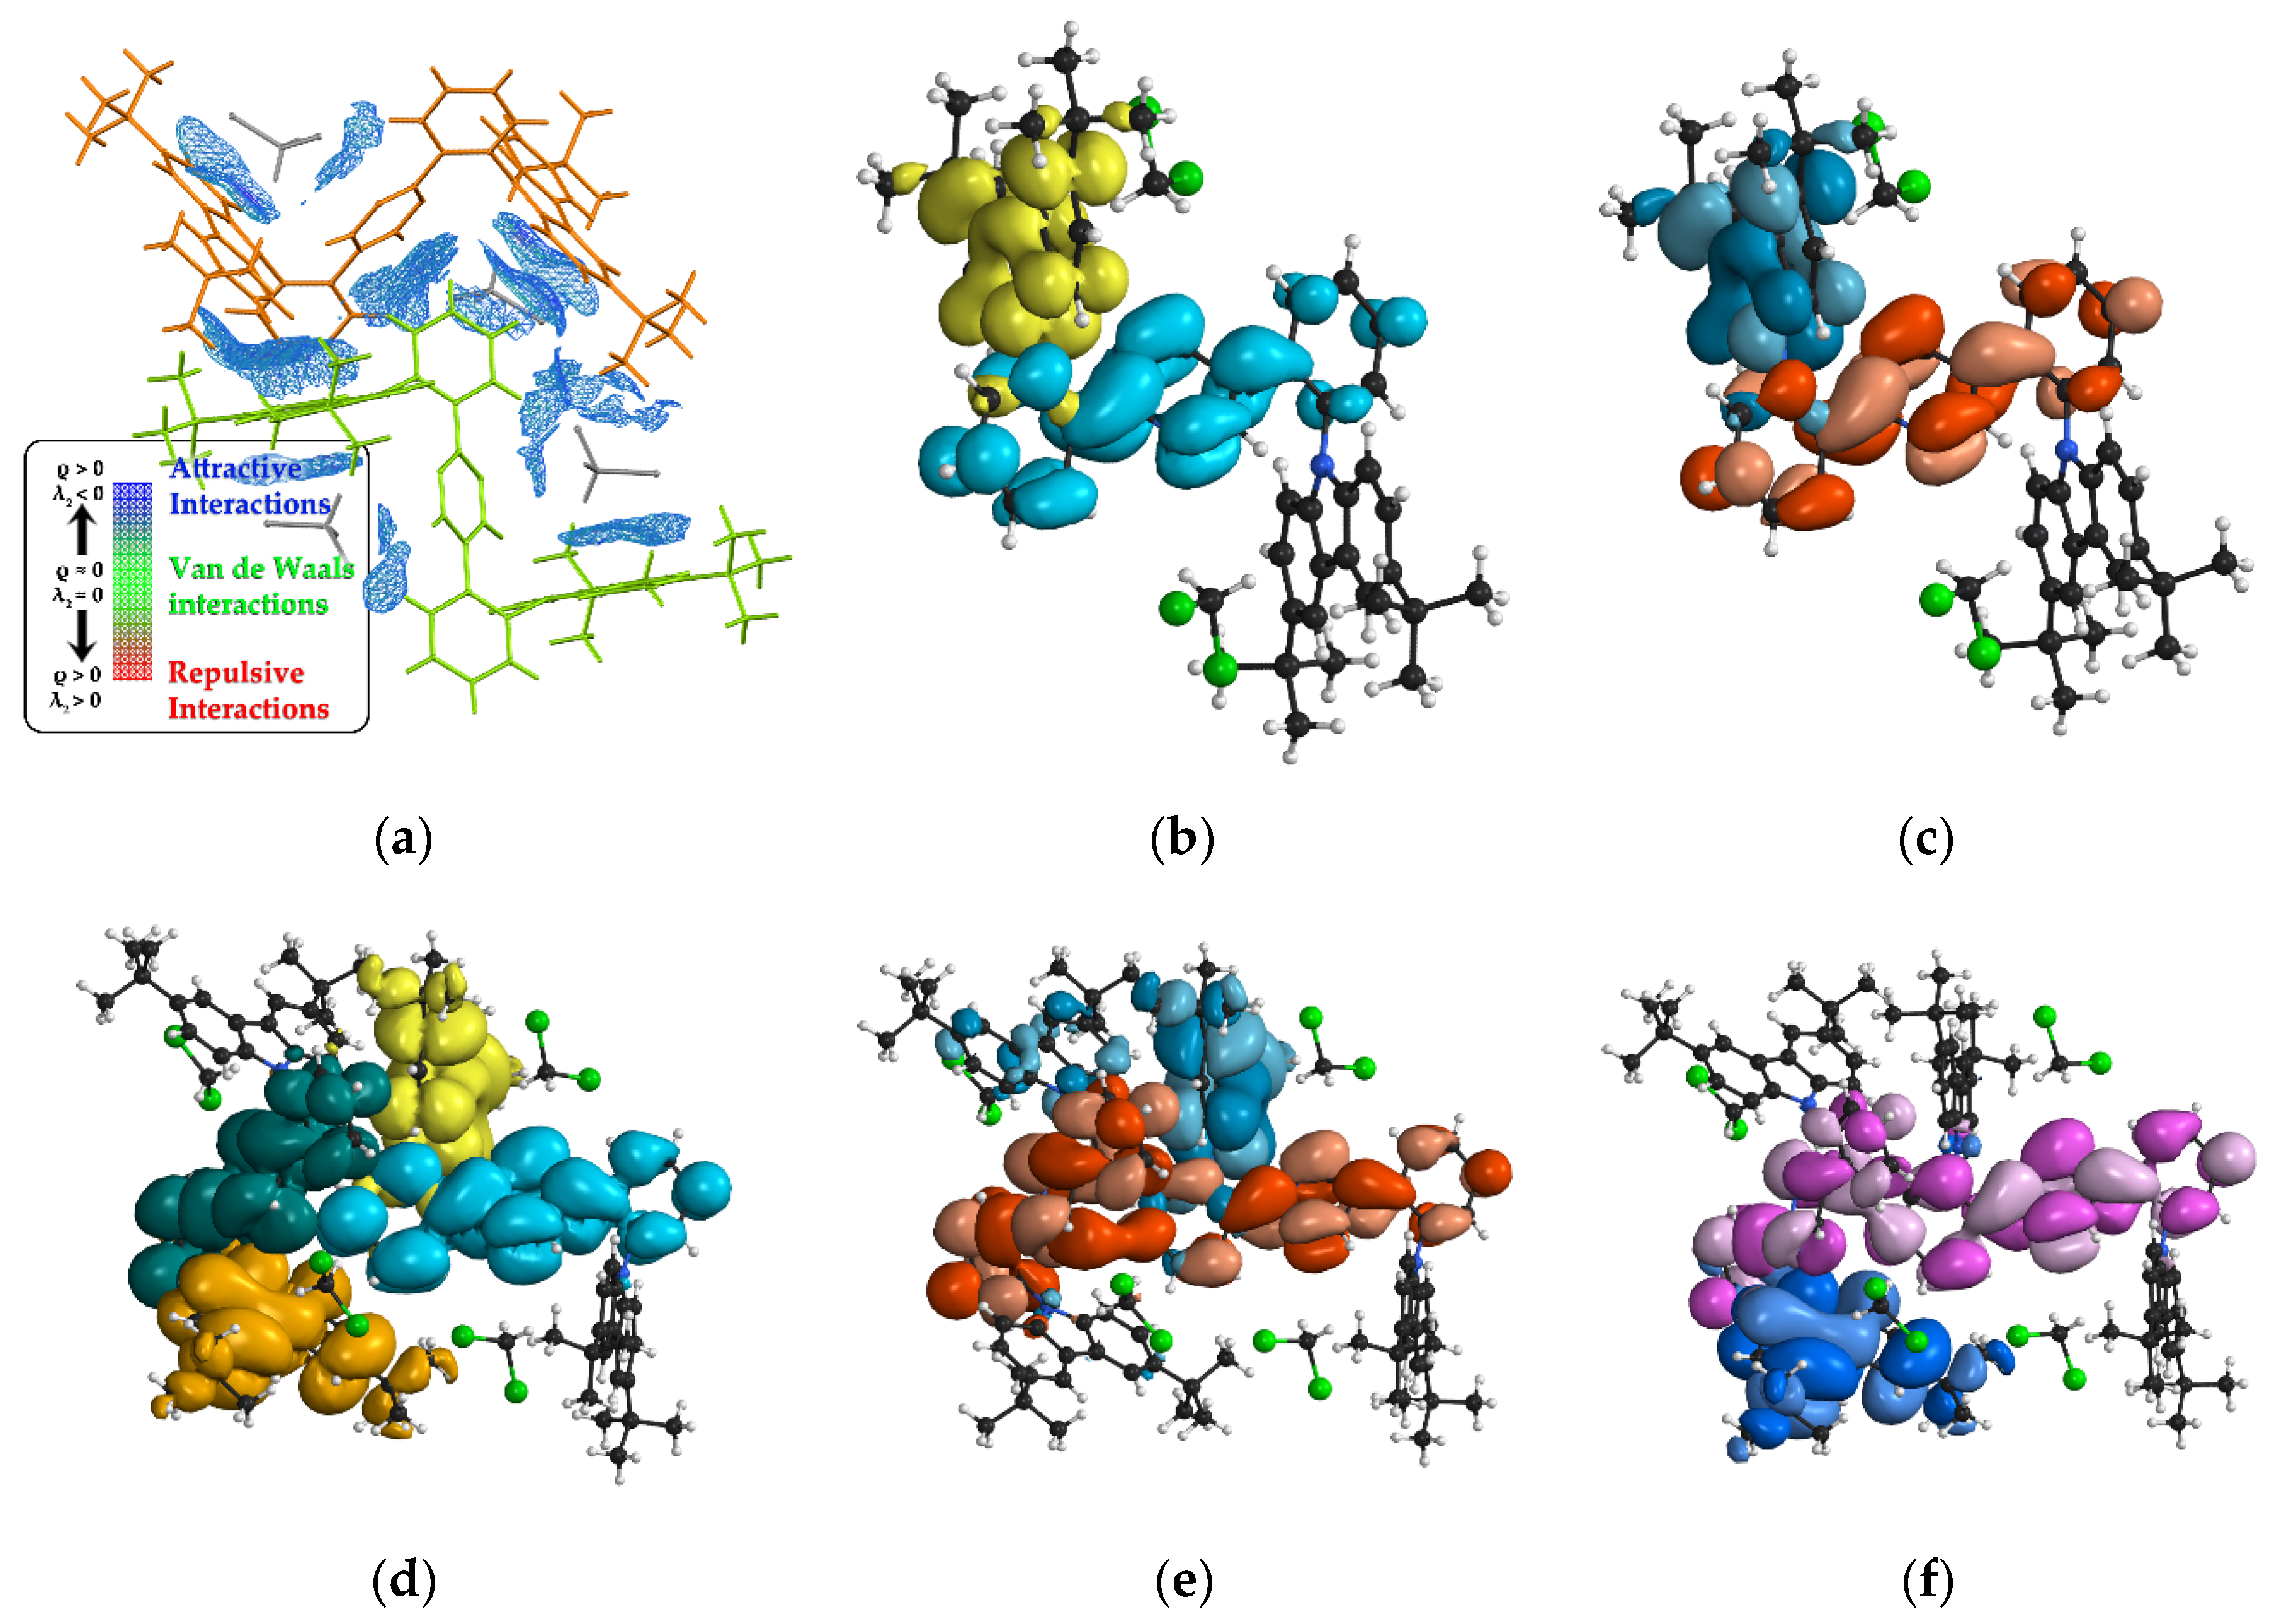
To theoretically investigate the interactions between the adjacent molecules, the independent gradient model based on the Hirschfeld partition (IGMH) method was adopted, and the results are visualized in Figure 4a [21]. The region filled with meshes indicated that there were interactions between molecules on both sides. The individual molecules are identically colored for clarity. According to the results, most of the interactions occurring between the molecules were attractive interactions, which are facilitative in forming multimers.

Figure 4.
(a) The IGMH interactions between two neighboring PDPC molecules. The distribution of (b) holes (yellow) and electrons (cyan), and (c) HOMO (turquoise)/LUMO (red) orbitals in monomer PDPC; (d) the distribution of holes and electrons in dimer PDPC, under excited state S1 (hole: yellow; electron: cyan), and its degenerated state S2 (hole: orange; electron: green). The frontier orbitals of the dimer: (e) HOMO (turquoise)/LUMO (red) and (f) HOMO-1 (purple)/LUMO+1 (blue).
The calculation for a separated molecule revealed a charge-transfer (CT) state for the S1 state, in which the transition was mostly owing to the transfer from HOMO to LUMO (Figure 4b,c). When observing the dimeric configuration, we found a degenerated S2 state, in which the energy levels of S1 and S2 in the dimer were slightly lower than that in the monomer, while the oscillator strengths of the two degenerated S states almost remained as in the single molecule (Figure 4d). A further investigation into the frontier orbitals of the dimers unveiled that the distributions of LUMO and LUMO+1, the orbitals that substantially contribute to S1 and S2, resided on the acceptor segments of both molecules and conjugated as a whole, supporting the postulation that multimers were formed (Figure 4e,f). The information on the specific values are detailed in Table S5.
3.6. Electroluminescent Properties
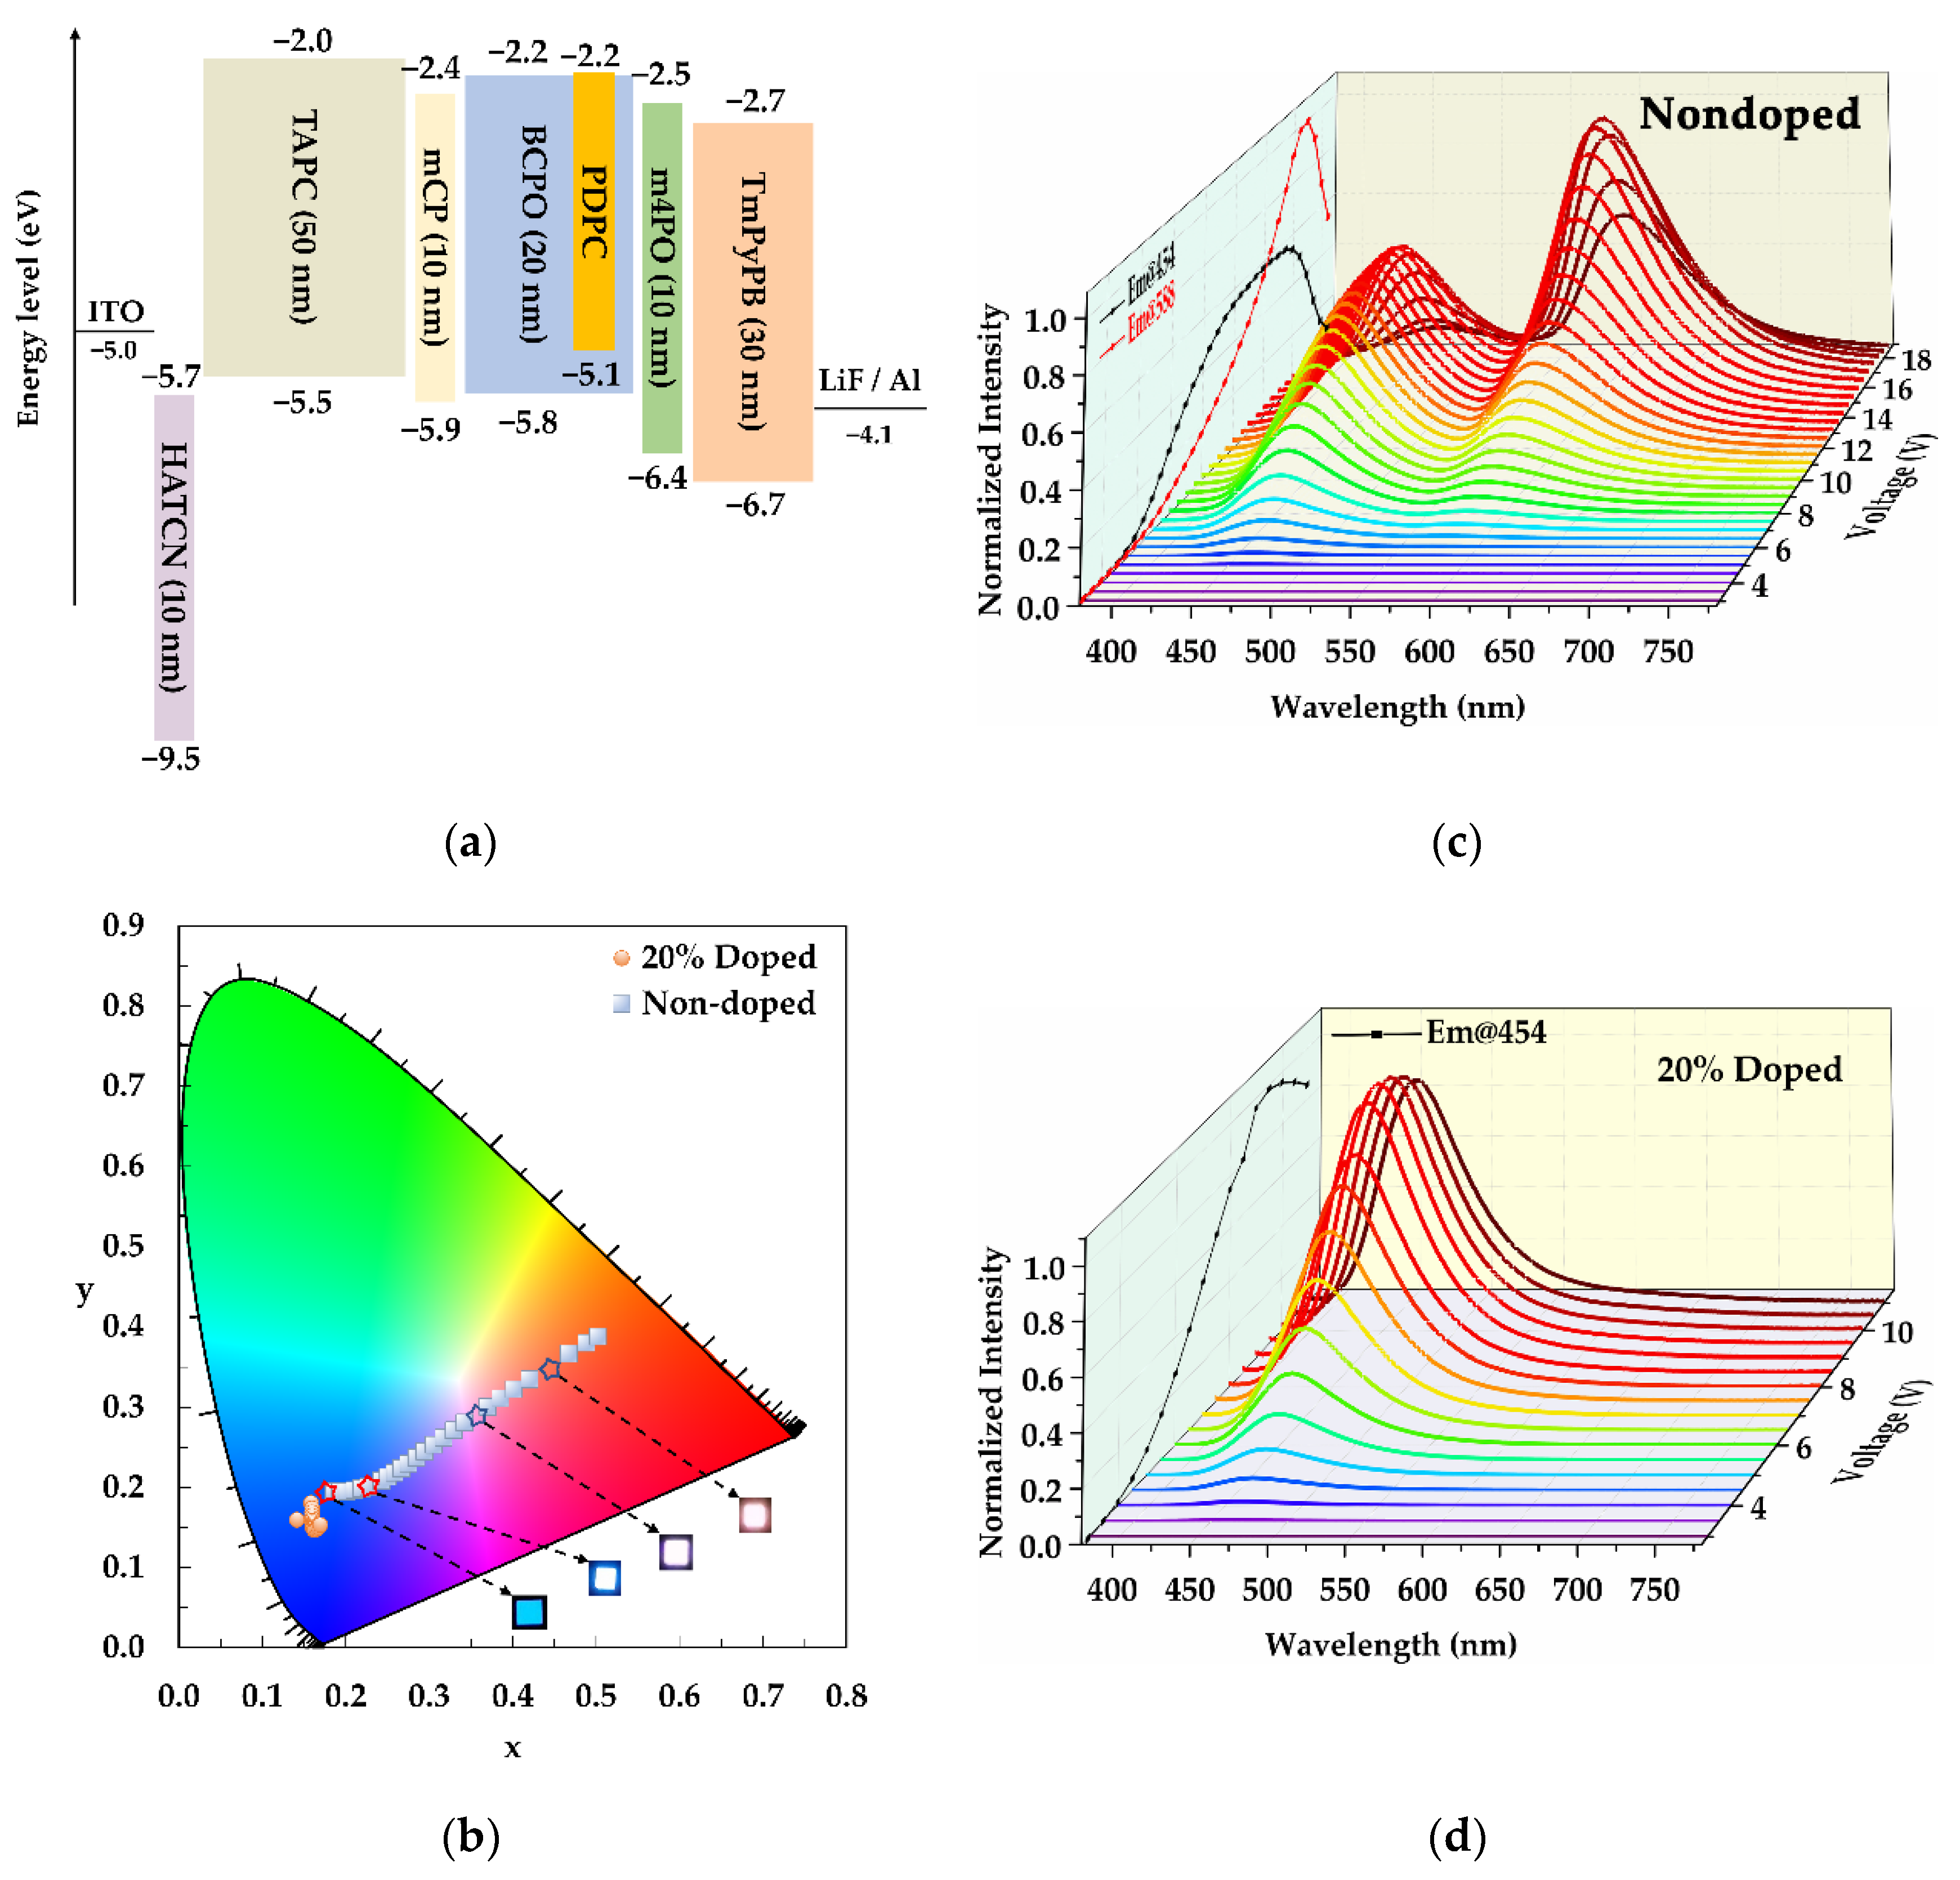
In order to examine the electroluminescent (EL) performance of the emitters, we fabricated nondoped and 20 wt%-doped OLEDs, the configurations of which [22,23] are depicted in Figure 5a. The energy level of PDPC was determined by CV analysis, the result of which is plotted in Figure S10b, and the bandgap was calculated from a Tauc plot that is shown in Figure S10c. The chemical structures of the used materials are drawn in Figure S11. The emission colors of the nondoped PDPC device drastically varied with increasing voltage, from blue, through pinkish white, to orange–red (Figure 5b). The EL spectra revealed two distinct bands peaking at around 460 and 590 nm (Figure 5c). The scatter-line figure referring to the maximum values of these peaks were projected on the left side wall of the 3D graph. When the voltage increased from 4 to 18 V, the intensities of both emission bands gradually increased, with varied intensity ratios. For instance, the blue-emission band dominated from 3 to 12 V, while the orange–red emission band was strengthened to be the predominant component at higher voltages (15–18 V). When the intensity of the latter emission peak surpassed its blue counterpart at 14.5 V, the device emitted a nearly white spectrum with a CIE 1931 coordinate of (0.35, 0.29) and a color rendering index (CRI) value of up to 93. As a comparative study, a device with an emitting layer of 20% PDPC, doped in BCPO, was fabricated, and the results are presented in Figure 5d. In contrast to the nondoped device, the doped device emitted blue light with indiscernible color change over a wide range of operating voltages. The EL spectra of the doped devices were voltage-independent and contained only one blue-emission band corresponding to the blue-emission band observed in the EL spectra of the nondoped device. The enlarged photos are displayed in Figure S12, and the parameters are listed in Table S6.
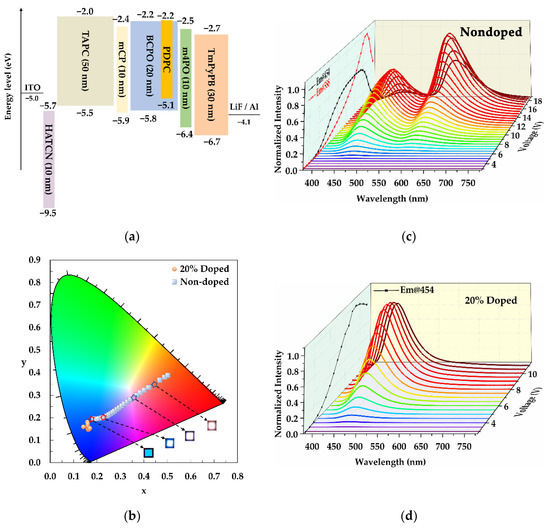
Figure 5.
(a) Diagram for each layer in the fabrication of devices; (b) the coordinate plots of the nondoped and 20% doped devices on CIE 1931 color space; The electroluminescent curves of fabricated devices with an emitting layer for (c) nondoped and (d) 20% doped PDPC, under various voltages.
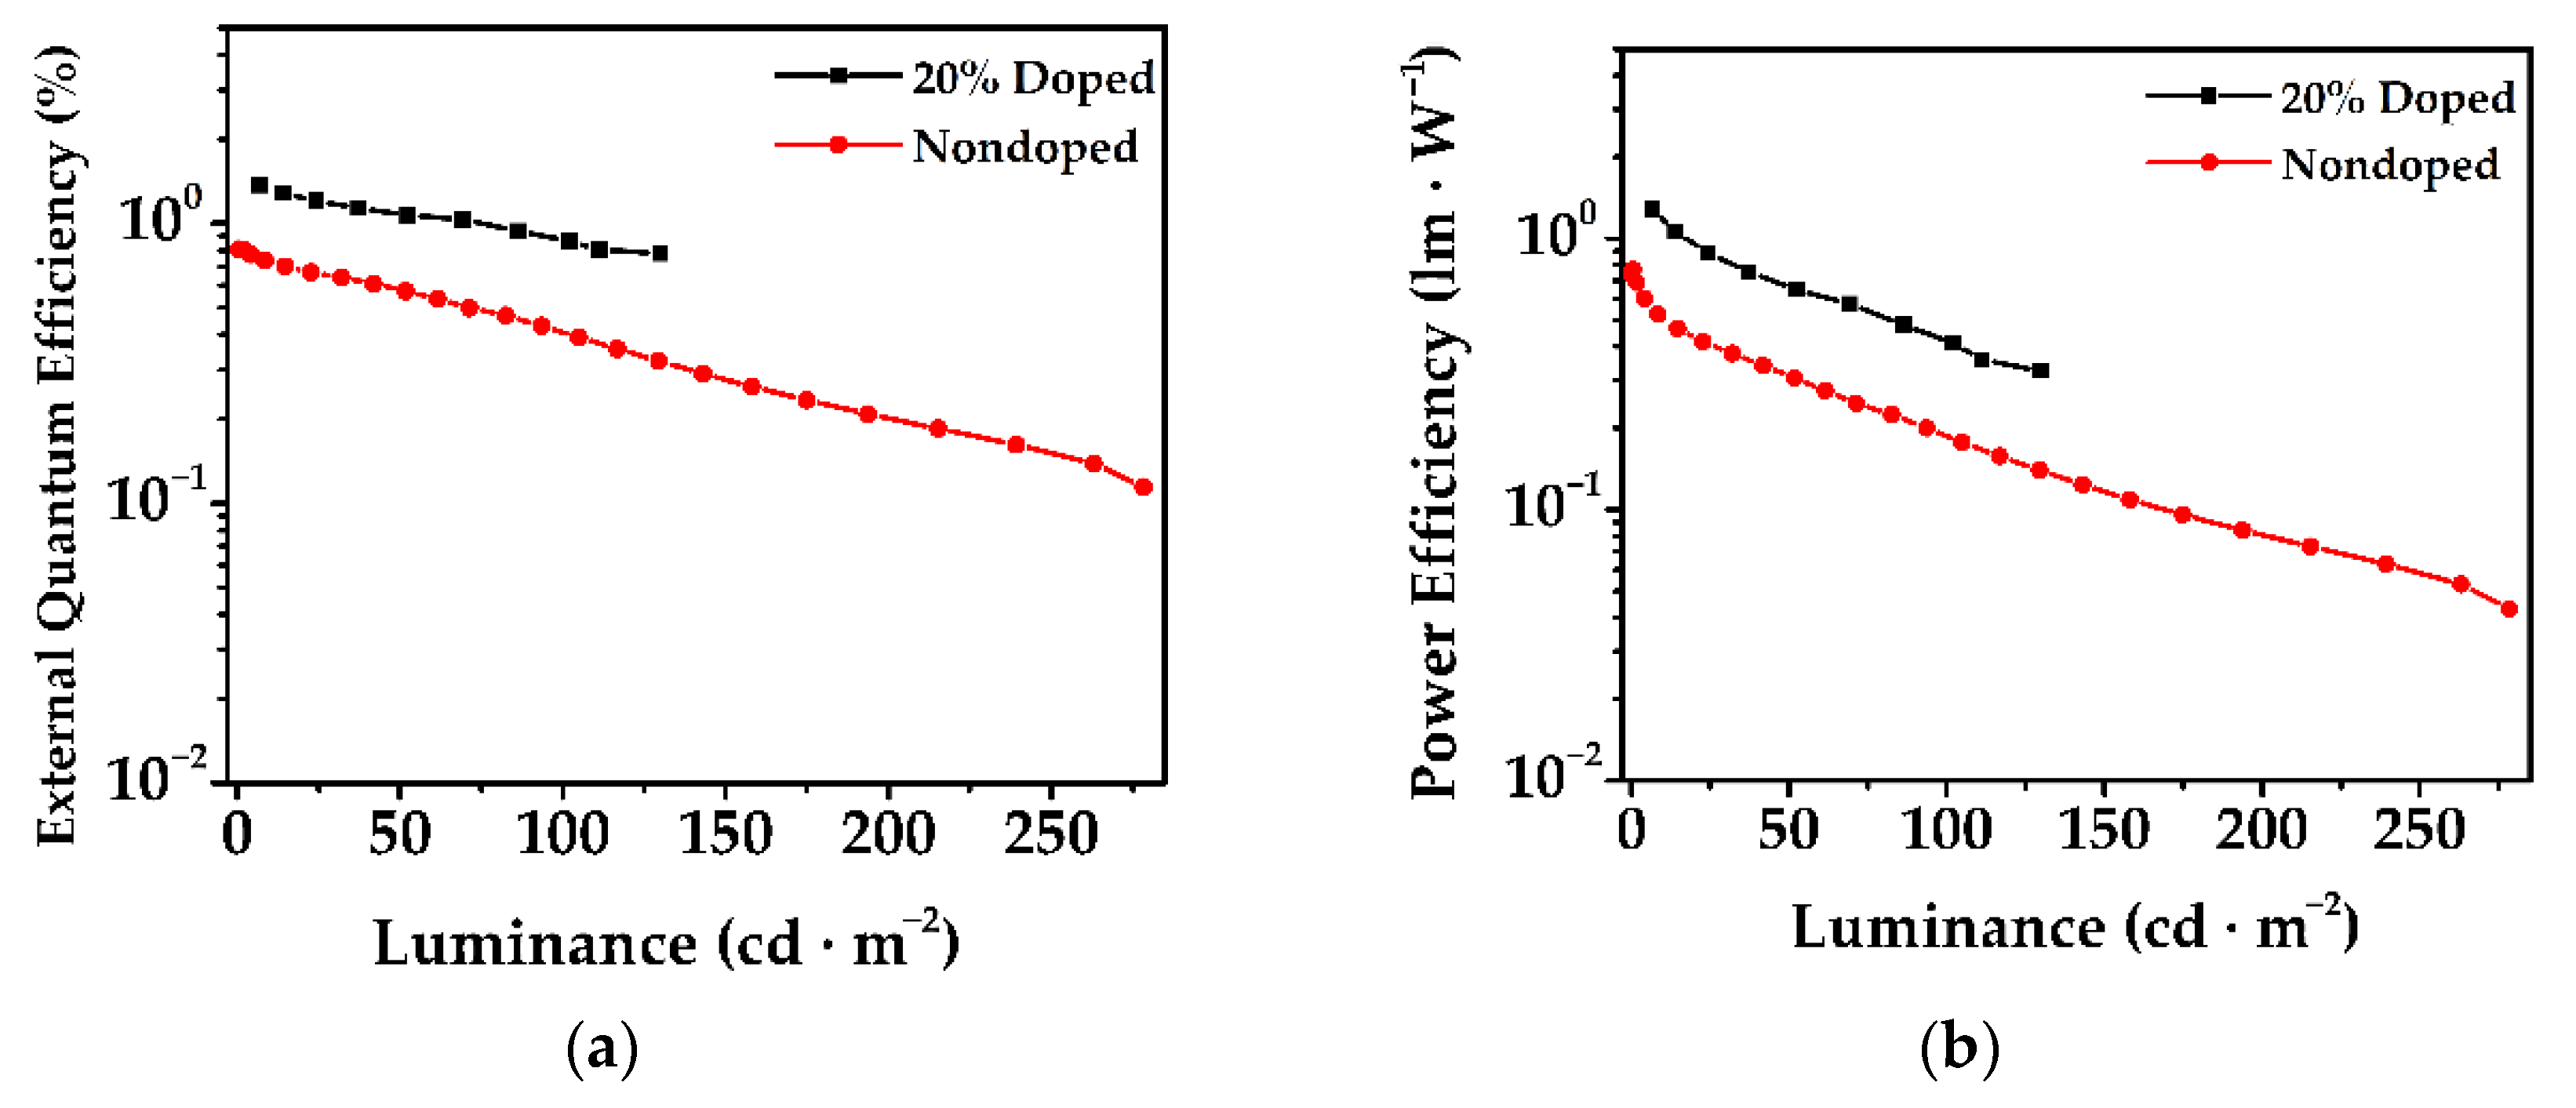
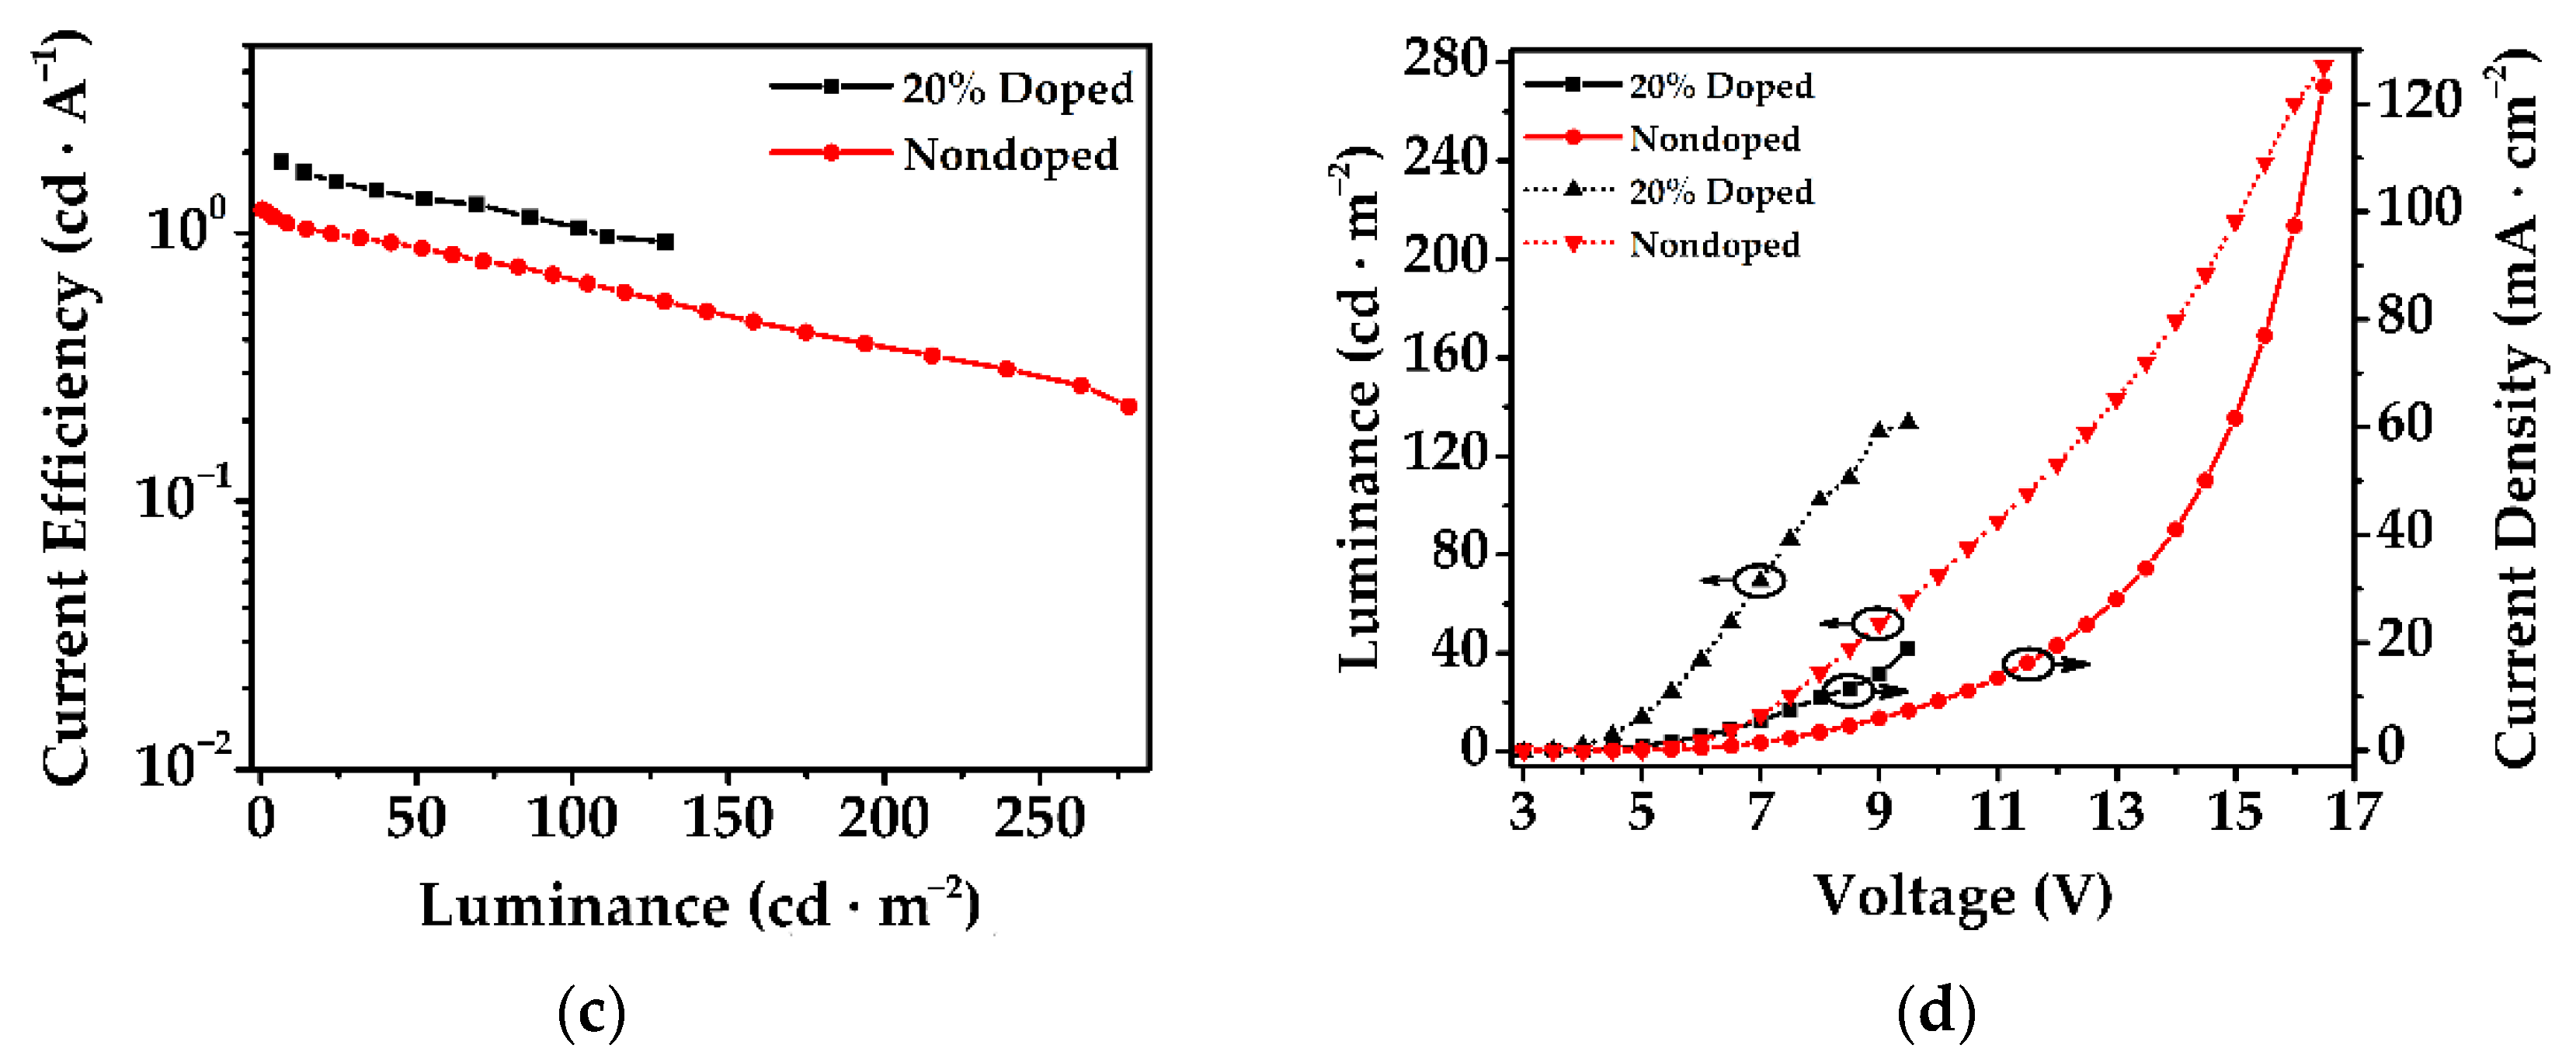
The key parameters for the electroluminescent performance of the doped and nondoped PDPC are compared in Figure 6. The lower turn-on voltage of the doped device (3.62 V) than that of the nondoped (5.19 V) indicated the efficient hole and electron injection of the former. In addition, the maximum EQE, PE, and CE for the doped device outperformed those of the nondoped device, which we attributed to the efficient separation of the excitons in doped devices, stemming from the dilution of PDPC that inhibited the concentration quenching. However, the maximum luminance of the nondoped device was over twice as much as that of the doped device. Based on the above-mentioned EL curves, it seemed plausible that the emission from the red region contributed to the high intensity of the luminance. However, both devices suffered from apparent efficiency roll-off. This could have been the result of the long-lived delayed fluorescence lifetimes (17.86 and 35.00 μs) and slow RISC rates (2.86 × 10⁴ and 5.60 × 10⁴ s−1).


Figure 6.
(a–c) The EQE, PE, and CE versus luminance plots, and (d) current density–luminance–voltage (J–L–V) plots for nondoped and doped devices. Circles and arrows in (d) indicated which side of the y axis the curve followed.
Thus, the orange–red emission band appearing only in the nondoped device could be attributed to the emission of excimers, as illustrated in Figure 7 [24,25,26]. In the nondoped device, the PDPC molecules were highly aggregated, leading to the possibility of forming excimers with a stabilized emissive state at a high-enough voltage. With an increase in voltage, the excitons’ recombined emission on the excimers sharply increased, resulting in a gradually redshifted emission color. The nondoped device failed when the voltage was higher than 16.5 V. However, when the emitter molecules were well-dispersed into the host BCPO, the formation of excimers was completely suppressed, with the only emission coming from the monomers.
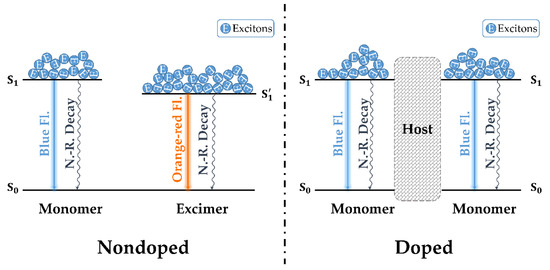
Figure 7.
A proposed mechanism illustrating the discrepancies of electroluminescence between nondoped and doped devices.
4. Conclusions
We designed and synthesized an organic molecule featuring a D–A–D structure with two ortho-substituted 3,6-di-tert-butyl-9H-carbazoles as donors and a central pyrimidine as the acceptor. The compound exhibited blue emission peaking at 454 nm under UV light. Using this compound as a single emitter, the nondoped OLED showed a unique voltage-dependent EL with emission colors spanning from blue to orange–red. The EL color of the nondoped device varied from blue to orange–red with an increase in voltage, during which a pinkish-white light with a CIE coordinate of (0.35, 0.29) and a CRI value of 93 was observed. We inferred from experimental and theoretical investigations that the electro-induced orangish-red emission stemmed from the excitation of multimers, which were formed via intermolecular interactions. Despite the TADF characteristics of the compound, the long-lived decay, small kRISC, and competitive knr against kr altogether lead to the concentration quenching of the exciton, which may be attributed to the depressed EL efficiencies. This study provides insight into the multimer-excited mechanism and may help to develop novel color-tunable OLEDs.
Supplementary Materials
The following supporting information can be downloaded at: https://www.mdpi.com/article/10.3390/nano12142333/s1, Scheme S1: Synthetic route of 2,5-bis(2-fluorophenyl)pyrimidine; Scheme S2: Synthetic route of 9-(2,3-bis((2-bromophenyl)thio)phenyl)-9H-carbazole (PDPC); Figure S1: 1H NMR spectrum of 2,5-bis(2-fluorophenyl)pyrimidine; Figure S2: 13C NMR spectrum of 2,5-bis(2-fluorophenyl)pyrimidine; Figure S3: 1H NMR spectrum of PDPC; Figure S4: 13C NMR spectrum of PDPC; Figure S5: Density residue for different denotations of the pyrimidine ring; Table S1: Single-crystal data for PDPC; Table S2: Selected bond lengths for PDPC; Table S3: Selected bond angles for PDPC; Figure S6: (a) UV-vis absorption spectrum of solid state PDPC; (b) TGA curve of PDPC; Figure S7: The normalized time-resolved photoluminescent spectra of neat-film PDPC within different time ranges under ambient temperature; Figure S8: The transient decay spectra of doped- and neat-film PDPC at room temperature; Figure S9: The (a) photoluminescence spectra and (b) transient decay curve of PDPC powder; Table S4: Photoluminescent lifetimes and percentages (A) of crystalline PDPC; Table S5: Component analysis of the excited-state PDPC monomers and dimers; Figure S10: The cyclic voltammetric plots for (a) ferrocene and (b) PDPC; (c) Tauc plot for UV-vis absorption of PDPC solution (ca. 10−5 mol/L); Figure S11: Chemical formula for the abbreviations in the fabricated device; Figure S12: Enlarged photo shots for the nondoped device; Table S6: Parameters for the nondoped device. Reference [27] are cited in the supplementary materials.
Author Contributions
Conceptualization, M.Y.; methodology, M.Y., T.-X.Z., S.-C.J. and X.-D.T.; software, M.Y., L.M. and D.L.; validation, M.Y., T.-X.Z., S.-C.J. and X.-D.T.; formal analysis, M.Y.; resources, L.M., D.L. and C.-Z.L.; data curation, M.Y.; writing—original draft preparation, M.Y.; writing—review and editing, X.-L.C. and C.-Z.L.; visualization, M.Y.; funding acquisition, C.-Z.L. All authors have read and agreed to the published version of the manuscript.
Funding
This research was funded by the Key Research Program of Frontier Science, CAS, grant number QYZDJ-SSW-SLH033; the National Natural Science Foundation of China, grant numbers 52073286, 21805281, 21875252, and 21773246; the Natural Science Foundation of Fujian Province, grant numbers 2006L2005, 2019J01125, and 2019J01123; the Fujian Science & Technology Innovation Laboratory for Optoelectronic Information of China, grant numbers 2021ZR132 and 2021ZZ115; the Youth Innovation Foundation of Xiamen City, grant numbers 3502Z20206082 and 3502Z20206083; the Major Research Project of Xiamen, grant number 3502Z20191015; and the Opening Project of PCOSS, Xiamen University, grant number 202014.
Institutional Review Board Statement
Not applicable.
Informed Consent Statement
Not applicable.
Data Availability Statement
The crystal data can be found at The Cambridge Crystallographic Data Centre (www.ccdc.cam.ac.uk (accessed on 8 May 2022)), No. 2171367.
Acknowledgments
We would like to extend our appreciation to the working staff from the test center of Xiamen Institute of Rare Earth, Haixi Institutes, for their hard work in testing; and the agent dealers of the reagent companies, for their efficiency in supplying reagents. M. Yang also wish to express his gratitude to Yanxin Chen for his advices in submitting article.
Conflicts of Interest
The authors declare that there are no conflict of interest.
References
- Coe, S.; Woo, W.K.; Bawendi, M.; Bulovic, V. Electroluminescence from Single Monolayers of Nanocrystals in Molecular Organic Devices. Nature 2002, 420, 800–803. [Google Scholar] [CrossRef] [PubMed]
- Han, T.H.; Lee, Y.; Choi, M.R.; Woo, S.H.; Bae, S.H.; Hong, B.H.; Ahn, J.H.; Lee, T.W. Extremely Efficient Flexible Organic Light-Emitting Diodes with Modified Graphene Anode. Nat. Photonics 2012, 6, 105–110. [Google Scholar] [CrossRef]
- Koch, N. Organic Electronic Devices and Their Functional Interfaces. Chemphyschem 2007, 8, 1438–1455. [Google Scholar] [CrossRef] [PubMed]
- Shen, Z.L.; Burrows, P.E.; Bulovic, V.; Forrest, S.R.; Thompson, M.E. Three-Color, Tunable, Organic Light-Emitting Devices. Science 1997, 276, 2009–2011. [Google Scholar] [CrossRef]
- Zhang, C.; Zhang, D.D.; Bin, Z.Y.; Liu, Z.Y.; Zhang, Y.W.; Lee, H.; Kwon, J.H.; Duan, L. Color-Tunable All-Fluorescent White Organic Light-Emitting Diodes with a High External Quantum Efficiency over 30% and Extended Device Lifetime. Adv. Mater. 2022, 34, e2103102. [Google Scholar] [CrossRef]
- Li, M.C.; Zhang, X.J.; Zhang, H.R.; Chen, W.B.; Ma, L.; Wang, X.J.; Liu, Y.L.; Lei, B.F. Highly Efficient and Dual Broad Emitting Light Convertor: An Option for Next-Generation Plant Growth LEDs. J. Mater. Chem. C 2019, 7, 3617–3622. [Google Scholar] [CrossRef]
- Yuan, W.Z.; Gong, Y.Y.; Chen, S.M.; Shen, X.Y.; Lam, J.W.Y.; Lu, P.; Lu, Y.W.; Wan, Z.M.; Hu, R.R.; Xie, N.; et al. Efficient Solid Emitters with Aggregation-Induced Emission and Intramolecular Charge Transfer Characteristics: Molecular Design, Synthesis, Photophysical Behaviors, and OLED Application. Chem. Mater. 2012, 24, 1518–1528. [Google Scholar] [CrossRef]
- Wang, C.; Hwang, D.; Yu, Z.B.; Takei, K.; Park, J.; Chen, T.; Ma, B.W.; Javey, A. User-Interactive Electronic Skin for Instantaneous Pressure Visualization. Nat. Mater. 2013, 12, 899–904. [Google Scholar] [CrossRef]
- Mao, M.; Lam, T.L.; To, W.P.; Lao, X.; Liu, W.; Xu, S.; Cheng, G.; Che, C.M. Stable, High-Efficiency Voltage-Dependent Color-Tunable Organic Light-Emitting Diodes with a Single Tetradentate Platinum(II) Emitter Having Long Operational Lifetime. Adv. Mater. 2021, 33, e2004873. [Google Scholar] [CrossRef]
- Frobel, M.; Schwab, T.; Kliem, M.; Hofmann, S.; Leo, K.; Gather Malte, C. Get It White: Color-Tunable AC/DC OLEDs. Light-Sci. Appl. 2015, 4, 317–322. [Google Scholar] [CrossRef] [Green Version]
- Jiang, Y.B.; Lian, J.R.; Chen, S.M.; Kwok, H.S. Fabrication of Color Tunable Organic Light-Emitting Diodes by an Alignment Free Mask Patterning Method. Org. Electron. 2013, 14, 2001–2006. [Google Scholar] [CrossRef]
- Wong, K.M.C.; Zhu, X.L.; Hung, L.L.; Zhu, N.Y.; Yam, V.W.W.; Kwok, H.S. A Novel Class of Phosphorescent Gold(III) Alkynyl-Based Organic Light-Emitting Devices with Tunable Colour. Chem. Commun. 2005, 2906–2908. [Google Scholar] [CrossRef] [PubMed]
- Cheng, G.; Chan, K.T.; To, W.P.; Che, C.M. Color Tunable Organic Light-Emitting Devices with External Quantum Efficiency Over 20% Based on Strongly Luminescent Gold(III) Complexes Having Long-Lived Emissive Excited States. Adv. Mater. 2014, 26, 2540–2546. [Google Scholar] [CrossRef] [PubMed]
- Liu, S.Q.; Wu, R.F.; Huang, J.; Yu, J.S. Color-Tunable and High-Efficiency Organic Light-Emitting Diode by Adjusting Exciton Bilateral Migration Zone. Appl. Phys. Lett. 2013, 103, 133307. [Google Scholar] [CrossRef]
- Wang, Q.; Ding, J.Q.; Ma, D.G.; Cheng, Y.X.; Wang, L.X.; Jing, X.B.; Wang, F.S. Harvesting Excitons via Two Parallel Channels for Efficient White Organic LEDs with Nearly 100% Internal Quantum Efficiency: Fabrication and Emission-Mechanism Analysis. Adv. Funct. Mater. 2009, 19, 84–95. [Google Scholar] [CrossRef]
- Mazzeo, M.; Vitale, V.; Della Sala, F.; Anni, M.; Barbarella, G.; Favaretto, L.; Sotgiu, G.; Cingolani, R.; Gigli, G. Bright White Organic Light-Emitting Devices from a Single Active Molecular Material. Adv. Mater. 2005, 17, 34–39. [Google Scholar] [CrossRef]
- Frisch, M.J.; Trucks, G.W.; Schlegel, H.B.; Scuseria, G.E.; Robb, M.A.; Cheeseman, J.R.; Scalmani, G.; Barone, V.; Mennucci, B.; Petersson, G.A.; et al. Gaussian 09; Revision D.01; Gaussian, Inc.: Wallingford, CT, USA, 2009. [Google Scholar]
- Lu, T.; Chen, F. Multiwfn: A Multifunctional Wavefunction Analyzer. J. Comput. Chem. 2012, 33, 580–592. [Google Scholar] [CrossRef]
- Humphrey, W.; Dalke, A.; Schulten, K. VMD—Visual Molecular Dynamics. J. Mol. Graph Model. 1995, 14, 33–38. [Google Scholar] [CrossRef]
- Ji, S.C.; Jiang, S.S.; Zhao, T.X.; Meng, L.Y.; Chen, X.L.; Lu, C.Z. Efficient yellow and red thermally activated delayed fluorescence materials based on a quinoxaline-derived electron-acceptor. New J. Chem. 2022, 46, 8991–8998. [Google Scholar] [CrossRef]
- Lu, T.; Chen, Q. Independent Gradient Model Based on Hirshfeld Partition: A New Method for Visual Study of Interactions in Chemical Systems. J. Comput. Chem. 2022, 43, 539–555. [Google Scholar] [CrossRef]
- Tao, X.-D.; Wei, Z.; Meng, L.; Chen, X.-L.; Yang, M.; Jing, Y.-Y.; Zhang, D.-H.; Lu, C.-Z. A Meta-Linkage Strategy Towards High-Performance Hosts for Efficient Blue Thermally Activated Delayed Fluorescence OLEDs. Mater. Chem. Front. 2022, 6, 748–756. [Google Scholar] [CrossRef]
- Jing, Y.-Y.; Tao, X.-D.; Yang, M.-X.; Chen, X.-L.; Lu, C.-Z. Triptycene-Imbedded Thermally Activated Delayed Fluorescence Emitters with Excellent Film Morphologies for Applications in Efficient Nondoped and Doped Organic Light-Emitting Devices. Chem. Eng. J. 2021, 413, 127418. [Google Scholar] [CrossRef]
- Sun, J.; Zhang, J.; Liang, Q.; Wei, Y.; Duan, C.; Han, C.; Xu, H. Charge-Transfer Exciton Manipulation Based on Hydrogen Bond for Efficient White Thermally Activated Delayed Fluorescence. Adv. Funct. Mater. 2019, 30, 1908568. [Google Scholar] [CrossRef]
- Wu, Z.; Liu, Y.; Yu, L.; Zhao, C.; Yang, D.; Qiao, X.; Chen, J.; Yang, C.; Kleemann, H.; Leo, K.; et al. Strategic-tuning of radiative excitons for efficient and stable fluorescent white organic light-emitting diodes. Nat. Commun. 2019, 10, 2380. [Google Scholar] [CrossRef] [PubMed] [Green Version]
- Wang, Z.; Su, S.J. Molecular and Device Design Strategies for Ideal Performance White Organic Light-Emitting Diodes. Chem. Rec. 2019, 19, 1518–1530. [Google Scholar] [CrossRef]
- OriginPro; Learning Edition; OriginLab Corporation: Northampton, MA, USA; Available online: https://www.originlab.com/originprolearning.aspx (accessed on 6 June 2022).

Publisher’s Note: MDPI stays neutral with regard to jurisdictional claims in published maps and institutional affiliations. |
© 2022 by the authors. Licensee MDPI, Basel, Switzerland. This article is an open access article distributed under the terms and conditions of the Creative Commons Attribution (CC BY) license (https://creativecommons.org/licenses/by/4.0/).