Article

Synthesis of Nanoceria with Varied Ratios of Ce3+/Ce4+ Utilizing Soluble Borate Glass

1
Department of Physics, Kennesaw State University, Marietta, GA 30060, USA
2
Department of Chemistry and Biochemistry, Kennesaw State University, Kennesaw, GA 30144, USA
3
Brookhaven National Laboratory NSLSII, Upton, NY 11973, USA
*
Author to whom correspondence should be addressed.
Nanomaterials 2022, 12(14), 2363; https://doi.org/10.3390/nano12142363
Submission received: 12 May 2022 / Revised: 10 June 2022 / Accepted: 13 June 2022 / Published: 10 July 2022
(This article belongs to the Section Synthesis, Interfaces and Nanostructures)

Abstract

:
Mixed-valence cerium oxide nanoparticles (nanoceria) have been investigated with pronounced interest due to a wide range of biomedical and industrial applications that arises from its remarkable redox catalytic properties. However, there is no understanding of how to control the formation of these two types of nanoceria to obtain Ce3+/Ce4+ ratios required in various applications. In this work, using a soluble borate glass, nanoceria with specific ratios of Ce3+/Ce4+ are created and extracted via controlled glass-melting parameters. Glass embedded with nanoceria as well as nanoceria extracted from the glass were studied via XANES and fitted with the Multivariate Curve Resolution (MCR) technique to calculate the ratio of Ce3+/Ce4+. Results show that mixed-valence nanoceria with specific ratios are hermetically sealed within the glass for long durations. When the glass dissolves, the mixed-valence nanoceria are released, and the extracted nanoceria have unchanged Ce3+/Ce4+ ratios. Furthermore, TEM investigation on released nanoceria show that the nanoceria consist of several different structures. Although nanocrystal structures of Ce7O12, Ce11O20, and Ce2O3 contribute to the reduced state, a new quasi-stable phase of CeO1.66 has been observed as well.

1. Introduction

In recent years, increased interest has been given to nanoceria due to its remarkable catalytic and electronic properties acquired by alteration of the oxidation states; tetravalent Ce4+ (CeO2) and less stable trivalent Ce3+ (Ce2O3) through a reversible ceric–cerous redox equilibrium reaction [1]. A redox reaction between CeO2 and CeO2−x through loss of oxygen and/or its electrons provides the cerium with the ability to reconfigure its electronic structure to adapt to the given environment. These oxygen vacancies in the lattice structure due to the reversible redox reaction make ceria a key ingredient for catalytic reactions, opening tremendous applications in industrial and medical fields. Nanoceria is applied in three-way catalytic converters, [2] solid oxide fuel cells (SOFC) [3], polymer electrolyte membrane (PEM) fuel cells [4], low-temperature ceramic fuel cells (CFC) [5], and nanoceria are used to create high-performing propellants [6]. There are several ongoing studies that demonstrate that controlling the Ce3+/Ce4+ ratios improve the properties of scintillators [7,8,9] and photodarkening in cerium-doped optical fibers [10]. In addition, ceria-doped glass is receiving significant attention due to their potential applications in non-linear materials for photonic devices [8,11,12]. The redox cycling between the two oxidation states plays a critical role in the use of nanoceria as scavengers of oxidizing radicals and molecules [7], alleviating pathologies associated with oxidative stress in biological systems [13]. Cerium-doped bioglass has antioxidant and anti-inflammatory properties and is useful in bone regeneration [14,15,16,17].
The importance of mixed-valence nanoceria is well characterized in biological systems. Hydrogen peroxide and superoxide anions are harmful byproducts of oxidative stress, and enzymes such as catalase and superoxide dismutase can quench these molecules, thus protecting the cell from oxidative stress damage [18,19]. Nanoceria with a predominance of Ce4+ mimics catalase while nanoceria with greater amounts of Ce3+ mimic superoxide dismutases [18,19]. Although these investigations underscore the importance of Ce3+/Ce4+ ratios, no studies have addressed controlling the Ce3+/Ce4+ ratio during synthesis, especially through glass formation with multivalent nanoceria embedded. In our previous work, we have shown that nanoceria of Ce3+ and Ce4+ valences are created when the glass is doped with CeO2 and can coexist within a soluble borate glass. The amounts of the two types of nanoceria created are controlled by glass-melting parameters, and when the glass dissolves in water, mixed-valence nanoceria of 2–5 nm are released into the aqueous media [20].
In the present study, we quantify the ratios sealed within the glass as a function of melting parameters and determine if the ratio of Ce3+/Ce4+ embedded within the glass remains the same when the nanoceria is extracted from the soluble glass. The transition of Ce3+ to Ce4+ is dynamic; however, when nanoceria of fixed ratios are created and embedded within a soluble borate glass we find that the Ce3+/Ce4+ ratio remains unchanged when the glass dissolves and nanoceria are released into the aqueous environment. The present study provides a novel mechanism to create mixed-valence nanoceria within a soluble glass and to extract mixed-valence nanoceria with the same Ce3+/Ce4+ ratio that was initially sealed within the glass.

2. Materials and Methods

2.1. Synthesis of the Glass Embedded Nanoceria

Sodium carbonate and diboron trioxide obtained from Alfa Aesar, MA, USA with 99.99% purity was mixed with powdered CeO2 of 99.9% purity to create a series of Na2O·2B2O3·xCeO2 glasses with x = 0.01–0.6 mol as shown in Table 1. The glass compositions containing 0.05 mol of CeO2 were then melted at different temperatures and times with different raw materials such as sodium tetraborate deca-hydrate to observe changes in Ce3+/Ce4+ ratios due to melting parameters. Each of these compositions were melted in a platinum crucible using a high-temperature furnace in air atmosphere and quenched between two steel plates to achieve a fast-cooling rate to prevent crystallization. Each sample was then processed to a fine powder using a Retsch Mixer Mill MM 500-Nanomill and stored in a desiccator cabinet.

2.2. Extraction of Nanoceria

3.0 g of powdered glass samples were treated with 50 mL of DI water for different lengths of time. After the addition of water, samples were vigorously mixed and incubated in a shaker at 37 °C to completely dissolve the glassy matrix. The nanoceria from the glass was extracted by (a) allowing nanoceria to settle under gravity, (b) centrifugation at 1500 rcf (low speed) for 5 min or centrifugation at 14,000 rcf (high speed) for 30 min. In all instances, the supernatant is removed and the extracted nanoceria precipitate is dried overnight at 70 °C.

2.3. Characterization of the Glass and the Nanoceria

X-ray Absorption Near-Edge Spectroscopy (XANES) is used to determine the changes in the electronic structure of cerium within the glass as well as extracted nanoceria. XANES spectra were obtained at the Ce L3 edge (5.7 keV) in fluorescence mode for all the glass samples using the inner Shell Spectroscopy (ISS) beamline at the National Synchrotron Light Source NSLS II at Brookhaven National Lab. Ratios of Ce3+/Ce4+ within the glass as well as within the extracted nanoceria were resolved using XANES. To calculate the ratio of Ce3+/Ce4+, all XANES data were analyzed with Multivariate Curve Resolution (MCR) technique using PyMCR [21] implementation. The details of the analysis are summarized in the supporting information. Briefly, we first investigated the sensitivity of the fitting results to the reference spectra for Ce3+/Ce4+ species, as well as established a necessary set of constraints that yields physically meaningful results of the MCR fitting (Supporting information, Figure S1). Upon verifying that the procedure resulted in satisfactory fitting of the data (Supporting information, Figure S2), we have performed several runs of MCR fitting using different sets of reference spectra as starting solutions to recover the Ce3+/Ce4+ fractions in each sample (Supporting information, Figure S3). The reported Ce3+/Ce4+ fractions and their uncertainties were estimated based on averages and standard deviations of the MCR fitting runs. XANES is the most powerful technique to identify Ce3+/Ce4+ due to its ability to resolve differences at the absorption edge for different valence states of cerium ions. Other techniques such as Raman and UV-Vis spectroscopy are unable to provide accurate quantitative values for Ce3+/Ce4+ ratios as XANES does. Furthermore, the nanocrystalline structure was analyzed via a high-resolution FEI Tecnai G2 F30 Transmission Electron Microscope (TEM), Atlanta GA USA. TEM samples were prepared by resuspending the extracted nanoceria in DI water and the dispersed nanoparticles were placed on the TEM copper grid followed by overnight drying. The nanocrystalline structure was analyzed via Open-Source Image-J software.

3. Results and Discussion

Our results show that when the glass composition is doped with cerium (IV) oxide, during high-temperature melting, ceria distributes mainly into two oxidation states, tetravalent Ce4+, and the less stable trivalent Ce3+. This formation of multivalent ceria nanoparticles (nanoceria) is governed by a cerox–ceric reaction, CeO2 ↔ CeO2−δ + δ 2 O2 within the soluble borate glass. Depending on the oxygen availability in the molten state, the concentration of Ce4+ and Ce3+ changes. When the glass is formed, the tetravalent Ce4+ and less stable trivalent Ce3+ nanoceria, with specific ratios, are embedded and sealed within the glass indefinitely.

3.1. Ce3+/Ce4+ Ratio of the Nanoceria Embedded within the Glass

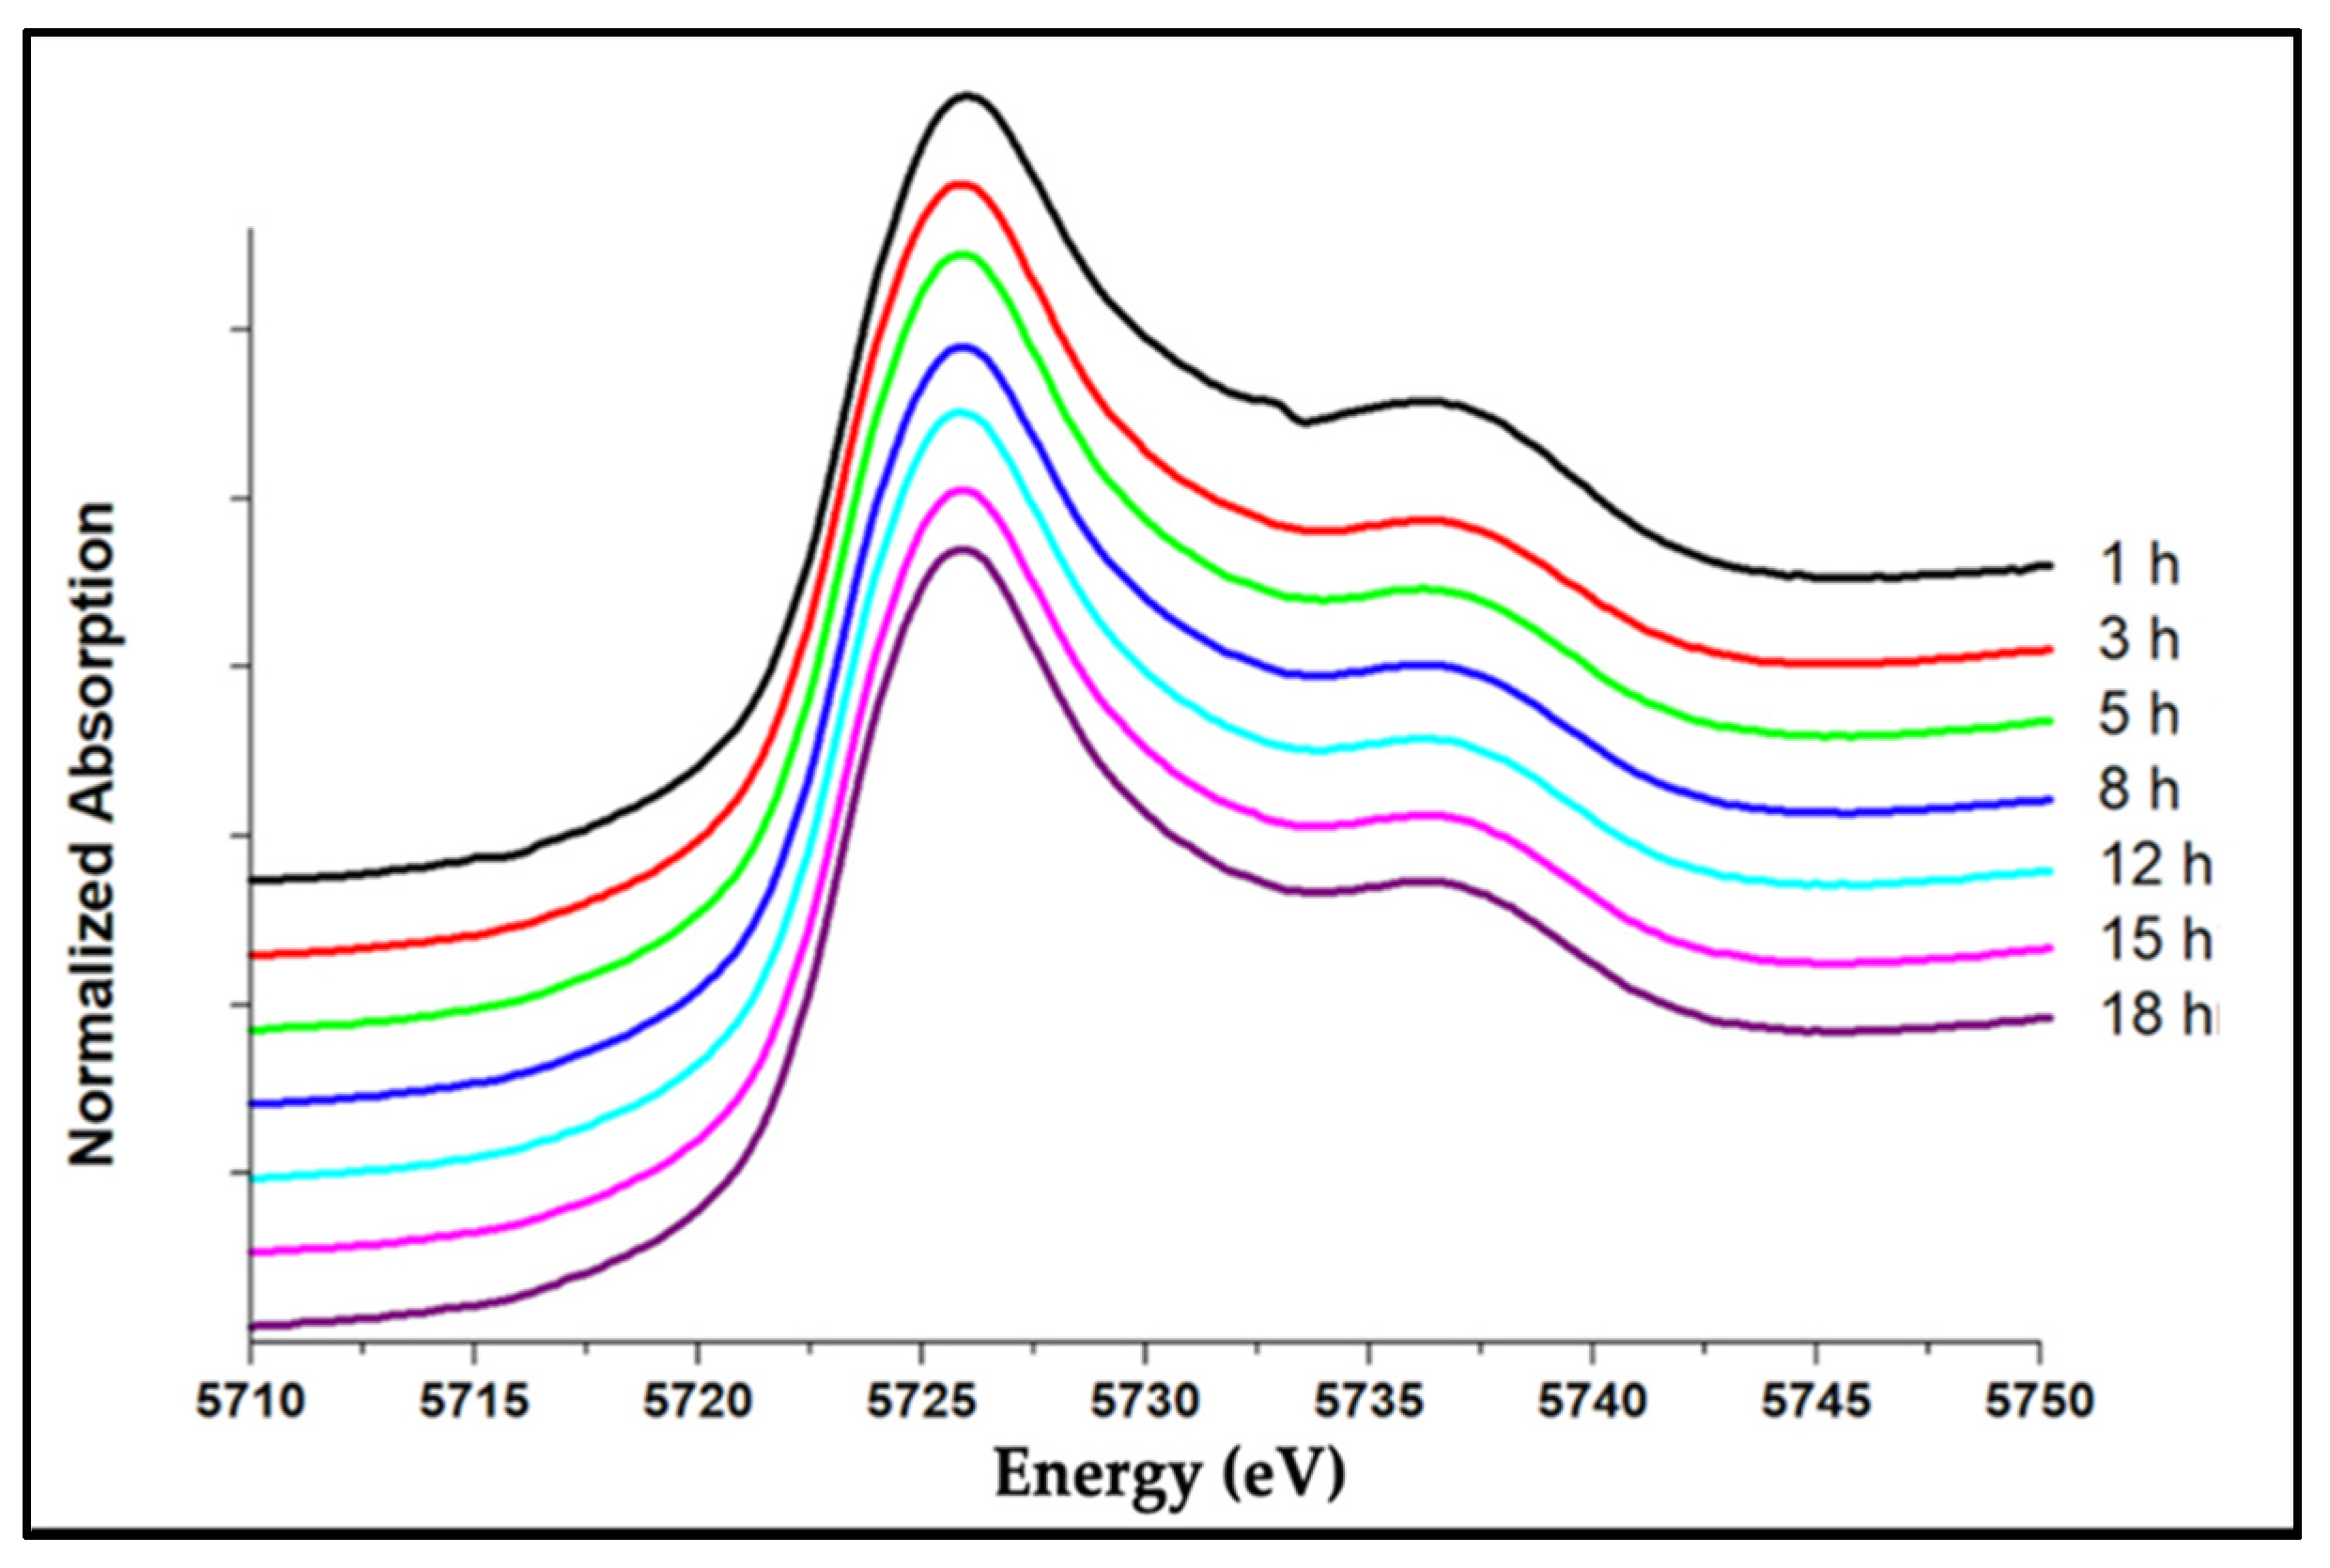
To determine the cerium valence states in each of the melted glasses, in situ valence states of Ce4+ and Ce3+ were determined using XANES at the Ce L3 edge, which involves a 2p → 5d transition located around 5.7 keV. To identify the existence of Ce4+ and Ce3+ valences within the glass, cerium(III)fluoride (CeF3) and cerium(IV)oxide (CeO2) were used as standards. As shown in Figure 1a, the standard CeF3 shows a characteristic Ce3+ peak (A) at −5726 eV, and CeO2 shows two peaks around 5730 eV and 5737 eV. The peak B at 5737 eV is due to the excitation of an electron from 2p to 5d shell associated with the configuration 2p4f05d1 whereas peak (C), at 5730 eV is due to the transition of an electron from the 2p orbital of adjacent O to the 4f shell of Ce to produce a final state of 2p4f15d1 which is indicative of Ce-O bonding in CeO2 while the transition to 2p4f15d1 is forbidden in cerium (III) oxide (Ce2O3) [17]. As shown in Figure 1b, when Na2O·2B2O3 glass composition is doped with 0.05 mols of CeO2, the Ce4+ ↔ Ce3+ reaction occurs to convert Ce4+ to Ce3 during the glass-melting process. As expected, the forbidden peak (C), at 5730 eV is notably missing within the glass. The two peaks were fitted with the MCR technique to calculate the ratio of Ce3+/Ce4+. Table 2 shows the Ce3+/Ce4+ ratios calculated by fitting XANES data using MCR for glass compositions with increased doping amounts of CeO2. The S4NBCe glass with 0.04 mol of CeO2 has the smallest Ce3+/Ce4+ ratio of 0.72, while S1NBCe glass with 0.01 mol of CeO2 melted at the same temperature and same time had the highest Ce3+/Ce4+ ratio of 2.41. Although we see shifts in Ce3+/Ce4+ ratios with different doping concentrations of initial CeO2, no specific trend that correlates Ce3+/Ce4+ratios to the doping content of CeO2 is observed. The Ce3+ concentrations in glass compositions doped with the same amount of CeO2 and melted at the same temperatures but for different times showed no significant change in the Ce3+/Ce4+ ratio, as shown in Figure 2. As seen in Table 3, when S5NBCe glass is melted with sodium tetraborate decahydrate at 1100 °C for from 1 h to 18 h, the Ce3+ concentrations remained near constant with a slight gain in the Ce3+ concentration from the first 1 h to 3 h of melting. When the same glass melted at temperatures 1200 °C and 1300 °C, the Ce3+ concentration is maintained at approximately 0.79 ± 0.09 and 0.87 ± 0.09, respectively. These results indicate that the equilibrium reaction that converts Ce4+ ⇾ Ce3+ occurs during the first few hours of melting. With no change in the furnace conditions, the longer hours of melting did not contribute to further catalytic conversion of ceria. Our results are comparable to the results obtained for an alkali borosilicate glass where Ce3+ concentration has remained at (83 ± 3)% when melted for 4 and 16 h [22]. On the other hand, as shown in Table 3, when the S5NBCe glass is melted at different melting temperatures for an hour, significant differences in Ce3+ concentrations are observed causing the ratio Ce3+/Ce4+ to change significantly. A similar trend was seen within S1NBCe glass showing an almost complete reduction to Ce3+. The S1NBCe, glass melted at 1200 °C for 1 h, and 93% of Ce4+ was reduced to Ce3+ giving a 13.13 ratio of Ce3+/Ce4+ while the same glass was melted at 1100 °C, only a 70% reduced to Ce3+ as shown in Table 4. However, when S1NBCe was melted at 1000° for 1 h, Ce3+/Ce4+ ratio was 8.82 with 90% of Ce3+ ions created by Ce4+ ⇾ Ce3+ transition during this melt. We believe when ceria undergoes thermal decomposition at high temperatures, there is a rapid decrease in Ce4+ with the formation of oxygen vacancies and a simultaneous formation of CO2 from sodium carbonate which can act as an oxidizer. Due to these competing processes, ceria could be partially reduced at 1100 °C while almost fully reduced at 1000 °C and 1200 °C. Schelter et al. [23] have discussed that ceria could be in multiconfigurational states, with some valences act as intermediate states that are trapped between Ce3+ and Ce4+ valent states. Our TEM data of the extracted nanoceria (see Section 3.3) strongly agree with this statement as we have observed the transformation of rhombohedral Ce7O12 to triclinic Ce11O20 at small temperature differences. We strongly believe that the redox changes between 1000 °C to 1100 °C and 1200 °C are a result of these intermediate states.
Furthermore, to study the effect of the furnace atmosphere and the raw materials on the formation of nanoceria with Ce3+/Ce4+ ratios, glass was melted at different air flow as shown in Table 4 while keeping the melting temperature at 1100 °C and 1 h of melting time constant. Results show that while melting in argon gas and dry air did not contribute to a significant change in Ce3+, but when melted with nitrogen gas atmosphere, 84% of the Ce4+ transferred to Ce3+. This could be because, while all three gases, nitrogen, argon, and dry air, were expected to be inert, nitrogen act as an inert gas at high temperatures. We used dry air to observe the difference between a normal air atmosphere within the furnace, but at high temperatures, due to the lack of water vapor, we did not observe any changes in Ce3+. Argon, being a noble gas, did not contribute any reduction or oxidization as expected. Furthermore, the glass was melted with different sources of cerium oxides as shown in Table 4, to understand the reduction process further. The glass melted with Ce(SO4)2 has almost the same amount Ce3+ while the glass doped with Ce(NO3)3 had a higher Ce3+. This result is as expected since the redox reaction, in this case, is Ce3+ → Ce4+ the abundance of oxygen makes it less likely to create Ce4+ nanocrystals. Additionally, we tested the shelf life of nanoceria-embedded glass to determine the effect of storage conditions on Ce3+/Ce4+ ratios within the nanoceria-embedded glass. We tested the S5NBCe glass that was melted and stored a year ago by XANES. Our results show (Table 4) that S5NBCe glass that was melted one year ago (labeled S5NBCe*) had roughly the same Ce3+ content, stating that the studied glass composition not only creates multivalent nanoceria but also maintains the ratio within the glass embedded indefinitely.

3.2. Ce3+/Ce4+ Ratio of the Extracted Nanoceria

To determine if the released nanoceria from soluble glass maintains the same ratio that was created within the glass, we tested the extracted samples using XANES. The soluble borate glass S5NBCe was used, with the following differences. B2O3 and Na2CO3 were replaced with sodium tetraborate decahydrate. Melting was carried out at 1100 °C for 1 h. Prior to dissolution, the Ce3+ concentration for this glass was 0.64 ± 0.09 was determined by XANES, which is equivalent to Ce3+/Ce4+ ratio of 1.77 ± 0.51. To extract the nanoceria, the glass was incubated, with shaking, at 37 °C for various lengths of time from 2 h to 24 h. After incubation, nanoceria were collected with and without centrifugation. Two speeds of centrifugation were used, a low speed at 1500 rcf and a high speed at 14,000 rcf. Figure 3 shows the ratios of the concentration of Ce3+ analyzed by MCR data fitting of the XANES data for the extracted nanoceria. Within 2 h of incubation, the extracted nanoceria showed roughly the same amount of Ce3+ concentration with 0.61, 0.63, and 0.64 for 1500 rcf, 14,000 rcf, and zero rcf, respectively. Although both 1500 rcf and 14,000 rcf maintained the same Ce3+ amount within average, the nanoceria extracted using 1500 rcf had consistently a lower value averaging to a 0.61 ± 0.09 of Ce3+ amount with a lower Ce3+/Ce4+ ratio of 1.57 ± 0.48. When the nanoceria were extracted by just dissolving in DI water without centrifuging, the extracted sample showed a slight increase of Ce3+ amount with 0.66 ± 0.09 giving a Ce3+/Ce4+ ratio of 1.96 ± 0.44. The overall change in Ce3+ content in the extracted nanoceria is insignificant for the incubated times and but the speed of centrifugation has an effect. When the samples were incubated with no centrifugation, samples showed an increase in the Ce3+ content with longer incubation times. This could be because when collecting nanoceria without centrifugation, the cerous–ceric reaction is allowed to occur naturally in the presence of the glassy substrate where the, without any centrifugation, ceria may tend to reduce further increasing the Ce3+ concentration to form when compared to nanoceria collected by centrifugation. Collectively though, these results indicate that ratios of mixed-valence nanoceria extracted from this glass composition using different speeds of centrifugation are very stable, and even after 24 h of incubation in an aqueous media, the ratios remain the same.

3.3. TEM Analysis of Extracted Nanoceria

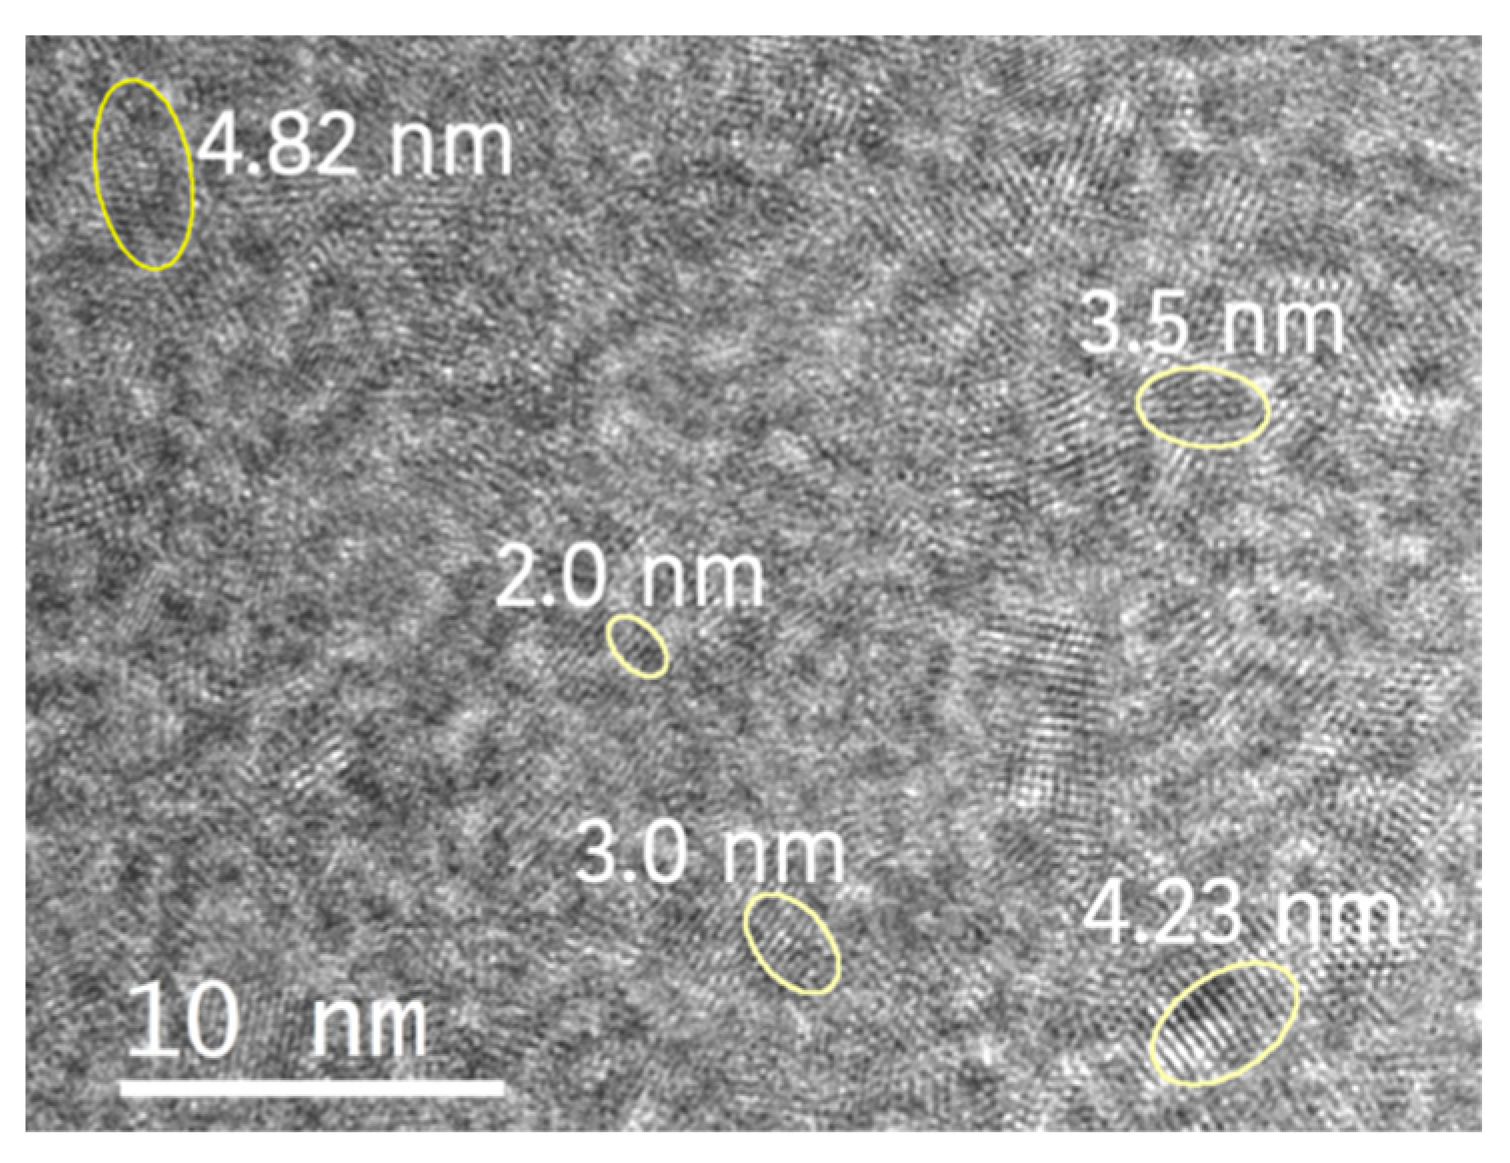
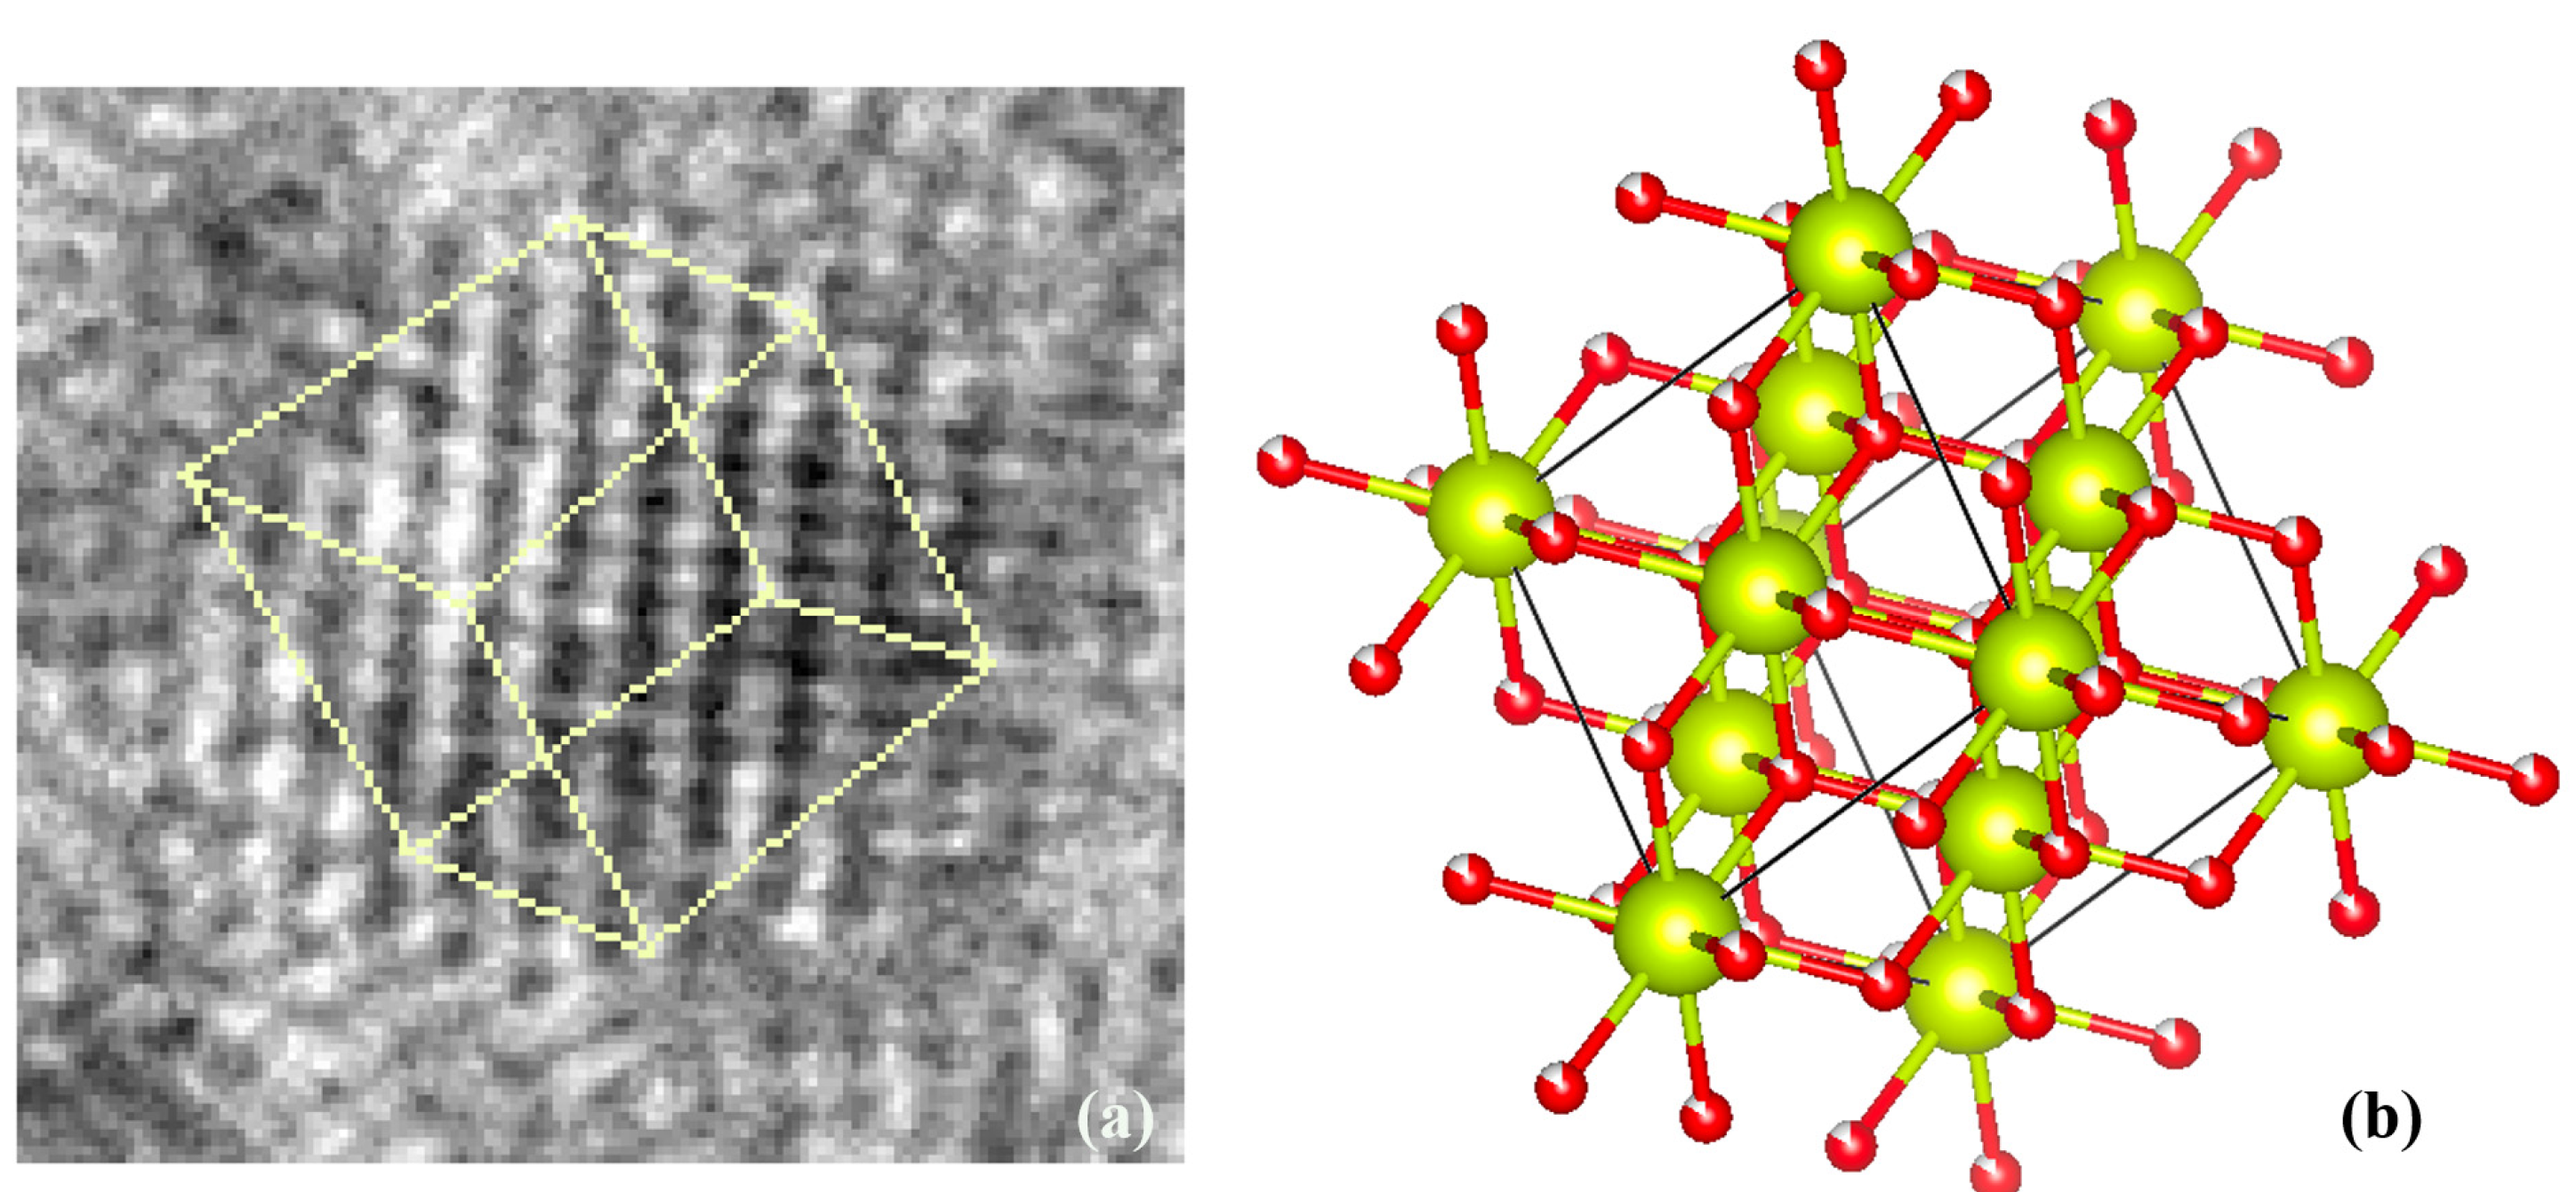
TEM results show that when powdered S5NBCe glass is dissolved in DI water for 2 h, the released nanoparticles are 2–5 nm in size, as shown in Figure 3. The oval shapes, seen in Figure 4, are drawn to highlight the nanoceria sizes. Even though the majority of the nanoceria are in the form of tetravalent Ce4+ (CeO2) and trivalent Ce3+ (Ce2O3); TEM data shows evidence of crystalline phases of Ce7O12 and Ce11O20. The schematic diagram of the unit cells of these identified structures are shown in Figure 5, which are plotted using Vesta software and the Crystallography Open database. The Ce3+ structures are observed in the form of Ce2O3, Ce7O12, and Ce11O20 as shown in Figure 5b–d, while the CeO2 phase is observed in the cubic fluorite structure as shown in Figure 5a [24,25,26].
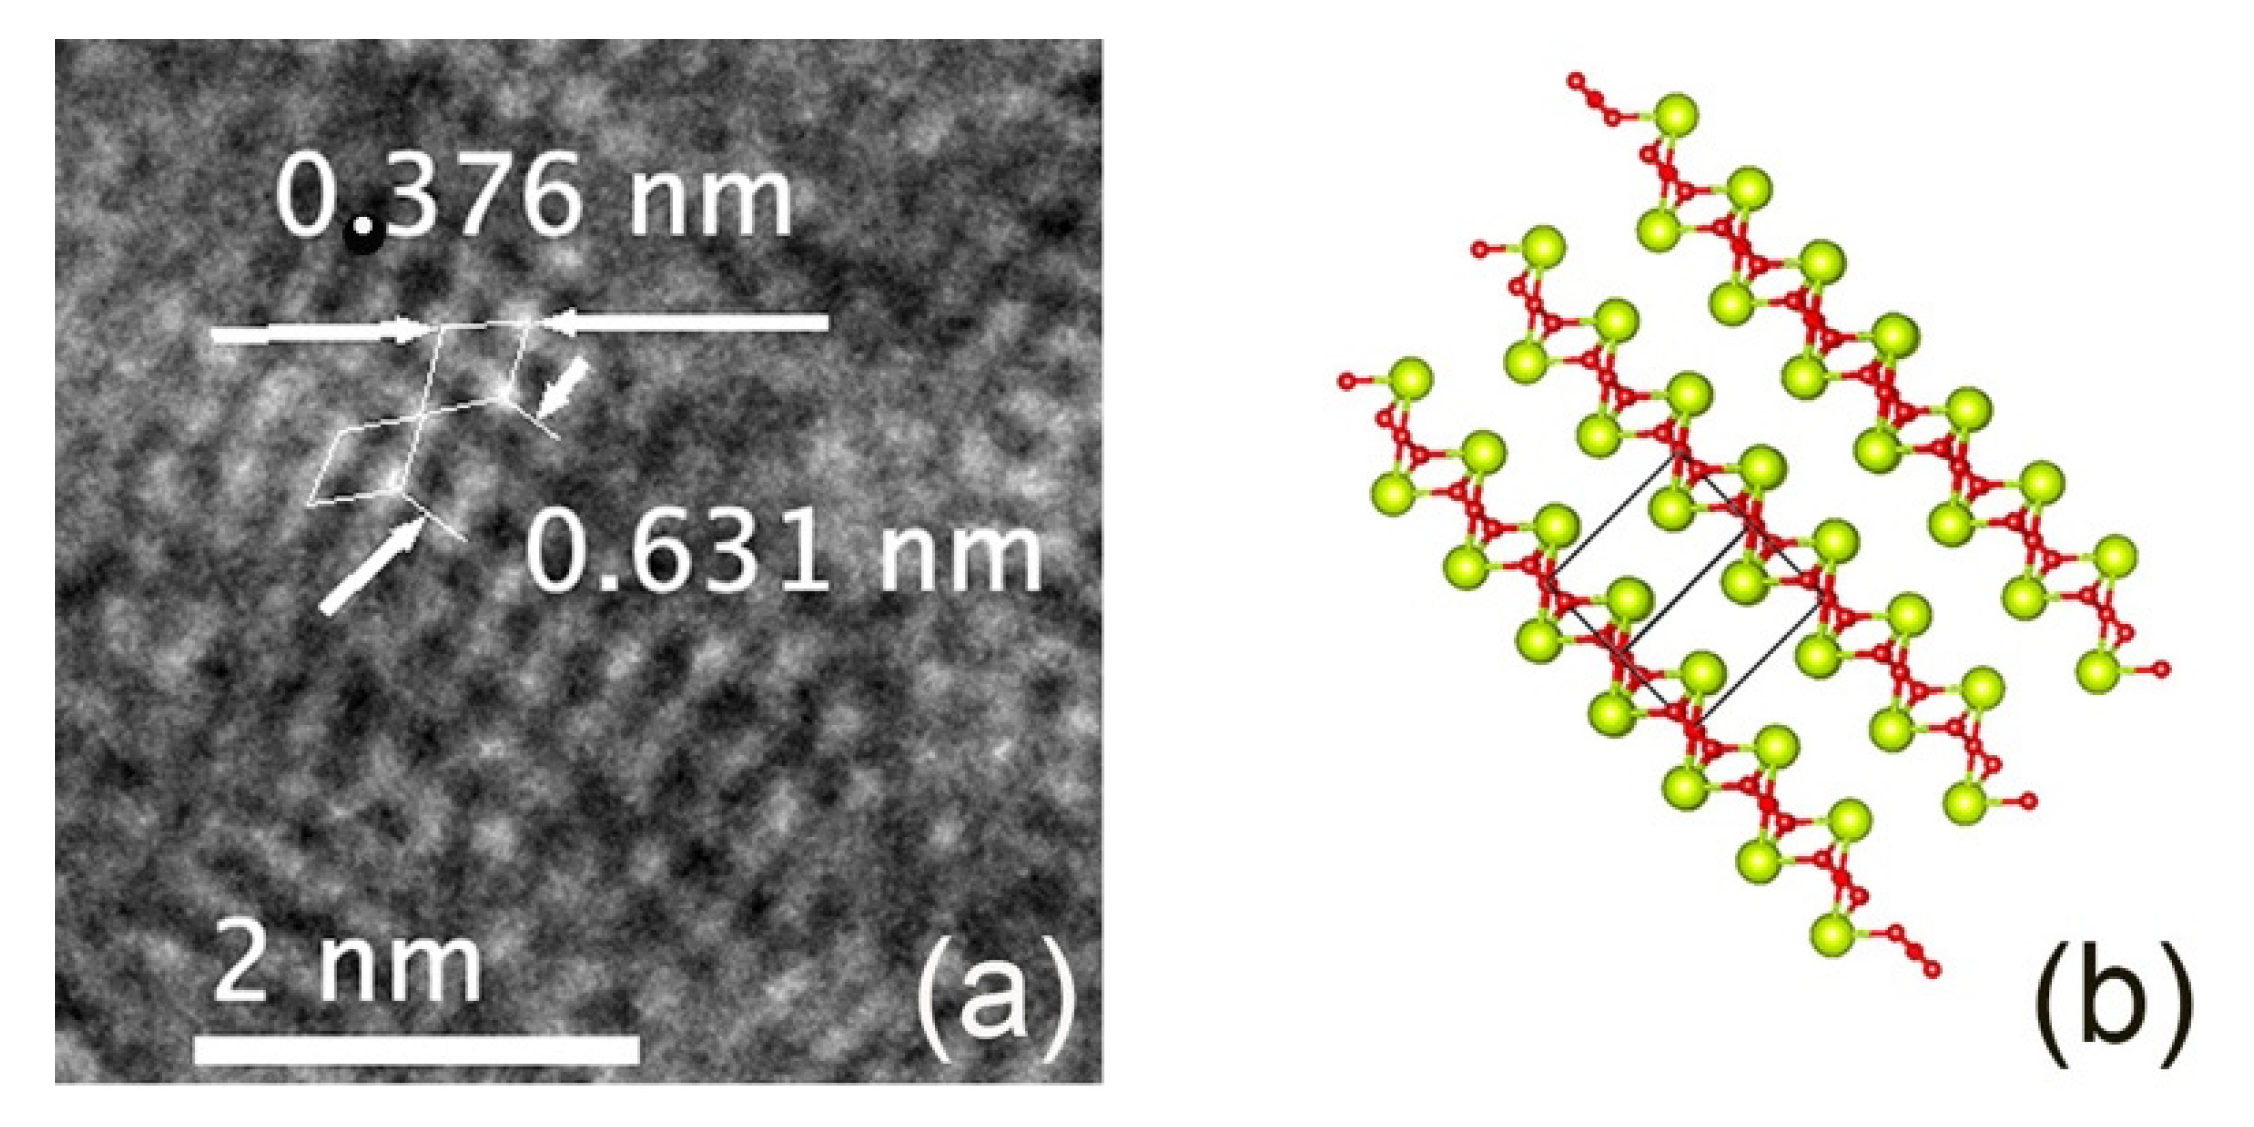
The TEM images of the nanoceria particles obtained from the S5NBCe glass show nanoceria crystal structure with a lattice distance of 0.242 nm, as shown in Figure 6a, which is comparable to the theoretical value of the interatomic distance of Ce–O of the (100) plane of cubic CeO2 [27]. The lattice distance of 0.322 nm corresponds to the (111) plane of the cubic fluorite structure of CeO2, as shown in Figure 6b. Our data on CeO2 structure are comparable to the nanoparticles synthesized by others [28,29,30,31], even though the nanoparticles created from our method are far smaller. The measured Ce–Ce of the interatomic distance of 0.385 nm matches to the distance between the face-centered cerium atom to the successive Ce atom of the cubic CeO2 of 0.3825 nm [27]. Out of the measured atomic distances in our nanoceria samples, a considerable amount of nanoceria has an atomic distance of 0.376 nm, which corresponds to the distance between Ce–Ce atoms on the (011) plane, as shown in Figure 7a. The measured distance between the two Ce atoms on the (100) plane is 6.31 Å which matches to the unit cell distance of the A-type Ce2O3. These measurements confirm the existence of the A-type Ce2O3 nanocrystals, as shown in the schematic diagram in Figure 7b. We have observed nanocrystals in the form of rhombic Ce7O12 and triclinic Ce11O20 in nanoceria extracted from the glass. Figure 8a shows a TEM image of the unit cell of Ce7O12 nanocrystal while that image was compared with the schematic diagram of Ce7O12 plotted according to the work done by Kümmerle et al. [24]. Image 7b shows the cross-section of a stackable (101) plane of the Ce7O12 unit cell. The atomic distance between the corner cerium atoms is 0.625 nm and comparable to the rhombic structure (Figure 8c), while the distance between the inner off-centered Ce atom is measured to be 0.389 nm.
Our measured distances also show us the existence of triclinic Ce11O20 nanocrystals. Figure 9a indicates a (100) plane of nanocrystal structure of Ce11O20 along with the schematic diagram of Ce11O20 schematic diagram of Ce11O20 with (110) plane indicated by the yellow.
A recent study conducted by Bekheed et al. discusses the coexistence of Ce7O12 and Ce11O20 on the reduced CeO2 when pure CeO2 powder is calcined at 1100 °C [32]. Their in situ high-temperature synchrotron XRD data indicated that CeO2 reduced to 62.4 wt.% rhombic-Ce7O12 and to 25.5 (0.6) wt.% triclinic Ce11O20. Bekheed et al. stated that the fluorite structure originally transformed into the bixbyite-type structure Ce2O3+δ or CeO2−δ around 955 °C, which stayed stable before transforming partially into rhombohedral Ce7O12 around 650 °C and to triclinic Ce11O20 at 520 °C while cooling down. They claimed that the Ce7O12 consists of Ce0.583+Ce0.424+O1.71 while the Ce11O20 phase consists of Ce0.483+Ce0.524+O1.76. Furthermore, Murgida et al. [33] argued that the crystal structures of Ce7O12, Ce11O20, and C-type Ce2O3 are reduced structures that can be considered to be sublattices of CeO2 fluorite.
These results confirm our data as we believe the abundance of oxygen in the glass matrix reduces the CeO2 and further changes the phase as the melt cools down, giving rise to various Ce3+/Ce4+ ratios depending on the glass-melting parameters. We also observed another phase with a structure of CeO1.66 that has been newly identified [33,34] as a possible reduced phase. Some of the TEM images of nanoceria crystals analyzed show measured Ce-Ce lattice distances of 0.398 nm and 0.559 nm, indicating another FCC structure with Ce-O lattice distance of 0.246 nm, as shown in Figure 10a. These lattice parameters suggest the existence of nanoparticles in the form of CeO1.66 crystal, as shown in Figure 10b, schematics lattice structure plotted according to the theoretical data [24]. Murgida et al. [33] discussed a quasi-stable bulk Ce3O5 structure that is equivalent to the CeO1.66 structure that we have observed within the nanoceria extracted from the glass. These results indicate the formation of a mixed-valence state of nanoceria within the glass during melting and release; nanoceria acquired from the glass consists of multivalent nanoceria with different Ce3+/Ce4+.
Furthermore, it has been observed that the nanoparticles that are less than 5 nm undergo lattice expansion [35,36,37,38,39,40,41]. According to Tsunekawa et al., when nanoceria undergoes a redox reaction, the CeO2 is reduced to CeO2−x state and has been associated with a lattice expansion as the smaller Ce4+ transforms to a larger ionic radius such as Ce3+ [42]. Furthermore, Diehm et al. discussed that the reason for a lattice expansion is due to the surface stress of the nanoparticle [43]. The data on lattice expansion on the CeO2 is quite contradictory, while the majority of the data shows a 0.1% to 0.5% lattice expansion [9], Tsunekawa et al. [42] and Wu et al. [44] showed a 2.5% to 3.5% lattice expansion. However, the data published by Hailstone et al. suggested a 7% lattice expansion on CeO2, while the theoretical work done by Sayle et al. [45] discusses the possibility of a 10% reduction on the lattice parameter. The experimental study conducted by Wang et al. [46] on the CeO2 nanoparticles obtained from the hydrothermal process did not show any significant difference in the lattice parameters. We observed a 0.653% lattice expansion in the most stable (111) plane of the CeO2 crystal. As shown in Table 5, we have observed a considerable expansion in the primary axis of the unit cell of Ce2O3 nanoparticle while the distance between the two cerium atoms on the same plane is reduced by 0.262%. A similar expansion was observed in the distance between two consecutive cerium atoms on the same plane of Ce11O20 nanoparticles, but we have observed a 6.298% reduction in the primary axis of the unit cell of Ce7O12 nanoparticle from that of the theoretical value of the bulk. The distance between two consecutive cerium atoms on the same plane of Ce7O12 nanoparticle was reduced as well by 0.262%. We believe the reduction is due to the coexistence of both Ce3+ and Ce4+ phases due to oxygen vacancy. The literature only discussed the lattice expansion of ceria nanoparticles in the form of CeO2 nanocrystal to its reduced state, and our data are comparable to the majority of the published data on the lattice expansion [9]. There are no data on the literature on the lattice change in Ce7O12 and Ce11O20, nanoparticles for comparison.

4. Conclusions

We have successfully synthesized nanoceria with varied ratios of Ce3+/Ce4+ ratios using a soluble borate glass. Although the glass-melting temperature variations changed the Ce3+/Ce4+ ratios, the duration of melting did not contribute to any significant change. When a specific glass composition with identified Ce3+/Ce4+ ratio was dissolved in DI water, extracted nanoceria maintained the same ratio of Ce3+/Ce4+ as that of the initial glass. The incubation times in DI water had no significant change in the ratios, and neither did the speed of centrifugation. The extracted nanoceria exhibited multivalency and the three phases, Ce2O3, Ce7O12, and Ce11O20, contributed to the Ce3+ content within the nanoceria. Furthermore, we have observed a Ce3O5 phase that has been identified as the quasi-stable state in the extracted nanoceria. Lastly, we have confirmed that the Ce3+/Ce4+ ratio of the nanoceria embedded in the glass remained unchanged even after a year of melting.

5. Patents

US and International Patent-065848.0030PCT1, Ranasinghe, K.S, Singh, R., Disclosure of the invention: Multivalent Cerium oxide Nanoparticles in Soluble Borate Glass Matrix for Targeted Release. (April 2020).

Supplementary Materials

The following supporting information can be downloaded at: https://www.mdpi.com/article/10.3390/nano12142363/s1, Figure S1: Spectra obtained from the MCR procedure using different combinations of reference spectra as starting solutions. (left) spectra obtained from the MCR fitting when both spectral components are allowed to vary freely. (right) spectra obtained from the MCR fitting when Ce4+ spectra are fixed; Figure S2: Comparison between the data and the MCR fit using CeO2 and CeF3 spectra as starting solutions. Similar fits were obtained for other starting solution sets; Figure S3: Comparison between the Ce3+/Ce4+ fractions for the sample series was obtained using different starting solutions. Dashed and solid lines correspond to fractions of Ce3+ and Ce4+, respectively

Author Contributions

Conceptualization, K.S.R., R.S. and D.L.; methodology, K.S.R., R.S., D.L., E.S. and A.V.; software, K.S.R., R.S., E.S. and D.L.; validation, K.S.R., R.S., E.S. and D.L.; formal analysis, K.S.R., E.S., D.L., I.F. and A.V.; investigation, K.S.R., R.S., D.L., A.V. and I.F.; resources, K.S.R. and R.S.; data curation, K.S.R.; writing—original draft preparation, K.S.R.; writing—review and editing, K.S.R., R.S., D.L., E.S. and A.V.; visualization, K.S.R.; supervision, K.S.R.; project administration, K.S.R. and R.S.; funding acquisition, K.S.R. and E.S. All authors have read and agreed to the published version of the manuscript.

Funding

This research received no external funding, but this research used Inner Shell Spectroscopy beamline (8-ID) of the National Synchrotron Light Source II, a U.S. Department of Energy (DOE) Office of Science User Facility operated for the DOE Office of Science by Brookhaven National Laboratory under Contract No. DE-SC0012704.

Institutional Review Board Statement

Not applicable.

Informed Consent Statement

Not applicable.

Data Availability Statement

No data reported other than what presented.

Acknowledgments

The authors acknowledge Kennesaw State University for providing the internal funds and support and the resources provided by the Brookhaven National Laboratory.

Conflicts of Interest

The authors declare no conflict of interest. The funders had no role in the design of the study; in the collection, analyses, or interpretation of data; in the writing of the manuscript, or in the decision to publish the results.

References

  1. Cicconi, M.R.; Neuville, D.R.; Blanc, W.; Lupi, J.-F.; Vermillac, M.; de Ligny, D. Cerium/aluminum correlation in aluminosilicate glasses and optical silica fiber preforms. J. Non-Cryst. Solids 2017, 475, 85–95. [Google Scholar] [CrossRef] [Green Version]
  2. Dey, S.; Dhal, G.C. Cerium catalysts applications in carbon monoxide oxidations. Mater. Sci. Energy Technol. 2020, 3, 6–24. [Google Scholar] [CrossRef]
  3. Pandiyan, A.; Uthayakumar, A.; Subrayan, R.; Cha, S.W.; Moorthy, S.B.K. Review of solid oxide electrolysis cells: A clean energy strategy for hydrogen generation. Nanomater. Energy 2019, 8, 2–22. [Google Scholar] [CrossRef]
  4. Kwon, K.; Lee, K.H.; Jin, S.; You, D.J.; Pak, C. Ceria-promoted oxygen reduction reaction in Pd-based electrocatalysts. Electrochem. Commun. 2011, 13, 1067–1069. [Google Scholar] [CrossRef]
  5. Jing, Y.; Zhou, X.; Lund, P.; Chen, C.; Fan, L. Electrochemical impact of the carbonate in ceria-carbonate composite for low temperature solid oxide fuel cell. Int. J. Hydrogen Energy 2021, 46, 9898–9904. [Google Scholar] [CrossRef]
  6. Agnihotri, R.; Oommen, C. Impact of HAN Ternary Propellant System Decomposition on Catalytic Sustainability. Propellants Explos. Pyrotech. 2021, 46, 440–449. [Google Scholar] [CrossRef]
  7. Jia, M.; Wen, J.; Luo, W.; Dong, Y.; Pang, F.; Chen, Z.; Peng, G.; Wang, T. Improved scintillating properties in Ce:YAG derived silica fiber with the reduction from Ce4 + to Ce3+ ions. J. Lumin. 2020, 221, 117063. [Google Scholar] [CrossRef]
  8. Rittisut, W.; Wantana, N.; Butburee, A.; Ruangtaweep, Y.; Padchasri, J.; Rujirawat, S.; Manyum, P.; Kidkhunthod, P.; Yimnirun, R.; Kothan, S.; et al. Luminescence properties of Ce3+- doped borate scintillating glass for new radiation detection material. Radiat. Phys. Chem. 2021, 185, 109498. [Google Scholar] [CrossRef]
  9. Sun, X.; Liu, X.; Xiao, Z.; Jiang, D.; Wang, W.; Wen, Y.; Yang, Q.; Kang, Z. Enhancement of emission intensity in Ce3+-activated aluminoborosilicate scintillating glass synthesized in air. J. Am. Ceram. Soc. 2020, 103, 768–772. [Google Scholar] [CrossRef]
  10. Zhang, L.; Dai, J.; Li, Y.; Sun, S.; Li, H.; Wang, J.; Jing, F.; Gao, C. Photodarkening Properties of Typical Ytterbium Doped Silica Fiber. In Proceedings of the 14th Pacific Rim Conference on Lasers and Electro-Optics (CLEO PR 2020), Sydney, Australia, 3–5 August 2020; p. P2_33. [Google Scholar] [CrossRef]
  11. Gökçe, M.; Burgaz, G.; Gökçe, A.G. Cerium doped glasses containing reducing agent for enhanced luminescence. J. Lumin. 2020, 222, 117175. [Google Scholar] [CrossRef]
  12. Środa, M.; Świontek, S.; Gieszczyk, W.; Bilski, P. The effect of CeO2 on the thermal stability, structure and thermoluminescence and optically stimulated luminescence properties of barium borate glass. J. Non-Cryst. Solids 2019, 517, 61–69. [Google Scholar] [CrossRef]
  13. Xu, C.; Qu, X. Cerium oxide nanoparticle: A remarkably versatile rare earth nanomaterial for biological applications. NPG Asia Mater. 2014, 6, e90. [Google Scholar] [CrossRef]
  14. Lu, B.; Zhu, D.; Yin, J.; Xu, H.; Zhang, C.; Ke, Q.; Gao, Y.; Guo, Y. Incorporation of cerium oxide in hollow mesoporous bioglass scaffolds for enhanced bone regeneration by activating the ERK signaling pathway. Biofabrication 2019, 11, 025012. [Google Scholar] [CrossRef]
  15. Saatchi, A.; Arani, A.R.; Moghanian, A.; Mozafari, M. Synthesis and characterization of electrospun cerium-doped bioactive glass/chitosan/polyethylene oxide composite scaffolds for tissue engineering applications. Ceram. Int. 2021, 47, 260–271. [Google Scholar] [CrossRef]
  16. Westhauser, F.; Rehde, F.; Decker, S.; Kunisch, E.; Moghaddam, A.; Zheng, K.; Boccaccini, A.R. Ionic dissolution products of Cerium-doped bioactive glass nanoparticles promote cellular osteogenic differentiation and extracellular matrix formation of human bone marrow derived mesenchymal stromal cells. Biomed. Mater. 2021, 16, 035028. [Google Scholar] [CrossRef] [PubMed]
  17. Sontakke, A.D.; Ueda, J.; Xu, J.; Asami, K.; Katayama, M.; Inada, Y.; Tanabe, S. A Comparison on Ce3+ Luminescence in Borate Glass and YAG Ceramic: Understanding the Role of Host’s Characteristics. J. Phys. Chem. C 2016, 120, 17683–17691. [Google Scholar] [CrossRef]
  18. Nicolini, V.; Gambuzzi, E.; Malavasi, G.; Menabue, L.; Menziani, M.C.; Lusvardi, G.; Pedone, A.; Benedetti, F.; Luches, P.; D’Addato, S.; et al. Evidence of Catalase Mimetic Activity in Ce3+/Ce4+ Doped Bioactive Glasses. J. Phys. Chem. B 2015, 119, 4009–4019. [Google Scholar] [CrossRef]
  19. Kargozar, S.; Baino, F.; Hoseini, S.J.; Hamzehlou, S.; Darroudi, M.; Verdi, J.; Hasanzadeh, L.; Kim, H.-W.; Mozafari, M. Biomedical applications of nanoceria: New roles for an old player. Nanomedicine 2018, 13, 3051–3069. [Google Scholar] [CrossRef]
  20. Ranasinghe, K.S.; Singh, R.; Day, D.E.; Attenkofer, K.; Stavitski, E.; Quinn, L.A.; Patterson, D.; Duenas, A. Evidence of the coexistence of multivalence cerium oxide nano-particles in a sodium borate glass. J. Non-Cryst. Solids 2019, 515, 75–81. [Google Scholar] [CrossRef]
  21. Camp, C.H. pyMCR: A Python Library for MultivariateCurve Resolution Analysis with Alternating Regression (MCR-AR). J. Res. Natl. Inst. Stand. Technol. 2019, 124, 1–10. [Google Scholar] [CrossRef]
  22. Darab, J.G.; Li, H.; Vienna, J.D. X-ray absorption spectroscopic investigation of the environment of cerium in glasses based on complex cerium alkali borosilicate compositions. J. Non-Cryst. Solids 1998, 226, 162–174. [Google Scholar] [CrossRef]
  23. Schelter, E.J. Cerium under the lens. Nat. Chem. 2013, 5, 348. [Google Scholar] [CrossRef]
  24. Kümmerle, E.A.; Heger, G. The Structures of C–Ce2O3+δ, Ce7O12, and Ce11O20. J. Solid State Chem. 1999, 147, 485–500. [Google Scholar] [CrossRef]
  25. Zachariasen, W. Die Kristallstruktur der A-Modifikation von den Sesquioxyden der seltenen Erdmetalle. (La2O3 Ce2O3, Pr2O3, Nd2O3). Z. Für Phys. Chem. 1926, 123U, 134–150. [Google Scholar] [CrossRef]
  26. Artini, C.; Pani, M.; Carnasciali, M.M.; Buscaglia, M.T.; Plaisier, J.R.; Costa, G.A. Structural Features of Sm- and Gd-Doped Ceria Studied by Synchrotron X-ray Diffraction and μ-Raman Spectroscopy. Inorg. Chem. 2015, 54, 4126–4137. [Google Scholar] [CrossRef] [PubMed]
  27. Artini, C.; Costa, G.A.; Pani, M.; Lausi, A.; Plaisier, J. Structural characterization of the CeO2/Gd2O3 mixed system by synchrotron X-ray diffraction. J. Solid State Chem. 2012, 190, 24–28. [Google Scholar] [CrossRef]
  28. Nikolenko, A.; Strelchuk, V.; Gnatyuk, O.; Kraszkiewicz, P.; Boiko, V.; Kovalska, E.; Mista, W.; Klimkiewicz, R.; Karbivskii, V.; Dovbeshko, G. In situ Raman study of laser-induced stabilization of reduced nanoceria (CeO2−x) supported on graphene. J. Raman Spectrosc. 2019, 50, 490–498. [Google Scholar] [CrossRef]
  29. Patil, S.; Dasari, H.P. Effect of fuel and solvent on soot oxidation activity of ceria nanoparticles synthesized by solution combustion method. Mater. Sci. Energy Technol. 2019, 2, 485–489. [Google Scholar] [CrossRef]
  30. Trenque, I.; Magnano, G.C.; Bolzinger, M.A.; Roiban, L.; Chaput, F.; Pitault, I.; Briançon, S.; Devers, T.; Masenelli-Varlot, K.; Bugnet, M.; et al. Shape-selective synthesis of nanoceria for degradation of paraoxon as a chemical warfare simulant. Phys. Chem. Chem. Phys. 2019, 21, 5455–5465. [Google Scholar] [CrossRef]
  31. Olbrich, R.; Murgida, G.E.; Ferrari, V.; Barth, C.; Llois, A.M.; Reichling, M.; Ganduglia-Pirovano, M.V. Surface Stabilizes Ceria in Unexpected Stoichiometry. J. Phys. Chem. C 2017, 121, 6844–6851. [Google Scholar] [CrossRef] [Green Version]
  32. Bekheet, M.F.; Grünbacher, M.; Schlicker, L.; Gili, A.; Doran, A.; Epping, J.D.; Gurlo, A.; Klötzer, B.; Penner, S. On the structural stability of crystalline ceria phases in undoped and acceptor-doped ceria materials under in situ reduction conditions. CrystEngComm 2019, 21, 145–154. [Google Scholar] [CrossRef] [Green Version]
  33. Murgida, G.E.; Ferrari, V.; Llois, A.M.; Ganduglia-Pirovano, M.V. Reduced CeO2 (111) ordered phases as bulk terminations: Introducing the structure of Ce3O5. Phys. Rev. Mater. 2018, 2, 083609. [Google Scholar] [CrossRef] [Green Version]
  34. Xu, Y.; Mofarah, S.S.; Mehmood, R.; Cazorla, C.; Koshy, P.; Sorrell, C.C. Design strategies for ceria nanomaterials: Untangling key mechanistic concepts. Mater. Horiz. 2021, 8, 102–123. [Google Scholar] [CrossRef] [PubMed]
  35. Zhang, F.; Chan, S.-W.; Spanier, J.E.; Apak, E.; Jin, Q.; Robinson, R.D.; Herman, I.P. Cerium oxide nanoparticles: Size-selective formation and structure analysis. Appl. Phys. Lett. 2002, 80, 127–129. [Google Scholar] [CrossRef] [Green Version]
  36. Kurian, M.; Kunjachan, C. Investigation of size dependency on lattice strain of nanoceria particles synthesised by wet chemical methods. Int. Nano Lett. 2014, 4, 73–80. [Google Scholar] [CrossRef] [Green Version]
  37. Chen, L.; Fleming, P.; Morris, V.; Holmes, J.D.; Morris, M.A. Size-Related Lattice Parameter Changes and Surface Defects in Ceria Nanocrystals. J. Phys. Chem. C 2010, 114, 12909–12919. [Google Scholar] [CrossRef]
  38. Prieur, D.; Bonani, W.; Popa, K.; Walter, O.; Kriegsman, K.W.; Engelhard, M.H.; Guo, X.; Eloirdi, R.; Gouder, T.; Beck, A.; et al. Size Dependence of Lattice Parameter and Electronic Structure in CeO2 Nanoparticles. Inorg. Chem. 2020, 59, 5760–5767. [Google Scholar] [CrossRef] [PubMed]
  39. Hailstone, R.K.; DiFrancesco, A.G.; Leong, J.G.; Allston, T.D.; Reed, K.J. A Study of Lattice Expansion in CeO2 Nanoparticles by Transmission Electron Microscopy. J. Phys. Chem. C 2009, 113, 15155–15159. [Google Scholar] [CrossRef]
  40. Baranchikov, A.E.; Polezhaeva, O.S.; Ivanov, V.K.; Tretyakov, Y.D. Lattice expansion and oxygen non-stoichiometry of nanocrystalline ceria. CrystEngComm 2010, 12, 3531–3533. [Google Scholar] [CrossRef]
  41. Da Silva, J.L.F. Stability of the Ce2O3 phases: ADFT + Uinvestigation. Phys. Rev. B 2007, 76, 193108. [Google Scholar] [CrossRef]
  42. Tsunekawa, S.; Ishikawa, K.; Li, Z.-Q.; Kawazoe, Y.; Kasuya, A. Erratum: Origin of Anomalous Lattice Expansion in Oxide Nanoparticles [Phys. Rev. Lett. 85, 3440 (2000)]. Phys. Rev. Lett. 2002, 89, 249905. [Google Scholar] [CrossRef]
  43. Diehm, P.M.; Ágoston, P.; Albe, K. Size-Dependent Lattice Expansion in Nanoparticles: Reality or Anomaly? ChemPhysChem 2012, 13, 2443–2454. [Google Scholar] [CrossRef]
  44. Wu, L.; Wiesmann, H.J.; Moodenbaugh, A.R.; Klie, R.F.; Zhu, Y.; Welch, D.O.; Suenaga, M. Oxidation state and lattice expansion of CeO2−x nanoparticles as a function of particle size. Phys. Rev. B 2004, 69, 125415. [Google Scholar] [CrossRef]
  45. Sayle, T.X.T.; Parker, S.C.; Sayle, D.C. Shape of CeO2 nanoparticles using simulated amorphisation and recrystallisation. Chem. Commun. 2004, 2438–2439. [Google Scholar] [CrossRef] [PubMed]
  46. Wang, Z.L.; Feng, X. Polyhedral Shapes of CeO2 Nanoparticles. J. Phys. Chem. B 2003, 107, 13563–13566. [Google Scholar] [CrossRef] [Green Version]
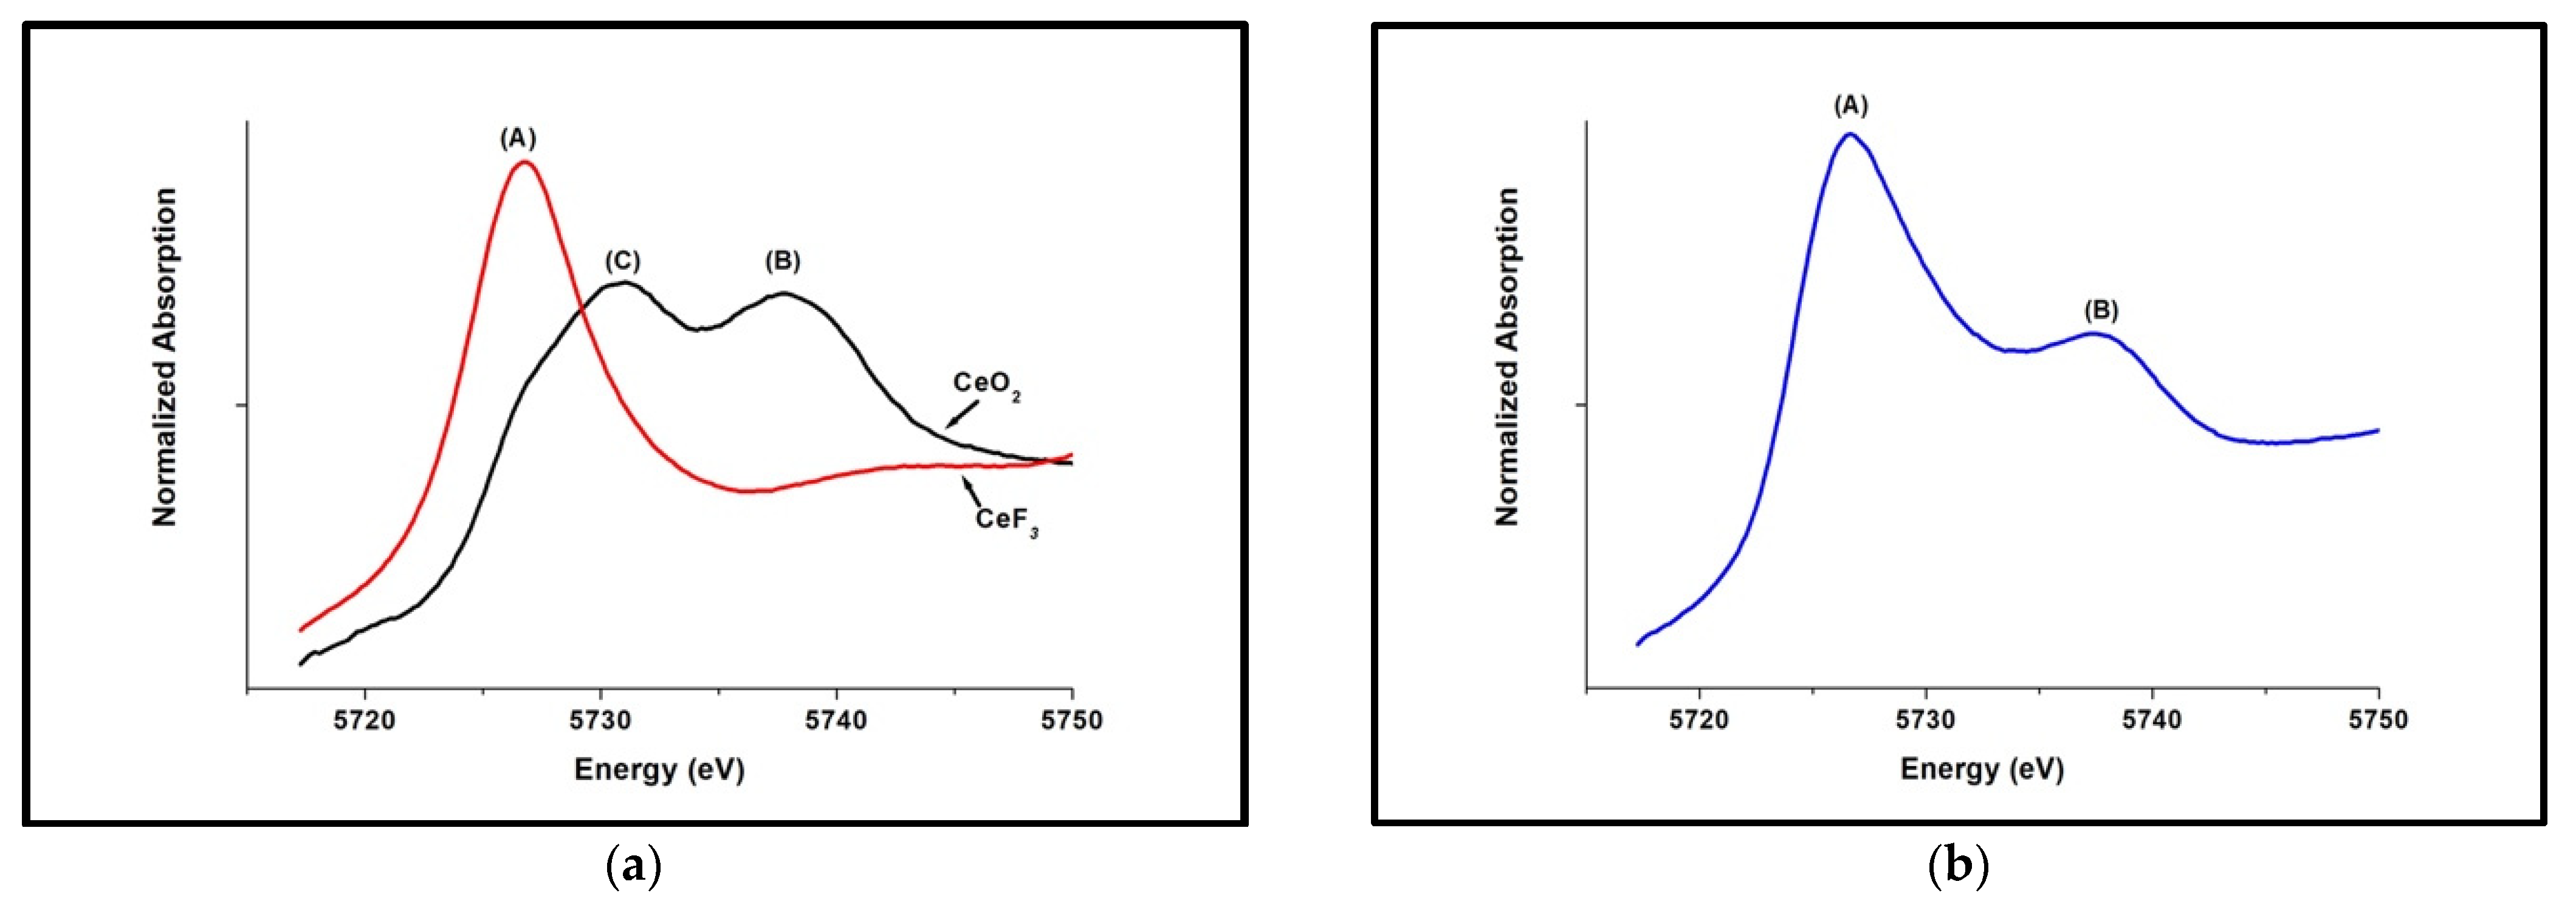
Figure 1. XANES spectrum for (a) standards of Ce(IV) and Ce(III) compounds, (b) Na2O·2B2O3 glass melted with 0.05 mols of CeO2.
Nanomaterials 12 02363 g001
Figure 2. XANES spectrum for S5NBCe glass melted for different hours at 1100 °C.
Nanomaterials 12 02363 g002
Figure 3. The Ce3+/Ce4+ of nanoceria extracted at 1500 rcf, 14,000 rcf, and no centrifuging from S5NBCe glass melted with sodium tetraborate decahydrate for 1 h at 1100 °C.
Nanomaterials 12 02363 g003
Figure 4. TEM image of nanoceria extracted from S5NBCe4 glass by dissolving in DI water for two hours. The marked crystals and their width is shown in the figure.
Nanomaterials 12 02363 g004
Figure 5. Schematic diagram of (a) cubic fluorite structure of CeO2, (b) hexagonal Ce2O3 structure, (c) rhombohedral Ce7O12, and (d) cubic body-centered structure of Ce11O20 larger cerium atoms are shown in green, while the smaller oxygen atoms are shown in red.
Nanomaterials 12 02363 g005
Figure 6. TEM image of the nanoceria obtained from the dissolution of S5NBCe glass with (a) the (100) plane of cubic CeO2, (b) the (111) pane of cubic CeO2.
Nanomaterials 12 02363 g006
Figure 7. (a) TEM image of Ce2O3 nanoceria obtained from the dissolution of S5NBCe glass (b) the schematic diagram of A-type Ce2O3.
Nanomaterials 12 02363 g007
Figure 8. (a) TEM image from the dissolution of S5NBCe glass and the schematic diagram of Ce7O12 (b) cross-section of a (101) plane (c) rhombic unit cell.
Nanomaterials 12 02363 g008
Figure 9. (a) TEM image of Ce11O20 nanoceria crystal (b) schematics diagram of the unit cell of Ce11O20.
Nanomaterials 12 02363 g009
Figure 10. Schematics diagrams of (a) FCC structure of CeO1.66 and (b) schematics lattice structure of CeO1.66.
Nanomaterials 12 02363 g010
Table 1. Composition/Identification for glasses Na2O·2B2O3 1 doped with different amounts of CeO2.
SampleCeO2 ConcentrationMelting TemperatureMelting Time
S1NBCe0.01 mol1100 °C1 h
S2NBCe0.02 mol1100 °C1 h
S3NBCe0.03 mol1100 °C1 h
S4NBCe0.04 mol1100 °C1 h
S5NBCe0.05 mol1100 °C1 h
S6NBCe0.06 mol1100 °C1 h
1 All the samples were melted in air atmosphere with raw materials Na2CO3 and B2O3 to obtain Na2O·2B2O3 glass.
Table 2. The concentrations of Ce3+ and Ce3+/Ce4+ ratio within the processed glasses Na2O·2B2O3 1 melted with different amounts of CeO2.
SampleCeO2 molsCe3+/ΣCe (±0.09) 2Ce3+/Ce4+
S1NBCe0.010.712.41 ± 0.80
S2NBCe0.020.611.55 ± 0.42
S3NBCe0.030.611.55 ± 0.42
S4NBCe0.040.420.72 ± 0.19
S5NBCe0.050.581.38 ± 0.37
S6NBCe0.060.631.72 ± 0.49
1 All the samples were melted in air atmosphere at 1100 °C for one hour and doped with Ce (IV) O2. 2 The XANES data were rounded to two decimals as the MCR data have ±0.09 error with a 95% confidence level.
Table 3. The concentrations of Ce3+ with different melting times at different temperatures for S5NBCe glass melted with sodium tetraborate decahydrate.
Melted Time (h)Ce3+ /∑Ce (±0.09)
(1100 °C)
Ce3+ /∑Ce (±0.09)
(1200 °C)
Ce3+ /∑Ce (±0.09)
(1300 °C)
10.620.770.87
30.700.790.87
50.690.800.87
80.680.800.88
120.690.78-
150.6680.800.88
180.69--
Table 4. The concentrations of Ce3+ and Ce3+/Ce4+ ratio within the processed glasses Na2O·2B2O3 melted with different melting variables.
SampleCerium SourceConcentration (mol)TemperatureTimeFurnace AtmosphereCe3+ /∑Ce (±0.09)
S1NBCeCe(IV)O20.011000 °C1 hair0.90
S1NBCeCe(IV)O20.011100 °C1 hair0.70
S1NBCeCe(IV)O20.011200 °C1 hair0.93
S1NBCeCe(IV)O20.011100 °C2 hair0.70
S1NBCeCe(IV)O20.011100 °C3 hair0.70
S5NBCeCe(IV)O20.051100 °C1 hDry air0.64
S5NBCeCe(IV)O20.051100 °C1 hAr0.68
S5NBCeCe(IV)O20.051100 °C1 hN20.84
S5NBCeCe(NO3)30.051100 °C1 hair0.77
S5NBCeCe(SO4)20.051100 °C1 hair0.56
S5NBCeCe(IV)O20.051100 °C1 hair0.57
S5NBCe *Ce(IV)O20.051100 °C1 hair0.58
* S5NBCe * was melted and kept under a desiccator for one year.
Table 5. The Ce lattice distance of nanoceria extracted from S6NBCe4 glass compared with the theoretical values.
NanocrystalCe-Ce Lattice Distance Measured (Å)Ce-Ce Theoretical Lattice Distance (Å)Lattice Expansion
CeO2(3.85 ± 0.06)3.825 [26]+0.653%
Ce2O3(3.76 ± 0.04) and (6.31 ± 0.07)3.77 and 6.06 [25]−0.398% and +4.175%
Ce7O12(6.35 ± 0.08) and 3.80 ± 0.09)6.78 and 3.812 [24]−6.298% and −0.262%
Ce11O20(3.73 ± 0.01)3.717 [24]+0.215%
Publisher’s Note: MDPI stays neutral with regard to jurisdictional claims in published maps and institutional affiliations.