
A Review on Carbon Dots: Synthesis, Characterization and Its Application in Optical Sensor for Environmental Monitoring


 , ,
, ,
Abstract
:1. Introduction
2. CDs Synthesized from Green Precursors
2.1. Fruits
2.2. Vegetables
2.3. Flowers
2.4. Leaves, Seeds, and Stems
2.5. Crop Residues
2.6. Fungi/Bacteria Species
2.7. Waste Products
3. CDs Synthesized from Chemical Precursors
3.1. Acid Reagents

| Precursor | Technique | Properties | Year | Reference | |||
|---|---|---|---|---|---|---|---|
| Carbon Source | Passivation/Solvent | Particle Size | Fluorescence | Quantum Yield | |||
| Citric acid | Terbium (III) nitrate pentahydrate | Carbonization | TEM- 3 nm | λem- 450 nm λex- 320 nm | - | 2012 | [112] |
| Citric acid monohydrate | L-cysteine | Hydrothermal treatment | HRTEM- 7 nm | λem- 415 nm λex- 345 nm | 73% | 2013 | [113] |
| - | - | λem- 435 nm λex- 345 nm | 5.3% | ||||
| Glycine | - | λem- 415 nm λex- 345 nm | 16.9% | ||||
| Citric acid | Urea | Microwave | TEM- 4 to 6 nm | λem- 460 nm λex- 360 nm | 0.13% | 2013 | [114] |
| Ethyleneglycol bis-(2-aminoethyl ether)- N,N,N′,N′-tetraacetic acid | Tris(hydroxymethyl)aminomethane | Thermal carbonization | TEM- 5 nm | λem- 425 nm λex- 310 nm | 28% | 2014 | [115] |
| Citric acid | PEG-diamine | Solid-phase | TEM- 1.7 nm | λem- 435 nm λex- 360 nm | 31% | 2014 | [116] |
| Citric acid | Poly(ethylenimine) | Pyrolysis | HRTEM- 3.5–4.5 nm | - | 42.5% | 2014 | [117] |
| Folic acid | Ethylene glycol and nanopure water | Hydrothermal | TEM- 4.5 nm | λem- 470 nm λex- 395 nm | 15.7% | 2014 | [118] |
| Poly(ethylene glycol) and ascorbic acid | Distilled water | Microwave | TEM- 2.3 nm | λem- 450 nm λex- 373 nm | - | 2014 | [119] |
| Citric acid | Ethylenediamine | Microwave-assisted pyrolysis | TEM- 3 nm | λem- 455 nm λex- 280 nm | - | 2015 | [120] |
| Citric acid | L-Tyrosine methyl ester hydrochloride | Hydrothermal | TEM- 3.7 nm | λem- 433 nm λex- 348 nm | 3.8% | 2015 | [121] |
| Citric acid | Ethylenediamine and double distilled water | Hydrothermal | - | - | 75.0% | 2015 | [122] |
| Citric acid | 1-Aminopropyl-3-methy-imidazolium bromide | Pyrolysis | HRTEM- 0.6–1.6 nm | λem- 440 nm λex- 380 nm | 2.03–27.66% | 2015 | [123] |
| Glacial acetic acid | N-Acetyl-L-cysteine, diphosphorus pentoxide and distilled deionized water | Simple mixing | TEM- 2.51–3.44 nm | λem- 480 nm λex- 300 nm | 4.65% | 2015 | [124] |
| Citric acid | L-cysteine, urea and ultrapure water | Microwave | TEM- 1.1 nm | λem- 450 nm λex- 353 nm | 25.2% | 2015 | [125] |
| Citric acid | Dithiooxamide and distilled water | Microwave-assisted hydrothermal | STEM- 2 nm | λem- 448 nm λex- 360 nm | 17.6% | 2015 | [126] |
| Citric acid monohydrate | Ammonia and double distilled water | Hydrothermal | TEM- 3.7 nm | λem- 442 nm λex- 350 nm | 40.5% | 2015 | [127] |
| Sodium citrate | Urea and ultrapure water | Electrochemical carbonization | TEM- 2.4 nm | λem- 433 nm λex- 351 nm | 11.9% | 2015 | [128] |
| Citric acid anhydrous | Ethelendiamine | Condensation carbonization | TEM- 3.9 nm | λem- 445 nm λex- 365 nm | 69.3% | 2015 | [129] |
| Diethylenetriamine | TEM- 3.7 nm | 68% | |||||
| Tetraethylenepentamine | TEM- 4.1 nm | 33.4% | |||||
| Citric acid anhydrous | Ethylenediamine and deionized water | Hydrothermal | - | λem- 440 nm λex- 320 nm | 53% | 2016 | [130] |
| Hexamethylenetetramine and deionized water | λem- 420 nm λex- 320 nm | 17% | |||||
| Triethanol-amine and deionized water | λem- 420 nm λex- 320 nm | 7% | |||||
| Citric acid | Ethylenediamine and deionized water | Hydrothermal | TEM- 5 to 7 nm | λem- 443 nm λex- 365 nm | - | 2016 | [131] |
| Citric acid | Branched polyethylenimine | Condensation | DLS- 1.9 nm | λem- 450 nm λex- 350 nm | - | 2016 | [132] |
| Citric acid | Diethylenetriamine | Reflux treatment | TEM- 5 -7 nm | - | 82.40% | 2016 | [133] |
| Ascorbic acid and valine | Ethanol and distilled water | Hydrothermal | TEM- 4 nm | λem- 430 nm λex- 352 nm | 4.8% | 2016 | [134] |
| L-glutamic acid | Silica gel powders and water | Microwave | TEM- 1.64 nm | λem- 450 nm λex- 370 nm | 41.2% | 2016 | [135] |
| Malonic acid | Urea and ultrapure water | Hydrothermal | TEM- 2.5 nm | λem- 397 nm λex- 320 nm | 12.6% | 2017 | [136] |
| Sucrose and phosphoric acid | Sodium hydroxide | Carbonization | SEM- 10 nm | λem- 524 nm λex- 423 nm | - | 2017 | [137] |
| Citric acid | Sodium phosphate | Solid-phase | TEM- 1.7 nm | λem- 435 nm λex- 360 nm | - | 2017 | [138] |
| Citric acid | Ethylenediamine and ultrapure water | Hydrothermal | TEM- <10 nm | λem- 431 nm λex- 337 nm | 32.25% | 2017 | [139] |
| Citric acid monohydrate | Thiourea | Microwave solid-phase pyrolysis | TEM- 2 nm | λem- 436 nm λex- 358 nm | 23.6% | 2017 | [140] |
| Citric acid | Silk | Hydrothermal | TEM- 5.6 nm | λem- 425 nm λex- 360 nm | 61.1% | 2017 | [141] |
| Citric acid | Melamine | Hydrothermal | TEM- 1.8 nm | λem- 422 nm λex- 320 nm | 8.11% | 2017 | [142] |
| Citric acid | Tartaric acid, ethanediamine and oleic acid | Solvothermal | TEM- 2.66 nm | λem- 460 nm λex- 360 nm | 42.2% | 2017 | [143] |
| Citric acid and urea | Water | Solvothermal | TEM- 1.7 nm | λem- 448–638 nm λex- 375 nm | - | 2017 | [144] |
| Glycerol | TEM- 2.8 nm | ||||||
| Dimethylformamide | TEM- 4.5 nm | ||||||
| Maleic anhy- dride and tetraethylenepentamine | Sulfuric acid and deionized water | Pyrolysis | TEM- 20 nm DLS- 8 nm | λem- 450 nm λex- 360 nm | 21% | 2017 | [145] |
| D-(+)-maltose monohydrate, boric acid and thiocarbamide | - | Hydrothermal | TEM- 2.0 nm | λem- 415 nm λex- 326 nm | 8.9% | 2017 | [146] |
| Pyrogallic acid | N-N-dumethylformamide | Solvothermal | TEM- 11.9 nm | λem- 520 nm λex- 360–450 nm | 16.8% | 2018 | [147] |
| L-histidine and citric acid | Ethylene glycol | Polyol microwave | TEM- 19 nm | λem- 430–511 nm λex- 350 nm | - | 2018 | [148] |
| Phthalic acid and triethylenediamine hexahydrate | Deionized water | Microwave | TEM- 2–6 nm | λem- 520–542 nm λex- 360–440 nm | 16.1% | 2018 | [149] |
| Citric acid | Urea | Solvothermal | TEM- 1.87 nm | λem- 590 nm λex- 540 nm | 43% | 2018 | [150] |
| Citric acid | Lysine and ultrapure water | Hydrothermal | TEM- 10 nm | - | - | 2018 | [151] |
| Citric acid monohydrate | - | Thermal treatment | TEM- 3.5 nm | λem- 450 nm λex- 360 nm | 3.54% | 2018 | [152] |
| Citric acid | Ammonium thiocyanate and deionized water | Microwave-assisted | HRTEM- 30 nm | λem- 490 nm λex- 410 nm | - | 2018 | [153] |
| Folic acid and p-phenylenediamine | Sodium hydroxide | Hydrothermal | TEM- 2 nm | λem- 505 nm λex- 420 nm | 8.4% | 2018 | [154] |
| 3-Aminobenzeneboronic acid | Deionized water | Hydrothermal | TEM- 3 nm | λem- 504 nm λex- 400 nm | - | 2018 | [155] |
| Succinic acid | Deionized water and glycerol | Hydrothermal | TEM- 2.3 nm | λem- 410 nm λex- 280 nm | 11% | 2018 | [156] |
| TEM- 4.6 nm | λem- 525 nm λex- 480 nm | 7% | |||||
| Phosphoric acid | Ethylenediamine | Simple heating (180 °C, 2 h) | TEM- 3.2 nm | λem- 430 nm λex- 340 nm | 5.17% | 2018 | [157] |
| Simple heating (280 °C, 2 h) | TEM- 6.4 nm | λem- 413 nm λex- 340 nm | 21.8% | ||||
| Phosphoric acid and ethanolamine | Water | Microwave irradiation | TEM- 3.4 nm | λem- 417 nm λex- 340 nm | 20.52% | 2018 | [158] |
| P-aminosalicylic acid | Ethyleneglycol dimethacrylate and double distilled water | Hydrothermal | TEM- 3 nm AFM- 1.6 nm DLS- 11.7 nm | λem- 520 nm λex- 390 nm | 27.2% | 2018 | [159] |
| Sodium citrate | Urea and dimethylformamide | Solvothermal | TEM- 3.52 nm | λem- 446 nm λex- 370 nm | 67% | 2018 | [160] |
| Citric acid monohydrate | 3-(Aminopro- pyl)triethoxysilane (APTES) | Thermal decomposition | TEM- 5–15 nm | λem- 416 and 480 nm | - | 2019 | [161] |
| Citric acid | Urea and deionized water | Hydrothermal | - | - | - | 2019 | [162] |
| Glycine and deionized water | - | ||||||
| Citric acid, deionized water, ethylene glycol, N,N’- bis(2-aminoethyl)-1,3-propanediamine | HRTEM- 5–6 nm | ||||||
| Citric acid and urea | N,N-dimethylformamide | Solvothermal | - | λem- 450, 550, 630 nm λex- 400–450 nm | - | 2019 | [163] |
| N,N-dimethylformamide, NaOH and HCl | TEM- 3.7 nm | λem- 630 nm λex- 550 nm | - | ||||
| N,N-dimethylformamide, NaOH and water | TEM- 2.1 nm | - | - | ||||
| Procaine hydrochloride and citric acid | Double distilled water and ethylenediamine | Hydrothermal | TEM- 3.3 nm | λem- 440 nm λex- 360 nm | 47.1% | 2019 | [164] |
| Anhydrous citric acid | N-(β-aminoethyl)-γ-aminopropyl-methyldimethoxysilane | Hydrothermal | TEM- 2.22 nm | λem- 460 nm λex- 370 nm | 51.8% | 2019 | [165] |
| Citric acid | Thiourea and deionized water | Microwave-assisted pyrolysis | TEM- 3.3 nm | - | - | 2019 | [166] |
| Sodium citrate and aminopyrazine | Ultrapure water | Hydrothermal | TEM- 2.38 nm | λem- 389 nm λex- 310 nm | 11.8% | 2019 | [167] |
| Citric acid | Deionized water and arginine | Microwave | TEM- 11 ± 4 nm | λem- 330 nm λex- 430 nm | 3.9 ± 0.4% | 2019 | [168] |
| Deionized water and lysine | TEM- 17 ± 2 nm | λem- 330 nm λex- 430 nm | 4.2 ± 1.9% | ||||
| Deionized water and histidine | TEM- 6 ± 5 nm | λem- 330 nm λex- 433 nm | 2.8 ± 0.2% | ||||
| Deionized water and cysteine | TEM- 10 ± 7 nm | λem- 330 nm λex- 420 nm | 89.5 ± 2.3% | ||||
| Deionized water and methionine | TEM- 9 ± 5 nm | λem- 330 nm λex- 407 nm | 2.5 ± 0.6% | ||||
| Citric acid and phenylalanine | Ultrapure water | Hydrothermal | TEM- 2–3 nm | λem- 330 nm λex- 310 nm | - | 2020 | [169] |
| Polyacrylamide and citric acid | Ultrapure water | Hydrothermal | TEM- 4.1 nm | λem- 330 nm λex- 310 nm | 12.6% | 2020 | [170] |
| Citric acid and urea | - | Infrared carbonization | TEM- 5–10 nm | λem- 475 nm λex- 360 nm | 22.2% | 2020 | [171] |
| Citric acid and urea | - | Hydrothermal (180 °C, 20 min) | TEM- 2–7 nm | - | 46% 26% 4% | 2020 | [172] |
| (230 °C, 20 min) | λem- 394, 440, 523 nm λex- 350 nm | 23% 35% 36% | |||||
| Citric acid | Melamine and formaldehyde | Hydrothermal | TEM- 3.7 nm | λem- 425 nm λex- 350 nm | 63.7% | 2020 | [173] |
| Citric acid monohydrate | Urea | Microwave irradiation | TEM- 6 nm | λem- 536 and 532 nm λex- 350 nm | - | 2020 | [174] |
| Citric acid | Phenylalanine | Hydrothermal | TEM- 11.9 nm | λem- 413 nm λex- 350 nm | 65% | 2020 | [175] |
| Citric acid monohydrate | Ethylenediamine | Hydrothermal | TEM- 5–10 nm | λem- blue λex- 305–395 nm | 85.69% | 2020 | [176] |
| Citric acid | Ethylenediamine and ultrapure water | Hydrothermal | TEM- 5 nm | λem- 444 nm λex- 360 nm | - | 2020 | [177] |
| Ascorbic acid | Urea and deionized water | Microwave irradiation | TEM- 2 nm | λem- 415 nm λex- 340 nm | 7% | 2020 | [178] |
| Sodium citrate dihydrate | Urea and deionized water | Thermal pyrolysis | TEM- 2.75 nm | λem- 525 nm λex- 400 nm | 93% | 2020 | [179] |
| Citric acid and 3-aminobenzeneboronic | Dimethylformamide | Hydrothermal | HRTEM- 3.4 nm | - | - | 2020 | [180] |
| Diethylenetriamine- pentacetate acid | Ultrapure water | Carbonization | HRTEM- 2.85 nm | - | - | 2020 | [181] |
| Maleic anhydride and triethylenetetramine | Deionized water and nitric acid | Pyrolysis | TEM- 5.9 nm | λem- 400 nm λex- 320 nm | 6.3% | 2021 | [182] |
| DL-thioctic acid | Dimethylformamide, trisodium citrate dihydrate, sodium hydroxide, double deionized water | Hydrothermal | HRTEM- 2.52 nm | λem- 438 nm λex- 340 nm | - | 2021 | [183] |
| Citric acid and sulfamic acid | Polyethyleneimine | Two-step hydrothermal | TEM- 5.1 nm | λem- 460 nm λex- 355 nm | 29.1% | 2021 | [184] |
| Tartaric acid | Urea | Solid-phase thermal | TEM- 4.13 nm | λem- 537 nm λex- 460 nm | 10.5% | 2021 | [185] |
| 2-aminoterephthalic acid and polyethylene glycol | Orthophosphoric acid | Microwave-assisted pyrolysis | TEM- 3–10 nm | λem- 470 nm λex- 410 nm | 67% | 2021 | [186] |
| Citric acid | Ultrapure water and ethylenediamine | Hydrothermal | TEM- 3.1 nm | λem- 445 nm λex- 356 nm | - | 2021 | [187] |
| Citric acid | Ethylenediamine and water | Microwave | TEM- 2.3 nm | λem- 450 nm λex- 360 nm | - | 2021 | [188] |
| Trans-aconitic acid | Diethylenetriamine and distilled water | Hydrothermal | HRTEM- 2–8 nm | λem- 435 nm λex- 345 nm | 81% | 2021 | [189] |
| Dehydroabietic acid | Ethanolamine | Hydrothermal | TEM- 3.2 nm | λem- 433 nm λex- 365 nm | 10% | 2021 | [190] |
| Citric acid | L-glutamine | Hydrothermal | TEM- 3.5 nm | λem- 450 nm λex- 360 nm | - | 2021 | [191] |
| D-glutamine | TEM- 3–4 nm | ||||||
| Dithiosalicylic acid | Acetic acid and o-phenylenediamine | Solvothermal | TEM- 4.5 nm | λem- 620 nm λex- 560 nm | 4.05% | 2021 | [192] |
| Acetic acid and m-phenylenediamine | TEM- 4.0 nm | λem- 560 nm λex- 460 nm | 20.77% | ||||
| Acetic acid and p-phenylenediamine | TEM- 3.5 nm | λem- 478 nm λex- 460 nm | 1.76% | ||||
| L-cysteine and urea | Diphosphorus pentoxide and water | One-pot synthesis | TEM- 4.5 nm | λem- 445 nm λex- 362 nm | 17% | 2021 | [193] |
| Methyl cellulose and L-cysteine | Ethylenediamine | Hydrothermal | TEM-19 nm | λem- 370 nm λex- 330 nm | 12.3% | 2021 | [194] |
| Ce (NO3)3·6H2O and L-histidine | Sodium hydroxide and deionized water | One-pot hydrothermal | SEM- 46 nm | - | - | 2021 | [195] |
| Polyethylenimine and citric acid | Hot water | Microwave-assisted | STEM- 12 nm | λem- 442 nm λex- 354 nm | 54% | 2022 | [196] |
| Citric acid and urea | Ultrapure water | Solvothermal | HRTEM- 3.18 nm | λem- 470 nm λex- 330 nm | 20.1% | 2022 | [197] |
| 20 mL dimethylformamide | HRTEM- 3.25 nm | λem- 500 nm λex- 330 nm | 22.1% | ||||
| 10 mL dimethylformamide and ethanol | HRTEM- 3.47 nm | λem- 539 nm λex- 330 nm | 21.9% | ||||
| 10 mL dimethylformamide and acetic acid | HRTEM- 3.68 nm | λem- 595 nm λex- 330 nm | 24.2% | ||||
3.2. Non-Acid Reagents
| Precursor | Technique | Properties | Year | Reference | |||
|---|---|---|---|---|---|---|---|
| Carbon Source | Passivation/Solvent | Particle Size | Fluorescence | Quantum Yield | |||
| Graphite oxide | Nitric acid | Microwave-hydrothermal | TEM- 4 nm | λem- 520 nm λex- 470 nm | 2.72% | 2011 | [198] |
| Poly(ethylene glycol) | Sodium hydroxide and distilled water | Reflux method | TEM- 5 nm | λem- bright blue λex- 350 nm λem- cyan λex- 390 nm λem- yellow λex- 470 nm λem- red λex- 540 nm | - | 2013 | [199] |
| Polyethylene glycol 1500 | Serine and glycerin | Microwave pyrolysis | - | - | - | 2013 | [200] |
| 3-(3,4-dihydroxyphenyl)-L- alanine | - | Carbonization-oxidation | TEM- 3.64 nm | λem- 500 nm λex- 400 nm | 6.3% | 2013 | [201] |
| Nitric acid | TEM- 4.31 nm | λem- 475 nm λex- 360 nm | 1% | ||||
| Ethanolamine | - | Pyrolysis | TEM- 2.7 nm | λem- 450 nm λex- 365 nm | 7% | 2014 | [202] |
| Hydrogen peroxide | TEM- 8.3 nm | 10.3% | |||||
| Polyimide | - | Hydrothermal | TEM- 4 nm | λem- 490 nm λex- 365 nm | 20.9% | 2015 | [203] |
| Polyethyleneglycol bis(3-aminopropyl) | 6-Bromohexylboronic acid | Thermal carbonization | TEM- 5 nm | λem- 440 nm λex- 362 nm | 0.3% | 2015 | [204] |
| Ethanol | Hydrogen peroxide and deionized water | Hydrothermal | TEM- 4.8 nm | λem- 456 nm λex- 400 nm | 38.7% | 2015 | [205] |
| 3-Bromophenol | Ethanol and deionized water | Carbonization | TEM- 5.2 nm | λem- 440 nm λex- 367 nm | 19.6% | 2016 | [206] |
| Azidoimidizole | Ethanol | - | AFM- 5–10 nm | λem- 515 nm λex- 460 nm | - | 2016 | [207] |
| Activated carbon | Potassium permanganate, sulfuric acid, deionized water, hydrogen peroxide | Exhausted oxidation | TEM- 12 nm | λem- 465 nm λex- 350 nm | 3.94% | 2016 | [208] |
| Potassium permanganate, sulfuric acid, deionized water, hydrogen peroxide, PAMAM-NH2 | TEM- 65 nm | 6.93% | |||||
| Glucose | Water and sodium hydroxide | Ultrasonic | - | 7% | 2016 | [209] | |
| N-Methylethanolammonium thioglycolate | Water and hydrogen peroxide | HRTEM- 3–8 nm | 12.5% | ||||
| Chitosan | - | Carbonization | TEM- 1–6 nm | λem- 390 nm λex- 310 nm | 4.34% | 2016 | [210] |
| Chlorophyll | Water | Hydrothermal | DLS- 18 nm | λem- 520 nm λex- 440 nm | - | 2017 | [211] |
| Microcrystalline cellulose | Ethylenediamine | Hydrothermal | TEM- 3.2 nm | λem- 426–436 nm λex- 360 nm | 55% | 2017 | [212] |
| o-Phenylenediamine | Ethanol | Hydrothermal | TEM- 1–2 nm | λem- 400–600 nm λex- 350–500 nm | 20% | 2018 | [213] |
| Carbon paper | Nitric acid | Hydrothermal | TEM- 4.8 nm | λem- 450 nm λex- 350 nm | 5.1% | 2018 | [214] |
| Papain and PEG6000 | Ultrapure water | Hydrothermal | TEM- 2–3 nm | λem- 420 nm λex- 320 nm | 9.45% | 2018 | [215] |
| Dextrose solution | Hydrochloric acid | Mechano-chemical | TEM- 10 nm | λem- 456 nm λex- 390 nm | 40% | 2018 | [216] |
| 1,2,4,5- Benzenetetramine tetrahydrochloride | Ethanol | Solvothermal | TEM- 9.39 nm | λem- 605 nm λex- 540 nm | 30.2% | 2019 | [217] |
| 1,2,4-Benzenetriamine dihydrochloride | TEM- 8.60 nm | λem- 598 nm λex- 510 nm | 13.4% | ||||
| o-Phenylenediamine | TEM- 6.50 nm | λem- 538 nm λex- 420 nm | 16.7% | ||||
| Copper (II) chloride dihydrate | Ethanediamine | Hydrothermal | TEM- 1.8 nm | λem- 380 nm λex- 320 nm | 7.8% | 2019 | [218] |
| Glucose and taurine | Distilled water | Hydrothermal | TEM- 3 nm | λem- 410 nm λex- 340 nm | 11% | 2019 | [219] |
| Polyethylene glycol | - | Pyrolysis | DLS- 10 nm | λem- ~380 nm λex- 340 nm | 16% | 2020 | [220] |
| m-Phenylenediamine | Deionized water | Hydrothermal | TEM- 5.1 nm | λem- 420 nm λex- 340 nm | 12% | 2020 | [221] |
| Glucosamine | Ethylenediamine and water | Microwave digestion | TEM- 4.45 nm | λem- 466 nm λex- 384 nm | 25.38% | 2020 | [222] |
| Lactose | Hydrochloric acid | Hydrothermal | TEM- 7 to 8 nm | - | - | 2021 | [223] |
| Selenourea and o-phenylenediamine | Hydrochloric acid | Hydrothermal | TEM- 3 nm | λem- 625 nm λex- 564 nm | 23.6% | 2021 | [224] |
| Glutaraldehyde | Ethanol | Solvothermal | TEM- 1 nm | λem- 453 nm λex- 360 nm | - | 2021 | [225] |
| Nitrobenzaldehyde | TEM- 5 nm | λem- 421 nm λex- 360 nm | |||||
| Benzaldehyde | - | λem- 430 nm λex- 360 nm | |||||
| Diphenyl ether | p-Phenylenediamine | TEM- 2.8 nm | λem- ultraviolet λex- 285 nm | 8% | 2021 | [226] | |
| p-Phenylenediamine, dopamine and tris(hydroxymethylaminomethane) | TEM- 10–18 nm | λem- red λex- 285 nm | 15.5% | ||||
| o-Phenylenediamine | Ethanol | Two separate solutions mixed in one-pot hydrothermal | TEM- 5 nm | λem- ~570 nm λex- 430 nm | - | 2022 | [227] |
| Ammonium sulfate | Deionized water | ||||||
| Glucose | Deionized water | Hydrothermal | TEM- 8.9 nm | λem- 450 nm λex- 350 nm | - | 2022 | [228] |
| Boric acid | TEM- 6.2 nm | λem- 400 nm λex- 320 nm | |||||
| Sodium persulfate | TEM- 6.9 nm | λem- 400 nm λex- 320 nm | |||||
| Urea | TEM- 5.6 nm | λem- 450 nm λex- 390 nm | |||||
| p-Phenylenediamine and thylenediamine | Anhydrous ethanol | Hydrothermal | TEM- 2.76 nm | - | - | 2022 | [229] |
| m-Phenylenediamine | Ethanol | Solvothermal | TEM- 6.9 nm | λem- 440 nm λex- 380 nm | 11% | 2022 | [230] |
| o-Phenylenediamine | TEM- 7.8 nm | λem- 550 nm λex- 380 nm | 17% | ||||
4. Application of CD-Based Optical Sensor for Environmental Monitoring
4.1. Heavy Metal Ions
| Heavy Metal Ions | Material | Optical Sensor | Range of Detection | Limit of Detection | Linear Correlation Coefficient | Year | Reference |
|---|---|---|---|---|---|---|---|
| Hg2+ | CDs@PEG and N-acetyl-l-cysteine | Optical fibre | 0–2.69 μM | - | 0.977 | 2010 | [238] |
| Cu2+ | 0.975 | ||||||
| Hg2+ | CDs | Fluorescent | 0–5 fM | 1 fM | - | 2013 | [199] |
| Co2+ | CTAB@CDs | Chemiluminescent | 1.0–1000 nM | 0.67 nM | 0.992 | 2013 | [200] |
| Cu2+ | o-CDs/K2S2O8 | Electrochemiluminescent | 0–4 nM | - | - | 2013 | [201] |
| Fe3+ | N-CDs | Chemiluminescent | 1.0 × 10⁻⁷–1.0 × 10⁻⁶ M | 66.7 nM | 0.993 | 2014 | [117] |
| Fe3+ | N-doped CDs | Fluorescent | 0.01–500 μM | 2.5 nM | - | 2014 | [116] |
| Fe3+ | CDs | Electrochemiluminescent | 5–80 μM | 700 nM | 0.993 | 2014 | [119] |
| Hg2+ | N-CQDs | Fluorescent | 0–25 μM | 0.23 μM | 0.994 | 2014 | [118] |
| Pb2+ | CDs | Fluorescent | 0–47.62 μM | 7.49 μM | - | 2014 | [79] |
| Cu2+ | 7.78 μM | ||||||
| Al3+ | 13.38 μM | ||||||
| Ni2+ | 13.90 μM | ||||||
| Co2+ | 18.07 μM | ||||||
| Cr2+ | 23.69 μM | ||||||
| Sn2+ | 31.51 μM | ||||||
| Ca2+ | 34.79 μM | ||||||
| Hg2+ | 38.02 μM | ||||||
| Zn2+ | 69.64 μM | ||||||
| Fe3+ | CDs | Fluorescent | 0.10–10 μM | 31.5 nM | 0.9977 | 2015 | [124] |
| Hg2+ | 0.01–2.0 μM | 15.3 nM | 0.9977 | ||||
| Hg2+ | CDs | Fluorescent | 0.01–10 μM | 3.3 nM | 0.997 | 2015 | [128] |
| Hg2+ | ODN-CDs | Fluorescent | 5–200 nM | 2.6 nM | 0.974 | 2015 | [122] |
| Hg2+ | N-S-CDs | Fluorescent | 0–40 μM | 2.0 μM | 0.994 | 2015 | [125] |
| Hg2+ | N-CDs | Fluorescent | 0–8 μM | 0.087 μM | 0.9962 | 2015 | [127] |
| Hg2+ | N,S-co-doped CDs | Fluorescent | 0–20 μM | 0.18 μM | 0.9975 | 2015 | [126] |
| Hg2+ | N-rich CDs | Fluorescent | 0–20 μM | 0.63 μM | 0.989 | 2016 | [207] |
| Fe3+ | N-doped CDs | Fluorescent | 0–1000 μM | 100 μM | - | 2016 | [135] |
| Fe3+ | N-CDs | Fluorescent | 0–1000 μM | 0.96 μM | - | 2016 | [13] |
| Hg2+ | LR-CDs | Fluorescent | 0.1–1.5 μM | 18.7 nM | 0.9919 | 2016 | [64] |
| 2.0–60.0 μM | 0.994 | ||||||
| Hg2+ | CDs | Fluorescent | 0–80 μM | 0.201 μM | 0.9982 | 2016 | [133] |
| Pb2+ | CDs | Fluorescent | 0.01–1.0 μM | 0.59 nM | 0.998 | 2017 | [65] |
| Cu2+ | Nitrogen-doped CDs | Fluorescent | 0.5–4 μM | 0.38 μM | 0.998 | 2017 | [141] |
| Hg2+ | CDs | Fluorescent | 0–0.5 mM | 0.78 μM | 0.9944 | 2017 | [142] |
| Fe3+ | 0–0.15 mM | 1.17 μM | 0.9977 | ||||
| Hg2+ | Nitrogen-doped CQDs | Fluorescent | 0–18 μM | 83.5 nM | 0.9979 | 2017 | [143] |
| Hg2+ | CDs | Fluorescent | 0–40 μM | 9 nM | 0.9896 | 2017 | [15] |
| Fe3+ | N-CQDs | Fluorescent | 0–300 μM | 0.16 μM | 0.9811 | 2018 | [22] |
| Cr6+ | CDs | Fluorescent | 0–100 μM | 0.73 μM | 0.9903 | 2018 | [85] |
| Cu2+ | CQDs | Fluorescent | 1–8 μM | 6.33 nM | 0.998 | 2018 | [97] |
| Cu2+ | CDs | Fluorescent | 0.01–500 μM | 4.3 nM | 0.9907 | 2018 | [66] |
| Cu2+ | CQDs | Fluorescent | 0–100 μM | 31.5 μM | 0.9897 | 2018 | [239] |
| Fe3+ | CdSe@SiO2-CDs | Fluorescent | 9–120 μM | 0.26 μM | 0.995 | 2018 | [151] |
| Fe3+ | CDs | Fluorescent | 0.05–10.0 μM | 13.7 nM | 0.992 | 2018 | [159] |
| Hg2+ | N-CDs | Fluorescent | 0.001–5 μM | 0.65 μM | 0.985 | 2018 | [160] |
| Hg2+ | CDs | Fluorescent | 0–100 μM | 2.47 μM | 0.9892 | 2018 | [152] |
| Hg2+ | N-S-CDs | Fluorescent | 0.01–50 μM | 0.008 μM | 0.9622 | 2018 | [153] |
| Hg2+ | CQDs | Fluorescent | 5–70 nM | 8 nM | 0.9970 | 2018 | [23] |
| Cr6+ | 10 nM | 0.9956 | |||||
| Fe3+ | CDs | Fluorescent | 1–700 μM | <1 μM | 0.993 | 2019 | [219] |
| Fe2+ | CDs | Optical microfiber | 0–5.372 μM | 0.179 μM | - | 2019 | [166] |
| Co2+ | CDs | Fluorescent | 1–2 μM | 0.39 μM | 0.9912 | 2019 | [51] |
| Pb2+ | VV-CDs | Fluorescent | 1–100 μM | 12 nM | 0.99853 | 2020 | [87] |
| Fe3+ | 16 nM | 0.99933 | |||||
| Pb2+ | GCE/NCQDs/aptamers | Electrochemiluminescence | 50–387.9 nM | 0.0189 nM | 0.998 | 2020 | [181] |
| As3+ | CDs-MnO2 | Fluorescent | 0–200 nM | 16.8 nM | 0.992 | 2020 | [177] |
| Cu2+ | CDs | Fluorescent | 0–120 nM | 1.0 nM | 0.997 | 2020 | [53] |
| Fe3+ | Phe-CDs | Fluorescent | 5–500 μM | 0.720 μM | 0.9959 | 2020 | [169] |
| Hg2+ | N-CDs | Fluorescent | 0.15–90 μM | 0.20 μM | 0.993 | 2020 | [178] |
| Hg2+ | CDs | Fluorescent | 0.01–5 μM | 6.25 nM | 0.991 | 2020 | [54] |
| Cr4+ | S, N-CDs | Fluorescent | 0.03–50 μM | 21.14 nM | 0.996 | 2021 | [193] |
| Fe3+ | N-CDs | Fluorescent | 0.3–3.3 μM | 0.135 μM | 0.9918 | 2021 | [72] |
| Fe3+ | CDs@PDA | Fluorescent | 2–27 μM | 3.75 μM 5.82 μM | 0.994 0.991 | 2021 | [226] |
| Pb2+ | N-CDs/R-CDs@ZIF-8 | Fluorescent | 0.05–50 μM | 4.78 nM | 0.9952 | 2021 | [240] |
| Cr6+ | BNCDs | Fluorescent | 0–100 μM | 0.41 μM | 0.999 | 2021 | [241] |
| Fe3+ | KBNCDs | Fluorescent | 0–25 μM | 1.2 μM | 0.997 | 2022 | [78] |
| Mn2+ | 1.4 μM | 0.998 | |||||
| Hg2+ | CDs | Fluorescent | 0–46 μM | 2 μM | 0.997 | 2022 | [89] |
| Fe3+ | CDs | Fluorescent | 20–100 μM | 0.07 μM | 0.9977 | 2022 | [38] |
| Fe3+ | M-CDs | Fluorescent | 5–30 μM | 0.47 μM | 0.998 | 2022 | [40] |
| Cu2+ | NS-CDs | Colorimetric | 1–100 μM | 200 nM | 0.99481 | 2022 | [227] |
4.2. Phenols
4.3. Pesticides
4.4. Explosive Compounds
5. Concluding Remarks
Author Contributions
Funding
Institutional Review Board Statement
Informed Consent Statement
Data Availability Statement
Conflicts of Interest
References
- Atchudan, R.; Edison, T.N.J.I.; Perumal, S.; Vinodh, R.; Sundramoorthy, A.K.; Babu, R.S.; Lee, Y.R. Leftover Kiwi Fruit Peel-Derived Carbon Dots as a Highly Selective Fluorescent Sensor for Detection of Ferric Ion. Chemosensors 2021, 9, 166. [Google Scholar] [CrossRef]
- Carbonaro, C.M.; Corpino, R.; Salis, M.; Mocci, F.; Thakkar, S.V.; Olla, C.; Ricci, P.C. On the Emission Properties of Carbon Dots: Reviewing Data and Discussing Models. C—J. Carbon Res. 2019, 5, 60. [Google Scholar] [CrossRef] [Green Version]
- Shi, W.; Song, S.; Zhang, H. Hydrothermal Synthetic Strategies of Inorganic Semiconducting Nanostructures. Chem. Soc. Rev. 2013, 42, 5714–5743. [Google Scholar] [CrossRef]
- Li, L.; Dong, T. Photoluminescence Tuning in Carbon Dots: Surface Passivation or/and Functionalization, Heteroatom Doping. J. Mater. Chem. C 2018, 6, 7944–7970. [Google Scholar] [CrossRef]
- Jorns, M.; Pappas, D. A Review of Fluorescent Carbon Dots, Their Synthesis, Physical and Chemical Characteristics, and Applications. Nanomaterials 2021, 11, 1448. [Google Scholar] [CrossRef]
- Long, C.; Jiang, Z.; Shangguan, J.; Qing, T.; Zhang, P.; Feng, B. Applications of Carbon Dots in Environmental Pollution Control: A Review. Chem. Eng. J. 2021, 406, 126848. [Google Scholar] [CrossRef]
- Sharma, V.; Tiwari, P.; Kaur, N.; Mobin, S.M. Optical Nanosensors Based on Fluorescent Carbon Dots for the Detection of Water Contaminants: A Review. Environ. Chem. Lett. 2021, 19, 3229–3241. [Google Scholar] [CrossRef]
- Kurian, M.; Paul, A. Recent Trends in the Use of Green Sources for Carbon Dot Synthesis—A Short Review. Carbon Trends 2021, 3, 100032. [Google Scholar] [CrossRef]
- Sahu, S.; Behera, B.; Maiti, T.K.; Mohapatra, S. Simple One-Step Synthesis of Highly Luminescent Carbon Dots from Orange Juice: Application as Excellent Bio-Imaging Agents. Chem. Commun. 2012, 48, 8835–8837. [Google Scholar] [CrossRef]
- Zhou, J.; Sheng, Z.; Han, H.; Zou, M.; Li, C. Facile Synthesis of Fluorescent Carbon Dots Using Watermelon Peel as a Carbon Source. Mater. Lett. 2012, 66, 222–224. [Google Scholar] [CrossRef]
- Du, F.; Zhang, M.; Li, X.; Li, J.; Jiang, X.; Li, Z.; Hua, Y.; Shao, G.; Jin, J.; Shao, Q.; et al. Economical and Green Synthesis of Bagasse-Derived Fluorescent Carbon Dots for Biomedical Applications. Nanotechnology 2014, 25, 315702. [Google Scholar] [CrossRef]
- Tyagi, A.; Tripathi, K.M.; Singh, N.; Choudhary, S.; Gupta, R.K. Green Synthesis of Carbon Quantum Dots from Lemon Peel Waste: Applications in Sensing and Photocatalysis. RSC Adv. 2016, 6, 72423–72432. [Google Scholar] [CrossRef]
- Edison, T.N.J.I.; Atchudan, R.; Shim, J.J.; Kalimuthu, S.; Ahn, B.C.; Lee, Y.R. Turn-off Fluorescence Sensor for the Detection of Ferric Ion in Water Using Green Synthesized N-Doped Carbon Dots and Its Bio-Imaging. J. Photochem. Photobiol. B Biol. 2016, 158, 235–242. [Google Scholar] [CrossRef]
- Shi, J.; Ni, G.; Tu, J.; Jin, X.; Peng, J. Green Synthesis of Fluorescent Carbon Dots for Sensitive Detection of Fe2+ and Hydrogen Peroxide. J. Nanopart. Res. 2017, 19, 209. [Google Scholar] [CrossRef]
- Zhao, J.; Huang, M.; Zhang, L.; Zou, M.; Chen, D.; Huang, Y.; Zhao, S. Unique Approach to Develop Carbon Dot-Based Nanohybrid Near-Infrared Ratiometric Fluorescent Sensor for the Detection of Mercury Ions. Anal. Chem. 2017, 89, 8044–8049. [Google Scholar] [CrossRef]
- Su, A.; Wang, D.; Shu, X.; Zhong, Q.; Chen, Y.; Liu, J.; Wang, Y. Synthesis of Fluorescent Carbon Quantum Dots from Dried Lemon Peel for Determination of Carmine in Drinks. Chem. Res. Chin. Univ. 2018, 34, 164–168. [Google Scholar] [CrossRef]
- Ding, H.; Ji, Y.; Wei, J.S.; Gao, Q.Y.; Zhou, Z.Y.; Xiong, H.M. Facile Synthesis of Red-Emitting Carbon Dots from Pulp-Free Lemon Juice for Bioimaging. J. Mater. Chem. B 2017, 5, 5272–5277. [Google Scholar] [CrossRef]
- Chatzimitakos, T.; Kasouni, A.; Sygellou, L.; Avgeropoulos, A.; Troganis, A.; Stalikas, C. Two of a Kind but Different: Luminescent Carbon Quantum Dots from Citrus Peels for Iron and Tartrazine Sensing and Cell Imaging. Talanta 2017, 175, 305–312. [Google Scholar] [CrossRef]
- Gharat, P.M.; Pal, H.; Dutta Choudhury, S. Photophysics and Luminescence Quenching of Carbon Dots Derived from Lemon Juice and Glycerol. Spectrochim. Acta Part A Mol. Biomol. Spectrosc. 2019, 209, 14–21. [Google Scholar] [CrossRef]
- Schneider, E.M.; Bärtsch, A.; Stark, W.J.; Grass, R.N. Safe One-Pot Synthesis of Fluorescent Carbon Quantum Dots from Lemon Juice for a Hands-On Experience of Nanotechnology. J. Chem. Educ. 2019, 96, 540–545. [Google Scholar] [CrossRef]
- Tadesse, A.; RamaDevi, D.; Battu, G.; Basavaiah, K. Facile Green Synthesis of Fluorescent Carbon Quantum Dots from Citrus Lemon Juice for Live Cell Imaging. Asian J. Nanosci. Mater. 2018, 1, 36–46. [Google Scholar]
- Lu, M.; Duan, Y.; Song, Y.; Tan, J.; Zhou, L. Green Preparation of Versatile Nitrogen-Doped Carbon Quantum Dots from Watermelon Juice for Cell Imaging, Detection of Fe3+ Ions and Cysteine, and Optical Thermometry. J. Mol. Liq. 2018, 269, 766–774. [Google Scholar] [CrossRef]
- Rajendran, K.; Rajendiran, N. Bluish Green Emitting Carbon Quantum Dots Synthesized from Jackfruit (Artocarpus Heterophyllus) and Its Sensing Applications of Hg (II) and Cr (VI) Ions. Mater. Res. Express 2018, 5, 24008. [Google Scholar] [CrossRef]
- Ahmadian-Fard-Fini, S.; Salavati-Niasari, M.; Ghanbari, D. Hydrothermal Green Synthesis of Magnetic Fe3O4-Carbon Dots by Lemon and Grape Fruit Extracts and as a Photoluminescence Sensor for Detecting of E. Coli Bacteria. Spectrochim. Acta Part A Mol. Biomol. Spectrosc. 2018, 203, 481–493. [Google Scholar] [CrossRef]
- Anindita, F.; Darmawan, N.; Mas’Ud, Z.A. Fluorescence Carbon Dots from Durian as an Eco-Friendly Inhibitor for Copper Corrosion. AIP Conf. Proc. 2018, 2014, 020008. [Google Scholar] [CrossRef]
- Carvalho, J.; Santos, L.R.; Germino, J.C.; Terezo, A.J.; Moreto, J.A.; Quites, F.J.; Freitas, R.G. Hydrothermal Synthesis to Water-Stable Luminescent Carbon Dots from Acerola Fruit for Photoluminescent Composites Preparation and Its Application as Sensors. Mater. Res. 2019, 22, 1–8. [Google Scholar] [CrossRef] [Green Version]
- Fatahi, Z.; Esfandiari, N.; Ehtesabi, H.; Bagheri, Z.; Ranjbar, Z.; Latifi, H. Physicochemical and Cytotoxicity Analysis of Green Synthesis Carbon Dots for Cell Imaging. EXCLI J. 2019, 18, 454–466. [Google Scholar]
- Tadesse, A.; Hagos, M.; Ramadevi, D.; Basavaiah, K.; Belachew, N. Fluorescent-Nitrogen-Doped Carbon Quantum Dots Derived from Citrus Lemon Juice: Green Synthesis, Mercury(II) Ion Sensing, and Live Cell Imaging. ACS Omega 2020, 5, 3889–3898. [Google Scholar] [CrossRef] [Green Version]
- Monte-Filho, S.S.; Andrade, S.I.E.; Lima, M.B.; Araujo, M.C.U. Synthesis of Highly Fluorescent Carbon Dots from Lemon and Onion Juices for Determination of Riboflavin in Multivitamin/Mineral Supplements. J. Pharm. Anal. 2019, 9, 209–216. [Google Scholar] [CrossRef]
- Hoan, B.T.; Tam, P.D.; Pham, V.H. Green Synthesis of Highly Luminescent Carbon Quantum Dots from Lemon Juice. J. Nanotechnol. 2019, 2019, 2852816. [Google Scholar] [CrossRef] [Green Version]
- Jayaweera, S.; Yin, K.; Ng, W.J. Nitrogen-Doped Durian Shell Derived Carbon Dots for Inner Filter Effect Mediated Sensing of Tetracycline and Fluorescent Ink. J. Fluoresc. 2019, 29, 221–229. [Google Scholar] [CrossRef]
- Hashemi, F.; Heidari, F.; Mohajeri, N.; Mahmoodzadeh, F.; Zarghami, N. Fluorescence Intensity Enhancement of Green Carbon Dots: Synthesis, Characterization and Cell Imaging. Photochem. Photobiol. 2020, 96, 1032–1040. [Google Scholar] [CrossRef]
- Muktha, H.; Sharath, R.; Kottam, N.; Smrithi, S.P.; Samrat, K.; Ankitha, P. Green Synthesis of Carbon Dots and Evaluation of Its Pharmacological Activities. Bionanoscience 2020, 10, 731–744. [Google Scholar] [CrossRef]
- Zhang, Q.; Liang, J.; Zhao, L.; Wang, Y.; Zheng, Y.; Wu, Y.; Jiang, L. Synthesis of Novel Fluorescent Carbon Quantum Dots From Rosa roxburghii for Rapid and Highly Selective Detection of O-Nitrophenol and Cellular Imaging. Front. Chem. 2020, 8, 1–9. [Google Scholar] [CrossRef]
- Gudimella, K.K.; Appidi, T.; Wu, H.F.; Battula, V.; Jogdand, A.; Rengan, A.K.; Gedda, G. Sand Bath Assisted Green Synthesis of Carbon Dots from Citrus Fruit Peels for Free Radical Scavenging and Cell Imaging. Colloids Surf. B Biointerfaces 2021, 197, 111362. [Google Scholar] [CrossRef]
- Atchudan, R.; Jebakumar Immanuel Edison, T.N.; Shanmugam, M.; Perumal, S.; Somanathan, T.; Lee, Y.R. Sustainable Synthesis of Carbon Quantum Dots from Banana Peel Waste Using Hydrothermal Process for in Vivo Bioimaging. Phys. E Low-Dimens. Syst. Nanostruct. 2021, 126, 114417. [Google Scholar] [CrossRef]
- Ghereghlou, M.; Esmaeili, A.A.; Darroudi, M. Green Synthesis of Fluorescent Carbon Dots from Elaeagnus angustifolia and Its Application as Tartrazine Sensor. J. Fluoresc. 2021, 31, 185–193. [Google Scholar] [CrossRef]
- Ashok Varman, G.; Kalanidhi, K.; Nagaraaj, P. Green Synthesis of Fluorescent Carbon Dots from Canon Ball Fruit for Sensitive Detection of Fe3+ and Catalytic Reduction of Textile Dyes. Dyes Pigment. 2022, 199, 110101. [Google Scholar] [CrossRef]
- Vijeata, A.; Chaudhary, S.; Chaudhary, G.R. Fluorescent Carbon Dots from Indian Bael Patra as Effective Sensing Tool to Detect Perilous Food Colorant. Food Chem. 2022, 373, 131492. [Google Scholar] [CrossRef]
- Atchudan, R.; Edison, T.N.J.I.; Perumal, S.; Vinodh, R.; Sundramoorthy, A.K.; Babu, R.S.; Lee, Y.R. Morus Nigra-Derived Hydrophilic Carbon Dots for the Highly Selective and Sensitive Detection of Ferric Ion in Aqueous Media and Human Colon Cancer Cell Imaging. Colloids Surf. A Physicochem. Eng. Asp. 2022, 635, 128073. [Google Scholar] [CrossRef]
- Chandra, S.; Bano, D.; Sahoo, K.; Kumar, D.; Kumar, V.; Kumar Yadav, P.; Hadi Hasan, S. Synthesis of Fluorescent Carbon Quantum Dots from Jatropha Fruits and Their Application in Fluorometric Sensor for the Detection of Chlorpyrifos. Microchem. J. 2022, 172, 106953. [Google Scholar] [CrossRef]
- Qu, Y.; Yu, L.; Zhu, B.; Chai, F.; Su, Z. Green Synthesis of Carbon Dots by Celery Leaves for Use as Fluorescent Paper Sensors for the Detection of Nitrophenols. New J. Chem. 2020, 44, 1500–1507. [Google Scholar] [CrossRef]
- Yin, B.; Deng, J.; Peng, X.; Long, Q.; Zhao, J.; Lu, Q.; Chen, Q.; Li, H.; Tang, H.; Zhang, Y.; et al. Green Synthesis of Carbon Dots with Down- and up-Conversion Fluorescent Properties for Sensitive Detection of Hypochlorite with a Dual-Readout Assay. Analyst 2013, 138, 6551–6557. [Google Scholar] [CrossRef]
- Thota, S.P.; Thota, S.M.; Bhagavatham, S.S.; Manoj, K.S.; Muthukumar, V.S.S.; Venketesh, S.; Vadlani, P.V.; Belliraj, S.K. Facile One-Pot Hydrothermal Synthesis of Stable and Biocompatible Fluorescent Carbon Dots from Lemon Grass Herb. IET Nanobiotechnol. 2018, 12, 127–132. [Google Scholar] [CrossRef]
- Miao, H.; Wang, L.; Zhuo, Y.; Zhou, Z.; Yang, X. Label-Free Fluorimetric Detection of CEA Using Carbon Dots Derived from Tomato Juice. Biosens. Bioelectron. 2016, 86, 83–89. [Google Scholar] [CrossRef]
- Liu, Y.; Liu, Y.; Park, M.; Park, S.J.; Zhang, Y.; Akanda, M.R.; Park, B.Y.; Kim, H.Y. Green Synthesis of Fluorescent Carbon Dots from Carrot Juice for in Vitro Cellular Imaging. Carbon Lett. 2017, 21, 61–67. [Google Scholar] [CrossRef] [Green Version]
- Liu, W.; Diao, H.; Chang, H.; Wang, H.; Li, T.; Wei, W. Green Synthesis of Carbon Dots from Rose-Heart Radish and Application for Fe3+ Detection and Cell Imaging. Sens. Actuators B Chem. 2017, 241, 190–198. [Google Scholar] [CrossRef]
- Vasimalai, N.; Vilas-Boas, V.; Gallo, J.; Cerqueira, M.d.F.; Menéndez-Miranda, M.; Costa-Fernández, J.M.; Diéguez, L.; Espiña, B.; Fernández-Argüelles, M.T. Green Synthesis of Fluorescent Carbon Dots from Spices for in Vitro Imaging and Tumour Cell Growth Inhibition. Beilstein J. Nanotechnol. 2018, 9, 530–544. [Google Scholar] [CrossRef]
- Li, L.S.; Jiao, X.Y.; Zhang, Y.; Cheng, C.; Huang, K.; Xu, L. Green Synthesis of Fluorescent Carbon Dots from Hongcaitai for Selective Detection of Hypochlorite and Mercuric Ions and Cell Imaging. Sens. Actuators B Chem. 2018, 263, 426–435. [Google Scholar] [CrossRef]
- Tafreshi, F.A.; Fatahi, Z.; Ghasemi, S.F.; Taherian, A.; Esfandiari, N. Ultrasensitive Fluorescent Detection of Pesticides in Real Sample by Using Green Carbon Dots. PLoS ONE 2020, 15, 1–17. [Google Scholar] [CrossRef] [Green Version]
- Zhao, C.; Li, X.; Cheng, C.; Yang, Y. Green and Microwave-Assisted Synthesis of Carbon Dots and Application for Visual Detection of Cobalt(II) Ions and PH Sensing. Microchem. J. 2019, 147, 183–190. [Google Scholar] [CrossRef]
- Kailasa, S.K.; Ha, S.; Baek, S.H.; Phan, L.M.T.; Kim, S.; Kwak, K.; Park, T.J. Tuning of Carbon Dots Emission Color for Sensing of Fe3+ Ion and Bioimaging Applications. Mater. Sci. Eng. C 2019, 98, 834–842. [Google Scholar] [CrossRef] [PubMed]
- Xiao-Yan, W.; Xue-Yan, H.; Tian-Qi, W.; Xu-Cheng, F. Crown Daisy Leaf Waste–Derived Carbon Dots: A Simple and Green Fluorescent Probe for Copper Ion. Surf. Interface Anal. 2020, 52, 148–155. [Google Scholar] [CrossRef]
- Long, R.; Tang, C.; Li, T.; Tong, X.; Tong, C.; Guo, Y.; Gao, Q.; Wu, L.; Shi, S. Dual-Emissive Carbon Dots for Dual-Channel Ratiometric Fluorometric Determination of PH and Mercury Ion and Intracellular Imaging. Microchim. Acta 2020, 187, 307. [Google Scholar] [CrossRef]
- Lai, Z.; Guo, X.; Cheng, Z.; Ruan, G.; Du, F. Green Synthesis of Fluorescent Carbon Dots from Cherry Tomatoes for Highly Effective Detection of Trifluralin Herbicide in Soil Samples. ChemistrySelect 2020, 5, 1956–1960. [Google Scholar] [CrossRef]
- Zhang, Z.; Hu, B.; Zhuang, Q.; Wang, Y.; Luo, X.; Xie, Y.; Zhou, D. Green Synthesis of Fluorescent Nitrogen–Sulfur Co-Doped Carbon Dots from Scallion Leaves for Hemin Sensing. Anal. Lett. 2020, 53, 1704–1718. [Google Scholar] [CrossRef]
- Rodríguez-Varillas, S.; Fontanil, T.; Obaya, Á.J.; Fernández-González, A.; Murru, C.; Badía-Laíño, R. Biocompatibility and Antioxidant Capabilities of Carbon Dots Obtained from Tomato (Solanum lycopersicum). Appl. Sci. 2022, 12, 773. [Google Scholar] [CrossRef]
- Cao, Y.; Wang, X.; Bai, H.; Jia, P.; Zhao, Y.; Liu, Y.; Wang, L.; Zhuang, Y.; Yue, T. Fluorescent Detection of Tetracycline in Foods Based on Carbon Dots Derived from Natural Red Beet Pigment. LWT 2022, 157, 113100. [Google Scholar] [CrossRef]
- Sun, R.; Liu, S. Synthesis of Photoluminescent Carbon Dots and Its Effect on Chondrocytes for Knee Joint Therapy Applications. Artif. Cells Nanomed. Biotechnol. 2019, 47, 1321–1325. [Google Scholar] [CrossRef]
- Deka, M.J.; Dutta, P.; Sarma, S.; Medhi, O.K.; Talukdar, N.C.; Chowdhury, D. Carbon Dots Derived from Water Hyacinth and Their Application as a Sensor for Pretilachlor. Heliyon 2019, 5, e01985. [Google Scholar] [CrossRef] [Green Version]
- Wang, M.; Wan, Y.; Zhang, K.; Fu, Q.; Wang, L.; Zeng, J.; Xia, Z.; Gao, D. Green Synthesis of Carbon Dots Using the Flowers of Osmanthus Fragrans (Thunb.) Lour. as Precursors: Application in Fe3+ and Ascorbic Acid Determination and Cell Imaging. Anal. Bioanal. Chem. 2019, 411, 2715–2727. [Google Scholar] [CrossRef] [PubMed]
- Shekarbeygi, Z.; Farhadian, N.; Khani, S.; Moradi, S.; Shahlaei, M. The Effects of Rose Pigments Extracted by Different Methods on the Optical Properties of Carbon Quantum Dots and Its Efficacy in the Determination of Diazinon. Microchem. J. 2020, 158, 105232. [Google Scholar] [CrossRef]
- Ghosh, S.; Gul, A.R.; Park, C.Y.; Kim, M.W.; Xu, P.; Baek, S.H.; Bhamore, J.R.; Kailasa, S.K.; Park, T.J. Facile Synthesis of Carbon Dots from Tagetes erecta as a Precursor for Determination of Chlorpyrifos via Fluorescence Turn-off and Quinalphos via Fluorescence Turn-on Mechanisms. Chemosphere 2021, 279, 130515. [Google Scholar] [CrossRef] [PubMed]
- Gu, D.; Shang, S.; Yu, Q.; Shen, J. Green Synthesis of Nitrogen-Doped Carbon Dots from Lotus Root for Hg(II) Ions Detection and Cell Imaging. Appl. Surf. Sci. 2016, 390, 38–42. [Google Scholar] [CrossRef]
- Kumar, A.; Chowdhuri, A.R.; Laha, D.; Mahto, T.K.; Karmakar, P.; Sahu, S.K. Green Synthesis of Carbon Dots from Ocimum sanctum for Effective Fluorescent Sensing of Pb2+ Ions and Live Cell Imaging. Sens. Actuators B Chem. 2017, 242, 679–686. [Google Scholar] [CrossRef]
- Bhamore, J.R.; Jha, S.; Park, T.J.; Kailasa, S.K. Fluorescence Sensing of Cu2+ Ion and Imaging of Fungal Cell by Ultra-Small Fluorescent Carbon Dots Derived from Acacia concinna Seeds. Sens. Actuators B Chem. 2018, 277, 47–54. [Google Scholar] [CrossRef]
- Fahmi, M.Z.; Haris, A.; Permana, A.J.; Nor Wibowo, D.L.; Purwanto, B.; Nikmah, Y.L.; Idris, A. Bamboo Leaf-Based Carbon Dots for Efficient Tumor Imaging and Therapy. RSC Adv. 2018, 8, 38376–38383. [Google Scholar] [CrossRef] [Green Version]
- Li, W.; Liu, Y.; Wu, M.; Feng, X.; Redfern, S.A.T.; Shang, Y.; Yong, X.; Feng, T.; Wu, K.; Liu, Z.; et al. Carbon-Quantum-Dots-Loaded Ruthenium Nanoparticles as an Efficient Electrocatalyst for Hydrogen Production in Alkaline Media. Adv. Mater. 2018, 30, 1800676. [Google Scholar] [CrossRef]
- Wei, X.; Li, L.; Liu, J.; Yu, L.; Li, H.; Cheng, F.; Yi, X.; He, J.; Li, B. Green Synthesis of Fluorescent Carbon Dots from Gynostemma for Bioimaging and Antioxidant in Zebrafish. ACS Appl. Mater. Interfaces 2019, 11, 9832–9840. [Google Scholar] [CrossRef]
- Dager, A.; Uchida, T.; Maekawa, T.; Tachibana, M. Synthesis and Characterization of Mono-Disperse Carbon Quantum Dots from Fennel Seeds: Photoluminescence Analysis Using Machine Learning. Sci. Rep. 2019, 9, 14004. [Google Scholar] [CrossRef]
- Yang, X.; Wang, D.; Luo, N.; Feng, M.; Peng, X.; Liao, X. Green Synthesis of Fluorescent N,S-Carbon Dots from Bamboo Leaf and the Interaction with Nitrophenol Compounds. Spectrochim. Acta Part A Mol. Biomol. Spectrosc. 2020, 239, 118462. [Google Scholar] [CrossRef]
- Kalanidhi, K.; Nagaraaj, P. Facile and Green Synthesis of Fluorescent N-Doped Carbon Dots from Betel Leaves for Sensitive Detection of Picric Acid and Iron Ion. J. Photochem. Photobiol. A Chem. 2021, 418, 113369. [Google Scholar] [CrossRef]
- Ghosh, S.; Gul, A.R.; Park, C.Y.; Xu, P.; Baek, S.H.; Bhamore, J.R.; Kim, M.W.; Lee, M.; Kailasa, S.K.; Park, T.J. Green Synthesis of Carbon Dots from Calotropis procera Leaves for Trace Level Identification of Isoprothiolane. Microchem. J. 2021, 167, 106272. [Google Scholar] [CrossRef]
- Zaib, M.; Akhtar, A.; Maqsood, F.; Shahzadi, T. Green Synthesis of Carbon Dots and Their Application as Photocatalyst in Dye Degradation Studies. Arab. J. Sci. Eng. 2021, 46, 437–446. [Google Scholar] [CrossRef]
- Chauhan, P.; Chaudhary, S.; Kumar, R. Biogenic Approach for Fabricating Biocompatible Carbon Dots and Their Application in Colorimetric and Fluorometric Sensing of Lead Ion. J. Clean. Prod. 2021, 279, 123639. [Google Scholar] [CrossRef]
- Wang, C.; Xu, J.; Zhang, R.; Zhao, W. Facile and Low-Energy-Consumption Synthesis of Dual-Functional Carbon Dots from Cornus Walteri Leaves for Detection of p-Nitrophenol and Photocatalytic Degradation of Dyes. Colloids Surf. A Physicochem. Eng. Asp. 2022, 640, 128351. [Google Scholar] [CrossRef]
- Ge, G.; Li, L.; Chen, M.; Wu, X.; Yang, Y.; Wang, D.; Zuo, S.; Zeng, Z.; Xiong, W.; Guo, C. Green Synthesis of Nitrogen–Doped Carbon Dots from Fresh Tea Leaves for Selective Fe3+ Ions Detection and Cellular Imaging. Nanomaterials 2022, 12, 986. [Google Scholar] [CrossRef]
- Krishnaiah, P.; Atchudan, R.; Perumal, S.; Salama, E.S.; Lee, Y.R.; Jeon, B.H. Utilization of Waste Biomass of Poa Pratensis for Green Synthesis of N-Doped Carbon Dots and Its Application in Detection of Mn2+ and Fe3+. Chemosphere 2022, 286, 131764. [Google Scholar] [CrossRef]
- Tan, X.W.; Romainor, A.N.B.; Chin, S.F.; Ng, S.M. Carbon Dots Production via Pyrolysis of Sago Waste as Potential Probe for Metal Ions Sensing. J. Anal. Appl. Pyrolysis 2014, 105, 157–165. [Google Scholar] [CrossRef]
- Ang, W.L.; Boon Mee, C.A.L.; Sambudi, N.S.; Mohammad, A.W.; Leo, C.P.; Mahmoudi, E.; Ba-Abbad, M.; Benamor, A. Microwave-Assisted Conversion of Palm Kernel Shell Biomass Waste to Photoluminescent Carbon Dots. Sci. Rep. 2020, 10, 21199. [Google Scholar] [CrossRef]
- Monday, Y.N.; Abdullah, J.; Yusof, N.A.; Rashid, S.A.; Shueb, R.H. Facile Hydrothermal and Solvothermal Synthesis and Characterization of Nitrogen-Doped Carbon Dots from Palm Kernel Shell Precursor. Appl. Sci. 2021, 11, 1630. [Google Scholar] [CrossRef]
- Liu, S.; Liu, Z.; Li, Q.; Xia, H.; Yang, W.; Wang, R.; Li, Y.; Zhao, H.; Tian, B. Facile Synthesis of Carbon Dots from Wheat Straw for Colorimetric and Fluorescent Detection of Fluoride and Cellular Imaging. Spectrochim. Acta Part A Mol. Biomol. Spectrosc. 2021, 246, 118964. [Google Scholar] [CrossRef] [PubMed]
- Ramanan, V.; Thiyagarajan, S.K.; Raji, K.; Suresh, R.; Sekar, R.; Ramamurthy, P. Outright Green Synthesis of Fluorescent Carbon Dots from Eutrophic Algal Blooms for in Vitro Imaging. ACS Sustain. Chem. Eng. 2016, 4, 4724–4731. [Google Scholar] [CrossRef]
- Moonrinta, S.; Jamnongsong, S.; Sampattavanich, S.; Kladsomboon, S.; Sajomsang, W.; Paoprasert, P. Synthesis of Biocompatible Carbon Dots from Yogurt and Gas Vapor Sensing. IOP Conf. Ser. Mater. Sci. Eng. 2018, 378, 012005. [Google Scholar] [CrossRef]
- Pacquiao, M.R.; de Luna, M.D.G.; Thongsai, N.; Kladsomboon, S.; Paoprasert, P. Highly Fluorescent Carbon Dots from Enokitake Mushroom as Multi-Faceted Optical Nanomaterials for Cr6+ and VOC Detection and Imaging Applications. Appl. Surf. Sci. 2018, 453, 192–203. [Google Scholar] [CrossRef]
- Plácido, J.; Bustamante-López, S.; Meissner, K.E.; Kelly, D.E.; Kelly, S.L. Microalgae Biochar-Derived Carbon Dots and Their Application in Heavy Metal Sensing in Aqueous Systems. Sci. Total Environ. 2019, 656, 531–539. [Google Scholar] [CrossRef] [Green Version]
- Zulfajri, M.; Liu, K.C.; Pu, Y.H.; Rasool, A.; Dayalan, S.; Huang, G.G. Utilization of Carbon Dots Derived from Volvariella Volvacea Mushroom for a Highly Sensitive Detection of Fe3+ and Pb2+ Ions in Aqueous Solutions. Chemosensors 2020, 8, 47. [Google Scholar] [CrossRef]
- Chauhan, P.; Saini, J.; Chaudhary, S.; Bhasin, K.K. Sustainable Synthesis of Carbon Dots from Agarose Waste and Prospective Application in Sensing of L-Aspartic Acid. Mater. Res. Bull. 2021, 134, 111113. [Google Scholar] [CrossRef]
- Shen, C.; Dong, C.; Cheng, L.; Shi, X.; Bi, H. Fluorescent Carbon Dots from Shewanella oneidensis MR–1 for Hg2+ and Tetracycline Detection and Selective Fluorescence Imaging of Gram–Positive Bacteria. J. Environ. Chem. Eng. 2022, 10, 107020. [Google Scholar] [CrossRef]
- Hu, Y.; Yang, J.; Tian, J.; Jia, L.; Yu, J.S. Waste Frying Oil as a Precursor for One-Step Synthesis of Sulfur-Doped Carbon Dots with PH-Sensitive Photoluminescence. Carbon 2014, 77, 775–782. [Google Scholar] [CrossRef]
- Zhang, C.; Xiao, Y.; Ma, Y.; Li, B.; Liu, Z.; Lu, C.; Liu, X.; Wei, Y.; Zhu, Z.; Zhang, Y. Algae Biomass as a Precursor for Synthesis of Nitrogen-and Sulfur-Co-Doped Carbon Dots: A Better Probe in Arabidopsis Guard Cells and Root Tissues. J. Photochem. Photobiol. B Biol. 2017, 174, 315–322. [Google Scholar] [CrossRef] [PubMed]
- Ramanan, V.; Siddaiah, B.; Raji, K.; Ramamurthy, P. Green Synthesis of Multifunctionalized, Nitrogen-Doped, Highly Fluorescent Carbon Dots from Waste Expanded Polystyrene and Its Application in the Fluorimetric Detection of Au3+ Ions in Aqueous Media. ACS Sustain. Chem. Eng. 2018, 6, 1627–1638. [Google Scholar] [CrossRef]
- Konwar, A.; Baruah, U.; Deka, M.J.; Hussain, A.A.; Haque, S.R.; Pal, A.R.; Chowdhury, D. Tea-Carbon Dots-Reduced Graphene Oxide: An Efficient Conducting Coating Material for Fabrication of an E-Textile. ACS Sustain. Chem. Eng. 2017, 5, 11645–11651. [Google Scholar] [CrossRef]
- Su, R.; Wang, D.; Liu, M.; Yan, J.; Wang, J.X.; Zhan, Q.; Pu, Y.; Foster, N.R.; Chen, J.F. Subgram-Scale Synthesis of Biomass Waste-Derived Fluorescent Carbon Dots in Subcritical Water for Bioimaging, Sensing, and Solid-State Patterning. ACS Omega 2018, 3, 13211–13218. [Google Scholar] [CrossRef]
- Xue, H.; Yan, Y.; Hou, Y.; Li, G.; Hao, C. Novel Carbon Quantum Dots for Fluorescent Detection of Phenol and Insights into the Mechanism. New J. Chem. 2018, 42, 11485–11492. [Google Scholar] [CrossRef]
- Lin, B.; Yan, Y.; Guo, M.; Cao, Y.; Yu, Y.; Zhang, T.; Huang, Y.; Wu, D. Modification-Free Carbon Dots as Turn-on Fluorescence Probe for Detection of Organophosphorus Pesticides. Food Chem. 2018, 245, 1176–1182. [Google Scholar] [CrossRef]
- Kumari, A.; Kumar, A.; Sahu, S.K.; Kumar, S. Synthesis of Green Fluorescent Carbon Quantum Dots Using Waste Polyolefins Residue for Cu2+ Ion Sensing and Live Cell Imaging. Sens. Actuators B Chem. 2018, 254, 197–205. [Google Scholar] [CrossRef]
- Aji, M.P.; Wati, A.L.; Priyanto, A.; Karunawan, J.; Nuryadin, B.W.; Wibowo, E.; Marwoto, P. Sulhadi Polymer Carbon Dots from Plastics Waste Upcycling. Environ. Nanotechnol. Monit. Manag. 2018, 9, 136–140. [Google Scholar] [CrossRef]
- Devi, S.; Gupta, R.K.; Paul, A.K.; Kumar, V.; Sachdev, A.; Gopinath, P.; Tyagi, S. Ethylenediamine Mediated Luminescence Enhancement of Pollutant Derivatized Carbon Quantum Dots for Intracellular Trinitrotoluene Detection: Soot to Shine. RSC Adv. 2018, 8, 32684–32694. [Google Scholar] [CrossRef] [Green Version]
- Feng, X.; Zhang, Y. A Simple and Green Synthesis of Carbon Quantum Dots from Coke for White Light-Emitting Devices. RSC Adv. 2019, 9, 33789–33793. [Google Scholar] [CrossRef] [Green Version]
- Hu, Y.; Gao, Z.; Yang, J.; Chen, H.; Han, L. Environmentally Benign Conversion of Waste Polyethylene Terephthalate to Fluorescent Carbon Dots for “on-off-on” Sensing of Ferric and Pyrophosphate Ions. J. Colloid Interface Sci. 2019, 538, 481–488. [Google Scholar] [CrossRef] [PubMed]
- Gunjal, D.B.; Gurav, Y.M.; Gore, A.H.; Naik, V.M.; Waghmare, R.D.; Patil, C.S.; Sohn, D.; Anbhule, P.V.; Shejwal, R.V.; Kolekar, G.B. Nitrogen Doped Waste Tea Residue Derived Carbon Dots for Selective Quantification of Tetracycline in Urine and Pharmaceutical Samples and Yeast Cell Imaging Application. Opt. Mater. 2019, 98, 109484. [Google Scholar] [CrossRef]
- Gunjal, D.B.; Naik, V.M.; Waghmare, R.D.; Patil, C.S.; Shejwal, R.V.; Gore, A.H.; Kolekar, G.B. Sustainable Carbon Nanodots Synthesised from Kitchen Derived Waste Tea Residue for Highly Selective Fluorimetric Recognition of Free Chlorine in Acidic Water: A Waste Utilization Approach. J. Taiwan Inst. Chem. Eng. 2019, 95, 147–154. [Google Scholar] [CrossRef]
- Irmania, N.; Dehvari, K.; Gedda, G.; Tseng, P.J.; Chang, J.Y. Manganese-Doped Green Tea-Derived Carbon Quantum Dots as a Targeted Dual Imaging and Photodynamic Therapy Platform. J. Biomed. Mater. Res. Part B Appl. Biomater. 2020, 108, 1616–1625. [Google Scholar] [CrossRef] [PubMed]
- Zhu, J.; Zhu, F.; Yue, X.; Chen, P.; Sun, Y.; Zhang, L.; Mu, D.; Ke, F. Waste Utilization of Synthetic Carbon Quantum Dots Based on Tea and Peanut Shell. J. Nanomater. 2019, 2019, 7965756. [Google Scholar] [CrossRef] [Green Version]
- Venkatesan, S.; Mariadoss, A.J.; Kathiravan, A.; Muthupandian, A. Fuel Waste to Fluorescent Carbon Dots and Its Multifarious Applications. Sens. Actuators B Chem. 2019, 282, 972–983. [Google Scholar] [CrossRef]
- Park, S.J.; Park, J.Y.; Chung, J.W.; Yang, H.K.; Moon, B.K.; Yi, S.S. Color Tunable Carbon Quantum Dots from Wasted Paper by Different Solvents for Anti-Counterfeiting and Fluorescent Flexible Film. Chem. Eng. J. 2020, 383, 123200. [Google Scholar] [CrossRef]
- Chaudhary, S.; Kumari, M.; Chauhan, P.; Ram Chaudhary, G. Upcycling of Plastic Waste into Fluorescent Carbon Dots: An Environmentally Viable Transformation to Biocompatible C-Dots with Potential Prospective in Analytical Applications. Waste Manag. 2021, 120, 675–686. [Google Scholar] [CrossRef]
- Lauria, A.; Lizundia, E. Luminescent Carbon Dots Obtained from Polymeric Waste. J. Clean. Prod. 2020, 262, 121288. [Google Scholar] [CrossRef]
- Ma, J.; Zhang, L.; Chen, X.; Su, R.; Shi, Q.; Zhao, S.; Xu, Q.; Xu, C. Mass Production of Highly Fluorescent Full Color Carbon Dots from the Petroleum Coke. Chin. Chem. Lett. 2020, 32, 1532–1536. [Google Scholar] [CrossRef]
- Liang, Y.M.; Yang, H.; Zhou, B.; Chen, Y.; Yang, M.; Wei, K.S.; Yan, X.F.; Kang, C. Waste Tobacco Leaves Derived Carbon Dots for Tetracycline Detection: Improving Quantitative Accuracy with the Aid of Chemometric Model. Anal. Chim. Acta 2022, 1191, 339269. [Google Scholar] [CrossRef]
- Chen, B.B.; Liu, Z.X.; Zou, H.Y.; Huang, C.Z. Highly Selective Detection of 2,4,6-Trinitrophenol by Using Newly Developed Terbium-Doped Blue Carbon Dots. Analyst 2013, 141, 2676–2681. [Google Scholar] [CrossRef]
- Dong, Y.; Pang, H.; Yang, H.B.; Guo, C.; Shao, J.; Chi, Y.; Li, C.M.; Yu, T. Carbon-Based Dots Co-Doped with Nitrogen and Sulfur for High Quantum Yield and Excitation-Independent Emission. Angew. Chem. Int. Ed. 2013, 52, 7800–7804. [Google Scholar] [CrossRef] [PubMed]
- Niu, Q.; Gao, K.; Lin, Z.; Wu, W. Amine-Capped Carbon Dots as a Nanosensor for Sensitive and Selective Detection of Picric Acid in Aqueous Solution via Electrostatic Interaction. Anal. Methods 2013, 5, 6228–6233. [Google Scholar] [CrossRef]
- Ahmed, G.H.G.; Laíño, R.B.; Calzón, J.A.G.; García, M.E.D. Highly Fluorescent Carbon Dots as Nanoprobes for Sensitive and Selective Determination of 4-Nitrophenol in Surface Waters. Microchim. Acta 2015, 182, 51–59. [Google Scholar] [CrossRef]
- Zhang, H.; Chen, Y.; Liang, M.; Xu, L.; Qi, S.; Chen, H.; Chen, X. Solid-Phase Synthesis of Highly Fluorescent Nitrogen-Doped Carbon Dots for Sensitive and Selective Probing Ferric Ions in Living Cells. Anal. Chem. 2014, 86, 9846–9852. [Google Scholar] [CrossRef] [PubMed]
- Zhao, L.; Geng, F.; Di, F.; Guo, L.H.; Wan, B.; Yang, Y.; Zhang, H.; Sun, G. Polyamine-Functionalized Carbon Nanodots: A Novel Chemiluminescence Probe for Selective Detection of Iron(Iii) Ions. RSC Adv. 2014, 4, 45768–45771. [Google Scholar] [CrossRef]
- Zhang, R.; Chen, W. Nitrogen-Doped Carbon Quantum Dots: Facile Synthesis and Application as a “Turn-off” Fluorescent Probe for Detection of Hg2+ Ions. Biosens. Bioelectron. 2013, 55, 83–90. [Google Scholar] [CrossRef]
- Zhang, P.; Xue, Z.; Luo, D.; Yu, W.; Guo, Z.; Wang, T. Dual-Peak Electrogenerated Chemiluminescence of Carbon Dots for Iron Ions Detection. Anal. Chem. 2014, 86, 5620–5623. [Google Scholar] [CrossRef]
- Zhang, L.; Han, Y.; Zhu, J.; Zhai, Y.; Dong, S. Simple and Sensitive Fluorescent and Electrochemical Trinitrotoluene Sensors Based on Aqueous Carbon Dots. Anal. Chem. 2015, 87, 2033–2036. [Google Scholar] [CrossRef]
- Hou, J.; Dong, J.; Zhu, H.; Teng, X.; Ai, S.; Mang, M. A Simple and Sensitive Fluorescent Sensor for Methyl Parathion Based on L-Tyrosine Methyl Ester Functionalized Carbon Dots. Biosens. Bioelectron. 2015, 68, 20–26. [Google Scholar] [CrossRef] [PubMed]
- Cui, X.; Zhu, L.; Wu, J.; Hou, Y.; Wang, P.; Wang, Z.; Yang, M. A Fluorescent Biosensor Based on Carbon Dots-Labeled Oligodeoxyribonucleotide and Graphene Oxide for Mercury (II) Detection. Biosens. Bioelectron. 2015, 63, 506–512. [Google Scholar] [CrossRef] [PubMed]
- Wang, B.; Song, A.; Feng, L.; Ruan, H.; Li, H.; Dong, S.; Hao, J. Tunable Amphiphilicity and Multifunctional Applications of Ionic-Liquid-Modified Carbon Quantum Dots. ACS Appl. Mater. Interfaces 2015, 7, 6919–6925. [Google Scholar] [CrossRef] [PubMed]
- Liu, L.; Feng, F.; Paau, M.C.; Hu, Q.; Liu, Y.; Chen, Z.; Choic, M.M.F. Carbon Dots Isolated from Chromatographic Fractions for Sensing Applications. RSC Adv. 2015, 5, 106838–106847. [Google Scholar] [CrossRef]
- Li, L.; Yu, B.; You, T. Nitrogen and Sulfur Co-Doped Carbon Dots for Highly Selective and Sensitive Detection of Hg (II) Ions. Biosens. Bioelectron. 2015, 74, 263–269. [Google Scholar] [CrossRef]
- Wang, Y.; Kim, S.H.; Feng, L. Highly Luminescent N, S- Co-Doped Carbon Dots and Their Direct Use as Mercury(II) Sensor. Anal. Chim. Acta 2015, 890, 134–142. [Google Scholar] [CrossRef]
- Liu, Y.; Liao, M.; He, X.; Liu, X.; Kou, X.; Xiao, D. One-Step Synthesis of Highly Luminescent Nitrogen-Doped Carbon Dots for Selective and Sensitive Detection of Mercury(Ii) Ions and Cellular Imaging. Anal. Sci. 2015, 31, 971–977. [Google Scholar] [CrossRef] [Green Version]
- Hou, Y.; Lu, Q.; Deng, J.; Li, H.; Zhang, Y. One-Pot Electrochemical Synthesis of Functionalized Fluorescent Carbon Dots and Their Selective Sensing for Mercury Ion. Anal. Chim. Acta 2015, 866, 69–74. [Google Scholar] [CrossRef]
- Wang, J.; Zhang, P.; Huang, C.; Liu, G.; Leung, K.C.F.; Wáng, Y.X.J. High Performance Photoluminescent Carbon Dots for in Vitro and in Vivo Bioimaging: Effect of Nitrogen Doping Ratios. Langmuir 2015, 31, 8063–8073. [Google Scholar] [CrossRef]
- Schneider, J.; Reckmeier, C.J.; Xiong, Y.; Von Seckendorff, M.; Susha, A.S.; Kasak, P.; Rogach, A.L. Molecular Fluorescence in Citric Acid-Based Carbon Dots. J. Phys. Chem. C 2016, 121, 2014–2022. [Google Scholar] [CrossRef]
- Xu, S.; Lu, H. Mesoporous Structured MIPs@CDs Fluorescence Sensor for Highly Sensitive Detection of TNT. Biosens. Bioelectron. 2016, 85, 950–956. [Google Scholar] [CrossRef] [PubMed]
- Dai, J.; Zambrana, M.; Fidalgo, M.; Dai, J.; Zambrana, M. Amino-Functionalized Fluorescent Carbon Dots for Chemical Sensing Jingjing. MRS Adv. 2016, 1, 1365–1370. [Google Scholar] [CrossRef]
- He, J.; Zhang, H.; Zou, J.; Liu, Y.; Zhuang, J.; Xiao, Y.; Lei, B. Carbon Dots-Based Fluorescent Probe for “off-on” Sensing of Hg(II) and I-. Biosens. Bioelectron. 2016, 79, 531–535. [Google Scholar] [CrossRef] [PubMed]
- Zhao, Z.; Zhang, J.; Wang, Y.; Chen, L.; Zhang, Y. Hydrothermal Synthesis of Fluorescent Nitrogen-Doped Carbon Quantum Dots from Ascorbic Acid and Valine for Selective Determination of Picric Acid in Water Samples. Int. J. Environ. Anal. Chem. 2016, 96, 1402–1413. [Google Scholar] [CrossRef]
- He, G.; Xu, M.; Shu, M.; Li, X.; Yang, Z.; Zhang, L.; Su, Y.; Hu, N.; Zhang, Y. Rapid Solid-Phase Microwave Synthesis of Highly Photoluminescent Nitrogen-Doped Carbon Dots for Fe3+ Detection and Cellular Bioimaging. Nanotechnology 2016, 27, 395706. [Google Scholar] [CrossRef] [Green Version]
- Fan, Y.Z.; Zhang, Y.; Li, N.; Liu, S.G.; Liu, T.; Li, N.B.; Luo, H.Q. A Facile Synthesis of Water-Soluble Carbon Dots as a Label-Free Fluorescent Probe for Rapid, Selective and Sensitive Detection of Picric Acid. Sens. Actuators B Chem. 2017, 240, 949–955. [Google Scholar] [CrossRef]
- Chang, M.M.F.; Ginjom, I.R.; Ng, S.M. Single-Shot ‘Turn-off’ Optical Probe for Rapid Detection of Paraoxon-Ethyl Pesticide on Vegetable Utilising Fluorescence Carbon Dots. Sens. Actuators B Chem. 2017, 242, 1050–1056. [Google Scholar] [CrossRef]
- Song, W.; Zhang, H.J.; Liu, Y.H.; Ren, C.L.; Chen, H.L. A New Fluorescence Probing Strategy for the Detection of Parathion-Methyl Based on N-Doped Carbon Dots and Methyl Parathion Hydrolase. Chin. Chem. Lett. 2017, 28, 1675–1680. [Google Scholar] [CrossRef]
- Tian, X.; Peng, H.; Li, Y.; Yang, C.; Zhou, Z.; Wang, Y. Highly Sensitive and Selective Paper Sensor Based on Carbon Quantum Dots for Visual Detection of TNT Residues in Groundwater. Sens. Actuators B Chem. 2017, 243, 1002–1009. [Google Scholar] [CrossRef]
- Liu, T.; Cui, Z.W.; Zhou, J.; Wang, Y.; Zou, Z.G. Synthesis of Pyridinic-Rich N, S Co-Doped Carbon Quantum Dots as Effective Enzyme Mimics. Nanoscale Res. Lett. 2017, 12, 375. [Google Scholar] [CrossRef] [Green Version]
- Liu, H.; Zhang, Y.; Liu, J.H.; Hou, P.; Zhou, J.; Huang, C.Z. Preparation of Nitrogen-Doped Carbon Dots with High Quantum Yield from: Bombyx Mori Silk for Fe(III) Ions Detection. RSC Adv. 2017, 7, 50584–50590. [Google Scholar] [CrossRef] [Green Version]
- Liu, Y.; Liu, Y.; Lee, J.; Lee, J.H.; Park, M.; Kim, H.Y. Rational Designed Strategy to Dispel Mutual Interference of Mercuric and Ferric Ions towards Robust, PH-Stable Fluorescent Carbon Nanodots. Analyst 2017, 142, 1149–1156. [Google Scholar] [CrossRef] [PubMed]
- Huang, H.; Weng, Y.; Zheng, L.; Yao, B.; Weng, W.; Lin, X. Nitrogen-Doped Carbon Quantum Dots as Fluorescent Probe for “off-on” Detection of Mercury Ions, L-Cysteine and Iodide Ions. J. Colloid Interface Sci. 2017, 506, 373–378. [Google Scholar] [CrossRef] [PubMed]
- Tian, Z.; Zhang, X.; Li, D.; Zhou, D.; Jing, P.; Shen, D.; Qu, S.; Zboril, R.; Rogach, A.L. Full-Color Inorganic Carbon Dot Phosphors for White-Light-Emitting Diodes. Adv. Opt. Mater. 2017, 5, 1700416. [Google Scholar] [CrossRef]
- Thongsai, N.; Nagae, Y.; Hirai, T.; Takahara, A.; Uchiyama, T.; Kamitani, K.; Paoprasert, P. Multifunctional Nitrogen-Doped Carbon Dots from Maleic Anhydride and Tetraethylenepentamine via Pyrolysis for Sensing, Adsorbance, and Imaging Applications. Sens. Actuators B Chem. 2017, 253, 1026–1033. [Google Scholar] [CrossRef]
- Huang, Y.; Cheng, Z. Simple and Green Synthesis of Boron-, Sulfur-, and Nitrogen-Co-Doped Carbon Dots as Fluorescent Probe for Selective and Sensitive Detection of Sunset Yellow. Nano 2017, 12, 1750123. [Google Scholar] [CrossRef]
- Du, Q.; Zheng, J.; Wang, J.; Yang, Y.; Liu, X. The Synthesis of Green Fluorescent Carbon Dots for Warm White LEDs. RSC Adv. 2018, 8, 19585–19595. [Google Scholar] [CrossRef] [Green Version]
- Chen, L.; Zhang, J. Carbon Dots with Tunable Photoluminescence Properties. In Proceedings of the 2nd International Conference of Theoretical and Applied Nanoscience and Nanotechnology, Niagara Falls, ON, Canada, 10–12 June 2018; pp. 1–6. [Google Scholar] [CrossRef]
- Yu, T.; Wang, H.; Guo, C.; Zhai, Y.; Yang, J.; Yuan, J. A Rapid Microwave Synthesis of Green-Emissive Carbon Dots with Solid-State Fluorescence and PH-Sensitive Properties. R. Soc. Open Sci. 2018, 5, 180245. [Google Scholar] [CrossRef] [Green Version]
- Ren, G.; Yu, L.; Zhu, B.; Tang, M.; Chai, F.; Wang, C.; Su, Z. Orange Emissive Carbon Dots for Colorimetric and Fluorescent Sensing of 2,4,6-Trinitrophenol by Fluorescence Conversion. RSC Adv. 2018, 8, 16095–16102. [Google Scholar] [CrossRef] [Green Version]
- Zhang, L.; Chang, J.; Su, R.; Huang, R.; Qi, W.; He, Z. Carbon Dots and Quantum Dots-Based Nanohybrid as a Ratiometric Fluorescent Probe for Fe3+ and Phytic Acid Sensing. Chem. Eng. Trans. 2018, 70, 2065–2070. [Google Scholar] [CrossRef]
- Ma, Y.; Mei, J.; Bai, J.; Chen, X.; Ren, L. Ratiometric Fluorescent Nanosensor Based on Carbon Dots for the Detection of Mercury Ion. Mater. Res. Express 2018, 5, 055605. [Google Scholar] [CrossRef]
- Tabaraki, R.; Abdi, O. Green and Simple Turn off/on Fluorescence Sensor for Mercury (II), Cysteine and Histidine. J. Mol. Liq. 2018, 251, 77–82. [Google Scholar] [CrossRef]
- Li, H.; Yan, X.; Lu, G.; Su, X. Carbon Dot-Based Bioplatform for Dual Colorimetric and Fluorometric Sensing of Organophosphate Pesticides. Sens. Actuators B Chem. 2018, 260, 563–570. [Google Scholar] [CrossRef]
- Yan, X.; Song, Y.; Zhu, C.; Li, H.; Du, D.; Su, X.; Lin, Y. MnO2 Nanosheet-Carbon Dots Sensing Platform for Sensitive Detection of Organophosphorus Pesticides. Anal. Chem. 2018, 90, 2618–2624. [Google Scholar] [CrossRef]
- Prathumsuwan, T.; Jamnongsong, S.; Sampattavanich, S.; Paoprasert, P. Preparation of Carbon Dots from Succinic Acid and Glycerol as Ferrous Ion and Hydrogen Peroxide Dual-Mode Sensors and for Cell Imaging. Opt. Mater. 2018, 86, 517–529. [Google Scholar] [CrossRef]
- Jiang, K.; Wang, Y.; Cai, C.; Lin, H. Conversion of Carbon Dots from Fluorescence to Ultralong Room-Temperature Phosphorescence by Heating for Security Applications. Adv. Mater. 2018, 30, e1800783. [Google Scholar] [CrossRef]
- Jiang, K.; Wang, Y.; Gao, X.; Cai, C.; Lin, H. Facile, Quick, and Gram-Scale Synthesis of Ultralong-Lifetime Room-Temperature-Phosphorescent Carbon Dots by Microwave Irradiation. Angew. Chem. Int. Ed. 2018, 57, 6216–6220. [Google Scholar] [CrossRef]
- Shamsipur, M.; Molaei, K.; Molaabasi, F.; Alipour, M.; Alizadeh, N.; Hosseinkhani, S.; Hosseini, M. Facile Preparation and Characterization of New Green Emitting Carbon Dots for Sensitive and Selective off/on Detection of Fe3+ Ion and Ascorbic Acid in Water and Urine Samples and Intracellular Imaging in Living Cells. Talanta 2018, 183, 122–130. [Google Scholar] [CrossRef]
- Ren, G.; Meng, Y.; Zhang, Q.; Tang, M.; Zhu, B.; Chai, F.; Wang, C.; Su, Z. Nitrogen-Doped Carbon Dots for the Detection of Mercury Ions in Living Cells and Visualization of Latent Fingerprints. New J. Chem. 2018, 42, 6824–6830. [Google Scholar] [CrossRef]
- Ludmerczki, R.; Mura, S.; Carbonaro, C.M.; Mandity, I.M.; Carraro, M.; Senes, N.; Garroni, S.; Granozzi, G.; Calvillo, L.; Marras, S.; et al. Carbon Dots from Citric Acid and Its Intermediates Formed by Thermal Decomposition. Chem.-A Eur. J. 2019, 25, 11963–11974. [Google Scholar] [CrossRef]
- Hu, G.; Lei, B.; Jiao, X.; Wu, S.; Zhang, X.; Zhuang, J.; Liu, X.; Hu, C.; Liu, Y. Synthesis of Modified Carbon Dots with Performance of Ultraviolet Absorption Used in Sunscreen. Opt. Express 2019, 27, 7629. [Google Scholar] [CrossRef] [PubMed]
- Zhao, Y.Y.; Qu, S.N.; Feng, X.Y.; Xu, J.C.; Yang, Y.; Su, S.C.; Wang, S.P.; Ng, K.W. Tailoring the Photoluminescence Excitation Dependence of the Carbon Dots via an Alkali Treatment. J. Phys. Chem. Lett. 2019, 10, 4596–4602. [Google Scholar] [CrossRef] [PubMed]
- Zhao, X.; Qi, T.; Yang, M.; Zhang, W.; Kong, C.; Hao, M.; Wang, Y.; Zhang, H.; Yang, B.; Yang, J.; et al. Synthesis of Dual Functional Procaine-Derived Carbon Dots for Bioimaging and Anticancer Therapy. Nanomedicine 2020, 15, 677–689. [Google Scholar] [CrossRef] [PubMed]
- Wang, M.; Gao, M.; Deng, L.; Kang, X.; Yang, L.; Quan, T.; Xia, Z.; Gao, D. Composite Material Based on Carbon Dots and Molecularly Imprinted Polymers: A Facile Probe for Fluorescent Detection of 4-Nitrophenol. Nano 2020, 15, 2050105. [Google Scholar] [CrossRef]
- Chan, K.K.; Yap, S.H.K.; Yong, K.T. Solid State Carbon Dots-Based Sensor Using Optical Microfiber for Ferric Ion Detection. In Proceedings of the 2019 IEEE International Conference on Sensors and Nanotechnology, Penang, Malaysia, 24–25 July 2019; pp. 1–4. [Google Scholar] [CrossRef]
- Yang, H.; He, L.; Pan, S.; Liu, H.; Hu, X. Nitrogen-Doped Fluorescent Carbon Dots for Highly Sensitive and Selective Detection of Tannic Acid. Spectrochim. Acta Part A Mol. Biomol. Spectrosc. 2019, 210, 111–119. [Google Scholar] [CrossRef]
- Sahiner, N.; Suner, S.S.; Sahiner, M.; Silan, C. Nitrogen and Sulfur Doped Carbon Dots from Amino Acids for Potential Biomedical Applications. J. Fluoresc. 2019, 29, 1191–1200. [Google Scholar] [CrossRef]
- Pu, Z.F.; Wen, Q.L.; Yang, Y.J.; Cui, X.M.; Ling, J.; Liu, P.; Cao, Q.E. Fluorescent Carbon Quantum Dots Synthesized Using Phenylalanine and Citric Acid for Selective Detection of Fe3+ Ions. Spectrochim. Acta Part A Mol. Biomol. Spectrosc. 2020, 229, 117944. [Google Scholar] [CrossRef]
- Wang, X.; Liu, Y.; Zhou, Q.; Sheng, X.; Sun, Y.; Zhou, B.; Zhao, J.; Guo, J. A Reliable and Facile Fluorescent Sensor from Carbon Dots for Sensing 2,4,6-Trinitrophenol Based on Inner Filter Effect. Sci. Total Environ. 2020, 720, 137680. [Google Scholar] [CrossRef]
- Gu, S.; Hsieh, C.T.; Yuan, C.Y.; Gandomi, Y.A.; Chang, J.K.; Fu, C.C.; Yang, J.W.; Juang, R.S. Fluorescence of Functionalized Graphene Quantum Dots Prepared from Infrared-Assisted Pyrolysis of Citric Acid and Urea. J. Lumin. 2020, 217, 116774. [Google Scholar] [CrossRef]
- Strauss, V.; Wang, H.; Delacroix, S.; Ledendecker, M.; Wessig, P. Carbon Nanodots Revised: The Thermal Citric Acid/Urea Reaction. Chem. Sci. 2020, 11, 8256–8266. [Google Scholar] [CrossRef]
- Li, Y.; Yang, Y.; Jiang, Y.; Han, S. Detection of Tannic Acid Exploiting Carbon Dots Enhanced Hydrogen Peroxide/Potassium Ferricyanide Chemiluminescence. Microchem. J. 2020, 157, 105113. [Google Scholar] [CrossRef]
- Sutanto, H.; Alkian, I.; Romanda, N.; Lewa, I.W.L.; Marhaendrajaya, I.; Triadyaksa, P. High Green-Emission Carbon Dots and Its Optical Properties: Microwave Power Effect. AIP Adv. 2020, 10, 055008. [Google Scholar] [CrossRef]
- Chahal, S.; Yousefi, N.; Tufenkji, N. Green Synthesis of High Quantum Yield Carbon Dots from Phenylalanine and Citric Acid: Role of Stoichiometry and Nitrogen Doping. ACS Sustain. Chem. Eng. 2020, 8, 5566–5575. [Google Scholar] [CrossRef]
- Arab, S.; Masoum, S.; Seyed Hosseini, E. Engineering the Synthesis of Luminescent Carbon Dots with Ultra High-Quantum Yield Using Experimental Design Approach in Order to Develop Sensing Applications. IEEE Sens. J. 2020, 20, 1705–1711. [Google Scholar] [CrossRef]
- He, X.; Li, Y.; Yang, C.; Lu, L.; Nie, Y.; Tian, X. Carbon Dots–MnO2 Nanocomposites for As( Iii ) Detection in Groundwater with High Sensitivity and Selectivity. Anal. Methods 2020, 12, 5572–5580. [Google Scholar] [CrossRef]
- Bhatt, M.; Bhatt, S.; Vyas, G.; Raval, I.H.; Haldar, S.; Paul, P. Water-Dispersible Fluorescent Carbon Dots as Bioimaging Agents and Probes for Hg2+ and Cu2+ Ions. ACS Appl. Nano Mater. 2020, 3, 7096–7104. [Google Scholar] [CrossRef]
- Sun, Y.; Zheng, S.; Liu, L.; Kong, Y.; Zhang, A.; Xu, K.; Han, C. The Cost-Effective Preparation of Green Fluorescent Carbon Dots for Bioimaging and Enhanced Intracellular Drug Delivery. Nanoscale Res. Lett. 2020, 15, 55. [Google Scholar] [CrossRef] [Green Version]
- Luo, M.; Wei, J.; Zhao, Y.; Sun, Y.; Liang, H.; Wang, S.; Li, P. Fluorescent and Visual Detection of Methyl-Paraoxon by Using Boron-and Nitrogen-Doped Carbon Dots. Microchem. J. 2020, 154, 104547. [Google Scholar] [CrossRef]
- Li, D.; Chen, C.; Guo, X.; Liu, C.; Yang, W. A Simple Electrochemiluminesecence Aptasenor Using a GCE/NCQDs/Aptamers for Detection of Pb. Environ. Technol. 2021, 43, 2270–2277. [Google Scholar] [CrossRef]
- Supchocksoonthorn, P.; Hanchaina, R.; Sinoy, M.C.A.; de Luna, M.D.G.; Kangsamaksin, T.; Paoprasert, P. Novel Solution- and Paper-Based Sensors Based on Label-Free Fluorescent Carbon Dots for the Selective Detection of Pyrimethanil. Appl. Surf. Sci. 2021, 564, 150372. [Google Scholar] [CrossRef]
- Wang, S.; Chen, H.; Xie, H.; Wei, L.; Xu, L.; Zhang, L.; Lan, W.; Zhou, C.; She, Y.; Fu, H. A Novel Thioctic Acid-Carbon Dots Fluorescence Sensor for the Detection of Hg2+ and Thiophanate Methyl via S-Hg Affinity. Food Chem. 2021, 346, 128923. [Google Scholar] [CrossRef] [PubMed]
- Liu, Q.; Dong, Z.; Hao, A.; Guo, X.; Dong, W. Synthesis of Highly Fluorescent Carbon Dots as a Dual-Excitation Rationmetric Fluorescent Probe for the Fast Detection of Chlorogenic Acid. Talanta 2021, 221, 121372. [Google Scholar] [CrossRef] [PubMed]
- Tang, X.; Yu, H.; Bui, B.; Wang, L.; Xing, C.; Wang, S.; Chen, M.; Hu, Z.; Chen, W. Nitrogen-Doped Fluorescence Carbon Dots as Multi-Mechanism Detection for Iodide and Curcumin in Biological and Food Samples. Bioact. Mater. 2021, 6, 1541–1554. [Google Scholar] [CrossRef] [PubMed]
- Vidya, T.; Anupama, M.; Muhammed, S.; Joseph, J.; Anappara, A.A. Multi-Functional Carbon Dots for Visual Detection of Picric Acid and White-Light Emission. Mater. Res. Bull. 2021, 138, 111223. [Google Scholar] [CrossRef]
- Mu, X.; Wu, M.; Zhang, B.; Liu, X.; Xu, S.; Huang, Y.; Wang, X.; Song, D.; Ma, P.; Sun, Y. A Sensitive “off-on” Carbon Dots-Ag Nanoparticles Fluorescent Probe for Cysteamine Detection via the Inner Filter Effect. Talanta 2021, 221, 121463. [Google Scholar] [CrossRef]
- Zairov, R.R.; Dovzhenko, A.P.; Sarkanich, K.A.; Nizameev, I.R.; Luzhetskiy, A.V.; Sudakova, S.N.; Podyachev, S.N.; Burilov, V.A.; Vatsouro, I.M.; Vomiero, A.; et al. Single Excited Dual Band Luminescent Hybrid Carbon Dots-Terbium Chelate Nanothermometer. Nanomaterials 2021, 11, 3080. [Google Scholar] [CrossRef]
- Yi, Z.; Li, X.; Zhang, H.; Ji, X.; Sun, W.; Yu, Y.; Liu, Y.; Huang, J.; Sarshar, Z.; Sain, M. High Quantum Yield Photoluminescent N-Doped Carbon Dots for Switch Sensing and Imaging. Talanta 2021, 222, 121663. [Google Scholar] [CrossRef]
- Ge, M.; Huang, X.; Ni, J.; Han, Y.; Zhang, C.; Li, S.; Cao, J.; Li, J.; Chen, Z.; Han, S. One-Step Synthesis of Self-Quenching-Resistant Biomass-Based Solid-State Fluorescent Carbon Dots with High Yield for White Lighting Emitting Diodes. Dye. Pigment. 2021, 185, 108953. [Google Scholar] [CrossRef]
- Ma, W.; Wang, B.; Yang, Y.; Li, J. Photoluminescent Chiral Carbon Dots Derived from Glutamine. Chin. Chem. Lett. 2021, 32, 3916–3920. [Google Scholar] [CrossRef]
- Xu, X.; Mo, L.; Li, W.; Li, Y.; Lei, B.; Zhang, X.; Zhuang, J.; Hu, C.; Liu, Y. Red, Green and Blue Aggregation-Induced Emissive Carbon Dots. Chin. Chem. Lett. 2021, 32, 3927–3930. [Google Scholar] [CrossRef]
- Ji, Y.; Zou, X.; Wang, W.; Wang, T.; Zhang, S.; Gong, Z. Co-Doped S, N-Carbon Dots and Its Fluorescent Film Sensors for Rapid Detection of Cr (VI) and Ascorbic Acid. Microchem. J. 2021, 167, 106284. [Google Scholar] [CrossRef]
- Liu, Y.; Chen, P.; Yu, K.; Wu, Z.; Wang, N.; Yu, X. Nitrogen and Sulfur Co-Doped Carbon Dots: Facile Synthesis and Multifunctional Applications for PH Sensing, Temperature Sensing and RNA-Selective Imaging. Microchem. J. 2021, 168, 106248. [Google Scholar] [CrossRef]
- Yang, Z.; Liu, Y.; Lu, C.; Yue, G.; Wang, Y.; Rao, H.; Zhang, W.; Lu, Z.; Wang, X. One-Pot Synthesis of CeO2-Carbon Dots with Enhanced Peroxidase-like Activity and Carbon Dots for Ratiometric Fluorescence Detection of H2O2 and Cholesterol. J. Alloys Compd. 2021, 862, 158323. [Google Scholar] [CrossRef]
- Şen, F.B.; Beğiç, N.; Bener, M.; Apak, R. Fluorescence Turn-off Sensing of TNT by Polyethylenimine Capped Carbon Quantum Dots. Spectrochim. Acta Part A Mol. Biomol. Spectrosc. 2022, 271, 120884. [Google Scholar] [CrossRef] [PubMed]
- Huo, X.; Shen, H.; Xu, Y.; Shao, J.; Liu, R.; Zhang, Z. Fluorescence Properties of Carbon Dots Synthesized by Different Solvents for PH Detector. Opt. Mater. 2022, 123, 111889. [Google Scholar] [CrossRef]
- Wang, Q.; Zheng, H.; Long, Y.; Zhang, L.; Gao, M.; Bai, W. Microwave-Hydrothermal Synthesis of Fluorescent Carbon Dots from Graphite Oxide. Carbon 2011, 49, 3134–3140. [Google Scholar] [CrossRef]
- Liu, R.; Li, H.; Kong, W.; Liu, J.; Liu, Y.; Tong, C.; Zhang, X.; Kang, Z. Ultra-Sensitive and Selective Hg2+ Detection Based on Fluorescent Carbon Dots. Mater. Res. Bull. 2013, 48, 2529–2534. [Google Scholar] [CrossRef]
- Shi, J.; Lu, C.; Yan, D.; Ma, L. High Selectivity Sensing of Cobalt in HepG2 Cells Based on Necklace Model Microenvironment-Modulated Carbon Dot-Improved Chemiluminescence in Fenton-like System. Biosens. Bioelectron. 2013, 45, 58–64. [Google Scholar] [CrossRef]
- Xu, Y.; Wu, M.; Feng, X.Z.; Yin, X.B.; He, X.W.; Zhang, Y.K. Reduced Carbon Dots versus Oxidized Carbon Dots: Photo- and Electrochemiluminescence Investigations for Selected Applications. Chem.-A Eur. J. 2013, 19, 6282–6288. [Google Scholar] [CrossRef]
- Dong, X.; Su, Y.; Geng, H.; Li, Z.; Yang, C.; Li, X.; Zhang, Y. Fast One-Step Synthesis of N-Doped Carbon Dots by Pyrolyzing Ethanolamine. J. Mater. Chem. C 2014, 2, 7477–7481. [Google Scholar] [CrossRef]
- Huang, L.; Yang, S.; Chen, L.; Chen, S. Hydrothermal Synthesis of Fluorescent Carbon Dots towards Ion Response and Silk Screen Patterns. Chem. Lett. 2015, 44, 1251–1253. [Google Scholar] [CrossRef]
- Ahmed, G.H.G.; Laíño, R.B.; Calzón, J.A.G.; García, M.E.D. Fluorescent Carbon Nanodots for Sensitive and Selective Detection of Tannic Acid in Wines. Talanta 2015, 132, 252–257. [Google Scholar] [CrossRef] [Green Version]
- Hu, Y.; Yang, J.; Jia, L.; Yu, J.S. Ethanol in Aqueous Hydrogen Peroxide Solution: Hydrothermal Synthesis of Highly Photoluminescent Carbon Dots as Multifunctional Nanosensors. Carbon 2015, 93, 999–1007. [Google Scholar] [CrossRef]
- Zou, W.S.; Ji, Y.J.; Wang, X.F.; Zhao, Q.C.; Zhang, J.; Shao, Q.; Liu, J.; Wang, F.; Wang, Y.Q. Insecticide as a Precursor to Prepare Highly Bright Carbon Dots for Patterns Printing and Bioimaging: A New Pathway for Making Poison Profitable. Chem. Eng. J. 2016, 294, 323–332. [Google Scholar] [CrossRef]
- Wu, Z.; Feng, M.; Chen, X.; Tang, X. N-Dots as a Photoluminescent Probe for the Rapid and Selective Detection of Hg2+ and Ag+ in Aqueous Solution. J. Mater. Chem. B 2016, 4, 2086–2089. [Google Scholar] [CrossRef]
- Campos, B.B.; Contreras-Cáceres, R.; Bandosz, T.J.; Jiménez-Jiménez, J.; Rodríguez-Castellón, E.; Esteves da Silva, J.C.G.; Algarra, M. Carbon Dots as Fluorescent Sensor for Detection of Explosive Nitrocompounds. Carbon 2016, 106, 171–178. [Google Scholar] [CrossRef]
- Li, H.; Sun, C.; Vijayaraghavan, R.; Zhou, F.; Zhang, X.; MacFarlane, D.R. Long Lifetime Photoluminescence in N, S Co-Doped Carbon Quantum Dots from an Ionic Liquid and Their Applications in Ultrasensitive Detection of Pesticides. Carbon 2016, 104, 33–39. [Google Scholar] [CrossRef]
- Liu, X.; Pang, J.; Xu, F.; Zhang, X. Simple Approach to Synthesize Amino-Functionalized Carbon Dots by Carbonization of Chitosan. Sci. Rep. 2016, 6, 31100. [Google Scholar] [CrossRef] [Green Version]
- Wu, X.; Song, Y.; Yan, X.; Zhu, C.; Ma, Y.; Du, D.; Lin, Y. Carbon Quantum Dots as Fluorescence Resonance Energy Transfer Sensors for Organophosphate Pesticides Determination. Biosens. Bioelectron. 2017, 94, 292–297. [Google Scholar] [CrossRef]
- Wu, P.; Li, W.; Wu, Q.; Liu, Y.; Liu, S. Hydrothermal Synthesis of Nitrogen-Doped Carbon Quantum Dots from Microcrystalline Cellulose for the Detection of Fe3+ Ions in an Acidic Environment. RSC Adv. 2017, 7, 44144–44153. [Google Scholar] [CrossRef] [Green Version]
- Mohapatra, S.; Bera, M.K.; Das, R.K. Rapid “Turn-on” Detection of Atrazine Using Highly Luminescent N-Doped Carbon Quantum Dot. Sens. Actuators B Chem. 2018, 263, 459–468. [Google Scholar] [CrossRef]
- Devi, S.; Gupta, R.K.; Paul, A.K.; Tyagi, S. Waste Carbon Paper Derivatized Carbon Quantum Dots/(3- Aminopropyl)Triethoxysilane Based Fluorescent Probe for Trinitrotoluene Detection. Mater. Res. Express 2019, 6, 1–12. [Google Scholar] [CrossRef]
- Feng, Y.; Tan, L.; Tang, Q.; Zhong, W.; Yang, X. Synthesis of Carbon Dots from PEG6000 and Papain for Fluorescent and Doxycycline Sensing. Nano 2018, 13, 1–9. [Google Scholar] [CrossRef]
- Siddique, A.B.; Pramanick, A.K.; Chatterjee, S.; Ray, M. Amorphous Carbon Dots and Their Remarkable Ability to Detect 2,4,6-Trinitrophenol. Sci. Rep. 2018, 8, 9770. [Google Scholar] [CrossRef]
- Zhao, D.; Liu, X.; Wei, C.; Qu, Y.; Xiao, X.; Cheng, H. One-Step Synthesis of Red-Emitting Carbon Dots: Via a Solvothermal Method and Its Application in the Detection of Methylene Blue. RSC Adv. 2019, 9, 29533–29540. [Google Scholar] [CrossRef] [Green Version]
- Fang, J.; Zhuo, S.; Zhu, C. Fluorescent Sensing Platform for the Detection of P-Nitrophenol Based on Cu-Doped Carbon Dots. Opt. Mater. 2019, 97, 109396. [Google Scholar] [CrossRef]
- Xu, Y.; Yan, L.; Yue, M.; Yu, Y. Green Hydrothermal Synthesis of Fluorescent Carbon Dots from Glucose and Taurine for Fe3+ and PH Sensing. Nano 2019, 14, 1950014. [Google Scholar] [CrossRef]
- Gogoi, J.; Chowdhury, D. Calcium-Modified Carbon Dots Derived from Polyethylene Glycol: Fluorescence-Based Detection of Trifluralin Herbicide. J. Mater. Sci. 2020, 55, 11597–11608. [Google Scholar] [CrossRef]
- Saravanan, A.; Maruthapandi, M.; Das, P.; Ganguly, S.; Margel, S.; Luong, J.H.T.; Gedanken, A. Applications of N-Doped Carbon Dots as Antimicrobial Agents, Antibiotic Carriers, and Selective Fluorescent Probes for Nitro Explosives. ACS Appl. Bio Mater. 2020, 3, 8023–8031. [Google Scholar] [CrossRef]
- Tammina, S.K.; Yang, Y. Highly Sensitive and Selective Detection of 4-Nitrophenol, and on-off-on Fluorescence Sensor for Cr (VI) and Ascorbic Acid Detection by Glucosamine Derived n-Doped Carbon Dots. J. Photochem. Photobiol. A Chem. 2020, 387, 112134. [Google Scholar] [CrossRef]
- Houdová, D.; Soto, J.; Castro, R.; Rodrigues, J.; Soledad Pino-González, M.; Petković, M.; Bandosz, T.J.; Algarra, M. Chemically Heterogeneous Carbon Dots Enhanced Cholesterol Detection by MALDI TOF Mass Spectrometry. J. Colloid Interface Sci. 2021, 591, 373–383. [Google Scholar] [CrossRef] [PubMed]
- Hu, Y.; Gao, Z.; Luo, J. Fluorescence Detection of Malachite Green in Fish Tissue Using Red Emissive Se,N,Cl-Doped Carbon Dots. Food Chem. 2021, 335, 127677. [Google Scholar] [CrossRef] [PubMed]
- Mohammadi, S.; Mohammadi, S.; Salimi, A. A 3D Hydrogel Based on Chitosan and Carbon Dots for Sensitive Fluorescence Detection of MicroRNA-21 in Breast Cancer Cells. Talanta 2021, 224, 121895. [Google Scholar] [CrossRef] [PubMed]
- Liu, Q.; Zhao, F.; Shi, B.; Changli, L. Mussel-Inspired Polydopamine-Encapsulated Carbon Dots with Dual Emission for Detection of 4-Nitrophenol and Fe3+. Luminescence 2021, 36, 431–442. [Google Scholar] [CrossRef]
- Bisauriya, R.; Antonaroli, S.; Ardini, M.; Angelucci, F.; Ricci, A.; Pizzoferrato, R. Tuning the Sensing Properties of N and S Co-Doped Carbon Dots for Colorimetric Detection of Copper and Cobalt in Water. Sensors 2022, 22, 2487. [Google Scholar] [CrossRef]
- Ezati, P.; Rhim, J.W.; Molaei, R.; Priyadarshi, R.; Roy, S.; Min, S.; Kim, Y.H.; Lee, S.G.; Han, S. Preparation and Characterization of B, S, and N-Doped Glucose Carbon Dots: Antibacterial, Antifungal, and Antioxidant Activity. Sustain. Mater. Technol. 2022, 32, e00397. [Google Scholar] [CrossRef]
- Kong, B.; Yang, T.; Cheng, F.; Qian, Y.; Li, C.; Zhan, L.; Li, Y.; Zou, H.; Huang, C. Carbon Dots as Nanocatalytic Medicine for Anti-Inflammation Therapy. J. Colloid Interface Sci. 2022, 611, 545–553. [Google Scholar] [CrossRef]
- Zhu, X.; Han, L.; Liu, H.; Sun, B. A Smartphone-Based Ratiometric Fluorescent Sensing System for on-Site Detection of Pyrethroids by Using Blue-Green Dual-Emission Carbon Dots. Food Chem. 2022, 379, 132154. [Google Scholar] [CrossRef]
- Fen, Y.W.; Yunus, W.M.M.; Yusof, N.A. Surface Plasmon Resonance Optical Sensor for Detection of Pb2+ Based on Immobilized P-Tert-Butylcalix[4]Arene-Tetrakis in Chitosan Thin Film as an Active Layer. Sens. Actuators B Chem. 2012, 171, 287–293. [Google Scholar] [CrossRef]
- Daniyal, W.M.E.M.M.; Fen, Y.W.; Abdullah, J.; Sadrolhosseini, A.R.; Saleviter, S.; Omar, N.A.S. Exploration of Surface Plasmon Resonance for Sensing Copper Ion Based on Nanocrystalline Cellulose-Modified Thin Film. Opt. Express 2018, 26, 34880. [Google Scholar] [CrossRef]
- Anas, N.A.A.; Fen, Y.W.; Omar, N.A.S.; Ramdzan, N.S.M.; Daniyal, W.M.E.M.M.; Saleviter, S.; Zainudin, A.A. Optical Properties of Chitosan/Hydroxyl-Functionalized Graphene Quantum Dots Thin Film for Potential Optical Detection of Ferric (III) Ion. Opt. Laser Technol. 2019, 120, 105724. [Google Scholar] [CrossRef]
- Daniyal, W.M.E.M.M.; Fen, Y.W.; Anas, N.A.A.; Omar, N.A.S.; Ramdzan, N.S.M.; Nakajima, H.; Mahdi, M.A. Enhancing the Sensitivity of a Surface Plasmon Resonance-Based Optical Sensor for Zinc Ion Detection by the Modification of a Gold Thin Film. RSC Adv. 2019, 9, 41729–41736. [Google Scholar] [CrossRef] [PubMed] [Green Version]
- Ramdzan, N.S.M.; Fen, Y.W.; Omar, N.A.S.; Anas, N.A.A.; Liew, J.Y.C.; Daniyal, W.M.E.M.M.; Hashim, H.S. Detection of Mercury Ion Using Surface Plasmon Resonance Spectroscopy Based on Nanocrystalline Cellulose/Poly(3,4-Ethylenedioxythiophene) Thin Film. Measurement 2021, 182, 109728. [Google Scholar] [CrossRef]
- Omar, N.A.S.; Irmawati, R.; Fen, Y.W.; Abdullah, J.; Daud, N.F.M.; Daniyal, W.M.E.M.M.; Mahdi, M.A. A Sensing Approach for Manganese Ion Detection by Carbon Dots Nanocomposite Thin Film-based Surface Plasmon Resonance Sensor. Optik 2021, 243, 167435. [Google Scholar] [CrossRef]
- Mustapha Kamil, Y.; Al-Rekabi, S.H.; Abu Bakar, M.H.; Fen, Y.W.; Mohammed, H.A.; Halip, N.H.M.; Alresheedi, M.T.; Mahdi, M.A. Arsenic Detection Using Surface Plasmon Resonance Sensor with Hydrous Ferric Oxide Layer. Photonic Sens. 2021, 12, 220306. [Google Scholar] [CrossRef]
- Gonçalves, H.M.R.; Duarte, A.J.; Esteves da Silva, J.C.G. Optical Fiber Sensor for Hg(II) Based on Carbon Dots. Biosens. Bioelectron. 2010, 26, 1302–1306. [Google Scholar] [CrossRef] [Green Version]
- Sun, X.; Li, G.; Yin, Y.; Zhang, Y.; Li, H. Carbon Quantum Dot-Based Fluorescent Vesicles and Chiral Hydrogels with Biosurfactant and Biocompatible Small Molecule. Soft Matter 2018, 14, 6983–6993. [Google Scholar] [CrossRef]
- Wang, X.; Guo, H.; Wu, N.; Xu, M.; Zhang, L.; Yang, W. A Dual-Emission Fluorescence Sensor Constructed by Encapsulating Double Carbon Dots in Zeolite Imidazole Frameworks for Sensing Pb2+. Colloids Surf. A Physicochem. Eng. Asp. 2021, 615, 126218. [Google Scholar] [CrossRef]
- Jia, M.; Peng, L.; Yang, M.; Wei, H.; Zhang, M.; Wang, Y. Carbon Dots with Dual Emission: A Versatile Sensing Platform for Rapid Assay of Cr (VI). Carbon 2021, 182, 42–50. [Google Scholar] [CrossRef]
- Hashim, H.S.; Fen, Y.W.; Omar, N.A.S.; Fauzi, N.I.M.; Daniyal, W.M.E.M.M. Recent Advances of Priority Phenolic Compounds Detection Using Phenol Oxidases-Based Electrochemical and Optical Sensors. Meas. J. Int. Meas. Confed. 2021, 184, 109855. [Google Scholar] [CrossRef]
- Babar, D.G.; Garje, S.S. Nitrogen and Phosphorus Co-Doped Carbon Dots for Selective Detection of Nitro Explosives. ACS Omega 2020, 5, 2710–2717. [Google Scholar] [CrossRef] [PubMed]
- Fauzi, N.I.M.; Fen, Y.W.; Omar, N.A.S.; Hashim, H.S. Recent Advances on Detection of Insecticides Using Optical Sensors. Sensors 2021, 21, 3856. [Google Scholar] [CrossRef] [PubMed]
- Hou, J.; Dong, G.; Tian, Z.; Lu, J.; Wang, Q.; Ai, S.; Wang, M. A Sensitive Fluorescent Sensor for Selective Determination of Dichlorvos Based on the Recovered Fluorescence of Carbon Dots-Cu(II) System. Food Chem. 2016, 202, 81–87. [Google Scholar] [CrossRef] [PubMed]
- Mandal, P.; Sahoo, D.; Sarkar, P.; Chakraborty, K.; Das, S. Fluorescence Turn-on and Turn-off Sensing of Pesticides by Carbon Dot-Based Sensor. New J. Chem. 2019, 43, 12137–12151. [Google Scholar] [CrossRef]
- Bera, M.K.; Behera, L.; Mohapatra, S. A Fluorescence Turn-down-up Detection of Cu2+ and Pesticide Quinalphos Using Carbon Quantum Dot Integrated UiO-66-NH2. Colloids Surf. A Physicochem. Eng. Asp. 2021, 624, 126792. [Google Scholar] [CrossRef]
- Liu, Y.; Zhou, Q.; Wu, Y.; Li, S.; Sun, Y.; Sheng, X.; Zhan, Y.; Zhao, J.; Guo, J.; Zhou, B. Sensitive Detection of 2,4,6-Trinitrotoluene Utilizing Fluorescent Sensor from Carbon Dots and Reusable Magnetic Core-Shell Nanomaterial. Talanta 2021, 233, 122498. [Google Scholar] [CrossRef]

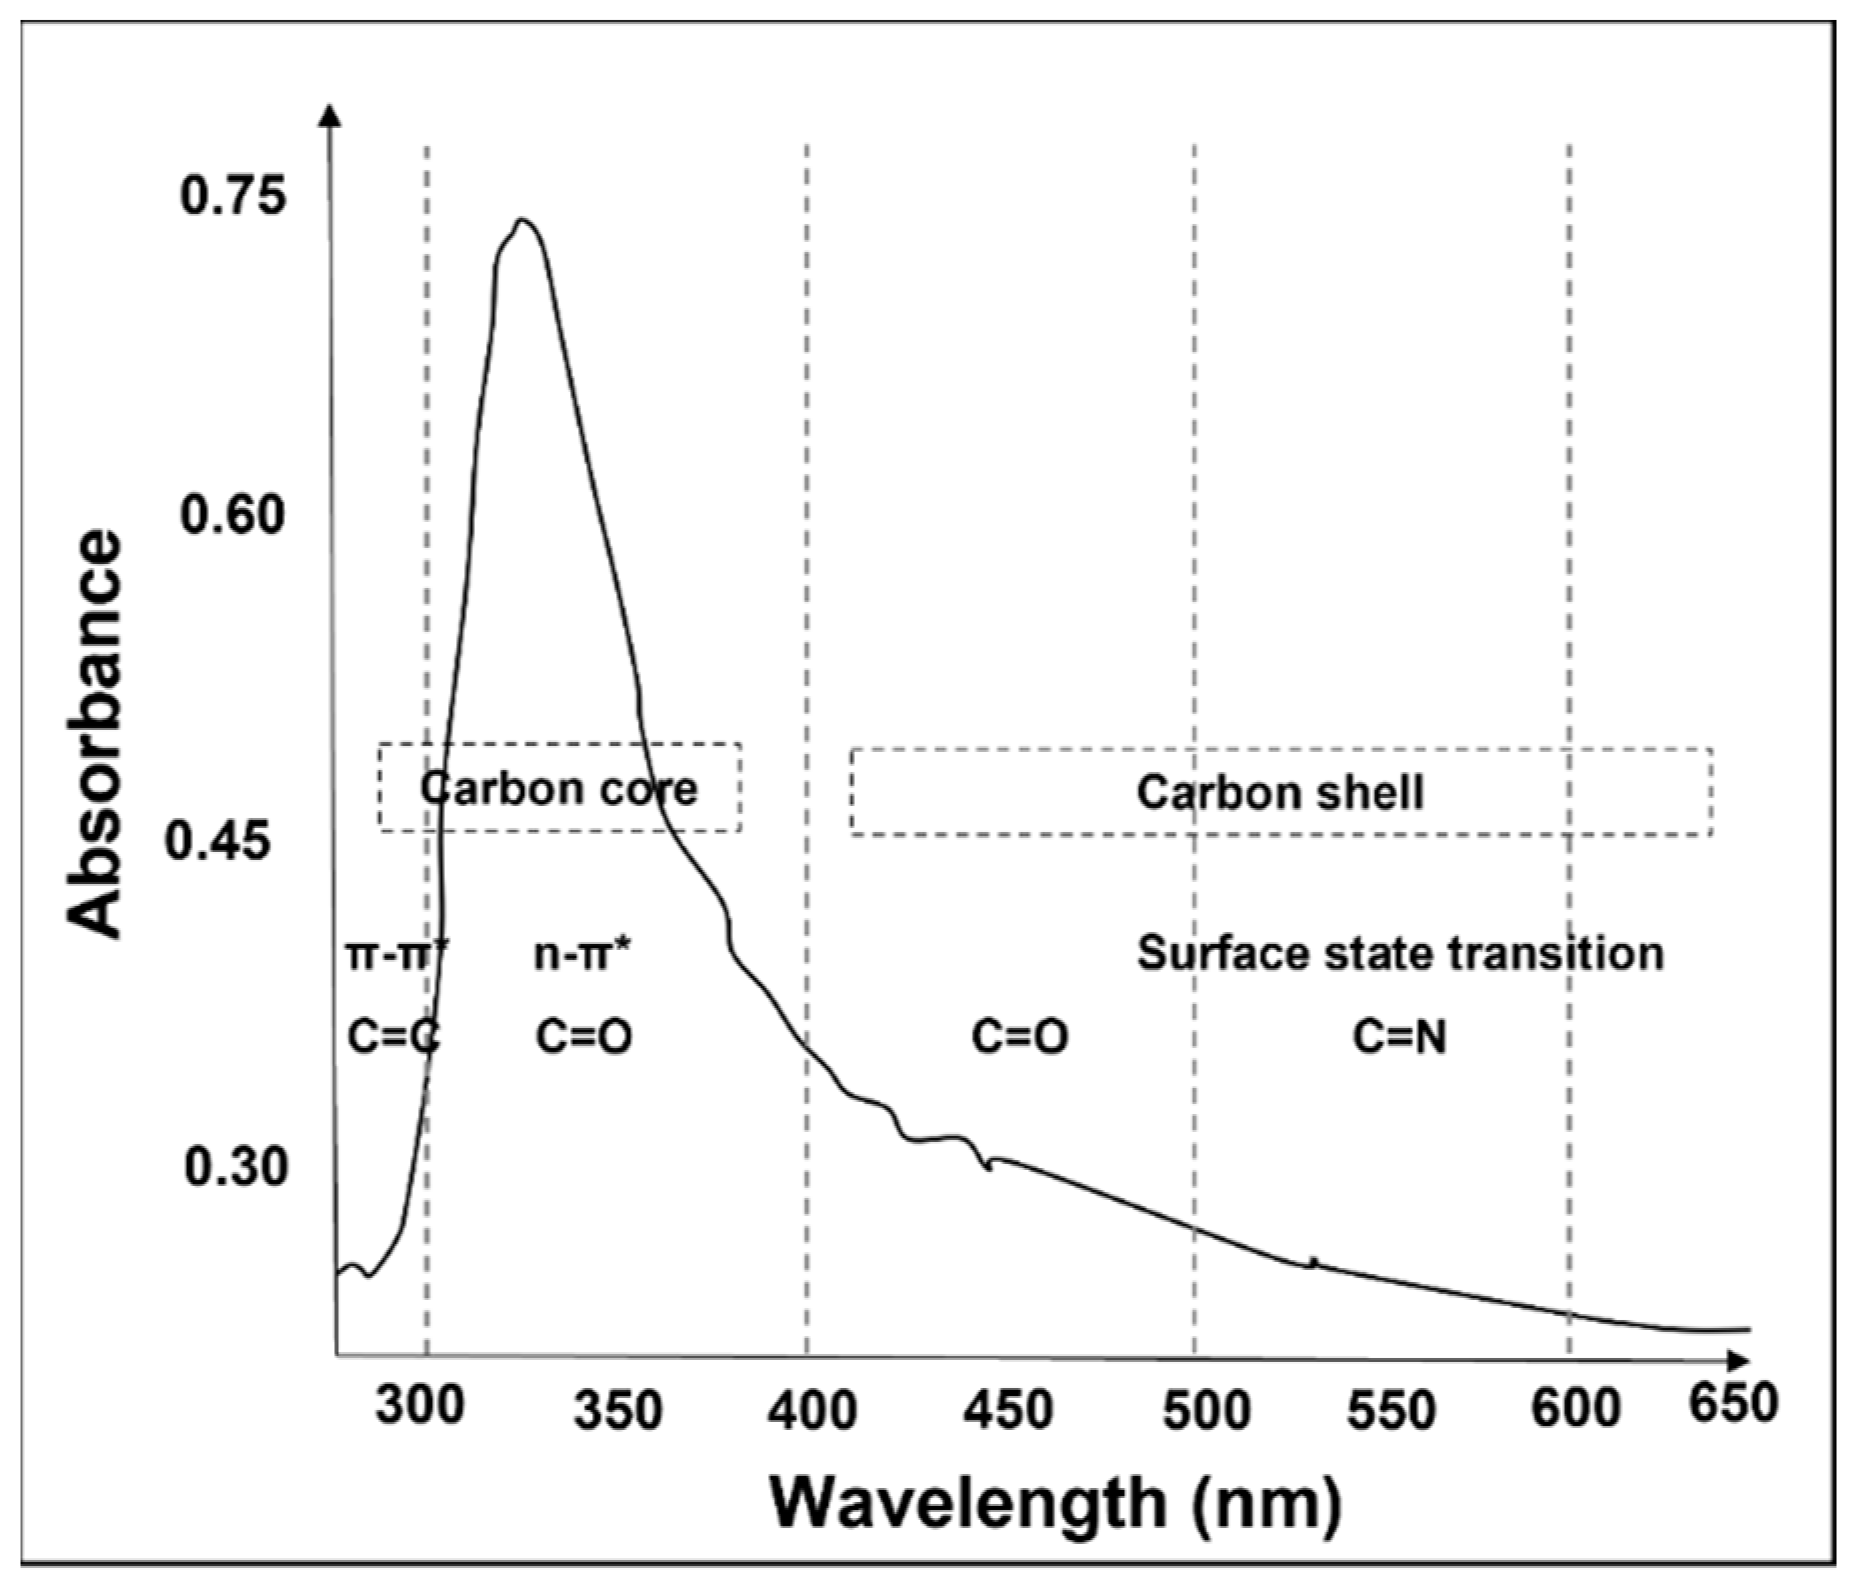
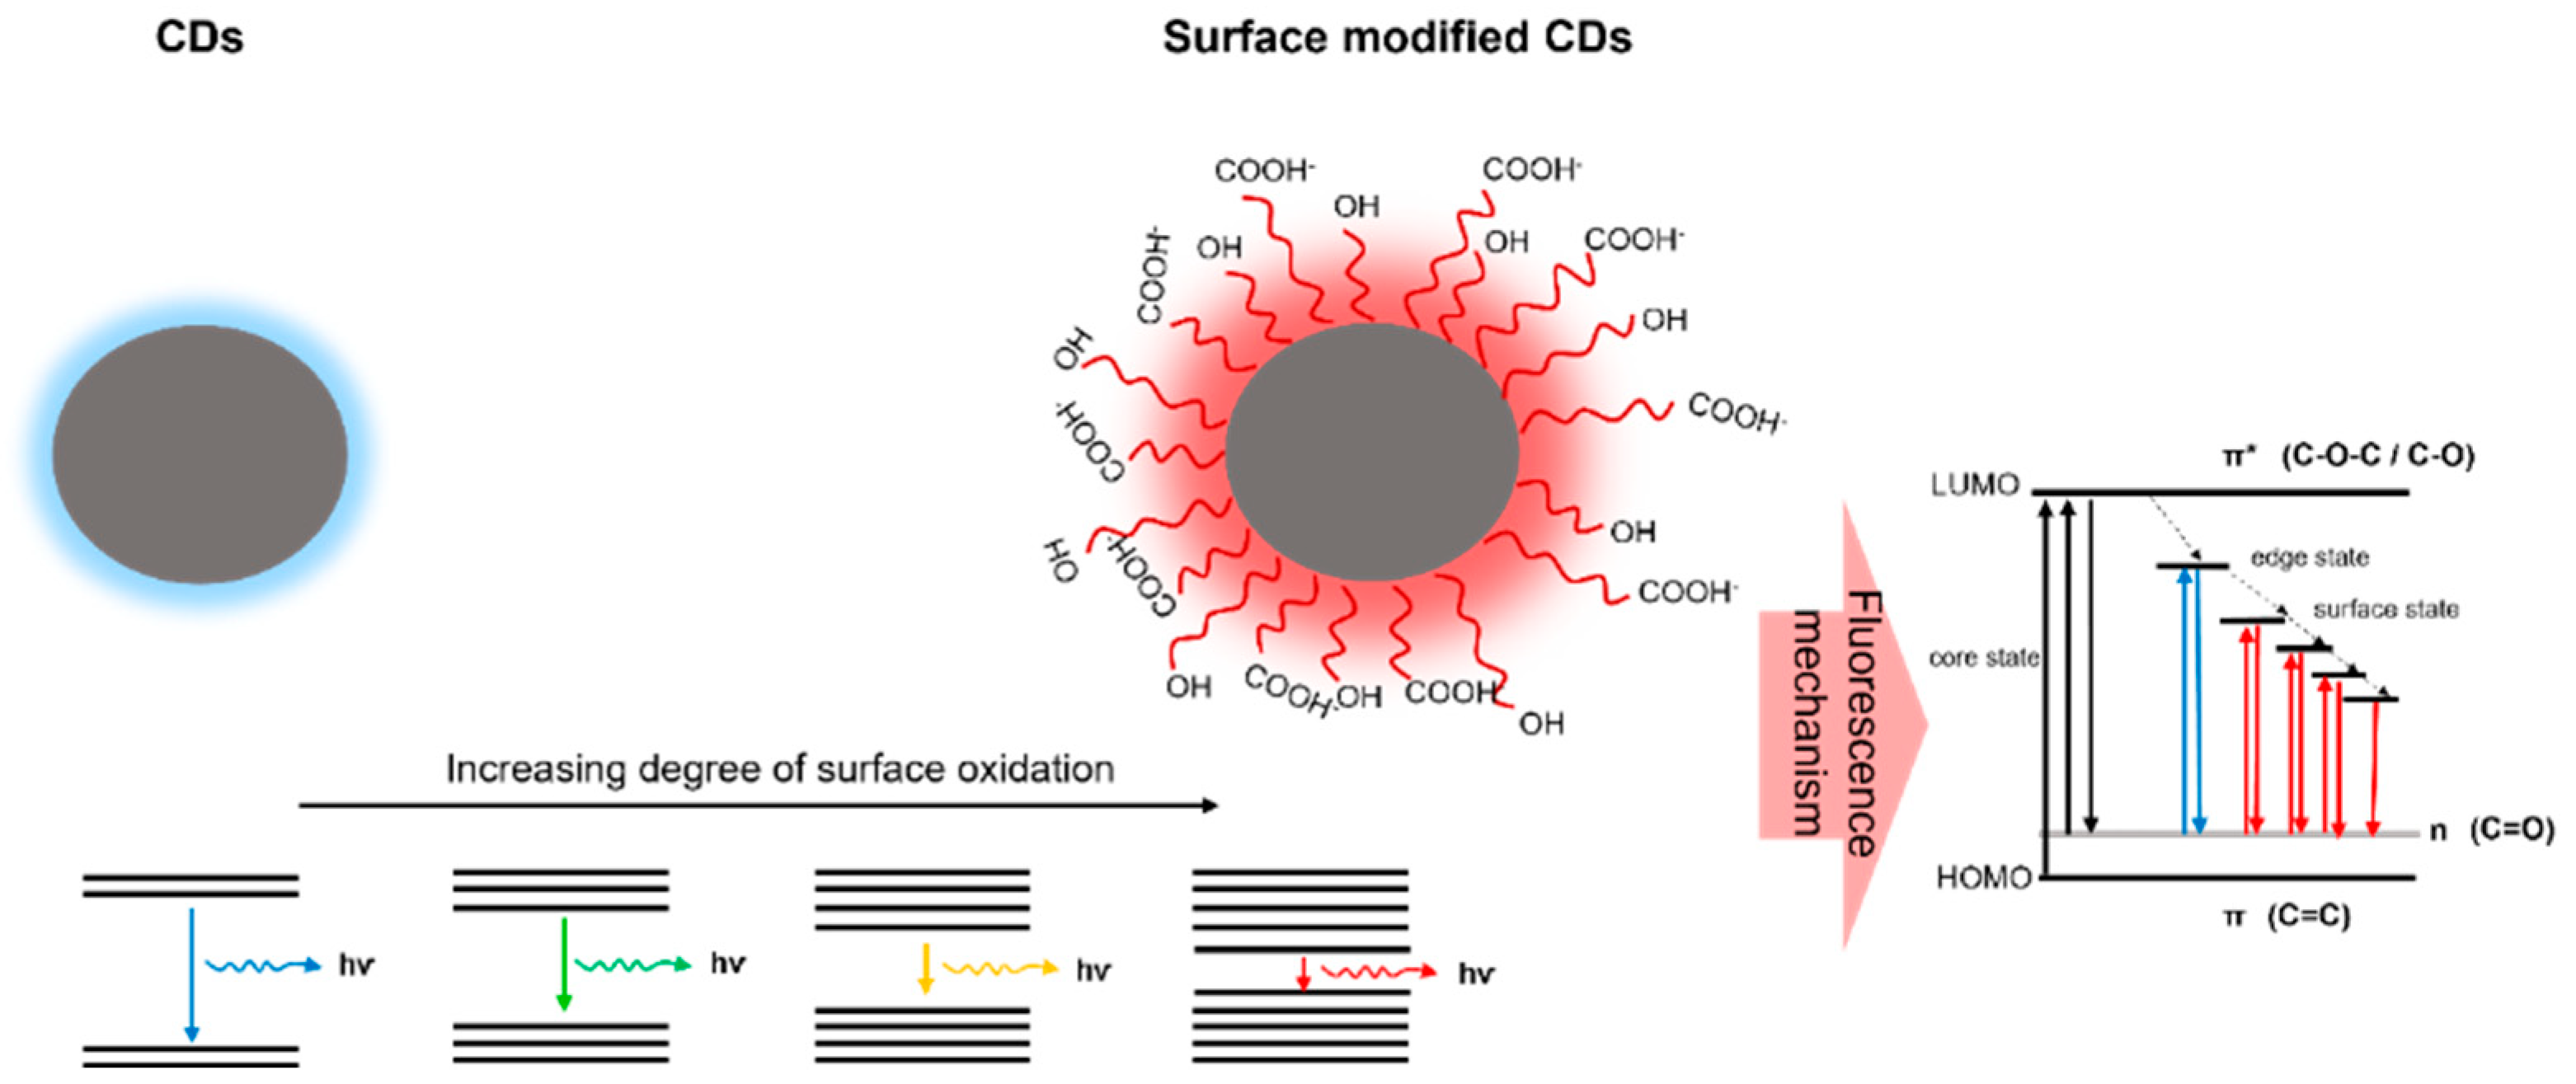
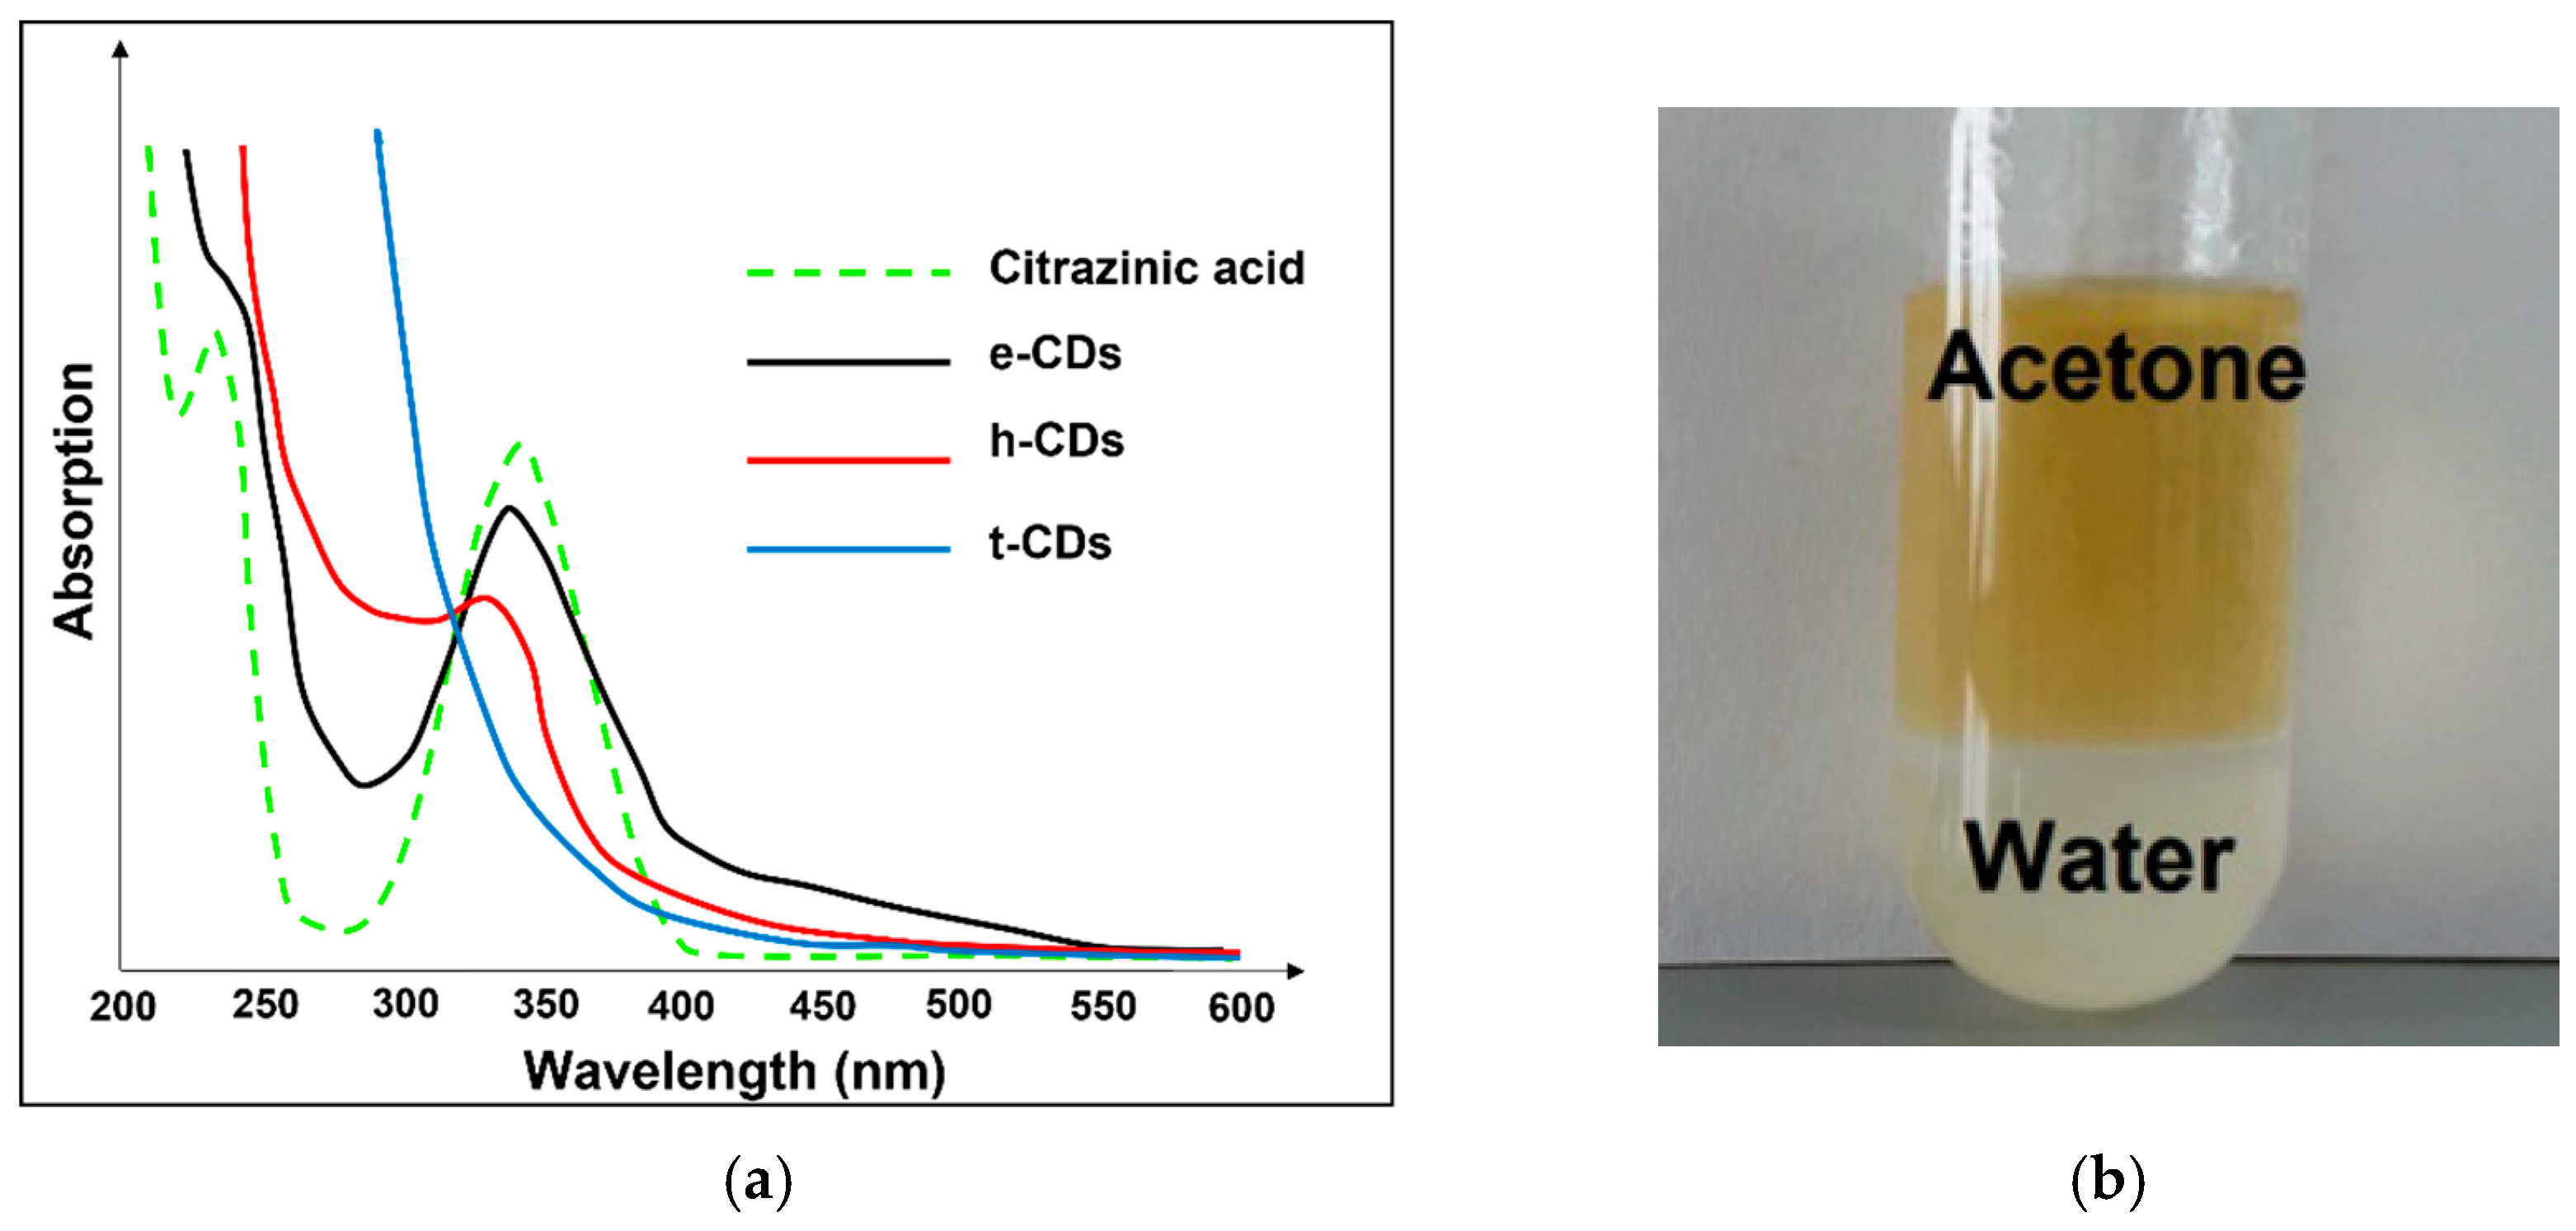
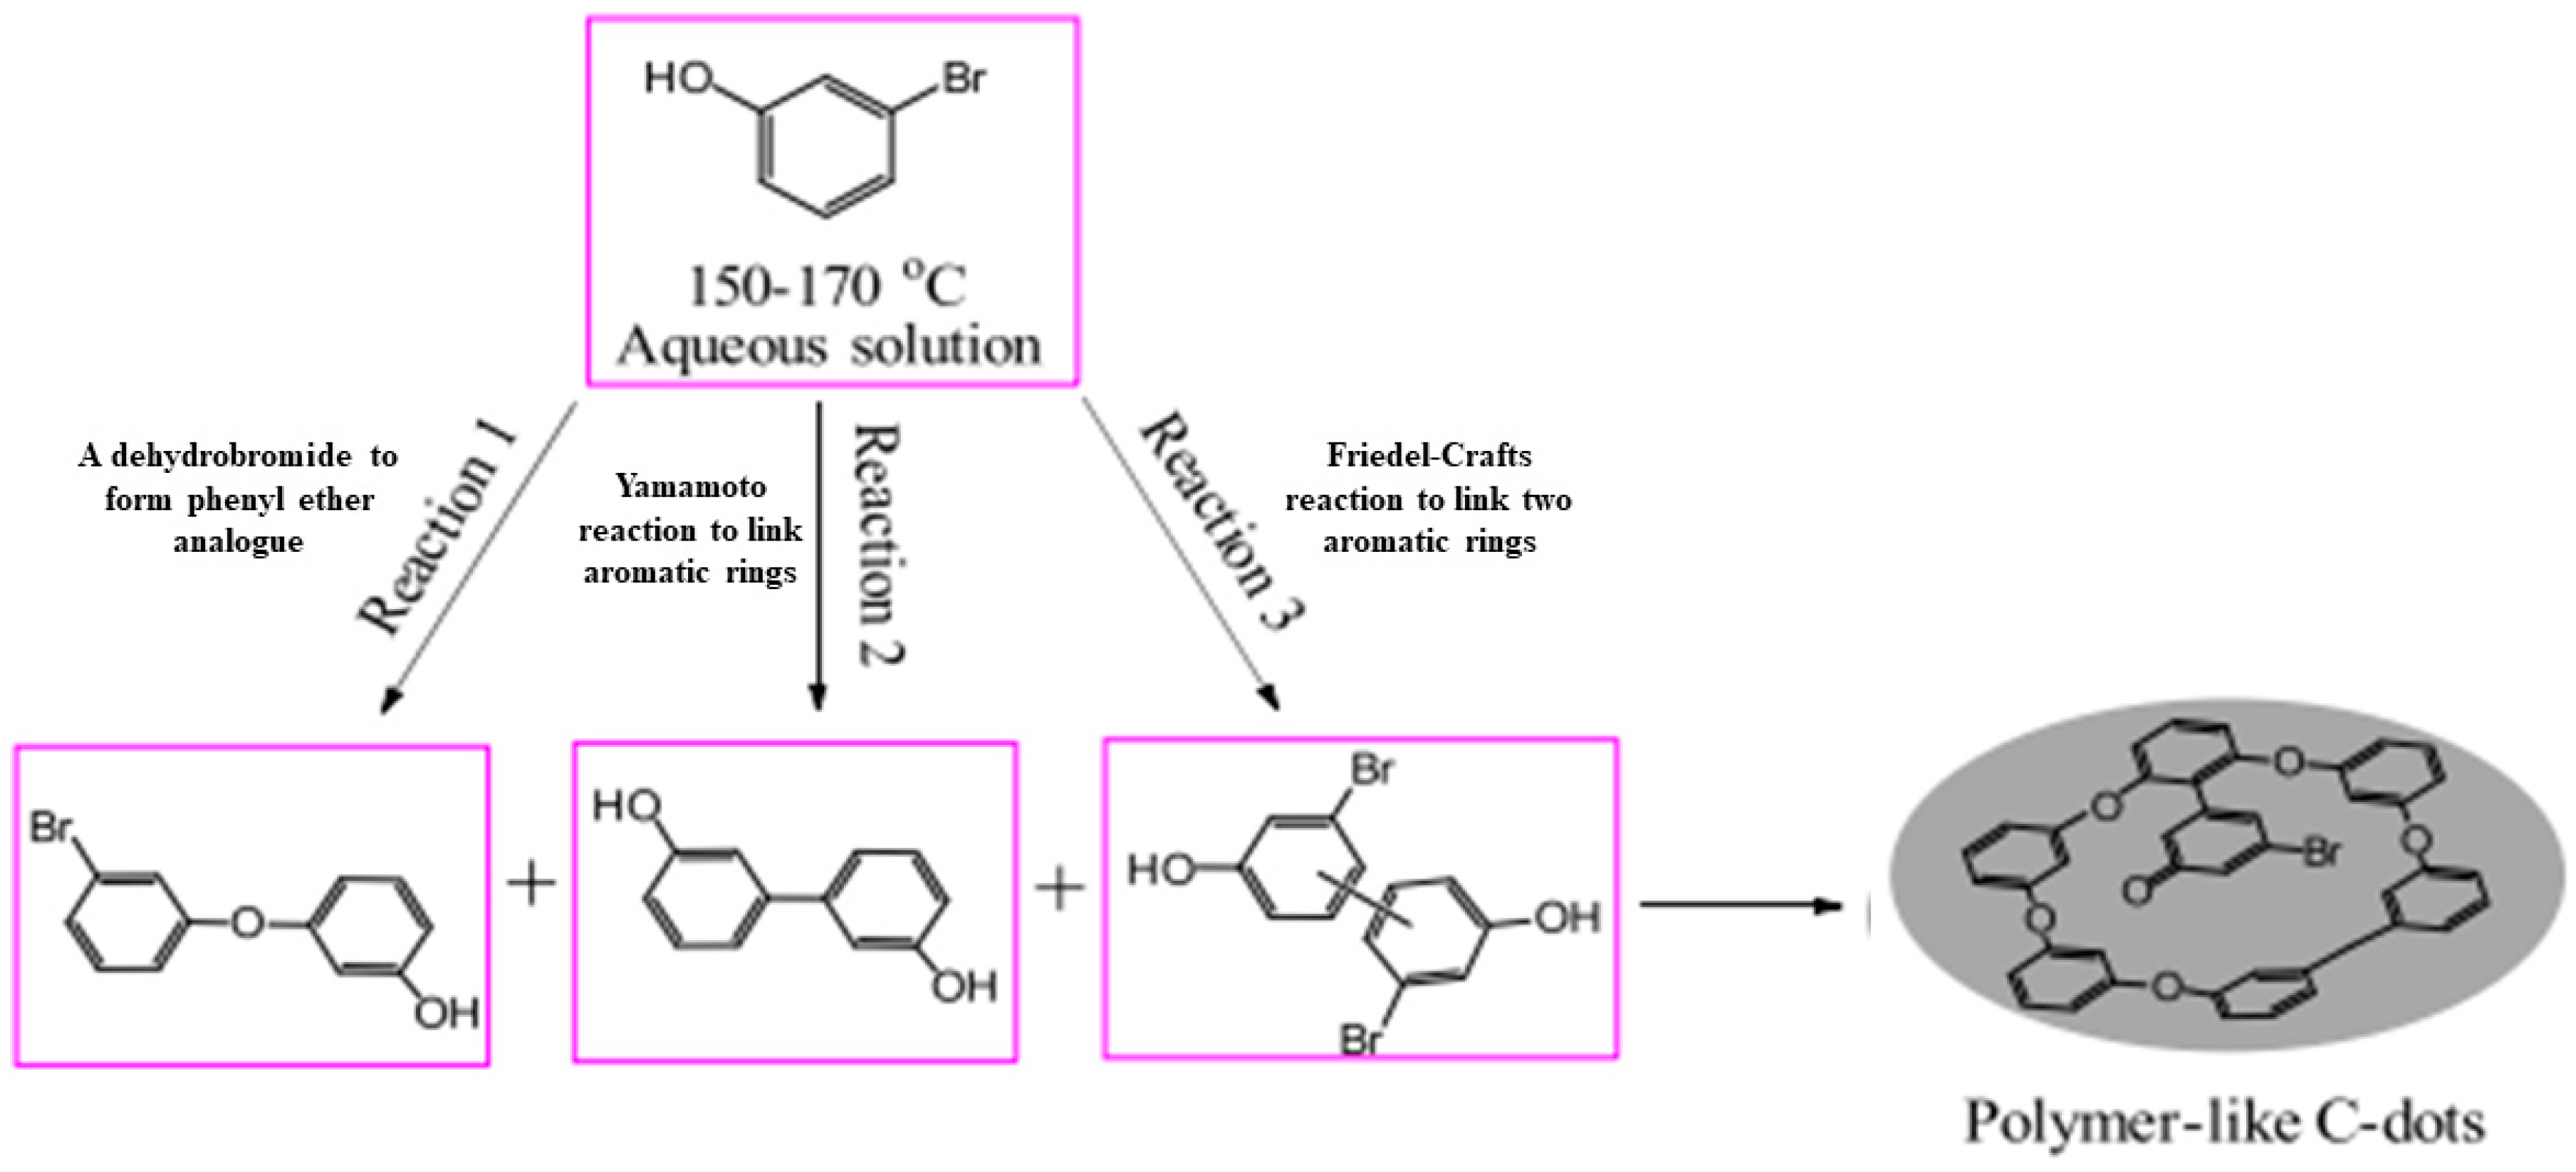
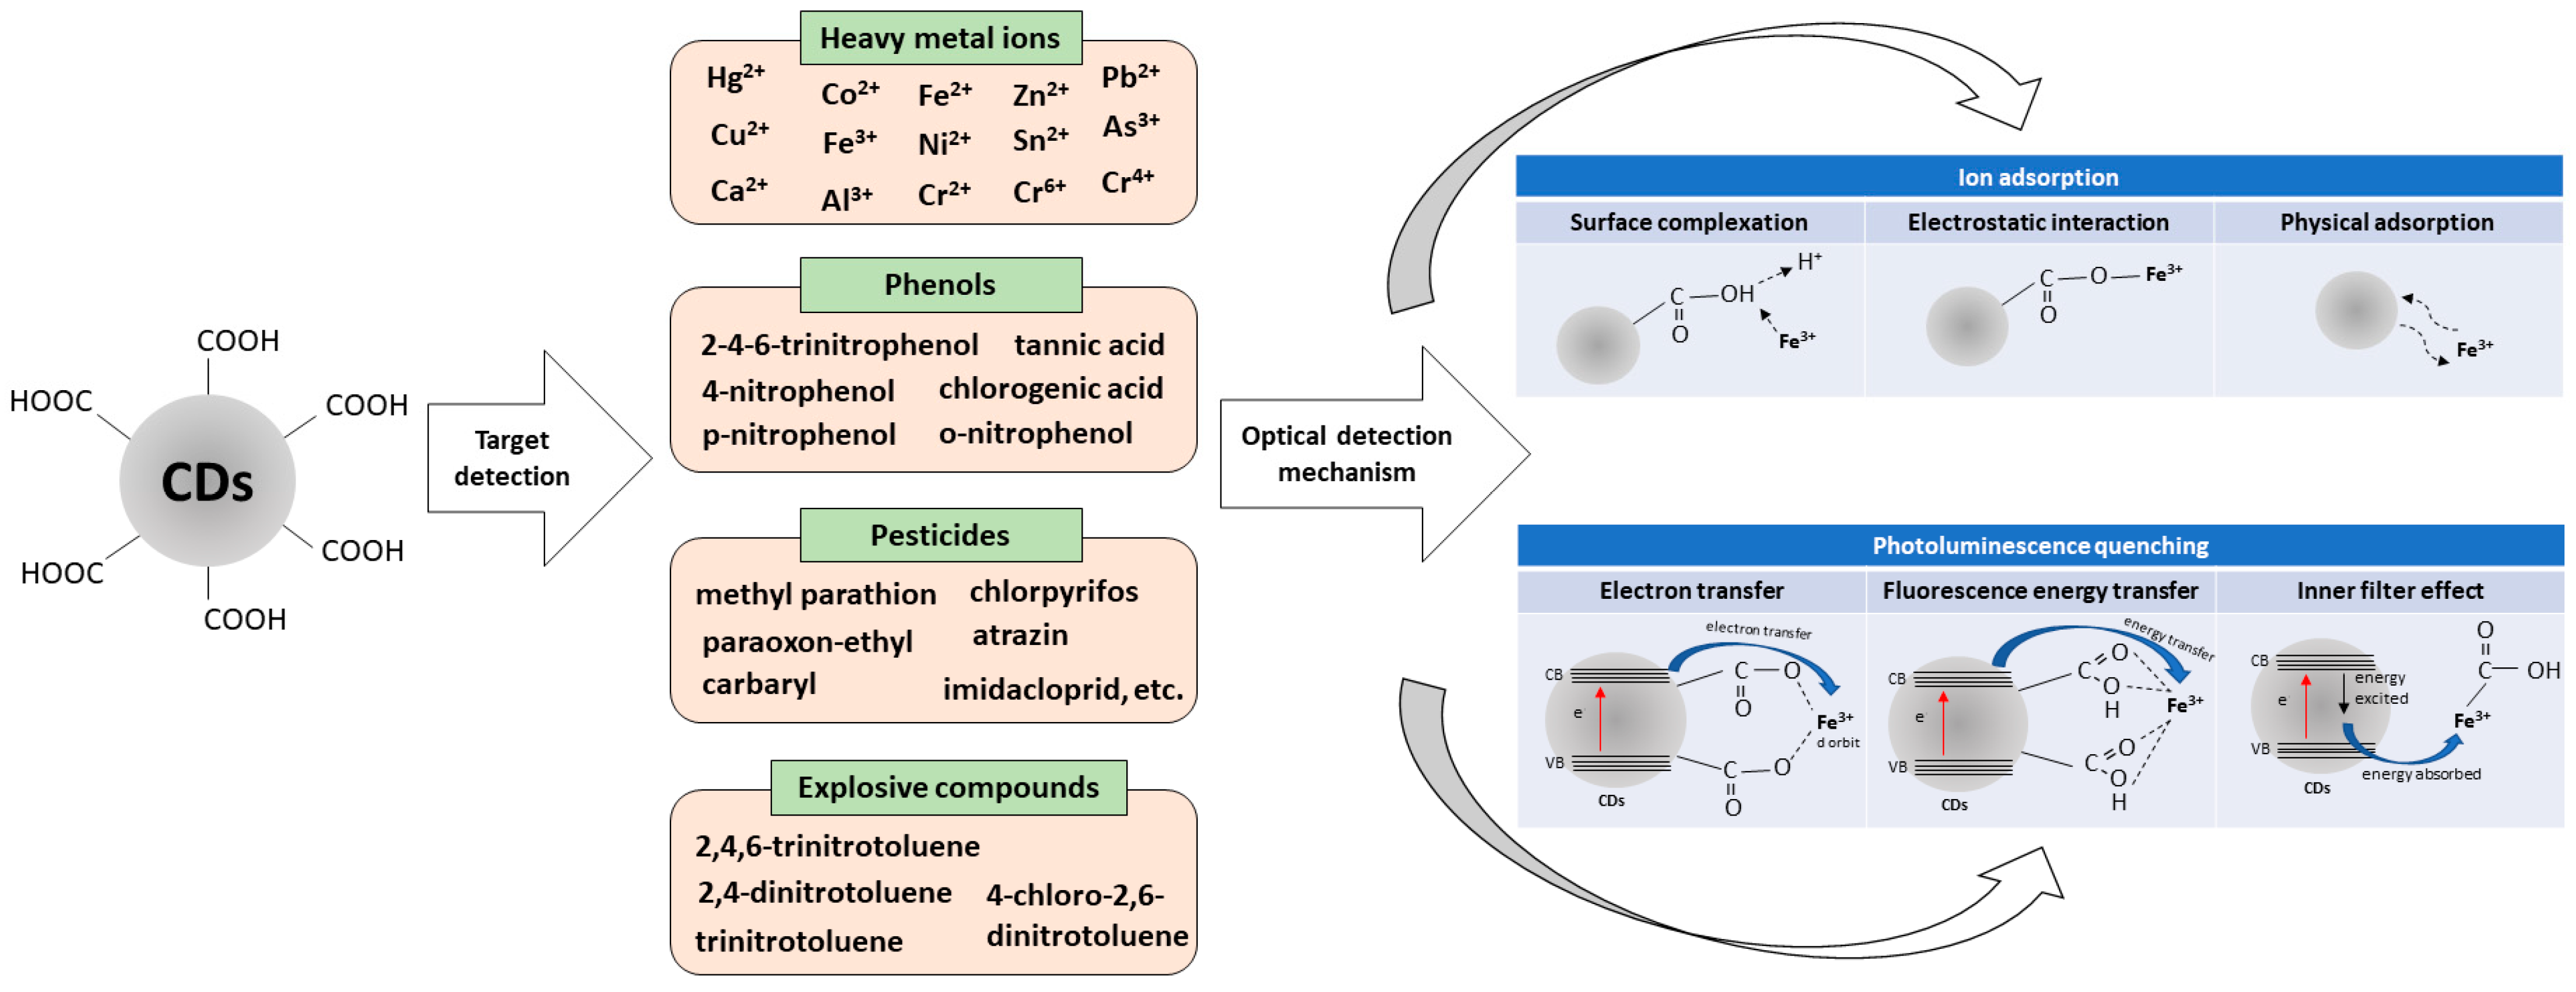


| Precursor | Technique | Properties | Year | Reference | |||
|---|---|---|---|---|---|---|---|
| Carbon Source | Passivation/Solvent | Particle Size | Fluorescence | Quantum Yield | |||
| Orange juice | - | Hydrothermal | TEM- 2.5 nm | λem- 441 nm λex- 360 nm | 26% | 2012 | [9] |
| Watermelon peels | - | Carbonization | TEM- 2.0 nm | λem- 490–580 nm | 7.1% | 2012 | [10] |
| Sugar cane bagasse | Sodium hydroxide solution | Hydrothermal carbonization | HRTEM- 1.8 nm | λem- 475 nm λex- 370 nm | 12.3% | 2014 | [11] |
| Lemon peels | Sulfuric acid | Hydrothermal carbonization | TEM- 1 to 3 nm | λem- 441 nm λex- 360 nm | 14% | 2016 | [12] |
| Prunus avium extract | Ammonia | Hydrothermal carbonization | HRTEM- 7 nm | λem- 411 nm λex- 310 nm | 13% | 2016 | [13] |
| Cornstalk | Distilled water | Hydrothermal | TEM- 5.2 nm | λem- 500 nm λex- 420 nm | 7.6% | 2017 | [14] |
| Corn bract | Anhydrous ethanol | Solvothermal | TEM- 1.8–3.4 nm | λem- 470 nm and 678 nm λex- 406 nm | 6.9% | 2017 | [15] |
| Dried lemon peel | Deionized water | Hydrothermal | TEM- 9.5 nm | λem- 505 nm λex- 425 nm | 11% | 2017 | [16] |
| Pulp-free lemon juice | Ethanol | Solvothermal | AFM- 1.5 nm TEM- 4.6 nm | λem- 631 nm λex- 540 nm | 28% | 2017 | [17] |
| Citrus lemon peels | - | Carbonization | TEM- 4.5 nm | λem- 435 nm λex- 330 nm | 16.8% | 2017 | [18] |
| Citrus sinensis peels | TEM- 6.5 nm | λem- 455 nm λex- 365 nm | 15.5% | ||||
| Lemon juice | - | Thermal decomposition | - | λem- 400 nm λex- 320 nm | 7% | 2018 | [19] |
| Lemon juice | Poly(ethylenimine) | Carbonization | TEM- 5.7 nm | λem- 540 nm λex- 420 nm | - | 2018 | [20] |
| Citrus lemon juice | - | Hydrothermal | TEM- 5.8 nm | λem- 450 nm λex- 360 nm | 10.20% | 2018 | [21] |
| Watermelon juice | Ethanol | Hydrothermal | TEM- 3–7 nm | λem- 439 nm λex- 355 nm | 10.6% | 2018 | [22] |
| Jackfruit juice | Ethanol and distilled water | Hydrothermal | HRTEM- <2.5 nm | λem- 485 nm λex- 395 nm | 14.6% | 2018 | [23] |
| Lemon | Ethylenediamine | Hydrothermal | TEM- 20 nm | - | 20% | 2018 | [24] |
| Grapefruit | |||||||
| Durian juice | Water and ethanol | Carbonization | - | - | - | 2018 | [25] |
| Acerola fruit | Water | Hydrothermal | - | λem- 504 nm λex- 360 nm | - | 2019 | [26] |
| Bitter orange juice | - | Hydrothermal | AFM- 2–4 nm DLS- 1–2 nm | λem- 390 nm λex- 325 nm | 19.9% | 2019 | [27] |
| Citrus lemon juice | Ethylenediamine | Hydrothermal | HRTEM- 3 nm | λem- 452 nm λex- 360 nm | 31% | 2019 | [28] |
| Lemon and onion juices | Ammonium hydroxide solution | Microwave assisted carbonization | TEM- 6.15 nm | λem- 425 nm λex- 340 nm | 23.6% | 2019 | [29] |
| Lemon juice | - | Hydrothermal | HRTEM- 3–15 nm | λem- 524 nm λex- 420 nm | 21.37% | 2019 | [30] |
| Durian shell | Tris base and deionized water | Hydrothermal carbonization | TEM- 6.5 nm | λem- 414 nm λex- 340 nm | 12.93% | 2019 | [31] |
| Lemon | Hydroxylamine | Hydrothermal | HRTEM- 2 nm | λem- 430–470 nm λex- 360 nm | 5% | 2020 | [32] |
| Pomegranate | Sodium hydroxide and polyethylene glycol | Microwave | HRTEM- 1 to 5 nm | λem- 532 nm | - | 2020 | [33] |
| Watermelon peels | λem- 515 nm | ||||||
| Rosa roxburghii fruits | Water | Hydrothermal | TEM- 2.5 nm | λem- 450 nm λex- 360 nm | 24.8% | 2020 | [34] |
| Citrus fruit peels | Deionized water | Sand bath | TEM- 4.6 nm | λem- 510 nm λex- 420 nm | - | 2021 | [35] |
| Banana peel | Deionized water | Hydrothermal | TEM- 5 nm | λex- 355 nm | 20% | 2021 | [36] |
| Elaeagnus angustifolia | Ultrapure water | Hydrothermal | TEM- <10 nm | λem- 410 nm λex- 330 nm | 16.8% | 2021 | [37] |
| Kiwi (Actinidia deliciosa) fruit peels | - | Hydrothermal carbonization | TEM- 5.6 nm | λem- 432 nm λex- 360 nm | 14% | 2021 | [1] |
| Ammonium hydroxide | TEM- 5.1 nm | 19% | |||||
| Canon ball fruit | Distilled water | Hydrothermal | TEM- <15 nm | λem- ~500 nm λex- 380 nm | 7.24% | 2022 | [38] |
| Indian Bael patra -hard shell -pulp -pulp and gum | - | Hydrothermal carbonization | TEM- 3 nm TEM- 6 nm TEM- 8 nm | 59.39% 59.07% 55.25% | 2022 | [39] | |
| Morus nigra (black mulberry) | Deionized water | Hydrothermal | TEM- 4.5 nm | λem- 427 nm λex- 360 nm | 24% | 2022 | [40] |
| Jatropha | Distilled water | Hydrothermal | TEM- 3.2 nm | λem- 462 nm λex- 370 nm | 13.7% | 2022 | [41] |
| Precursor | Technique | Properties | Year | Reference | |||
|---|---|---|---|---|---|---|---|
| Carbon Source | Passivation/Solvent | Particle Size | Fluorescence | Quantum Yield | |||
| Celery leaves | Glutathione and double distilled water | Hydrothermal | TEM- 2.08 nm | λem- 415 nm λex- 340 nm | 53% | 2013 | [42] |
| Sweet pepper | Water | Carbonization | TEM- 4.6 nm | λem- 450 nm λex- 360 nm | 19.3% | 2013 | [43] |
| Lemon grass | Water | Hydrothermal | - | λem- 440 nm λex- 320 nm | 23.3% | 2016 | [44] |
| Tomato juice | - | Hydrothermal | HRTEM- 3 nm DLS- 3 nm | λem- 440 nm λex- 367 nm | 13.9% | 2016 | [45] |
| Carrot juice | - | Hydrothermal | TEM- 5.5 nm | λem- 442–565 nm λex- 360–520 nm | 5.16% | 2017 | [46] |
| Rose-heart radish | Ultrapure water | Hydrothermal | TEM- 3.6 nm | λem- 420 nm λex- 330 nm | 13.6% | 2017 | [47] |
| Turmeric | Ethylenediamine | Hydrothermal | TEM- 20 nm | - | 20% | 2018 | [24] |
| Cinnamon | Ultrapure water | Hydrothermal | TEM- 3.4 nm | λem- 465 nm λex- 370 nm | 35.7% | 2018 | [48] |
| Red chili | TEM- 3.1 nm | λem- 477 nm λex- 380 nm | 26.8% | ||||
| Turmeric | TEM- 4.3 nm | λem- 460 nm λex- 370 nm | 38.3% | ||||
| Black pepper | TEM- 3.5 nm | λem- 489 nm λex- 390 nm | 43.6% | ||||
| Hongcaitai | Ultrapure water | Hydrothermal | TEM- 1.9 nm | λem- 410 nm λex- 330 nm | 21.0% | 2018 | [49] |
| Cauliflower | - | Hydrothermal | AFM- 4 nm DLS- 1.54 nm | λem- 380 nm λex- 325 nm | 43% | 2019 | [50] |
| Kelp | Ethylenediamine | Microwave irradiation | TEM- 3.7 nm | λem- 450 nm λex- 370 nm | 23.5% | 2019 | [51] |
| Tomato | Sulfuric acid | Chemical oxidation | HRTEM- 5–10 nm | λem- 450 λex- 360 nm | 12.70% | 2019 | [52] |
| Phosphoric acid | λem- 520 λex- 420 nm | 4.21% | |||||
| Phosphoric acid | λem- 560 nm λex- 460 nm | 2.76% | |||||
| Crown daisy leaf waste | Ultrapure water and urea | Hydrothermal | TEM- 5–10 nm | λem- 380 nm λex- 300 nm | - | 2019 | [53] |
| Cabbage | Anhydrous ethanol | Solvothermal | TEM- 3.4 nm | λem- 500 nm and 678 nm λex- 410 nm | 12.4% | 2020 | [54] |
| Cherry tomatoes | - | Hydrothermal | TEM- 7 nm | λem- 430 nm λex- 340 nm | 9.7% | 2020 | [55] |
| Tomato | Hydroxylamine | Hydrothermal | HRTEM- 3 nm | λem- 430–470 nm λex- 360 nm | 3.38% | 2020 | [32] |
| Scallion leaves | Water | Hydrothermal | TEM- 3.5 nm | λem- 418 nm λex- 320 nm | 3.2% | 2020 | [56] |
| Tomato | - | Hydrothermal | HRTEM- 9 nm | λem- 430 nm λex- 344 nm | 1.24% | 2021 | [57] |
| Red beet | Water | Hydrothermal | TEM- 4.66 nm | λem- 438 nm λex- 350 nm | 8.17% | 2022 | [58] |
| Precursor | Technique | Properties | Year | Reference | |||
|---|---|---|---|---|---|---|---|
| Carbon Source | Passivation/Solvent | Particle Size | Fluorescence | Quantum Yield | |||
| Selenicereus grandiflorus | - | Boiling | HRTEM- 2.5 nm | λem- 440 and 365 nm | 3.8% | 2019 | [59] |
| Water hyacinth | Phosphoric acid | Carbonization | SEM- ≤10 nm DLS- ≤10 nm TEM- 5.22 nm | λem- 370 nm λex- 300 nm | 17.02% | 2019 | [60] |
| Osmanthus fragrans | Ultrapure water | Hydrothermal | TEM- 2.23 nm | λem- 410 nm λex- 340 nm | 18.53% | 2019 | [61] |
| Rose flowers: Blue Red Yellow | Water | Hydrothermal | TEM- 37 nm TEM- 39 nm TEM- 33 nm | λex- 335 nm λex- 330 nm λex- 340 nm | 46% 44% 48% | 2020 | [62] |
| Ethanol | TEM- 30 nm TEM- 27 nm TEM- 26 nm | λex- 420 nm λex- 410 nm λex- 425 nm | 43% 46% 47% | ||||
| Tagetes erecta | Deionized water | Solvo(hydro)-thermal carbonization | FESEM- 3.41 nm | λem- 495 nm λex- 420 nm | 63.7% | 2021 | [63] |
| Precursor | Technique | Properties | Year | Reference | |||
|---|---|---|---|---|---|---|---|
| Carbon Source | Passivation/Solvent | Particle Size | Fluorescence | Quantum Yield | |||
| Lotus root | - | Microwave | TEM- 9.41 nm | λem- 435 nm λex- 360 nm | 19.0% | 2016 | [64] |
| Ocimum sanctum leaves | Distilled water | Hydrothermal | TEM- 2.23 nm | λem- 410 nm λex- 340 nm | 9.3% | 2017 | [65] |
| Acacia concinna seeds | Methanol | Microwave treatment | HRTEM- 2.5 nm | λem- 468 nm λex- 390 nm | 10.20% | 2018 | [66] |
| Acetonitrile | 7.20% | ||||||
| Acetone | 7.85% | ||||||
| Bamboo leaves | Sodium hydroxide and sodium hypochlorite | Pyrolysis | AFM- 2 nm | λem- 425–475 nm | - | 2018 | [67] |
| Gingko leaves | - | Pyrolysis | TEM- 4.11 nm | λem- 427 nm λex- 360 nm | 21.7% | 2018 | [68] |
| Gynostemma | - | Calcination | TEM- 2.5 nm | λem- 400 nm λex- 320 nm | 5.7% | 2019 | [69] |
| Fennel seeds (Foeniculum vulgare) | - | Pyrolysis | TEM- 3.9 nm | λem- 417 nm λex- 240 nm | 9.5% | 2019 | [70] |
| Bamboo leaves | - | Calcination | TEM- 11 nm | λem- 419 nm λex- 313 nm | 5.18% | 2020 | [71] |
| Betel leaves | Ammonia | Hydrothermal | HRTEM- less 10 nm PSA-3.7 nm | λem- 402 nm λex- 320 nm | 4.21% | 2021 | [72] |
| Calotropis procera leaves | Deionized water | Hydrothermal carbonization | FETEM- 4.3 nm | λem- 416 nm λex- 340 nm | 71.95% | 2021 | [73] |
| Elettaria cardamomum leaves | Distilled water | Ultrasonication | - | λem- 520 and 850 nm λex- 514 nm | - | 2021 | [74] |
| Pearl millet seeds | Double distilled water | Thermal treatment | HRTEM- 4–5 nm | λem- 415 nm λex- 250 nm | 52% | 2021 | [75] |
| Cornus walteri leaves | Maleic anhydride, hydrogen peroxide and water | Hydrothermal | TEM- 3.53 nm | λem- 550 nm λex- 420 nm | 18.34% | 2022 | [76] |
| Tea leaves | Urea and ultrapure water | Hydrothermal | TEM- 2.32 nm | λem- 455 nm λex- 360 nm | - | 2022 | [77] |
| Kentucky bluegrass | Ethylenediamine | Hydrothermal | TEM- 9 nm | λem- 370–470 nm λex- 280–400 nm | 7% | 2022 | [78] |
| Precursor | Technique | Properties | Year | Reference | |||
|---|---|---|---|---|---|---|---|
| Carbon Source | Passivation/Solvent | Particle Size | Fluorescence | Quantum Yield | |||
| Sago waste | - | Thermal pyrolysis | SEM- 6–17 nm | λem- 390 nm λex- 315 nm | - | 2014 | [79] |
| Palm kernel shell | Diethylene glycol | Microwave irradiation | TEM- 6.6 to 7 nm | λem- 438–459 nm λex- 370 nm | 44.0% | 2020 | [80] |
| Palm kernel shell | Ultrapure water and ethylenediamine | Hydrothermal | TEM-2 nm | λem- 430–450 nm λex- 350–400 nm | 13.7% | 2021 | [81] |
| Ethanol and L-phenylalanine | 8.6% | ||||||
| Wheat straw | Deionized water | Hydrothermal | TEM- 2.1 nm DLS- 5.7 nm | λem- 470 nm λex- 380 nm | 7.5% | 2021 | [82] |
| Precursor | Technique | Properties | Year | Reference | |||
|---|---|---|---|---|---|---|---|
| Carbon Source | Passivation/Solvent | Particle Size | Fluorescence | Quantum Yield | |||
| Algal blooms | Phosphoric acid | Microwave | TEM- 8.5 nm | λem- 438 nm λex- 360 nm | 13% | 2016 | [83] |
| Yogurt | Hydrochloric acid | Pyrolysis | TEM- 3.5 nm | λem- 420 nm λex- 320 nm | 2.4% | 2018 | [84] |
| Enokitake mushroom | Sulfuric acid | Hydrothermal | TEM- 4 nm | λem- 470 nm λex- 360 nm | 11% | 2018 | [85] |
| Sulfuric acid and tetraethylenepentamine | 39% | ||||||
| Microalgae biochar | Potassium permanganate | Oxidizing agent and autoclave | AFM- 68 nm | λex- 398 nm λex- 280 nm | - | 2019 | [86] |
| Mushroom | Ultrapure water | Hydrothermal | TEM- 5.8 nm | λem- 440 nm λex- 360 nm | 11.5% | 2020 | [87] |
| Agarose waste | - | Thermal treatment | HRTEM- 2–10 nm | λem- 420 nm λex- 300 nm | 62% | 2021 | [88] |
| Shewanella oneidensis | Luria-Bertani | Hydrothermal | - | λem- 410 nm λex- 320 nm | 7% | 2022 | [89] |
| Precursor | Technique | Properties | Year | Reference | |||
|---|---|---|---|---|---|---|---|
| Carbon Source | Passivation/Solvent | Particle Size | Fluorescence | Quantum Yield | |||
| Waste frying oil | Sulfuric acid | Carbonization | HRTEM- 2.6 nm | λem- 378 nm λex- 300 nm | 3.66% | 2014 | [90] |
| Nannochloropsis biocrude oil | Sulfuric acid | Hydrothermal liquefaction | TEM- 4 nm | λem- 280–560 nm λex- 400–550 nm | 13.71% | 2017 | [91] |
| Polystyrene | Ethylenediamine | Solvothermal | TEM- 4 nm | λem- 456 nm λex- 380 nm | ~20% | 2017 | [92] |
| Assam CTC tea | Acetic acid | Carbonization | TEM- <10 nm | λex- 380–500 nm | - | 2017 | [93] |
| Expired milk | Water | Subcritical water | TEM- <5 nm | λem- 440 nm λex- 360 nm | 8.64% | 2018 | [94] |
| Long flame coal powder | Deionized water | Ozone oxidation | DLS- 4.2 nm | λem- 530 nm λex- 470 nm | 8.4% | 2018 | [95] |
| Paper waste | Sodium hydroxide and distilled water | Hydrothermal | TEM- 2–4 nm | λem- 420 nm λex- 320 nm | 20% | 2018 | [96] |
| Waste polyolefin | Sulfuric acid and nitric acid | Ultrasonic-assisted chemical oxidation | TEM- 2.5 nm | λem- 540 nm λex- 490 nm | 4.84% | 2018 | [97] |
| Polypropylene plastic waste | Ethanol | Heating process | TEM- <20 nm | λem- 410–465 nm λex- 365 nm | - | 2018 | [98] |
| Bike soot | Deionized water | Hydrothermal | TEM- 4.2 nm | λem- 396 nm λex- 240 nm | ~5.63% | 2018 | [99] |
| Nitric acid | TEM- 5.6 nm | λem- λex- | 3.25% | ||||
| Phosphoric acid | λem- 560 nm λex- 460 nm | 2.76% | |||||
| Coke powder | Hydrogen peroxide | Chemical oxidation | TEM- 6.5 nm | λem- 410 nm λex- 330 nm | 9.2% | 2019 | [100] |
| Waste plastic bottles | Hydrogen peroxide | Air oxidation and hydrothermal | TEM- 3–10 nm | λem- 434 nm λex- 340 nm | 5.2% | 2019 | [101] |
| Waste tea powder | Nitric acid | Chemical oxidation | TEM- 3.2 nm | λem- 430 nm λex- 310 nm | 2.47% | 2019 | [102] |
| Waste tea powder | - | Carbonization | TEM- 5 nm | λem- 415 nm λex- 315 nm | 4.76% | 2019 | [103] |
| Waste green tea powder | Deionized water and manganese chloride | Hydrothermal | TEM- 5 nm | λem- 410–440 nm λex- 360 nm | 12% | 2019 | [104] |
| Tieguanyin Tea leaves | Acetic acid | Hydrothermal | TEM- 7–9 nm | λem- blue λex- 325 nm | - | 2019 | [105] |
| Peanut shell | λem- blue λex- 335 nm | ||||||
| Kerosene soot | Nitric acid | Oxidative acid treatment | HRTEM- 5 nm | λem- 510 nm λex- 300–360 nm | ~3% | 2019 | [106] |
| Paper waste | Deionized water | Hydro-/solvothermal | TEM- 2.6 nm | λem- blue λex- 360 nm | 12% | 2020 | [107] |
| Ethanol | TEM- 4.0 nm | λem- 435 nm (cyan) λex- 360 nm | 27% | ||||
| 2-propanol | TEM- 4.4 nm | λem- 435 nm (cyan) λex- 360 nm | 10% | ||||
| Polybags | - | Hydrothermal carbonization | HRTEM- 5–10 nm | λem- 420–425 nm λex- 310 nm | 62% | 2021 | [108] |
| Cups | λem- 420–425 nm λex- 310 nm | 65% | |||||
| Bottles | λem- 420–425 nm λex- 310 nm | 64% | |||||
| Polymeric waste | - | Hydrothermal | TEM- 3 nm | λem- 400 nm λex- 310 nm | - | 2021 | [109] |
| 4,7,10-trioxa-1,13-tridecanediamine | λem- 440 nm λex- 365 nm | ||||||
| Heavy oil | - | Hydrothermal | - | - | - | 2021 | [110] |
| Light deasphalted oil (LDAO) | - | - | ~64% | ||||
| Heavy deasphalted oil (HDAO) | - | - | 23.5% | ||||
| Asphalt | TEM- 2.39 nm | λem- 610 nm λex- 475 nm | 11.5% | ||||
| TEM- 1.77 nm | λem- 560 nm λex- 420 nm | 17.7% | |||||
| TEM- 1.21 nm | λem- 510 nm λex- 410 nm | 28.3% | |||||
| TEM- 1.18 nm | λem- 440 nm λex- 350 nm | 64% | |||||
| Waste tobacco leaves | Ethylenediamine and ultrapure water | Hydrothermal | TEM- 6.30 nm | λem- 430 nm λex- 360 nm | 13.7% | 2022 | [111] |
| Phenolic Compound | Material | Optical Sensor | Range of Detection | Limit of Detection | Linear Correlation Coefficient | Year | Reference |
|---|---|---|---|---|---|---|---|
| 2-4-6-Trinitrophenol | Amine-capped CDs | Fluorescent | 0–50 × 10−5 M | 0.9996 μM | - | 2013 | [114] |
| 2-4-6-Trinitrophenol | Tb-CDs | Fluorescent | 500 nM–100 μM | 200 nM | 0.991 | 2013 | [112] |
| 4-Nitrophenol | CDs | Fluorescent | 0.1–50 µM | 28 nM | - | 2014 | [115] |
| Tannic acid | PEGA-CDs | Fluorescent | 0.05–0.6 μM | 0.01 μM | - | 2015 | [204] |
| 2-4-6-Trinitrophenol | N-CQDs | Fluorescent | 0.27–34.1 µM | 50 nM | 0.992 | 2016 | [134] |
| 2-4-6-Trinitrophenol | CDs | Fluorescent | 0.1–26.5 µM | 51 nM | 0.995 | 2017 | [136] |
| 2-4-6-Trinitrophenol | CDs | Fluorescent | - | 0.127 µM | - | 2018 | [150] |
| Phenol | CDs | Fluorescent | 0–50 µM | 0.076 µM | 0.998 | 2018 | [95] |
| Tannic acid | N-CDs | Fluorescent | 0.4–9.0 µM | 0.12 µM | 0.9990 | 2019 | [167] |
| 4-Nitrophenol | CDs@MIPs | Fluorescent | 0–0.03594 mM | 35 nM | - | 2019 | [165] |
| p-Nitrophenol | Cu-doped carbon dots | Fluorescent | 0.5–50 μM | 0.08 μM | 0.998 | 2019 | [218] |
| 2-4-6-Trinitrophenol | CDs | Fluorescent | 0–305.54 μM | 0.023 μM | - | 2020 | [170] |
| o-Nitrophenol | CQDs | Fluorescent | 0.08–40 µM | 15.2 nM | 0.999 | 2020 | [34] |
| 4-Nitrophenol | N,CDs | Fluorescent | 0.25–125 μM | 0.05 μM | 0.9919 | 2020 | [222] |
| 2-4-6-Trinitrophenol | N@CDs | Fluorescent | 1–75 μM | 2.45 μM | 0.994 | 2020 | [221] |
| Trinitrophenol | wsNP-CDs | Fluorescent | 100–300 μM | 23 μM | 0.9861 | 2020 | [243] |
| Tannic acid | Nitrogen-doped CDs | Chemiluminescence | 0.2–10 μM | 39.3 nM | 0.9971 | 2020 | [173] |
| Chlorogenic acid | N,S-CDs | Fluorescent | 0.9314–83.82 μM | 0.3387 μM | 0.9970 | 2021 | [184] |
| 4-Nitrophenol | CDs@PDA | Fluorescent | 2–34 μM | 7.29 μM 3.44 μM | 0.992 0.993 | 2021 | [226] |
| 2-4-6-Trinitrophenol | N-CDs | Fluorescent | 0.3–3.3 μM | 0.11 μM | 0.9923 | 2021 | [72] |
| p-Nitrophenol | G-CDs | Fluorescent | 0–50 μM | 0.0175 μM | 0.9951 | 2022 | [76] |
| Pesticide | Material | Optical Sensor | Range of Detection | Limit of Detection | Linear Correlation Coefficient | Year | Reference |
|---|---|---|---|---|---|---|---|
| Methyl parathion | Tyr-CDs | Fluorescent | 1.0 × 10⁻¹⁰–1.0 × 10⁻⁴ M | 4.8 × 10⁻¹¹ M | 0.997 | 2015 | [121] |
| Paraoxon-ethyl | CDs | Fluorescent | 0–5.80 mM | 0.22 µM | 0.9974 | 2016 | [137] |
| Dichlorvos, malathion, ethion | CDs/Cu(II)/AChE/ATChCl | Fluorescent | 6 nM–0.6 nM 6 nM–0.8 nM 8 nM–0.8 nM | 3.8 nM 3.4 nM 4.2 nM | 0.998 0.996 0.997 | 2016 | [245] |
| Carbaryl | N,S co-doped CQDS | Photoluminescent | 0.00003131–3.131 µM | 0.02485 µM | - | 2016 | [209] |
| Paraoxon | CQDs | Fluorescent | 0.1817–181.7 nM | 0.1817 nM | 0.994 | 2017 | [211] |
| Paraoxon | BChE-ATCh-MnO2-CDs | Fluorescent | 0.1817–18.17 nM | 0.05451 nM | 0.9941 | 2017 | [155] |
| Chlorpyrifos | Fe-modified CDs | Fluorescent | 0.028523–2.8523 µM | 0.008557 µM | - | 2017 | [96] |
| Methyl parathion | N-doped CDs-MPH | Fluorescent | 2.38–73.78 µM | 0.338 µM | 0.9934 | 2017 | [138] |
| Paraoxon | CDs | Fluorescent | 0–1.817 µM | 0.00145 µM | 0.993 | 2018 | [154] |
| Atrazine | N-CQDs | Fluorescent | 0–1.0 nM | 3 pM | 0.9812 | 2018 | [213] |
| Atrazine; chlorpyrifos; imidacloprid; lindane; tetradifon | CDs | Fluorescent | - | 0.12 µM; 0.029 µM; 0.013 µM; 0.14 µM; 0.04 µM | - | 2019 | [246] |
| Pretilachlor | CDs | Fluorescent | 5.7 μM–61.5 μM | 2.9 µM | 0.9847 | 2019 | [60] |
| Diazinon | CDs | Fluorescent | 0.8214 nM–16.43 μM | 0.8214 nM | - | 2020 | [50] |
| Glyphosate | 1.4787 nM–29.574 μM | 0.01183 μM | |||||
| Amicarbazone | 1.036 nM–20.72 μM | 0.002072 μM | |||||
| Methyl-paraoxon | B,N-CDs | Fluorescent | 0.1–15 μM | 0.1 μM | 0.9967 | 2020 | [180] |
| Diazinon | CDs | Fluorescent | 0.02–10 μM | 0.01 μM | 0.9727 | 2020 | [62] |
| Trifluralin | Ca-modified CDs | Fluorescent | - | 7.89 µM | 0.96 | 2020 | [220] |
| Quinalphos | OPCD@UiO-66-NH2 | Fluorescent | 0–16 μM | 0.3 nM | 0.992 | 2021 | [247] |
| Chlorpyrifos | TEF-CDs | Fluorescent | 0.05–100.0 μM | 0.00599 μM | 0.9959 | 2021 | [63] |
| Quinalphos | 0.01–50.0 μM | 0.0057 μM | 0.9965 | ||||
| Pyrimethanil | CDs | Fluorescent | 0.5–75 μM | 14 nM | 0.9907 | 2021 | [182] |
| Thiophanate methyl | SCDs/Hg2+ | Fluorescent | 0.05–2.0 μM | 7.6 nM | 0.9998 | 2021 | [183] |
| 2.0–5.0 μM | 0.9983 | ||||||
| Isoprothiolane | CDs | Fluorescent | 1 mM-0.05 μM | 11.58 nM | 0.9921 | 2021 | [73] |
| λ-Cyhalothrin | CD-functionalized core-shell nanopsheres | Ratiometric fluorescent | 3.045–456.8 nM | 0.146 nM | 0.988 | 2022 | [230] |
| Chlorpyrifos | J-CQDs | Fluorescent | 57.05–513.4 nM | 7.701 nM | 0.993 | 2022 | [41] |
| Explosive Compound | Material | Optical Sensor | Range of Detection | Limit of Detection | Linear Correlation Coefficient | Year | Reference |
|---|---|---|---|---|---|---|---|
| 2,4,6-Trinitrotoluene | N-rich CNDs | Fluorescent | 10 nM–1.5 μM | 1 nM | - | 2015 | [120] |
| 2,4-Dinitrotoluene | Amine-functionalized CDs | Fluorescent | 1 mM–50 mM | 1 mM | - | 2016 | [132] |
| Trinitrotoluene | M-MIPs@CDs | Fluorescent | - | 17 nM | - | 2016 | [131] |
| 4-Chloro-2,6-dinitroaniline | CQDs@PAMAM-NH2 | Fluorescent | 1.0 × 10⁻⁵–6.0 × 10⁻⁵ M | 2 μM | 0.994 | 2016 | [208] |
| 2,4,6-Trinitrotoluene | Ethylenediamine-modified CDs | Fluorescent | - | 0.213 µM | 0.997 | 2017 | [139] |
| Trinitrotoluene | Nitrogen-doped CQD | Fluorescent | 4.4 nM–26.4 µM | 0.03258 µM | 0.9993 | 2018 | [214] |
| Trinitrotoluene | CDs capped with EDA | Fluorescent | 44.03–220.14 nM | 57.24 nM | 0.95457 | 2018 | [99] |
| CDs (in the presence of nitric acid) capped with\EDA | 44.03–220.14 nM | 48.43 nM | 0.9752 | ||||
| 88.06–264.17 nM | 21.88 nM | 0.99602 | |||||
| 2,4,6-Trinitrotoluene | CDs and Fe@SiO2-NH2 | Chemosensor | 44.03–8806 nM | 9.466 nM | - | 2021 | [248] |
| 2,4,6-Trinitrotoluene | PEI-CQDs | Fluorescent | 0–38.17 µM | 0.4094 µM | 0.9979 | 2022 | [196] |
Publisher’s Note: MDPI stays neutral with regard to jurisdictional claims in published maps and institutional affiliations. |
© 2022 by the authors. Licensee MDPI, Basel, Switzerland. This article is an open access article distributed under the terms and conditions of the Creative Commons Attribution (CC BY) license (https://creativecommons.org/licenses/by/4.0/).
Share and Cite
Omar, N.A.S.; Fen, Y.W.; Irmawati, R.; Hashim, H.S.; Ramdzan, N.S.M.; Fauzi, N.I.M. A Review on Carbon Dots: Synthesis, Characterization and Its Application in Optical Sensor for Environmental Monitoring. Nanomaterials 2022, 12, 2365. https://doi.org/10.3390/nano12142365
Omar NAS, Fen YW, Irmawati R, Hashim HS, Ramdzan NSM, Fauzi NIM. A Review on Carbon Dots: Synthesis, Characterization and Its Application in Optical Sensor for Environmental Monitoring. Nanomaterials. 2022; 12(14):2365. https://doi.org/10.3390/nano12142365
Chicago/Turabian StyleOmar, Nur Alia Sheh, Yap Wing Fen, Ramli Irmawati, Hazwani Suhaila Hashim, Nur Syahira Md Ramdzan, and Nurul Illya Muhamad Fauzi. 2022. "A Review on Carbon Dots: Synthesis, Characterization and Its Application in Optical Sensor for Environmental Monitoring" Nanomaterials 12, no. 14: 2365. https://doi.org/10.3390/nano12142365
APA StyleOmar, N. A. S., Fen, Y. W., Irmawati, R., Hashim, H. S., Ramdzan, N. S. M., & Fauzi, N. I. M. (2022). A Review on Carbon Dots: Synthesis, Characterization and Its Application in Optical Sensor for Environmental Monitoring. Nanomaterials, 12(14), 2365. https://doi.org/10.3390/nano12142365