Article

Effect of Annealing Temperature on Electrical Properties of ZTO Thin-Film Transistors

1
Key Laboratory for Comprehensive Energy Saving of Cold Regions Architecture of Ministry of Education, Jilin Jianzhu University, Changchun 130118, China
2
School of Electrical and Computer Science, Jilin Jianzhu University, Changchun 130118, China
3
Department of Basic Science, Jilin Jianzhu University, Changchun 130118, China
4
Department of Chemistry, Jilin Normal University, Siping 136000, China
*
Author to whom correspondence should be addressed.
Nanomaterials 2022, 12(14), 2397; https://doi.org/10.3390/nano12142397
Submission received: 30 May 2022 / Revised: 4 July 2022 / Accepted: 9 July 2022 / Published: 13 July 2022

Abstract

:
A high-performance ZnSnO (ZTO) thin-film transistor (TFT) was fabricated, with ZTO deposited by rf magnetron sputtering. XPS was used to analyze and study the effects of different annealing temperatures on the element composition and valence state of ZTO films. Then, the influence mechanism of annealing treatment on the electrical properties of ZTO thin films was analyzed. The results show that, with an increase in annealing temperature, the amount of metal bonding with oxygen increases first and then decreases, while the oxygen vacancy decreases first and then increases. Further analysis on the ratio of Sn2+ is presented. Electrical results show that the TFT annealed at 600 °C exhibits the best performance. It exhibits high saturation mobilities (μSAT) up to 12.64 cm2V−1s−1, a threshold voltage (VTH) of −6.61 V, a large on/off current ratio (Ion/Ioff) of 1.87 × 10⁹, and an excellent subthreshold swing (SS) of 0.79 V/Decade.

Graphical Abstract

1. Introduction

In recent years, oxide thin-film transistors have become a research hotspot in the display field due to their excellent characteristics such as high mobility, excellent uniformity, and high visible light transmittance [1,2,3,4,5]. Indium-containing metal oxide semiconductors, such as InZnO, InGaZnO, and HfInZnO, have been widely studied, due to high carrier mobility arising from the special electron configuration (n − 1)d10ns0 of the In ion [6]. However, as In is an expensive and toxic material, its cost and availability will hinder their wide deployment for TFT [7,8,9]. In contrast, Sn not only has a similar electronic structure to In, but is also non-toxic and less costly. Sn-based oxide semiconductors, such as ZnSnO (ZTO), are regarded as a competitive alternative to In-based oxide semiconductors [10]. When Sn replaces the Zn2+ position in the crystal structure of zinc oxide, it becomes Sn4+, resulting in two additional free electrons helping to conduct electricity. In addition, Sn4+ and Zn2+ have ionic radii of 0.70 nm and 0.74 nm, respectively. Therefore, Sn is considered to be the most convenient dopant [11].
To date, ZTO thin-film transistors (TFTs) are yet to achieve the desired performance. The residual electrons generated by oxygen vacancy (VO) result in transistor performance deterioration, such as large turn-off current and depletion mode with large threshold voltage [12]. Some researchers have reported that thermal annealing at appropriate temperature can improve the VO in ZnO [13], ZnSnO(ZTO) [14], InGaZnO(IGZO) [8,15], and InZnSnO(IZTO) [16] films, thus improving the electrical properties of corresponding TFTs. However, the factors affecting and inhibiting VO in ZTO films and the mechanism of improving the electrical properties are not clear.
In this paper, a ZTO TFT was prepared by rf magnetron sputtering at different annealing temperatures. The effects of annealing temperature on saturation mobility, threshold voltage, switching ratio, and subthreshold swing of thin-film transistors were studied. AFM characterization was used to study the morphologic characteristics of the film surface, and XRD and XPS tests were used to analyze the influence of the changes in the film on the electrical properties of the film transistor. The results show that, with a change in annealing temperature, the surface morphology and internal characteristics of the film change greatly, which has a great impact on the electrical properties.

2. Materials and Methods

All samples were prepared by lift-off process. All samples with 300 μm electrode width and 10 μm channel spacing were fabricated on a SiO2/p-Si substrate. The thickness of SiO2 on SiO2/p-Si substrate is 285 nm, in which the crystalline phase of silicon is Si (100). The SiO2/p-Si substrate was first cleaned by acetone, anhydrous ethanol, and deionized water in sequence, and after the nitrogen gas was blown dry, the photolithography mask was processed. The active layer was grown by a Kurt J. Lesker PVD75 (Pittsburgh, PA, USA) magnetron sputtering system at room temperature. The sputtering power of zinc oxide target and metal tin target was 100 W and 15 W, respectively, and the argon–oxygen ratio was 95:5. After the mask was removed, the samples were rapidly annealed in air at 400–700 °C for 1 h. Electron beam evaporation (Taiwan, China) method was used to prepare TFT source/drain Al electrodes. Except annealing temperature, the deposition conditions of all samples during the film preparation were the same. The schematic diagram of the TFT is shown in Figure 1.
The morphologies of the films were tested by Oxford MFP-3D Atomic Force Microscope (AFM, Santa Barbara, CA, USA). A JEOL JSM-7610F (Akishima-shi, Japan) scanning electron microscope (SEM) was used for cross-section inspection. The transmittance of the film was measured by UV-2600 UV-visible spectrophotometer (Tokyo, Japan). X-ray photoelectron spectroscopy (XPS) measurements were performed using Thermo Fisher Scientific ESCALAB 250Xi (Waltham, MA, USA) and photoelectron spectroscopy system, in which a monochrome Al-Ka (Waltham, MA, USA) (1486.6 eV) X-ray source was used to observe the changes in elements in the film. The crystal phase structure of the films was measured by Bruker D8 Discover X-ray diffractometer (XRD, Karlsruhe, Germany), where the X-ray source is Cu-Ka line, and the detection size is 1 mm × 12 mm. The electrical characteristics of ZTO thin-film transistors were measured by Keysight B1500A semiconductor parameter meter (Santa Rosa, CA, USA). An RTP-100 type rapid annealing furnace (Unitemp, Germany) was used for annealing equipment. The above tests were carried out in ambient air.

3. Results

3.1. Thin-Film Transmission Spectrum Analysis

To prove that ZTO thin films can be used for transparent display, a layer of ZTO was deposited on a sapphire substrate and the transmittance tested. Figure 2 shows the transmission spectra of as-grown and annealed ZTO films in the wavelength range of 200–800 nm. The transmittance of the spectrum is more than 90% in the visible light range, and therefore can be applied in the transparent display field.

3.2. Film AFM Characterization Analysis

To characterize the thickness, morphology, and roughness of the film, AFM and SEM measurements were carried out. Figure 3 shows AFM images and cross-sections of ZTO films annealed at different temperatures. Table 1 lists the root-mean-square (RMS) roughness of different ZTO films. The test results show that the annealing causes the clustering phenomenon of the films, resulting in an increase in the roughness. As the annealing temperature rises from 400 °C to 600 °C, the roughness gradually decreases from 3.5 nm to 2.1 nm, and the annealing temperature continues to rise to 700 °C, the roughness of the film begins to increase from 2.1 nm to 2.3 nm. The initial decrease in roughness is due to the improvement in film quality due to annealing, and the subsequent increase in roughness is due to the formation of crystals in the film. The cross-section (f) shows that the thickness of the deposited film at room temperature is about 85 nm.

3.3. XRD Spectrum Analysis

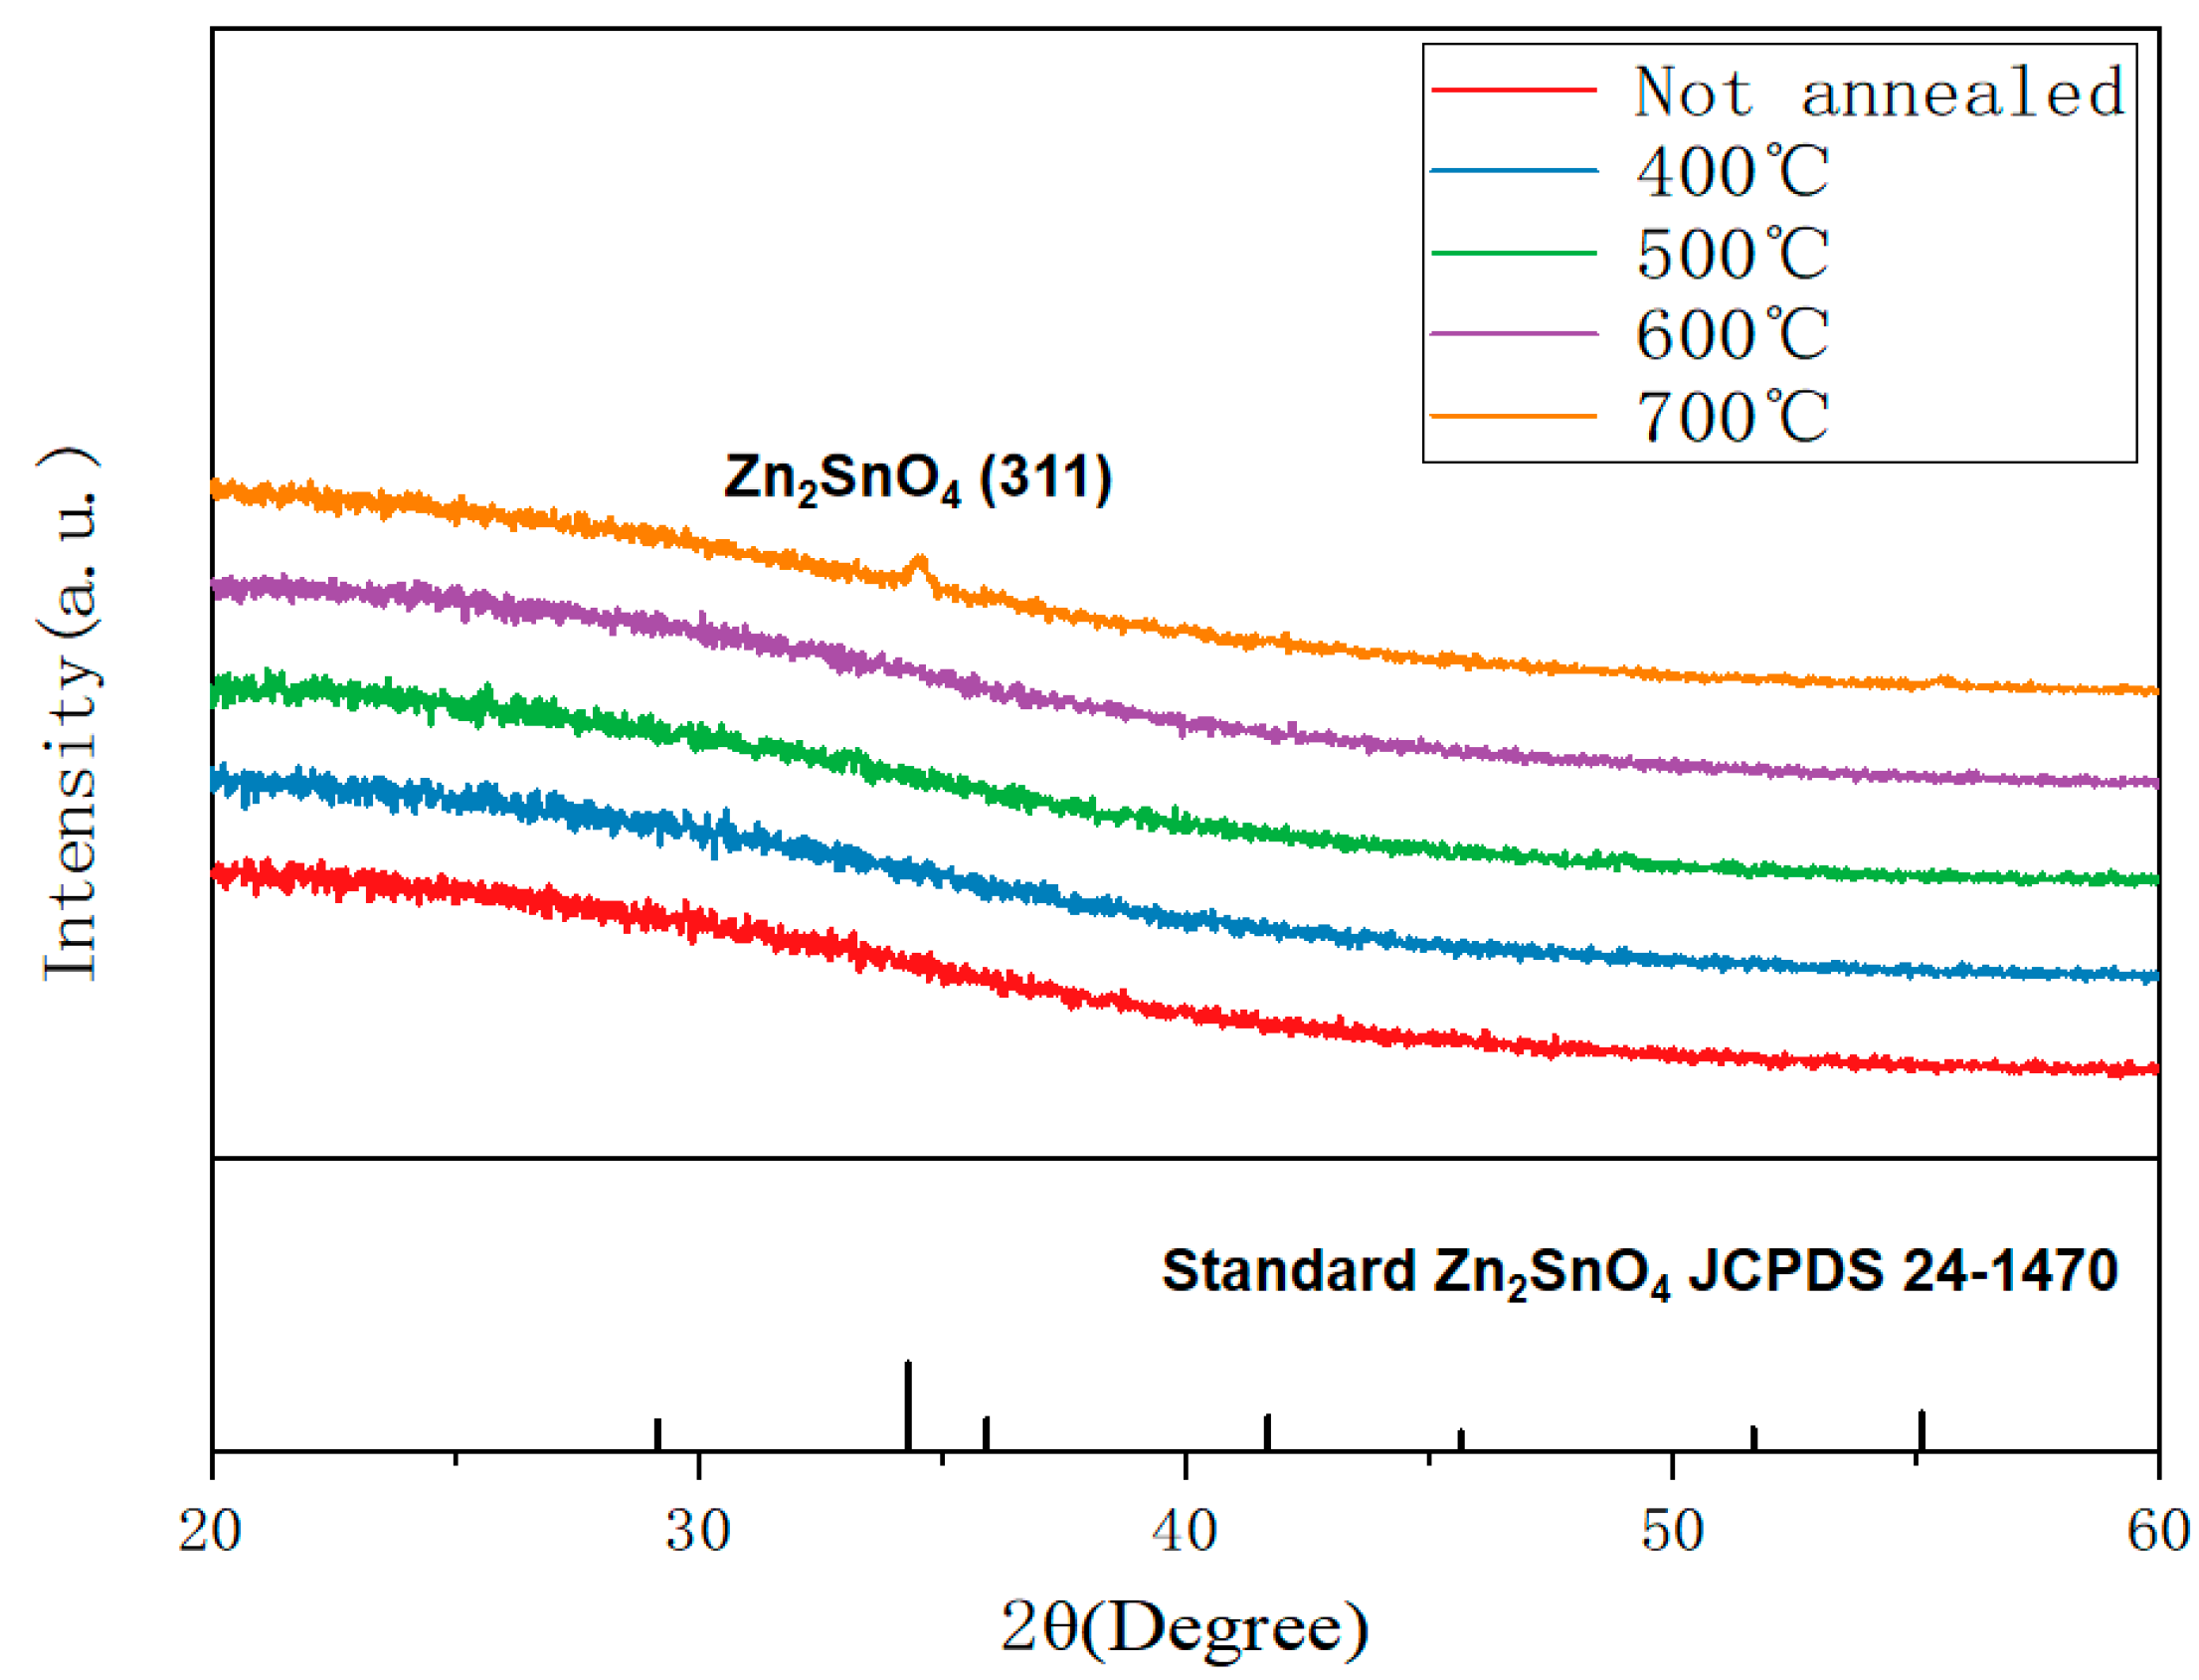
To analyze the effect of annealing temperature on the internal structure of the film, XRD measurements were carried out on the film. Figure 4 shows the XRD test spectra of the films without annealing and at different annealing temperatures. Since the crystallization temperature of ZTO film is usually greater than 600 °C [13,17,18]. The high Sn content in the film destroys the good crystal structure of ZnO, resulting in the formation of amorphous structure when the film is not annealed or annealed at 400 °C–600 °C. It can be seen from Figure 4 that when annealing at 700 ℃, a crystallization peak appears near 34.56° and the crystallinity is poor. This indicates that the film crystallizes gradually when annealed at 700 °C, and the microcrystalline size in the film is very small [9,19].

3.4. XPS Photoelectron Spectroscopy Analysis

To derive the effect of annealing temperature on the element proportion and valence state in ZTO film, XPS was used to analyze the ZTO film. According to the analysis of total XPS energy spectrum, the proportion of each element in the film and the proportion of Zn and Sn in the metal were obtained. The data are listed in Table 2.
According to Table 2, content changes in Zn, Sn, and O in the film were obtained. When the annealing temperature rose from 400 °C to 600 °C, the content of Zn gradually increased, the content of Sn gradually decreased, and the content of O gradually decreased. Since Zn elements commonly have Zn2+ and Sn elements have Sn4+ and Sn2+, and Zn is more active than Sn, the O first bonds with Zn, and the remaining O bonds with Sn. Combined with the chemical ratio of Sn and O in Table 2, the content of Sn4+ ions in the film decreases and the content of Sn2+ ions increases, while the oxygen content in the film gradually decreases. When the annealing temperature rises to 700 °C, Zn content decreases, Sn content increases, and O content increases. At this point, the content of Sn2+ ions in the film decreases and the content of Sn4+ ions increases, because the oxygen content in the film begins to rise.
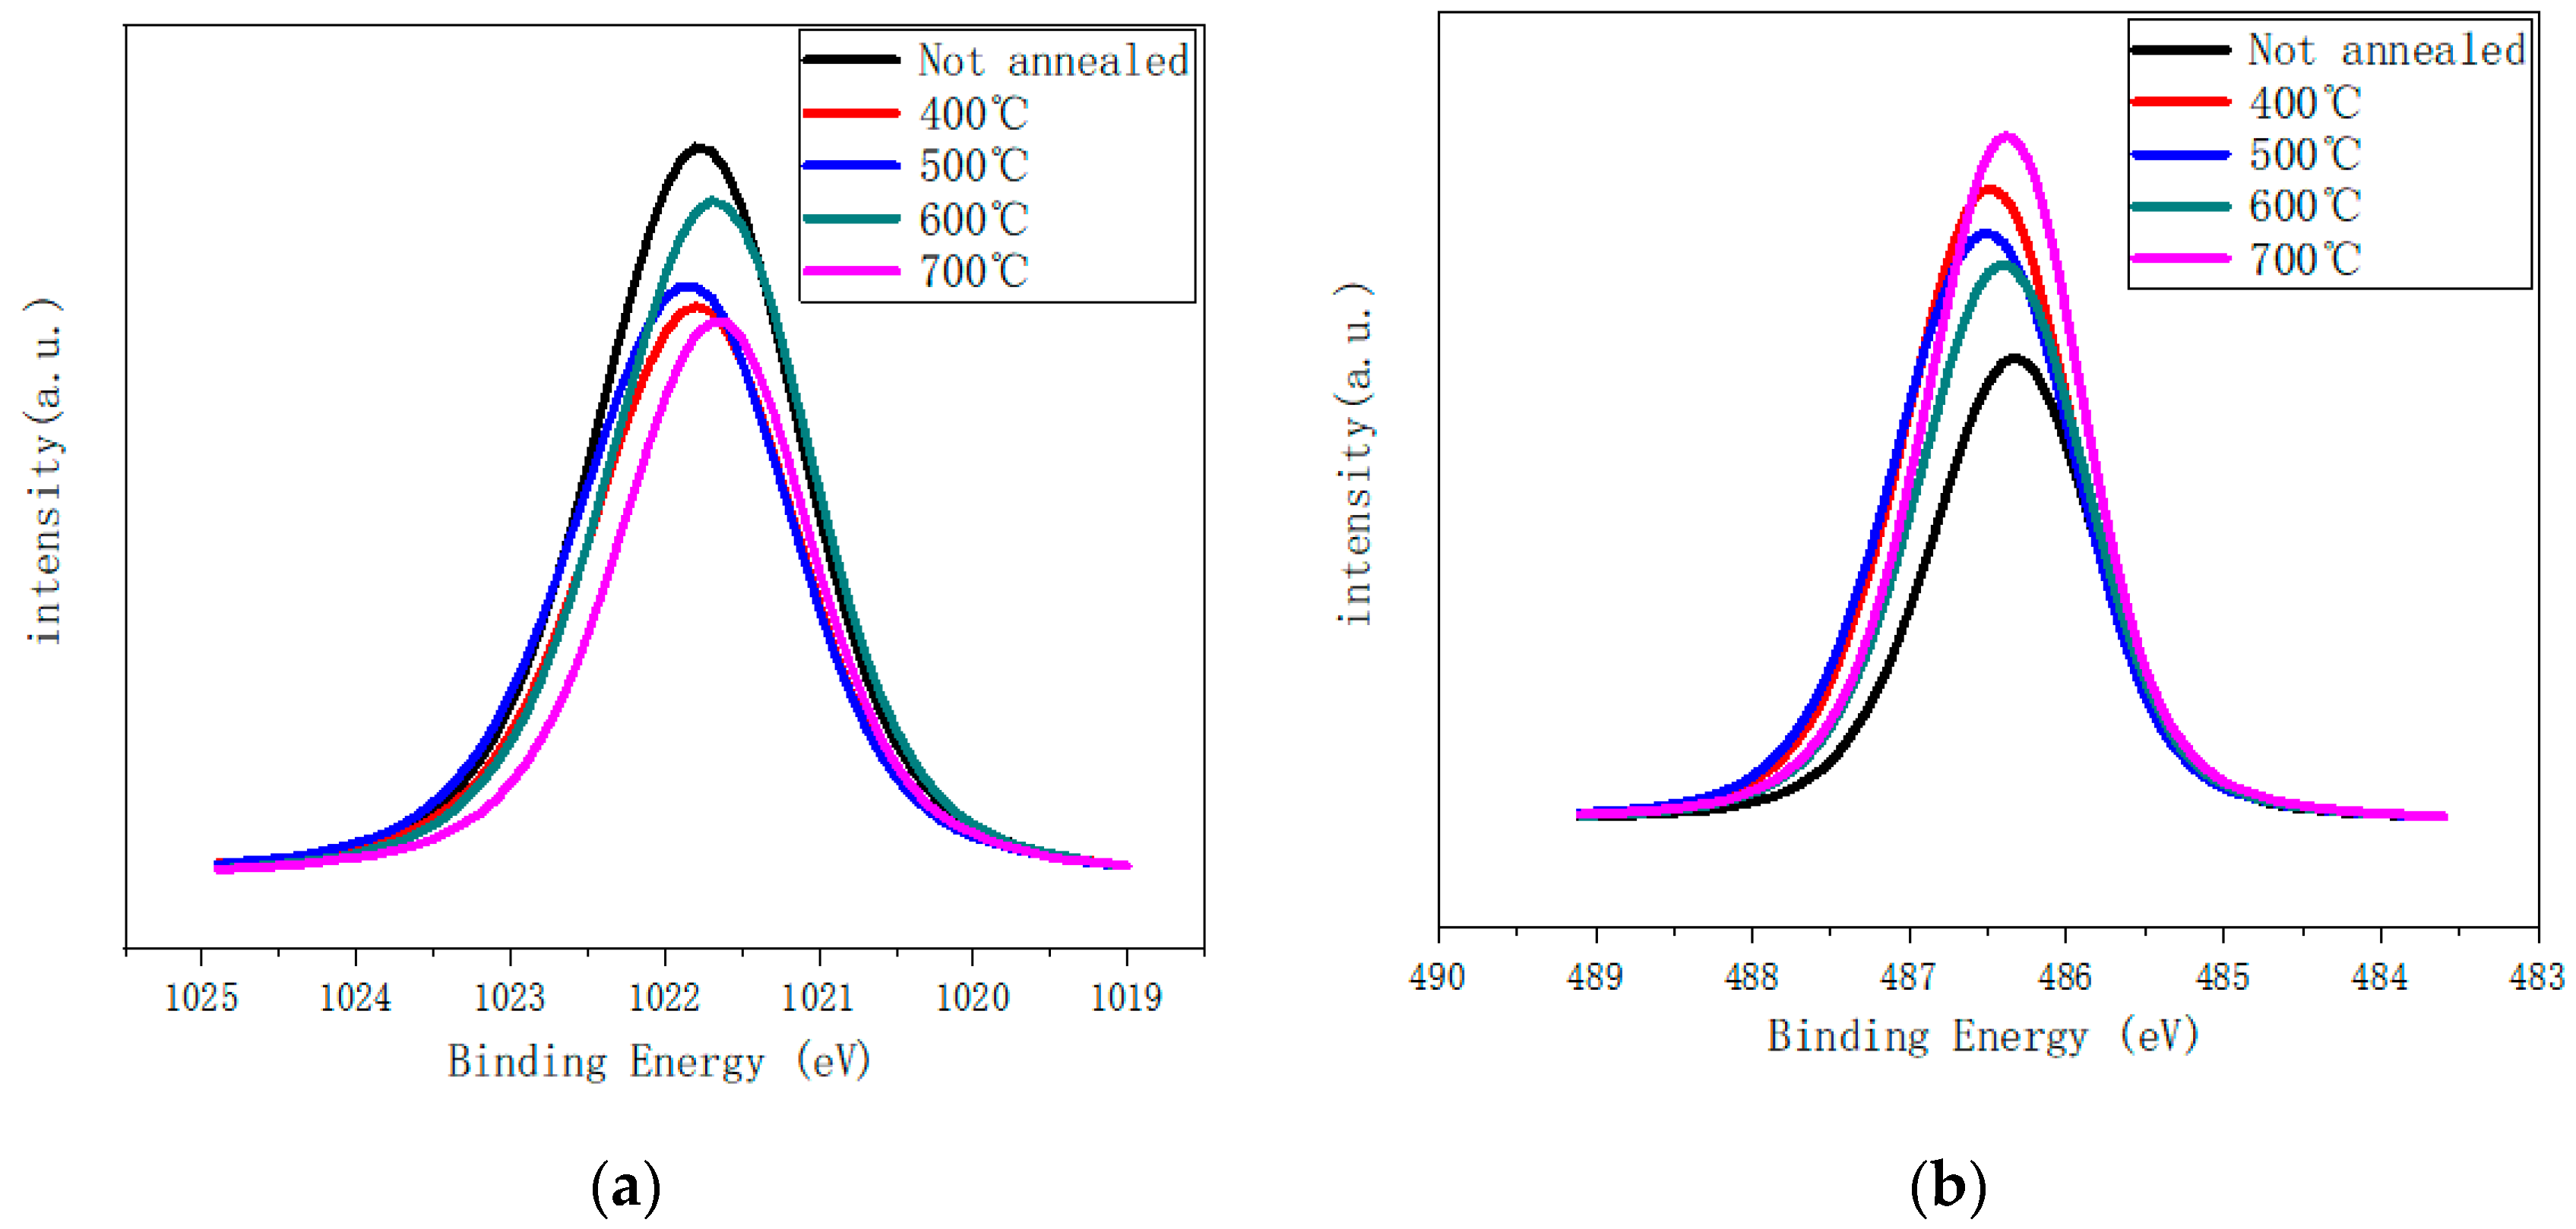
Figure 5 shows the XPS spectra of Zn2p and Sn3d peaks. The ratio of peak integral areas of Zn2p and Sn3d in Table 3 is obtained according to Figure 5. The chart shows that when the annealing temperature rises from 400 °C to 600 °C, the proportion of Zn-O peak area increases while the proportion of Sn-O peak area decreases. At this time, more Zn-O bonds are formed than Sn-O bonds. When the annealing temperature rises to 700 °C, the proportion of Zn-O peak area decreases obviously, while the proportion of Sn-O peak area increases obviously. The results show that more Sn-O bonds are formed at higher annealing temperature. The results are consistent with those in Table 2.
Figure 6 shows the O1s XPS spectra of as-grown and annealed films at 400 °C to 700 °C. Using the Gauss Lorentz fitting method, it is divided into three fitting peaks, located at 530.15 eV, 531.5 eV, and 532.2 eV, respectively. There is low binding energy of O1s spectrum at 530.15 eV (OOM). The O2− ion is surrounded by a complete complement of Zn (or substituted Sn) atoms and its nearest neighbor O2− ion [20,21]. The medium component at 531.2 eV (OV) corresponds to oxygen ions in oxygen-deficient regions [22,23]. Therefore, the change in the component strength may be related to the change in oxygen vacancy concentration. The third peak (OS) at 532.2 eV is usually attributed to the presence of loosely bound oxygen on the surface of the ZTO membrane [24,25,26,27].
Table 4 shows fitting peak contents of O1s peaks at non-annealed and 400–700 °C annealed temperatures. With an increase in annealing temperature from 400 °C to 600 °C, OOM content increases, OV content decreases, and OS decreases gradually. When the annealing temperature rises to 700 °C, OOM content continues to increase, OV content begins to increase, and OS content continues to decrease. The results show that with an increase in annealing temperature, the loose bonding on the film surface decreases gradually. Proper annealing temperature in air can improve the oxygen vacancies and other oxygen-related defects, while too-high annealing temperature will worsen the oxygen vacancies in the films. Combined with the analysis of Sn valence state in the film mentioned above, when the content of Sn2+ ions in the film is higher than that of Sn4+ ions, the content of oxygen vacancy in the film is reduced. In an OOM peak study, it is found that it increases gradually with an increase in annealing temperature, which indicates that more Sn-O bonds are formed in the film.

3.5. Device Electrical Performance Analysis

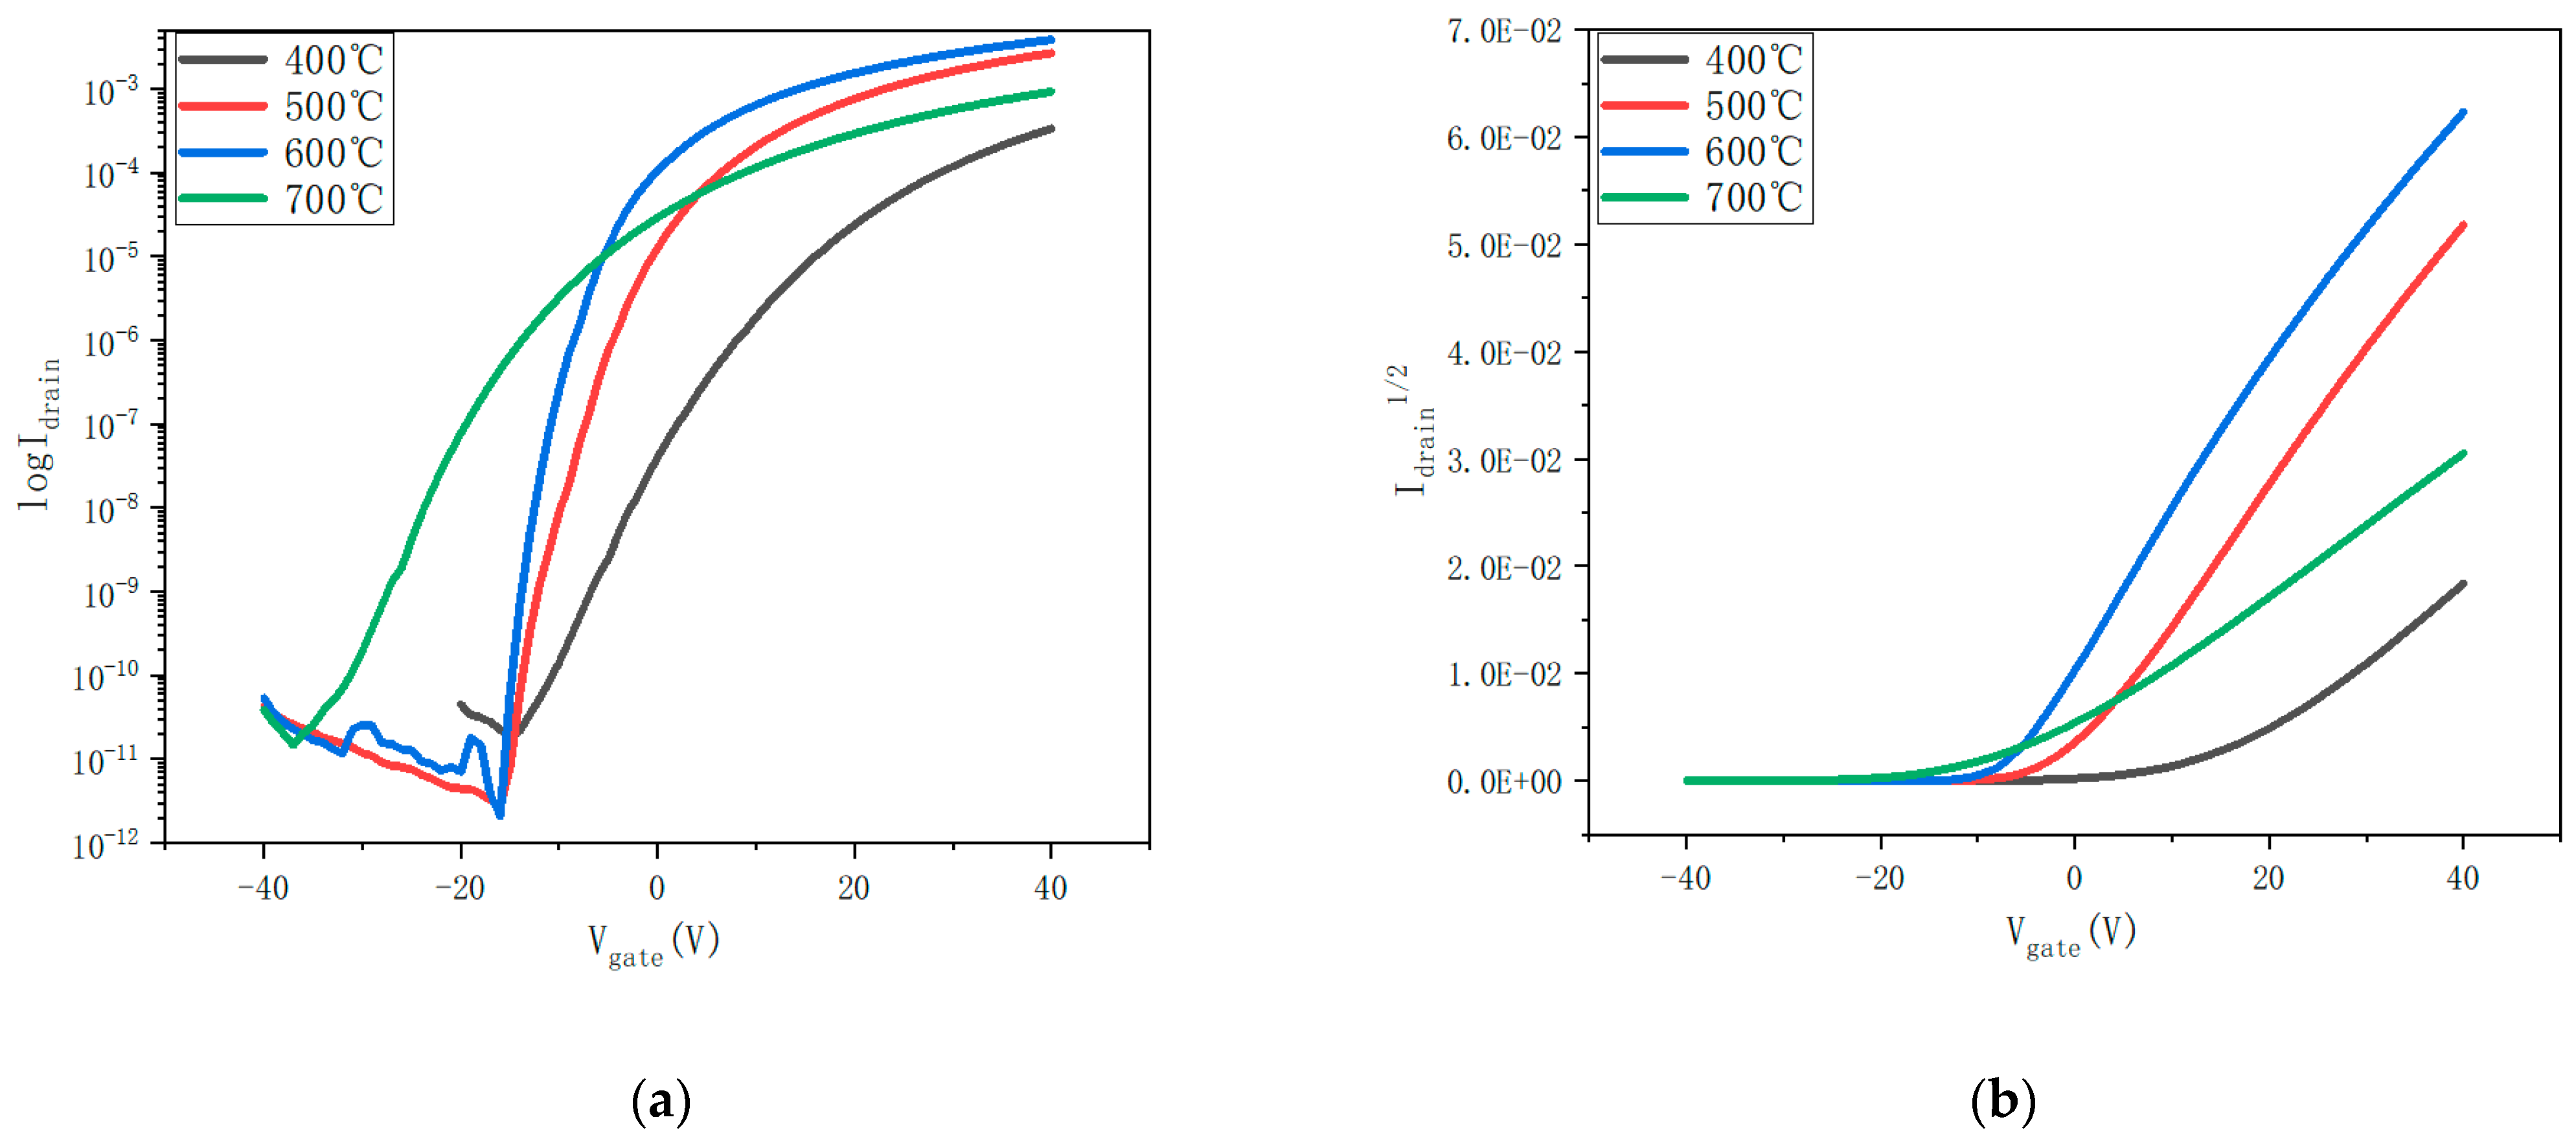
Figure 7 shows the transfer curves of annealed ZTO thin-film transistors at temperatures ranging from 400 °C to 700 °C. To obtain electrical performance parameters, the transfer curves of annealed ZTO thin-film transistors at VGS voltages ranging from −40 V to 40 V were scanned and plotted at VDS of 20 V.
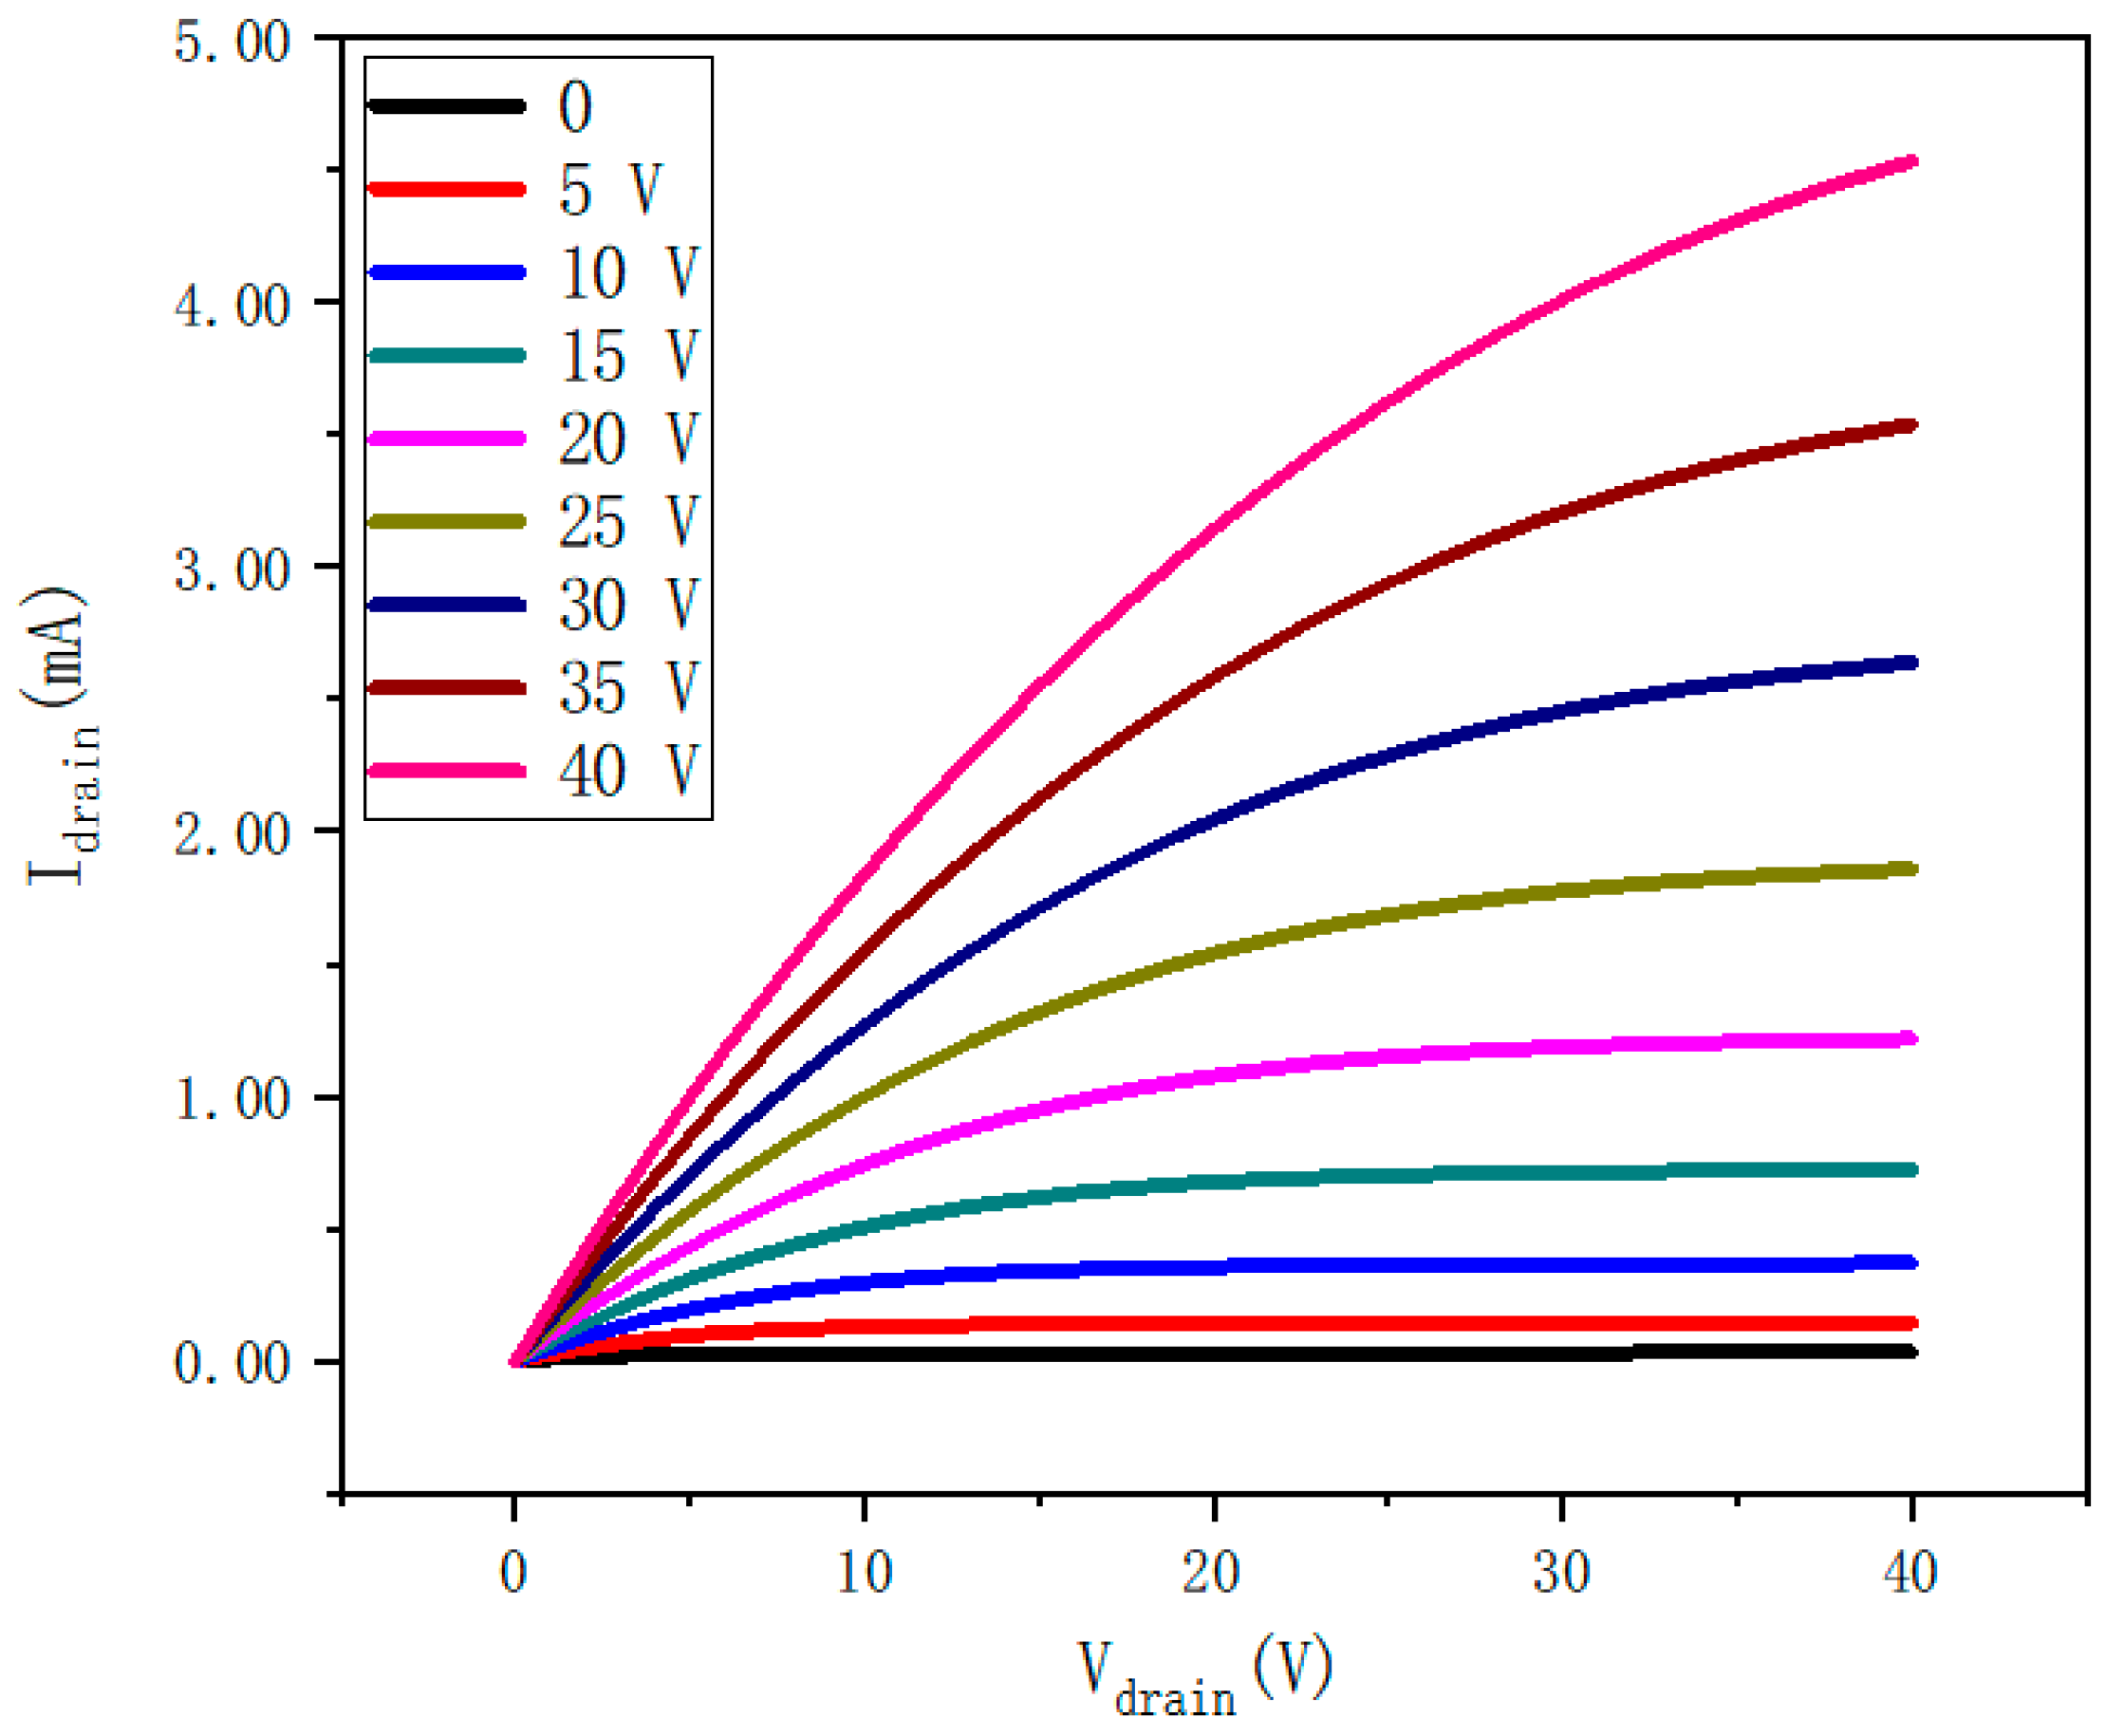
Figure 8 shows the output characteristics of a ZTO thin-film transistor annealed at 600 °C. The source-to-drain current (IDS) is plotted relative to the source-to-drain voltage (VDS), which ranges from 0 to 40 V. Thin-film transistors exhibit high drain current (IDS) and have a good saturation trend. Under positive VGS, IDS increases significantly as VGS increases from 0 to 40 V at a step size of 5 V, indicating that thin-film transistors work as n-channel FETs, and thin-film transistors also work as n-channel FETs at other annealing temperatures. In addition, the output curve indicates a good ohmic contact with the source/leakage electrode. A saturation drain current of 4.53 mA at a VGS of 40 V provides a large drive current for pixel switch and driver applications.
Device characteristics show that the annealing temperature has a significant effect on the electrical properties of the ZTO TFT. The threshold voltage (VTH) is obtained by fitting the linear part of the transfer curve in Figure 7b. Saturation mobility, current switching ratio, and subthreshold swing were obtained by the following formula [9]:
μ SAT = 2 L WC i I DS V GS 2 ,
I ON / I OFF = I DS max I DS min ,
SS = dV GS d log I DS ,
In the above formula, Ci is the capacitance of gate insulator per unit area, W is channel width, L is channel length, VGS is the grid applied voltage, and IDS is drain current. The saturation mobility, threshold voltage, current switching ratio, and subthreshold swing at different annealing temperatures are obtained, and the values obtained are listed in Table 5.
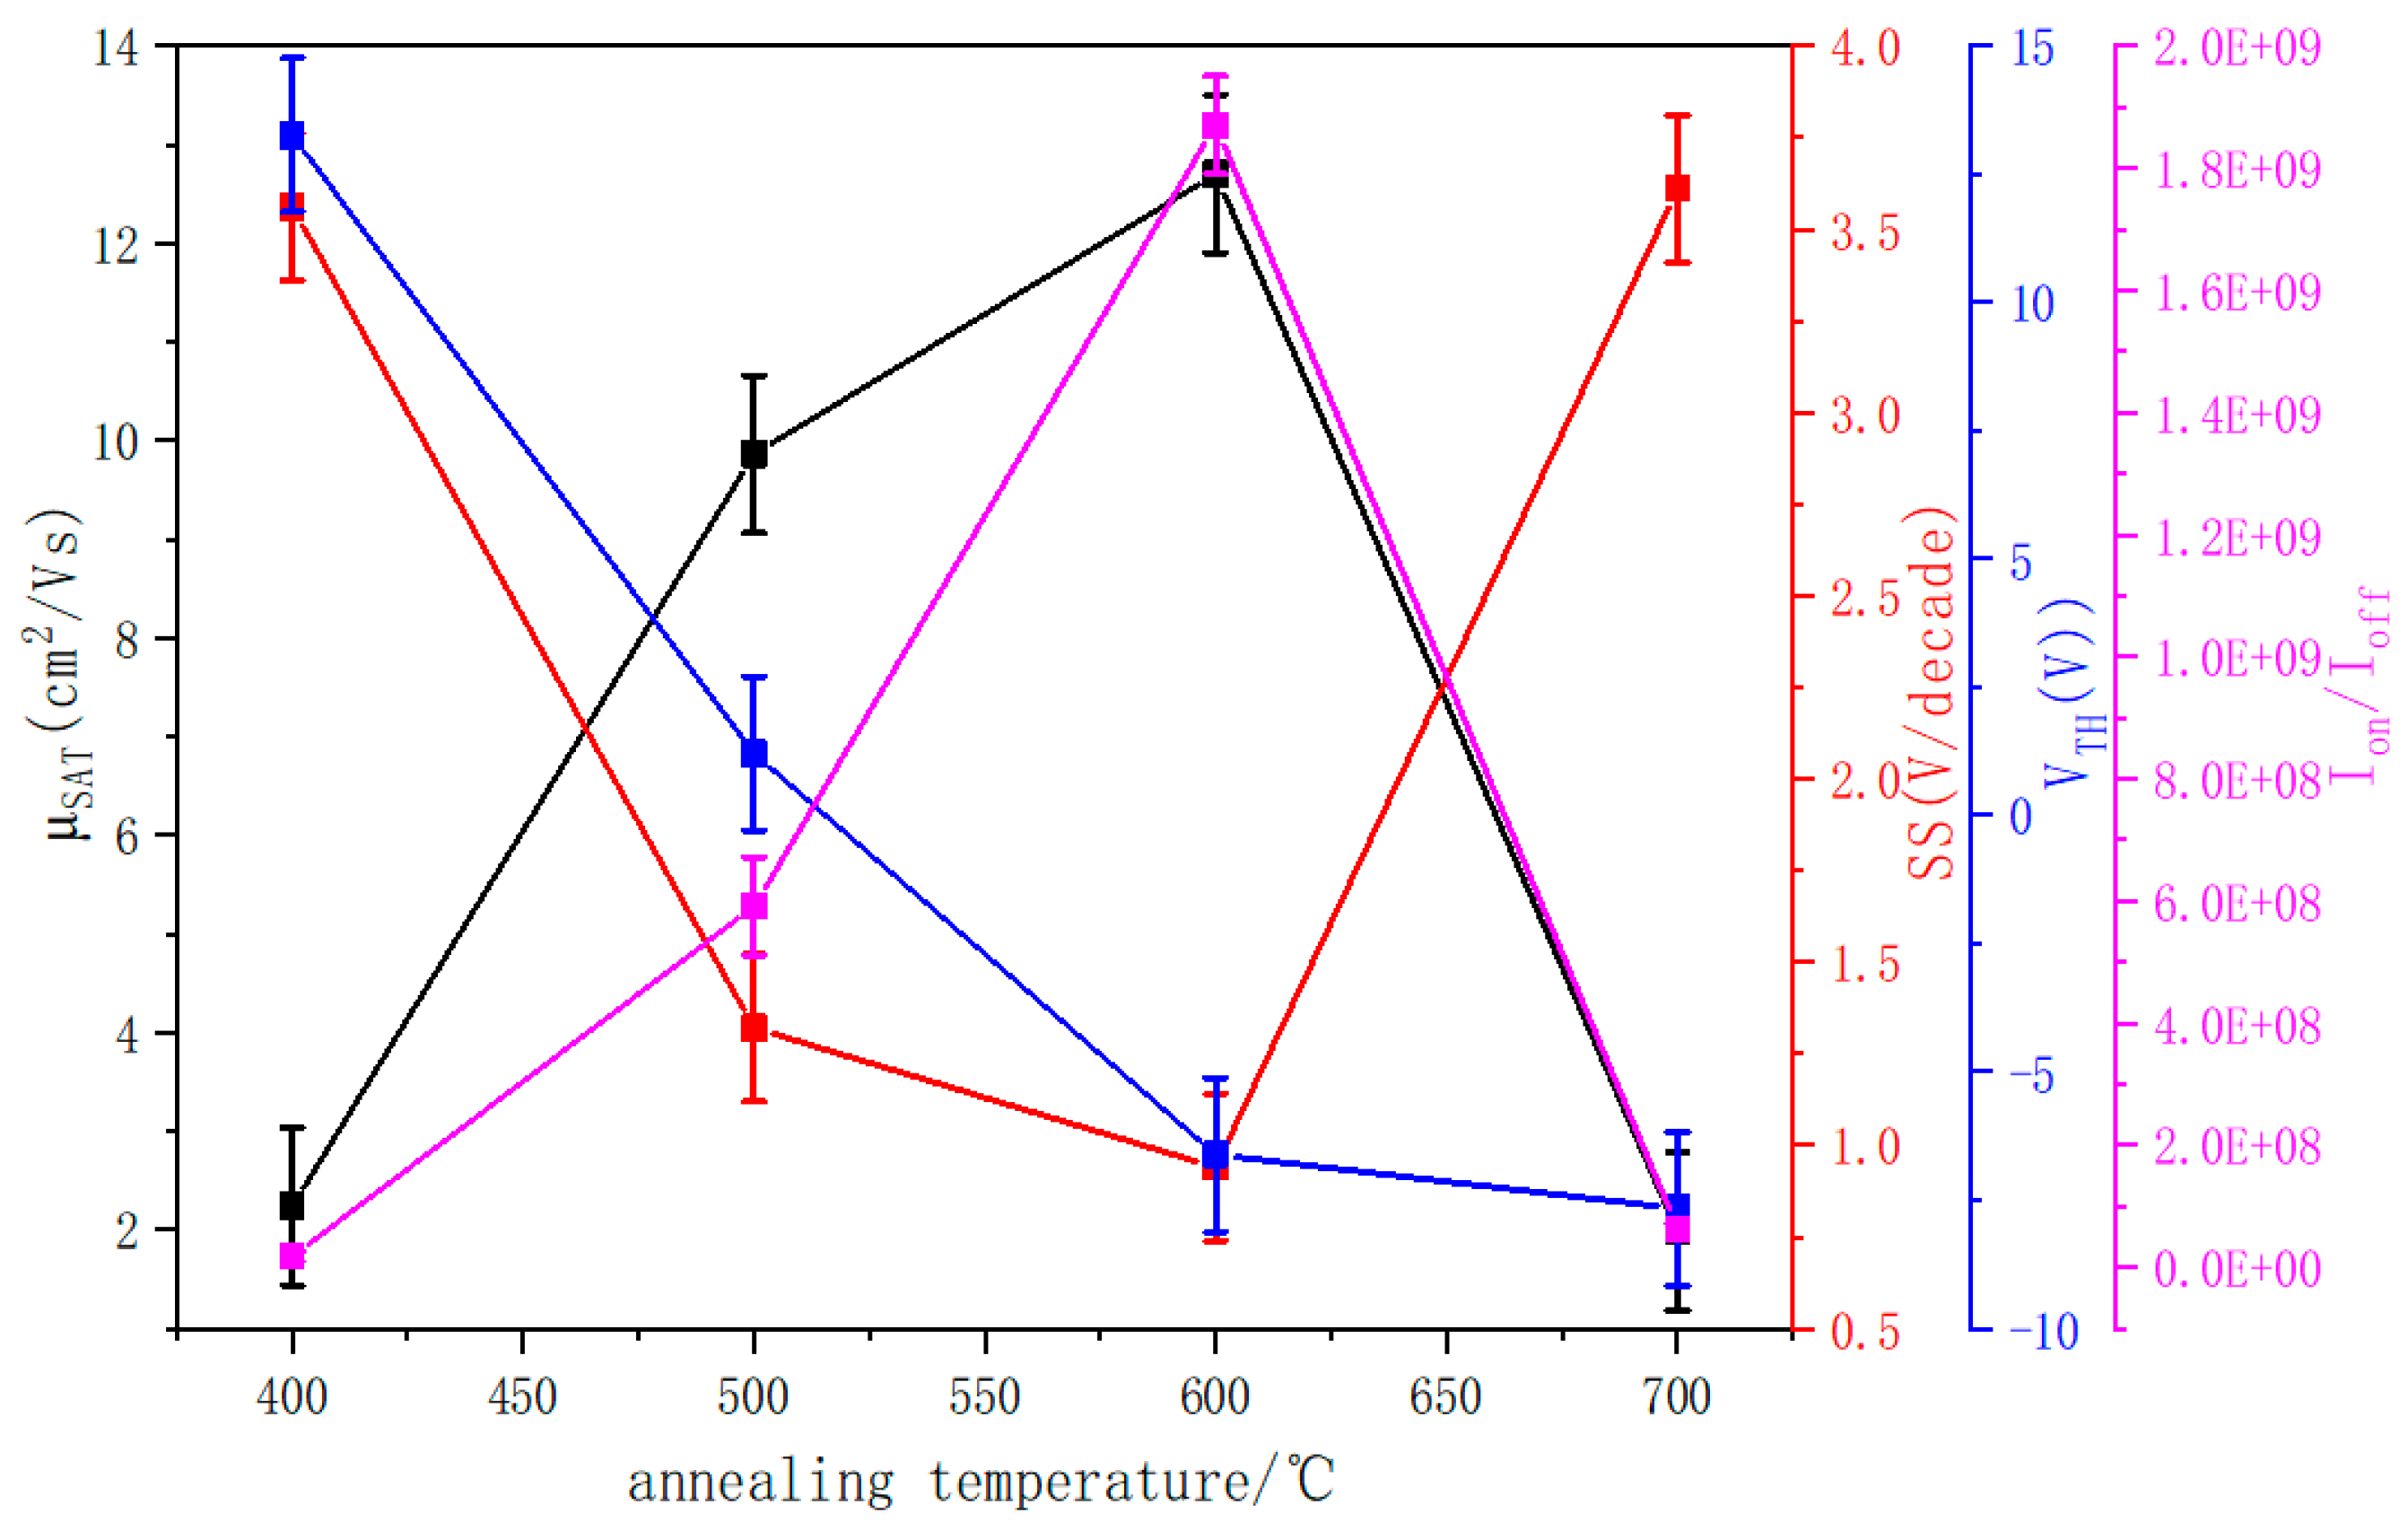
Combined with the data in Table 5, μSAT and Ion/Ioff begin to increase and then decrease with the increase in temperature, but the subthreshold amplitude (SS) is just the opposite. According to the interface trap state density formula [9], the variation in SS is consistent with the number of defects in the film. When the number of OV in the film decreases, SS decreases, and when the number of OV increases, SS increases.
The mobility changes largely depend on the film surface roughness. Due to the uniform interface between the active layer and the electrode contact, the ZTO film with low surface roughness is desirable for the electrical characteristics of thin-film transistors. Lower surface roughness contributes to a lower scattering effect at the interface between the source and the active layer and enhances the carrier mobility from the source drain to the active layer [28]. When the annealing temperature increases from 400 °C to 600 °C, SS decreases from 3.56 V/Decade to 0.79 V/Decade, and RMS decreases from 3.5 nm to 2.1 nm. According to the interface trap state formula, the trap state and roughness between the interface of active layer and insulating layer decrease. In addition, the oxygen vacancy concentration in the film decreases, and the charge trap sites in the band gap and conduction band decrease, resulting in mitigated carrier scattering [29,30] and higher μSAT. The electron mobility increased from 2.24 cm2/Vs to 12.64 cm2/Vs.
As the annealing temperature rises to 700 °C, the oxygen vacancy content increases. SS increases from 0.79 V/Decade to 3.61 V/Decade, suggesting the density of trap states at the interface between the active layer and the insulating layer increases. XRD spectrum indicates that crystal structures appear in the film. According to the influence of grain boundary on the thin-film transistor performance model, trap states capture electrons and introduce positive charges near the grain boundary [25,31], which reduces the carrier mobility from 12.64 cm2/Vs to 1.98 cm2/Vs.
Table 5 shows the on- and off-currents of ZTO thin-film transistors annealed at different temperatures. Combined with Figure 9, the current on/off ratio increases when the annealing temperature increases from 400 °C to 600 °C. On the one hand, the increase in current is related to the increase in mobility. On the other hand, oxygen vacancy is the main source of free electron transport in MOS. Due to the interface trap between the active layer and the gate insulator and the reduction of oxygen vacancy, the electron carrier concentration decreases. This leads to reduced off-state current from 18.1 pA to 2.08 pA and increased current switching ratio from 1.87 × 10⁷ A to 1.87 × 10⁹ A. When the annealing temperature rises to 700 °C, the decrease in mobility leads to the decrease in on-state current. In the meantime, the increase in oxygen vacancy content generates higher off-state drain current. As a result, the off-state current increases from 2.08 pA to 14.8 pA, and the current switch ratio decreases from 1.87 × 10⁹ A to 6.30 × 10⁷ A.
In addition, it can be seen from Table 5 that the threshold voltage of the films annealed at 400 °C and 500 °C is 13.26 V and 1.21 V, respectively, showing n-channel enhancement-mode operation. Due to the reduction of oxygen vacancy content at 500 °C, this means that, at the lower gate voltage, additional electrons can be easily activated and accumulate enough to the conduction band as a charge carrier [32]. Therefore, VTH is shifted to negative direction. The threshold voltages of the films at 600 °C and 700 °C are −6.61 V and −7.66 V, respectively, and the device shows n-channel depletion type. As the annealing temperature rises to 700 °C, crystallization begins to occur inside the film, forming a grain boundary barrier and making VTH shift more negative. In conclusion, by analyzing the samples at different annealing temperatures, we found that the appropriate annealing temperature can improve the electrical properties of the devices. With the increase in annealing temperature, the performance of the device tends to be better, and too-high annealing temperature will reduce the performance of the device.

4. Conclusions

A ZTO TFT was successfully fabricated with the channel active layer prepared by RF sputtering. The impact of annealing at 400 °C to 700 °C on the crystallinity, the stoichiometry, oxygen vacancy of ZTO, as well as the device performance were investigated. In our experiment, when the annealing temperature increased from 400 °C to 700 °C, the electrical properties of the device increased first and then decreased, and the sample at 600 °C was the best in our experiment, including μSAT of 12.64 cm2/Vs, VTH at −6.61 V, SS at 0.79 V/decade, Ion/Ioff at 1.87 × 10⁹, and lower turn-off current at 2.08 pA.

Author Contributions

Conceptualization and methodology, L.G. and C.W. (Chong Wang); data management, C.W. (Chao Wang); method, L.G. and X.C.; experimental validation, C.W. (Chong Wang) and M.L.; project management, C.W. (Chao Wang), X.G., Y.C. and X.Y.; capital acquisition and resources, C.W. (Chao Wang), F.Y., H.W., Y.C. and X.Y.; writing—first draft preparation, C.W. (Chong Wang); writing—review and editing, L.G. and C.W. (Chong Wang) All authors have read and agreed to the published version of the manuscript.

Funding

This research was funded by the Department of science and technology of Jilin Province (grant number 20210203021SF and grant number 20210506035ZP) and Jilin Provincial Department of education (grant number JJKH20220272KJ).

Institutional Review Board Statement

Not applicable.

Informed Consent Statement

Not applicable.

Data Availability Statement

The data that support the findings of this study are available from the corresponding authors upon reasonable request.

Acknowledgments

The authors are grateful to project support of Jilin Provincial Department of science and technology (grant number 20210203021SF and grant number 20210506035ZP) and Jilin Provincial Department of education (grant number JJKH20220272KJ). The authors gratefully acknowledge the financial support from Key Laboratory for Comprehensive Energy Saving of Cold Regions Architecture of Ministry of Education, Jilin Jianzhu University in Changchun Province (JLZHKF022021005).

Conflicts of Interest

The authors declare no conflict of interest.

References

  1. Lim, W.; Wang, Y.L.; Ren, F.; Norton, D.P.; Kravchenko, I.I.; Zavada, J.M.; Pearton, S.J. Indium zinc oxide thin films deposited by sputtering at room temperature. Appl. Surf. Sci. 2008, 254, 2878–2881. [Google Scholar] [CrossRef]
  2. Lim, H.S.; Rim, Y.S.; Kim, D.L.; Jeong, W.H.; Kim, H.J. Carrier-suppressing effect of Mg in solution-processed Zn-Sn-O thin-film transistors. Electrochem. Solid State Lett. 2012, 15, H78. [Google Scholar] [CrossRef]
  3. Kim, M.H.; Lee, H.S. Effect of In addition and annealing temperature on the device performance of solution-processed In–Zn–Sn–O thin film transistors. Solid-State Electron. 2014, 96, 14–18. [Google Scholar] [CrossRef]
  4. Yang, J.H.; Choi, J.H.; Cho, S.H.; Pi, J.E.; Kim, H.O.; Hwang, C.S.; Park, K.; Yoo, S. Highly Stable AlInZnSnO and InZnO Double-layer Oxide Thin-film Transistors with Mobility over 50 cm2/Vs for High-Speed Operation. IEEE Electron Device Lett. 2018, 39, 508–511. [Google Scholar] [CrossRef]
  5. Li, Q.; Dong, J.; Han, D.; Xu, D.; Wang, J.; Wang, Y. Structural Engineering Effects on Hump Characteristics of ZnO/InSnO Heterojunction Thin-Film Transistors. Nanomaterials 2022, 12, 1167. [Google Scholar] [CrossRef]
  6. Nomura, K.; Ohta, H.; Ueda, K.; Kamiya, T.; Hirano, M.; Hosono, H. Thin-film transistor fabricated in single-crystalline transparent oxide semiconductor. Science 2003, 300, 1269–1272. [Google Scholar] [CrossRef]
  7. Liang, C.; Chau, J.L.H.; Yang, C.C.; Shih, H.H. Preparation of amorphous Ga–Sn–Zn–O semiconductor thin films by RF-sputtering method. Mater. Sci. Eng. B 2014, 183, 17–23. [Google Scholar] [CrossRef]
  8. Fuh, C.S.; Liu, P.T.; Huang, W.H.; Sze, S.M. Effect of annealing on defect elimination for high mobility amorphous indium-zinc-tin-oxide thin-film transistor. IEEE Electron Device Lett. 2014, 35, 1103–1105. [Google Scholar] [CrossRef]
  9. Li, J.; Huang, C.X.; Fu, Y.Z.; Zhang, J.H.; Jiang, X.Y.; Zhang, Z.L. Amorphous LaZnSnO thin films by a combustion solution process and application in thin film transistors. Electron. Mater. Lett. 2016, 12, 76–81. [Google Scholar] [CrossRef]
  10. Dai, S.; Wang, T.; Li, R.; Zhou, D.; Peng, Y.; Wang, H.; Zhang, X.; Wang, Y. Preparation and effects of post-annealing temperature on the electrical characteristics of Li–N co-doped ZnSnO thin film transistors. Ceram. Int. 2017, 43, 4926–4929. [Google Scholar] [CrossRef]
  11. Peksu, E.; Karaagac, H. Doping and annealing effects on structural, electrical and optical properties of tin-doped zinc-oxide thin films. J. Alloys Compd. 2018, 764, 616–625. [Google Scholar] [CrossRef]
  12. Wu, C.; Li, X.; Lu, J.; Ye, Z.; Zhang, J.; Zhou, T.; Sun, R.; Chen, L.; Lu, B.; Pan, X. Characterization of amorphous Si-Zn-Sn-O thin films and applications in thin-film transistors. Appl. Phys. Lett. 2013, 103, 082109. [Google Scholar] [CrossRef]
  13. Ahn, C.H.; Kim, Y.Y.; Kim, D.C.; Mohanta, S.K.; Cho, H.K. A comparative analysis of deep level emission in ZnO layers deposited by various methods. J. Appl. Phys. 2009, 105, 013502. [Google Scholar] [CrossRef]
  14. Allemang, C.R.; Cho, T.H.; Trejo, O.; Ravan, S.; Rodríguez, R.E.; Dasgupta, N.P.; Peterson, R.L. High-Performance Zinc Tin Oxide TFTs with Active Layers Deposited by Atomic Layer Deposition. Adv. Electron. Mater. 2020, 6, 2000195. [Google Scholar] [CrossRef]
  15. Bae, H.; Kwon, J.H.; Chang, S.; Chung, M.H.; Oh, T.Y.; Park, J.H.; Lee, S.Y.; Pak, J.J.; Ju, B.K. The effect of annealing on amorphous indium gallium zinc oxide thin film transistors. Thin Solid Films 2010, 518, 6325–6329. [Google Scholar] [CrossRef]
  16. Barquinha, P.; Pereira, L.; Goncalves, G.; Martins, R.; Fortunato, E. Toward high-performance amorphous GIZO TFTs. J. Electrochem. Soc. 2008, 156, H161. [Google Scholar] [CrossRef]
  17. Young, D.L.; Moutinho, H.; Yan, Y.; Coutts, T.J. Growth and characterization of radio frequency magnetron sputter-deposited zinc stannate, Zn 2 SnO 4, thin films. J. Appl. Phys. 2002, 92, 310–319. [Google Scholar] [CrossRef]
  18. Chiang, H.Q.; Wager, J.F.; Hoffman, R.L.; Jeong, J.; Keszler, D.A. High mobility transparent thin-film transistors with amorphous zinc tin oxide channel layer. Appl. Phys. Lett. 2005, 86, 013503. [Google Scholar] [CrossRef]
  19. Ko, J.H.; Kim, I.H.; Kim, D.; Lee, K.S.; Lee, T.S.; Cheong, B.; Kim, W.M. Transparent and conducting Zn-Sn-O thin films prepared by combinatorial approach. Appl. Surf. Sci. 2007, 253, 7398–7403. [Google Scholar] [CrossRef]
  20. Hwang, Y.H.; Seo, S.J.; Jeon, J.H.; Bae, B.S. Ultraviolet photo-annealing process for low temperature processed sol-gel zinc tin oxide thin film transistors. Electrochem. Solid State Lett. 2012, 15, H91. [Google Scholar] [CrossRef]
  21. Kameswara Rao, L.; Vinni, V. Novel mechanism for high speed growth of transparent and conducting tin oxide thin films by spray pyrolysis. Appl. Phys. Lett. 1993, 63, 608–610. [Google Scholar] [CrossRef]
  22. Fan, J.C.C.; Goodenough, J.B. X-ray photoemission spectroscopy studies of Sn-doped indium-oxide films. J. Appl. Phys. 1977, 48, 3524–3531. [Google Scholar] [CrossRef]
  23. Seo, S.J.; Hwang, Y.H.; Bae, B.S. Postannealing process for low temperature processed sol–gel zinc tin oxide thin film transistors. Electrochem. Solid State Lett. 2010, 13, H357. [Google Scholar] [CrossRef]
  24. Major, S.; Kumar, S.; Bhatnagar, M.; Chopra, K.L. Effect of hydrogen plasma treatment on transparent conducting oxides. Appl. Phys. Lett. 1986, 49, 394–396. [Google Scholar] [CrossRef]
  25. Ahn, B.D.; Choi, D.; Choi, C.; Park, J.S. The effect of the annealing temperature on the transition from conductor to semiconductor behavior in zinc tin oxide deposited atomic layer deposition. Appl. Phys. Lett. 2014, 105, 092103. [Google Scholar] [CrossRef]
  26. Shinde, S.S.; Korade, A.P.; Bhosale, C.H.; Rajpure, K.Y. Influence of tin doping onto structural, morphological, optoelectronic and impedance properties of sprayed ZnO thin films. J. Alloys Compd. 2013, 551, 688–693. [Google Scholar] [CrossRef]
  27. Lee, Y.G.; Choi, W.S. Electrohydrodynamic jet-printed zinc–tin oxide TFTs and their bias stability. ACS Appl. Mater. Interfaces 2014, 6, 11167–11172. [Google Scholar] [CrossRef]
  28. Sahoo, A.K.; Wu, G.M. Effects of argon flow rate on electrical properties of amorphous indium gallium zinc oxide thin-film transistors. Thin Solid Films 2016, 605, 129–135. [Google Scholar] [CrossRef]
  29. Lee, C.; Lee, W.; Kim, H.; Kim, H.W. Influence of annealing atmosphere on the structure, resistivity and transmittance of InZnO thin films. Ceram. Int. 2008, 34, 1089–1092. [Google Scholar] [CrossRef]
  30. Park, J.H.; Kim, Y.; Yoon, S.; Hong, S.; Kim, H.J. Simple method to enhance positive bias stress stability of In–Ga–Zn–O thin-film transistors using a vertically graded oxygen-vacancy active layer. ACS Appl. Mater. Interfaces 2014, 6, 21363–21368. [Google Scholar] [CrossRef]
  31. Hossain, F.M.; Nishii, J.; Takagi, S.; Ohtomo, A.; Fukumura, T.; Fujioka, H.; Ohno, H.; Koinuma, H.; Kawasaki, M. Modeling and simulation of polycrystalline ZnO thin-film transistors. J. Appl. Phys. 2003, 94, 7768–7777. [Google Scholar] [CrossRef] [Green Version]
  32. Cho, S.W.; Ahn, C.H.; Yun, M.G.; Kim, S.H.; Cho, H.K. Effects of growth temperature on performance and stability of zinc oxide thin film transistors fabricated by thermal atomic layer deposition. Thin Solid Films 2014, 562, 597–602. [Google Scholar] [CrossRef]
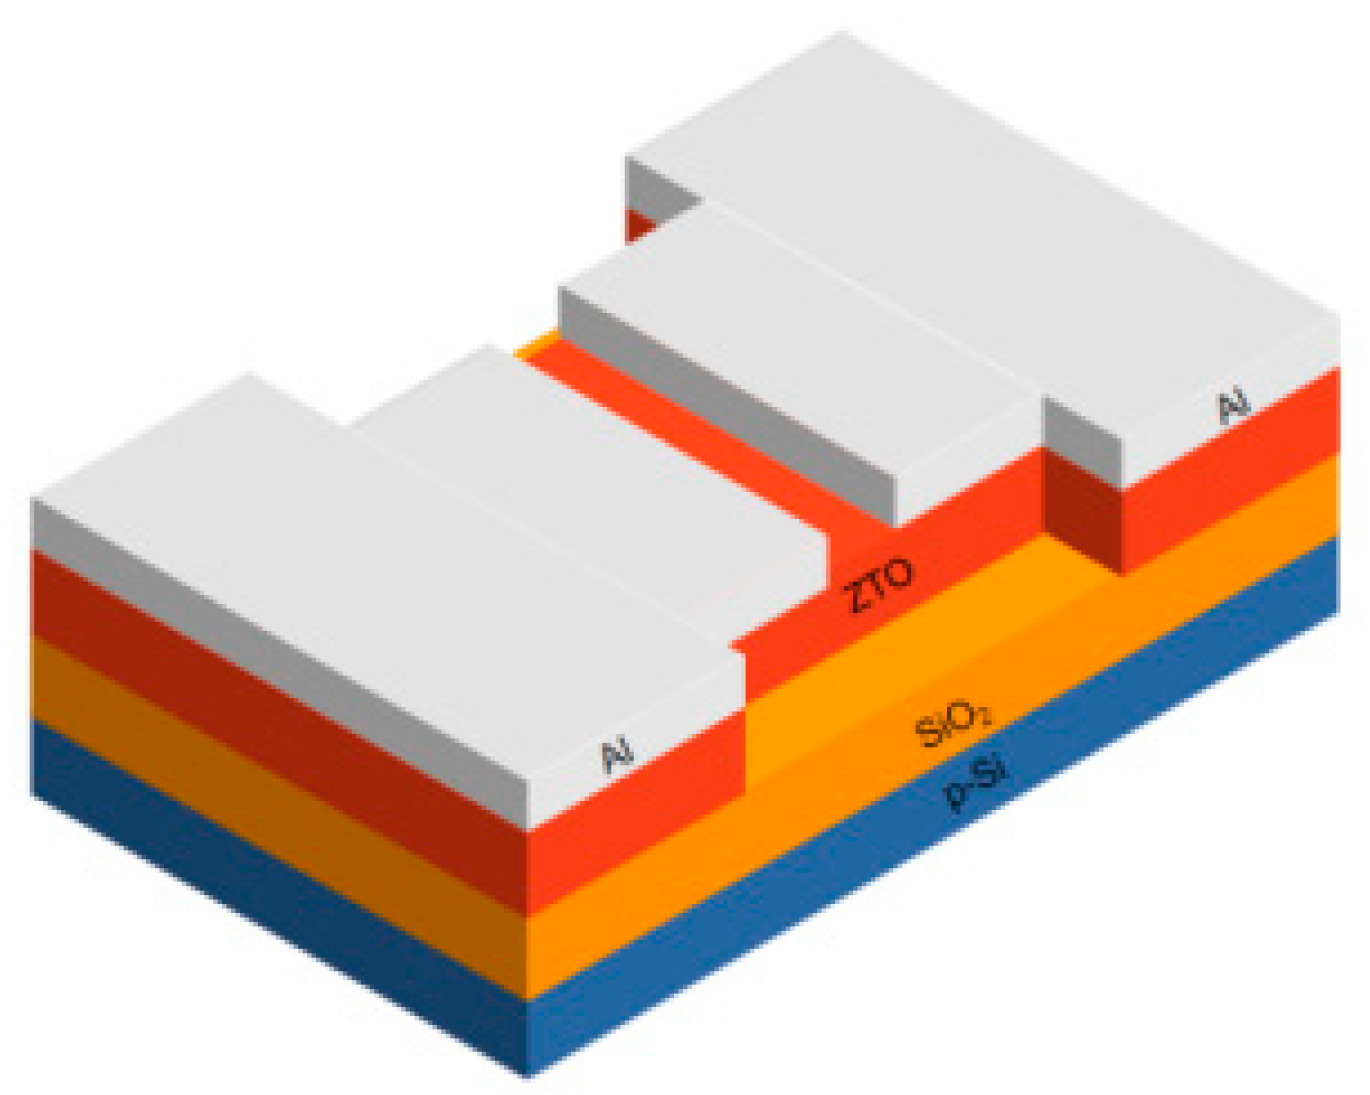
Figure 1. Structural diagram of the prepared thin-film transistor. The silicon substrate is the first layer (blue): p-Si and the second layer (Orange): SiO2. The active layer is the third layer (red): ZTO and S/D electrode layer (white): Al.
Nanomaterials 12 02397 g001
Figure 2. Transmission spectra of non-annealed and annealed ZTO films in the wavelength range of 200–800 nm.
Nanomaterials 12 02397 g002
Figure 3. The AFM test diagram and the growth state annealed at different temperatures are (a): not annealed, (b): 400 °C, (c): 500 °C, (d): 600 °C, (e): 700 °C, and (f): SEM section of unannealed ZTO films, respectively.
Nanomaterials 12 02397 g003
Figure 4. XRD spectra of ZTO films annealed at different temperatures and not annealed.
Nanomaterials 12 02397 g004
Figure 5. (a) Zn2p and (b) Sn3d XPS scanning peak spectrum.
Nanomaterials 12 02397 g005
Figure 6. (a): not annealed, (b): 400 °C, (c): 500 °C, (d): 600 °C, (e): O1s XPS spectrum, and (f): O1s XPS summary spectrum annealed at 700 °C. Wherein OOM, OV, and OS are three fitting peaks, respectively, OF is the total fitting peak, and O1s is the actual test peak.
Nanomaterials 12 02397 g006
Figure 7. (a) Transfer characteristics and (b) IDS1/2–VGS of thin-film transistors annealed at different temperatures.
Nanomaterials 12 02397 g007
Figure 8. Output characteristics of ZTO thin-film transistors annealed at 600 °C.
Nanomaterials 12 02397 g008
Figure 9. The (black) mobility, (red) subthreshold swing, (blue) threshold voltage, and (pink) current switching ratio of ZTO thin-film transistors change with annealing temperature.
Nanomaterials 12 02397 g009
Table 1. Surface roughness of ZTO films not annealed and annealed at 400–700 °C.
Annealing Temperature/°CSurface Roughness/nm
Not annealed1.2
4003.5
5002.3
6002.1
7002.3
Table 2. Stoichiometry of elements and binding of Sn to O in unannealed and 400–700 °C films.
Annealing Temperature/°CProportion of Zn Element/%Proportion of Sn Element/%Proportion of O Element/%Chemical Ratio of Sn to O
(O-Zn)/Sn
Not annealed27.0316.2756.701.82
40021.2322.5156.251.56
50022.7221.6955.591.52
60026.2419.7454.021.41
70019.7424.3855.881.48
Table 3. The integral area ratio of Zn2p and Sn3d peaks after normalization treatment at annealing temperature of 400–700 °C and unannealed.
Annealing Temperature/°CArea Ratio of Zn2p/%Area Ratio of Sn3d/%
Not annealed68.9131.09
40059.5340.47
50060.9039.10
60064.1935.81
70058.1141.89
Table 4. The content of three fitting peaks of O1s peak at annealing temperatures of 400–700 °C and not annealed.
Annealing Temperature/°CO1s Fitting Peak OOM/%O1s Fitting Peak OV/%O1s Fitting Peak OS/%
Not annealed60.1030.938.97
40074.2519.076.68
50077.1517.914.94
60082.0613.004.94
70083.4515.191.37
Table 5. Electrical parameters of ZTO thin-film transistors annealed at different temperatures.
Annealing
Temperature/°C
μSAT (cm2/Vs)VTH(V)SS
(V/decade)
Ion/IoffIon/AIoff/A
4002.2413.263.561.87 × 1073.38 × 10−41.81 × 10⁻¹¹
5009.861.211.329.68 × 1082.69 × 10−32.78 × 10⁻¹²
60012.64−6.610.791.87 × 1093.89 × 10−32.08 × 10⁻¹²
7001.98−7.663.616.30 × 1079.32 × 10−41.48 × 10⁻¹¹
Publisher’s Note: MDPI stays neutral with regard to jurisdictional claims in published maps and institutional affiliations.