
Tuning Electro-Magnetic Interference Shielding Efficiency of Customized Polyurethane Composite Foams Taking Advantage of rGO/Fe3O4 Hybrid Nanocomposites

 ,
,  , ,
, ,
Abstract
:1. Introduction
2. Experimental Work
2.1. Chemicals
2.2. Synthesis of rGO and Fe3O4@rGO Hybrid Nanocomposites
2.3. Synthesis of Fe3O4@rGO/PU Composite Foams
2.4. Characterization
3. Results and Discussion


4. Future Work
5. Conclusions
Author Contributions
Funding
Institutional Review Board Statement
Informed Consent Statement
Data Availability Statement
Acknowledgments
Conflicts of Interest
References
- Bhaskaran, K.; Bheema, R.K.; Etika, K. The influence of Fe3O4@ GNP hybrids on enhancing the EMI shielding effectiveness of epoxy composites in the X-band. Synth. Met. 2020, 265, 116374. [Google Scholar] [CrossRef]
- Al-Saleh, M.H.; Saadeh, W.H.; Sundararaj, U. EMI shielding effectiveness of carbon based nanostructured polymeric materials: A comparative study. Carbon 2013, 60, 146–156. [Google Scholar] [CrossRef]
- Clayton, R. Introduction to electromagnetic compatibility (EMC). In Introduction to Electromagnetic Compatibility; Wiley: New York, NY, USA, 2006; pp. 1–48. [Google Scholar]
- Benouis, C.; Benhaliliba, M.; Yakuphanoglu, F.; Silver, A.T.; Aida, M.S.; Juarez, A.S. Physical properties of ultrasonic sprayed nanosized indium doped SnO2 films. Synth. Met. 2011, 161, 1509–1516. [Google Scholar] [CrossRef]
- Wang, L.; Qiu, H.; Liang, C.; Song, P.; Han, Y.; Gu, J.; Kong, J.; Pan, D.; Guo, Z. Electromagnetic interference shielding MWCNT-Fe3O4@ Ag/epoxy nanocomposites with satisfactory thermal conductivity and high thermal stability. Carbon 2019, 141, 506–514. [Google Scholar] [CrossRef]
- Lakshmi, R.; Bera, P.; Chakradhar, R.; Choudhury, B.; Pawar, S.P.; Bose, S.; Nair, R.U.; Barshilia, H.C. Enhanced microwave absorption properties of PMMA modified MnFe2O4–polyaniline nanocomposites. Phys. Chem. Chem. Phys. 2019, 21, 5068–5077. [Google Scholar] [CrossRef] [PubMed]
- Vickers, N.J. Animal communication: When i’m calling you, will you answer too? Curr. Biol. 2017, 27, R713–R715. [Google Scholar] [CrossRef]
- Liu, X.; Chen, T.; Liang, H.; Qin, F.; Yang, H.; Guo, X. Facile approach for a robust graphene/silver nanowires aerogel with high-performance electromagnetic interference shielding. RSC Adv. 2019, 9, 27–33. [Google Scholar] [CrossRef]
- Li, J.; Liu, H.; Guo, J.; Hu, Z.; Wang, Z.; Wang, B.; Liu, L.; Huang, Y.; Guo, Z. Flexible, conductive, porous, fibrillar polymer–gold nanocomposites with enhanced electromagnetic interference shielding and mechanical properties. J. Mater. Chem. C 2017, 5, 1095–1105. [Google Scholar] [CrossRef]
- Wang, Y.; Ni, L.-J.; Yang, F.; Gu, F.-Q.; Liang, K.; Marcus, K.; Wan, Y.-D.; Chen, J.-J.; Feng, Z.-S. Facile preparation of a high-quality copper layer on epoxy resin via electroless plating for applications in electromagnetic interference shielding. J. Mater. Chem. C 2017, 5, 12769–12776. [Google Scholar] [CrossRef]
- Sankaran, S.; Deshmukh, K.; Ahamed, M.B.; Pasha, S.K. Recent advances in electromagnetic interference shielding properties of metal and carbon filler reinforced flexible polymer composites: A review. Compos. Part A Appl. Sci. Manuf. 2018, 114, 49–71. [Google Scholar] [CrossRef]
- Ravindren, R.; Mondal, S.; Nath, K.; Das, N.C. Investigation of electrical conductivity and electromagnetic interference shielding effectiveness of preferentially distributed conductive filler in highly flexible polymer blends nanocomposites. Compos. Part A Appl. Sci. Manuf. 2019, 118, 75–89. [Google Scholar] [CrossRef]
- Rahaman, M.; Khastgir, D.; Aldalbahi, A.K. Carbon-Containing Polymer Composites; Springer: Berlin/Heidelberg, Germany, 2019. [Google Scholar]
- Sang, G.; Dong, J.; He, X.; Jiang, J.; Li, J.; Xu, P.; Ding, Y. Electromagnetic interference shielding performance of polyurethane composites: A comparative study of GNs-IL/Fe3O4 and MWCNTs-IL/Fe3O4 hybrid fillers. Compos. Part B Eng. 2019, 164, 467–475. [Google Scholar] [CrossRef]
- Chhetri, S.; Adak, N.C.; Samanta, P.; Murmu, N.C.; Srivastava, S.K.; Kuila, T. Synergistic effect of Fe3O4 anchored N-doped rGO hybrid on mechanical, thermal and electromagnetic shielding properties of epoxy composites. Compos. Part B Eng. 2019, 166, 371–381. [Google Scholar] [CrossRef]
- Liu, Y.; Lu, M.; Wu, K.; Yao, S.; Du, X.; Chen, G.; Zhang, Q.; Liang, L.; Lu, M. Anisotropic thermal conductivity and electromagnetic interference shielding of epoxy nanocomposites based on magnetic driving reduced graphene oxide@Fe3O4. Compos. Sci. Technol. 2019, 174, 1–10. [Google Scholar] [CrossRef]
- Liu, H.; Liang, C.; Chen, J.; Huang, Y.; Cheng, F.; Wen, F.; Xu, B.; Wang, B. Novel 3D network porous graphene nanoplatelets/Fe3O4/epoxy nanocomposites with enhanced electromagnetic interference shielding efficiency. Compos. Sci. Technol. 2019, 169, 103–109. [Google Scholar] [CrossRef]
- Singh, K.; Ohlan, A.; Pham, V.H.; Rajagopalan, B.; Varshney, S.; Jang, J.; Hur, S.H.; Choi, W.M.; Kumar, M.; Dhawan, S.K.; et al. Nanostructured graphene/Fe3O4 incorporated polyaniline as a high performance shield against electromagnetic pollution. Nanoscale 2013, 5, 2411–2420. [Google Scholar] [CrossRef]
- Oraby, H.; Naeem, I.; Darwish, M.; Senna, M.H.; Tantawy, H.R. Effective electromagnetic interference shielding using foamy polyurethane composites. Polym. Compos. 2021, 42, 3077–3088. [Google Scholar] [CrossRef]
- Hong, S.Y.; Kim, Y.C.; Wang, M.; Nam, J.-D.; Suhr, J. Anisotropic electromagnetic interference shielding properties of polymer-based composites with magnetically-responsive aligned Fe3O4 decorated reduced graphene oxide. Eur. Polym. J. 2020, 127, 109595. [Google Scholar] [CrossRef]
- Phadtare, V.D.; Parale, V.G.; Lee, K.-Y.; Kim, T.; Puri, V.R.; Park, H.-H. Flexible and lightweight Fe3O4/polymer foam composites for microwave-absorption applications. J. Alloys Compd. 2019, 805, 120–129. [Google Scholar] [CrossRef]
- Qing, Y.; Zhou, W.; Luo, F.; Zhu, D. Microwave-absorbing and mechanical properties of carbonyl-iron/epoxy-silicone resin coatings. J. Magn. Magn. Mater. 2009, 321, 25–28. [Google Scholar] [CrossRef]
- De Silva, K.K.H.; Huang, H.-H.; Yoshimura, M. Progress of reduction of graphene oxide by ascorbic acid. Appl. Surf. Sci. 2018, 447, 338–346. [Google Scholar] [CrossRef]
- Jo, J.; Lee, S.; Gim, J.; Song, J.; Kim, S.; Mathew, V.; Alfaruqi, M.H.; Kim, S.; Lim, J.; Kim, J. Facile synthesis of reduced graphene oxide by modified Hummer’s method as anode material for Li-, Na-and K-ion secondary batteries. R. Soc. Open Sci. 2019, 6, 181978. [Google Scholar] [CrossRef] [PubMed]
- Jafari, A.; Shayesteh, S.F.; Salouti, M.; Boustani, K. Effect of annealing temperature on magnetic phase transition in Fe3O4 nanoparticles. J. Magn. Magn. Mater. 2015, 379, 305–312. [Google Scholar] [CrossRef]
- Padhi, D.K.; Panigrahi, T.K.; Parida, K.; Singh, S.; Mishra, P. Green synthesis of Fe3O4/RGO nanocomposite with enhanced photocatalytic performance for Cr (VI) reduction, phenol degradation, and antibacterial activity. ACS Sustain. Chem. Eng. 2017, 5, 10551–10562. [Google Scholar] [CrossRef]
- Zeng, F.; Sun, Z.; Sang, X.; Diamond, D.; Lau, K.T.; Liu, X.-X.; Su, D.S. In situ one-step electrochemical preparation of graphene oxide nanosheet-modified electrodes for biosensors. ChemSusChem 2011, 4, 1587–1591. [Google Scholar] [CrossRef]
- Stankovich, S.; Dikin, D.A.; Piner, R.D.; Kohlhaas, K.A.; Kleinhammes, A.; Jia, Y.; Wu, Y.; Nguyen, S.T.; Ruoff, R.S. Synthesis of graphene-based nanosheets via chemical reduction of exfoliated graphite oxide. Carbon 2007, 45, 1558–1565. [Google Scholar] [CrossRef]
- Elsaidy, A.; Vallejo, J.P.; Salgueiriño, V.; Lugo, L. Tuning the thermal properties of aqueous nanofluids by taking advantage of size-customized clusters of iron oxide nanoparticles. J. Mol. Liq. 2021, 344, 117727. [Google Scholar] [CrossRef]
- Otero-Lorenzo, R.; Ramos-Docampo, M.A.; Rodríguez-González, B.; Comesaña-Hermo, M.; Salgueiriño, V. Solvothermal clustering of magnetic spinel ferrite nanocrystals: A raman perspective. Chem. Mater. 2017, 29, 8729–8736. [Google Scholar] [CrossRef]
- Tantawy, H.; Aston, D.E.; Smith, J.R.; Young, J.L. Comparison of electromagnetic shielding with polyaniline nanopowders produced in solvent-limited conditions. ACS Appl. Mater. Interfaces 2013, 5, 4648–4658. [Google Scholar] [CrossRef]
- Scott, J.F. Soft-mode spectroscopy: Experimental studies of structural phase transitions. Rev. Mod. Phys. 1974, 46, 83–128. [Google Scholar] [CrossRef]
- De Faria, D.L.; Silva, S.V.; de Oliveira, M. Raman microspectroscopy of some iron oxides and oxyhydroxides. J. Raman Spectrosc. 1997, 28, 873–878. [Google Scholar] [CrossRef]
- Jubb, A.M.; Allen, H.C. Vibrational spectroscopic characterization of hematite, maghemite, and magnetite thin films produced by vapor deposition. ACS Appl. Mater. Interfaces 2010, 2, 2804–2812. [Google Scholar] [CrossRef]
- Yau, X.H.; Khe, C.S.; Saheed, M.S.M.; Lai, C.W.; You, K.Y.; Tan, W.K. Magnetically recoverable magnetite-reduced graphene oxide as a demulsifier for surfactant stabilized crude oil-in-water emulsion. PLoS ONE 2020, 15, e0232490. [Google Scholar] [CrossRef]
- Choudhary, N.; Hwang, S.; Choi, W. Carbon nanomaterials: A review. In Handbook of Nanomaterials Properties; Springer: Berlin/Heidelberg, Germany, 2014; pp. 709–769. [Google Scholar]
- Lee, H.C.; Liu, W.-W.; Chai, S.-P.; Mohamed, A.R.; Aziz, A.; Khe, C.-S.; Hidayah, N.M.S.; Hashim, U. Review of the synthesis, transfer, characterization and growth mechanisms of single and multilayer graphene. RSC Adv. 2017, 7, 15644–15693. [Google Scholar] [CrossRef]
- Munasir, N.; Kusumawati, R.; Kusumawati, D.; Supardi, Z.; Taufiq, A.; Darminto, D. Characterization of Fe3O4/rGO Composites from Natural Sources: Application for Dyes Color Degradation in Aqueous Solution. Int. J. Eng. 2020, 33, 18–27. [Google Scholar]
- Peik-See, T.; Pandikumar, A.; Ngee, L.H.; Ming, H.N.; Hua, C.C. Magnetically separable reduced graphene oxide/iron oxide nanocomposite materials for environmental remediation. Catal. Sci. Technol. 2014, 4, 4396–4405. [Google Scholar] [CrossRef]
- Sharma, N.; Sharma, V.; Jain, Y.; Kumari, M.; Gupta, R.; Sharma, S.K.; Sachdev, K. Synthesis and characterization of graphene oxide (GO) and reduced graphene oxide (rGO) for gas sensing application. Macromol. Symp. 2017, 376, 1700006. [Google Scholar] [CrossRef]
- Wang, Q.; Zhang, X.; Huang, L.; Zhang, Z.; Dong, S. One-pot synthesis of Fe3O4 nanoparticle loaded 3D porous graphene nanocomposites with enhanced nanozyme activity for glucose detection. ACS Appl. Mater. Interfaces 2017, 9, 7465–7471. [Google Scholar] [CrossRef] [PubMed]
- Kahsay, M.H.; Belachew, N.; Tadesse, A.; Basavaiah, K. Magnetite nanoparticle decorated reduced graphene oxide for adsorptive removal of crystal violet and antifungal activities. RSC Adv. 2020, 10, 34916–34927. [Google Scholar] [CrossRef]
- Dewanto, A.; Yulianingsih, A.; Saadah, I.; Supardi, Z.; Mufid, A.; Taufiq, A. Composites of Fe3O4/SiO2 from natural material synthesized by co-precipitation method. IOP Conf. Ser. Mater. Sci. Eng. 2017, 202, 012057. [Google Scholar]
- Gavgani, J.N.; Adelnia, H.; Zaarei, D.; Gudarzi, M.M. Lightweight flexible polyurethane/reduced ultralarge graphene oxide composite foams for electromagnetic interference shielding. RSC Adv. 2016, 6, 27517–27527. [Google Scholar] [CrossRef]
- Jamsaz, A.; Goharshadi, E.K. Flame retardant, superhydrophobic, and superoleophilic reduced graphene oxide/orthoaminophenol polyurethane sponge for efficient oil/water separation. J. Mol. Liq. 2020, 307, 112979. [Google Scholar] [CrossRef]
- Zhai, T.; Li, D.; Fei, G.; Xia, H. Piezoresistive and compression resistance relaxation behavior of water blown carbon nanotube/polyurethane composite foam. Compos. Part A Appl. Sci. Manuf. 2015, 72, 108–114. [Google Scholar] [CrossRef]
- Zhang, H.; Zhang, G.; Gao, Q.; Zong, M.; Wang, M.; Qin, J. Electrically electromagnetic interference shielding microcellular composite foams with 3D hierarchical graphene-carbon nanotube hybrids. Compos. Part A Appl. Sci. Manuf. 2020, 130, 105773. [Google Scholar] [CrossRef]
- Wang, J.; Xu, B.; Wang, X.; Liu, Y. A phosphorous-based bi-functional flame retardant for rigid polyurethane foam. Polym. Degrad. Stab. 2021, 186, 109516. [Google Scholar] [CrossRef]
- Saha, M.; Kabir, M.; Jeelani, S. Enhancement in thermal and mechanical properties of polyurethane foam infused with nanoparticles. Mater. Sci. Eng. A 2008, 479, 213–222. [Google Scholar] [CrossRef]
- Sachdev, V.K.; Patel, K.; Bhattacharya, S.; Tandon, R.P. Electromagnetic interference shielding of graphite/acrylonitrile butadiene styrene composites. J. Appl. Polym. Sci. 2011, 120, 1100–1105. [Google Scholar] [CrossRef]
- Verma, M.; Chauhan, S.S.; Dhawan, S.; Choudhary, V. Graphene nanoplatelets/carbon nanotubes/polyurethane composites as efficient shield against electromagnetic polluting radiations. Compos. Part B Eng. 2017, 120, 118–127. [Google Scholar] [CrossRef]
- Sharif, F.; Arjmand, M.; Moud, A.A.; Sundararaj, U.; Roberts, E.P. Segregated hybrid poly (methyl methacrylate)/graphene/magnetite nanocomposites for electromagnetic interference shielding. ACS Appl. Mater. Interfaces 2017, 9, 14171–14179. [Google Scholar] [CrossRef]
- BRao, B.V.B.; Yadav, P.; Aepuru, R.; Panda, H.S.; Ogale, S.; Kale, S.N. Single-layer graphene-assembled 3D porous carbon composites with PVA and Fe3O4 nano-fillers: An interface-mediated superior dielectric and EMI shielding performance. Phys. Chem. Chem. Phys. 2015, 17, 18353–18363. [Google Scholar]
- Yao, K.; Gong, J.; Tian, N.; Lin, Y.; Wen, X.; Jiang, Z.; Na, H.; Tang, T. Flammability properties and electromagnetic interference shielding of PVC/graphene composites containing Fe3O4 nanoparticles. RSC Adv. 2015, 5, 31910–31919. [Google Scholar] [CrossRef]
- Chen, Y.; Wang, Y.; Zhang, H.-B.; Li, X.; Gui, C.-X.; Yu, Z.-Z. Enhanced electromagnetic interference shielding efficiency of polystyrene/graphene composites with magnetic Fe3O4 nanoparticles. Carbon 2015, 82, 67–76. [Google Scholar] [CrossRef]


| Chemicals | Purity | Source |
|---|---|---|
| Graphite powder | 99.5% | Haryana/India |
| Potassium permanganate | 98% | Alpha Chemicals/India |
| Sulfuric acid | 98% | Alpha Chemicals/India |
| Hydrochloric acid | 36% | Alpha Chemicals/India |
| Hydrogen peroxide | 35% | Alpha Chemicals/India |
| Ascorbic acid | 98% | Alpha Chemicals/India |
| Ammonium ferrous sulfate hexahydrate | 98.5% | Loba Chem/India |
| Ferric chloride anhydrous | 98% | Loba Chem/India |
| Sodium hydroxide pellets | 99.5% | Techno Pharm Chem/India |
| Ethanol | 99.5% | Loba Chem/India |
| Polyol: Alcupol R-4520 (with a hydroxyl number of 343.5 mg KOH g) | - | Repsol Quimica/Spain |
| Methylene diphenyl diisocyanate (MDI) (viscous yellow liquid, viscosity 5260 cP at 25 °C, water content 2.3 wt%) | 99.5% | Huntsman/Germany |
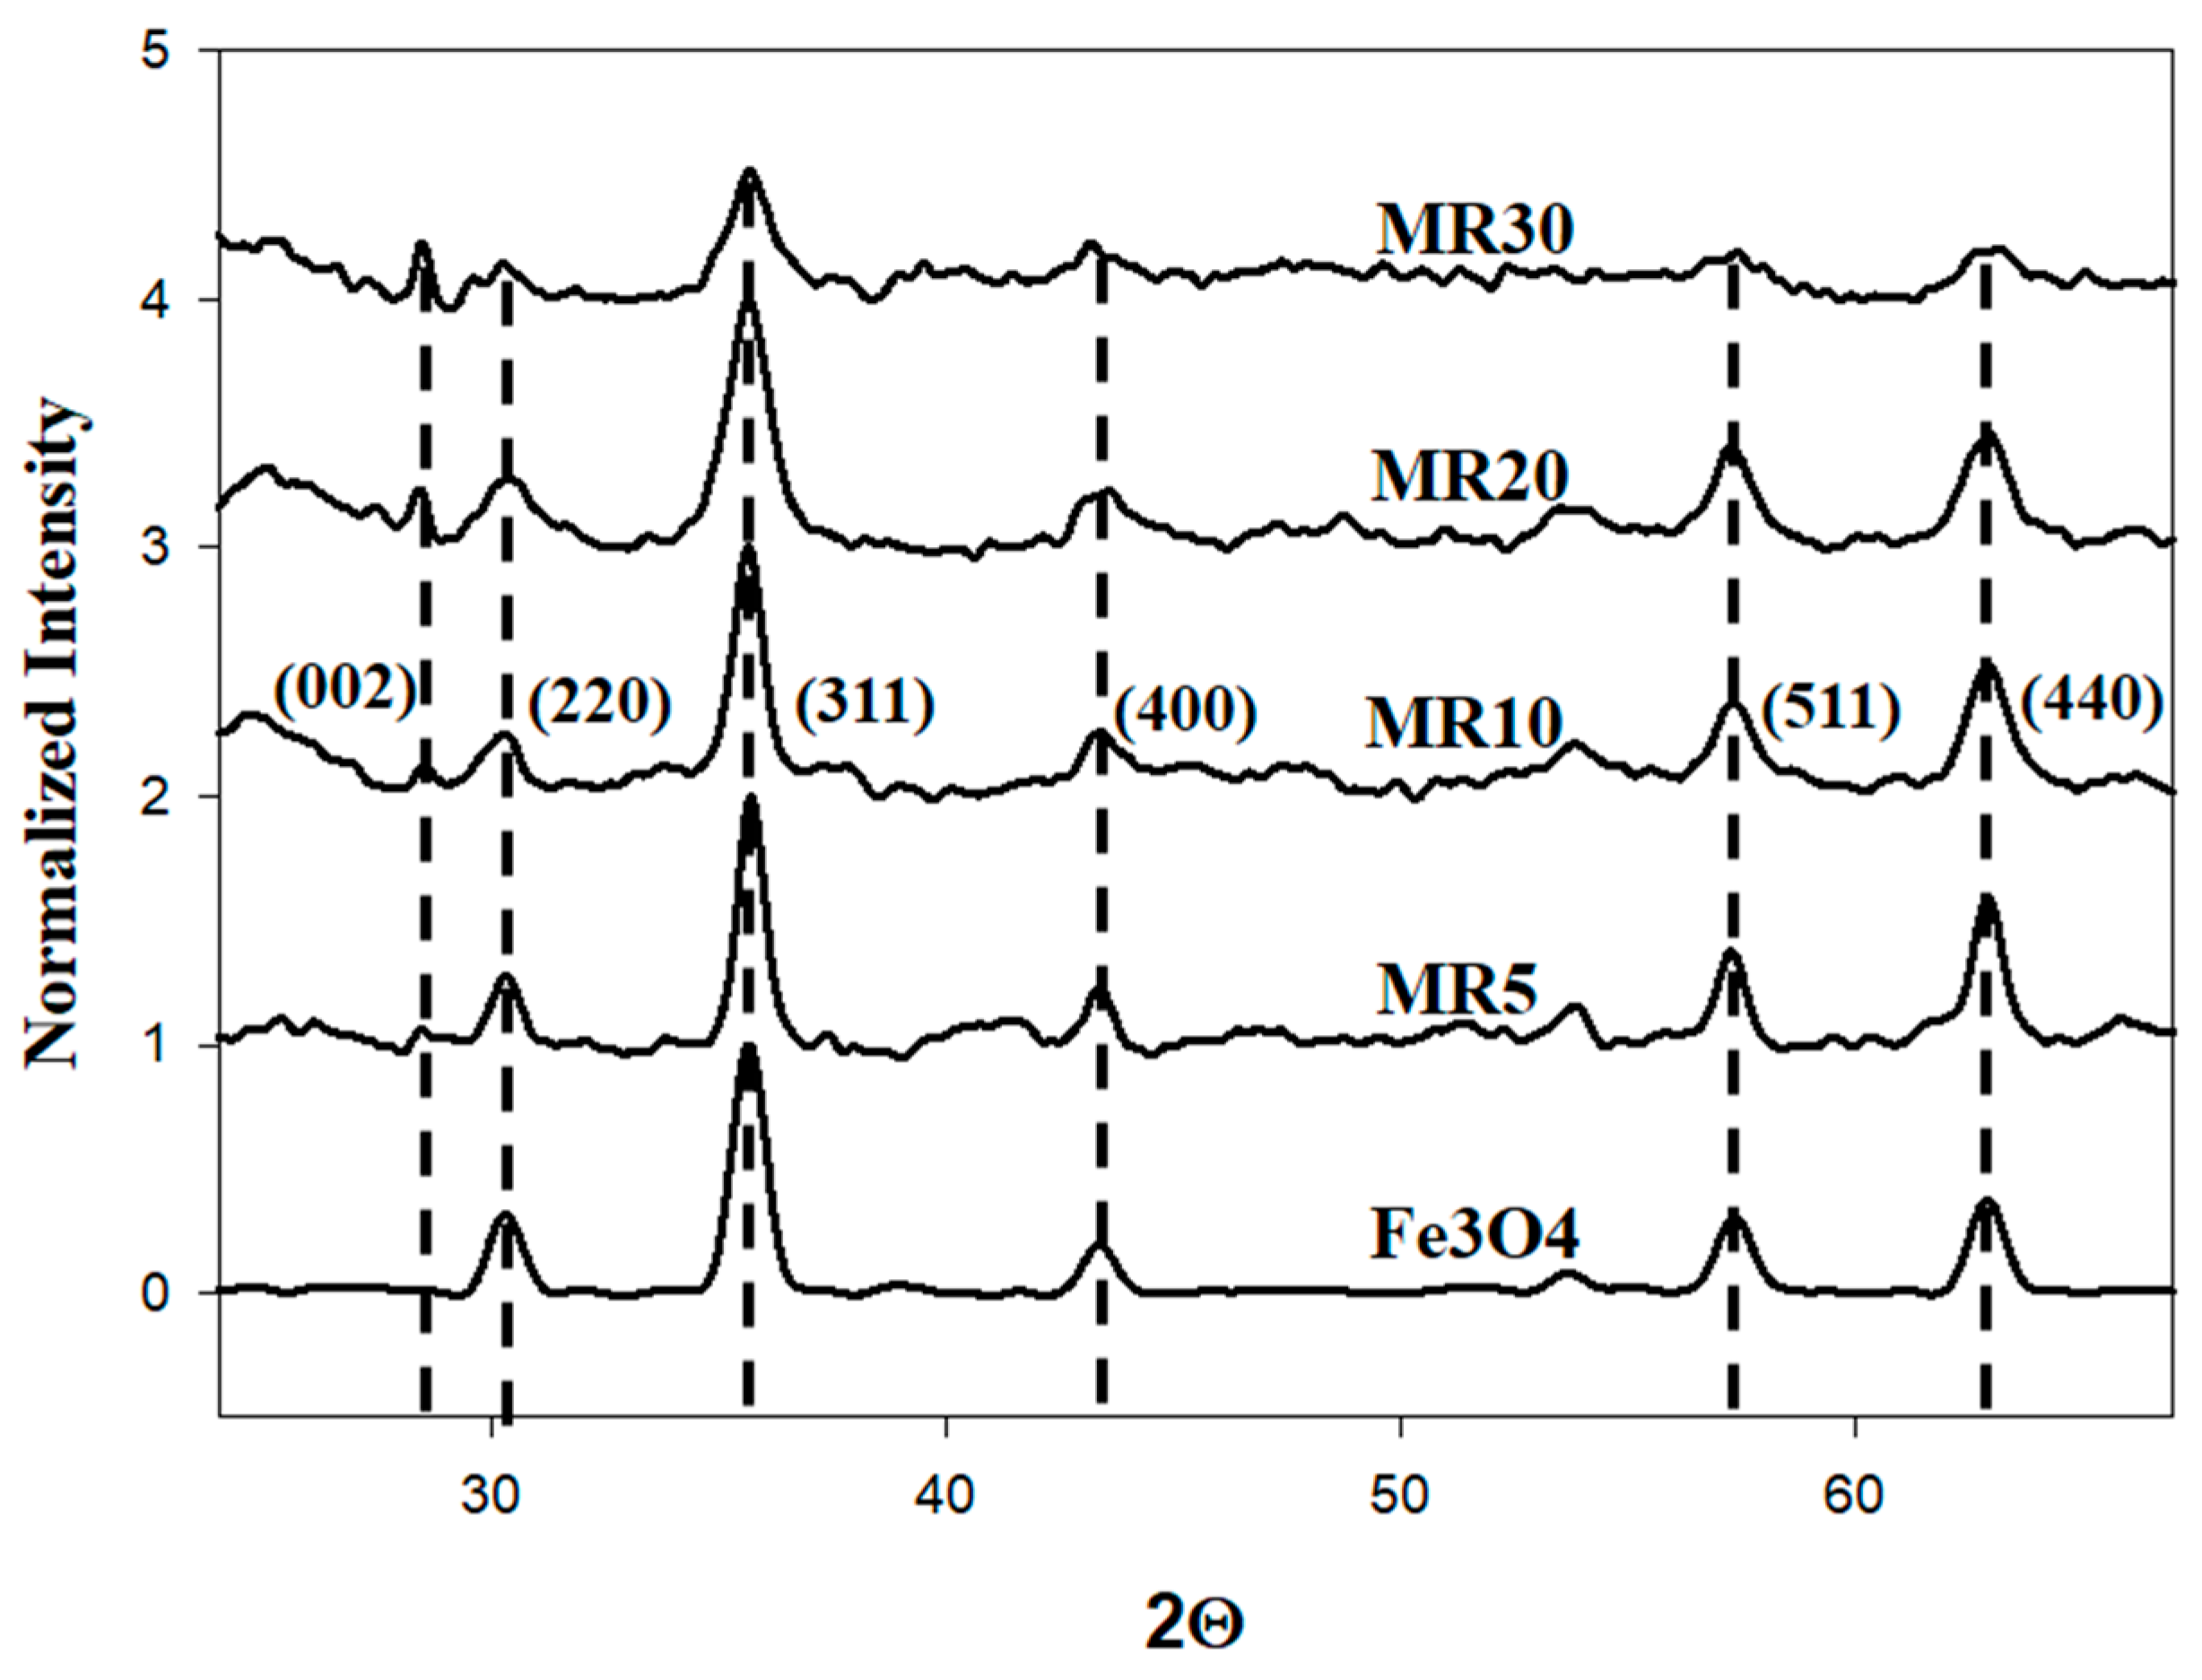
| # | Composition | β (Radians) | L (nm) |
|---|---|---|---|
| 1 | Fe3O4 | 0.0049 | 29.8 |
| 2 | MR5 | 0.0071 | 20.3 |
| 3 | MR10 | 0.0108 | 13.5 |
| 4 | MR20 | 0.0180 | 8.12 |
| 5 | MR30 | 0.0264 | 5.53 |
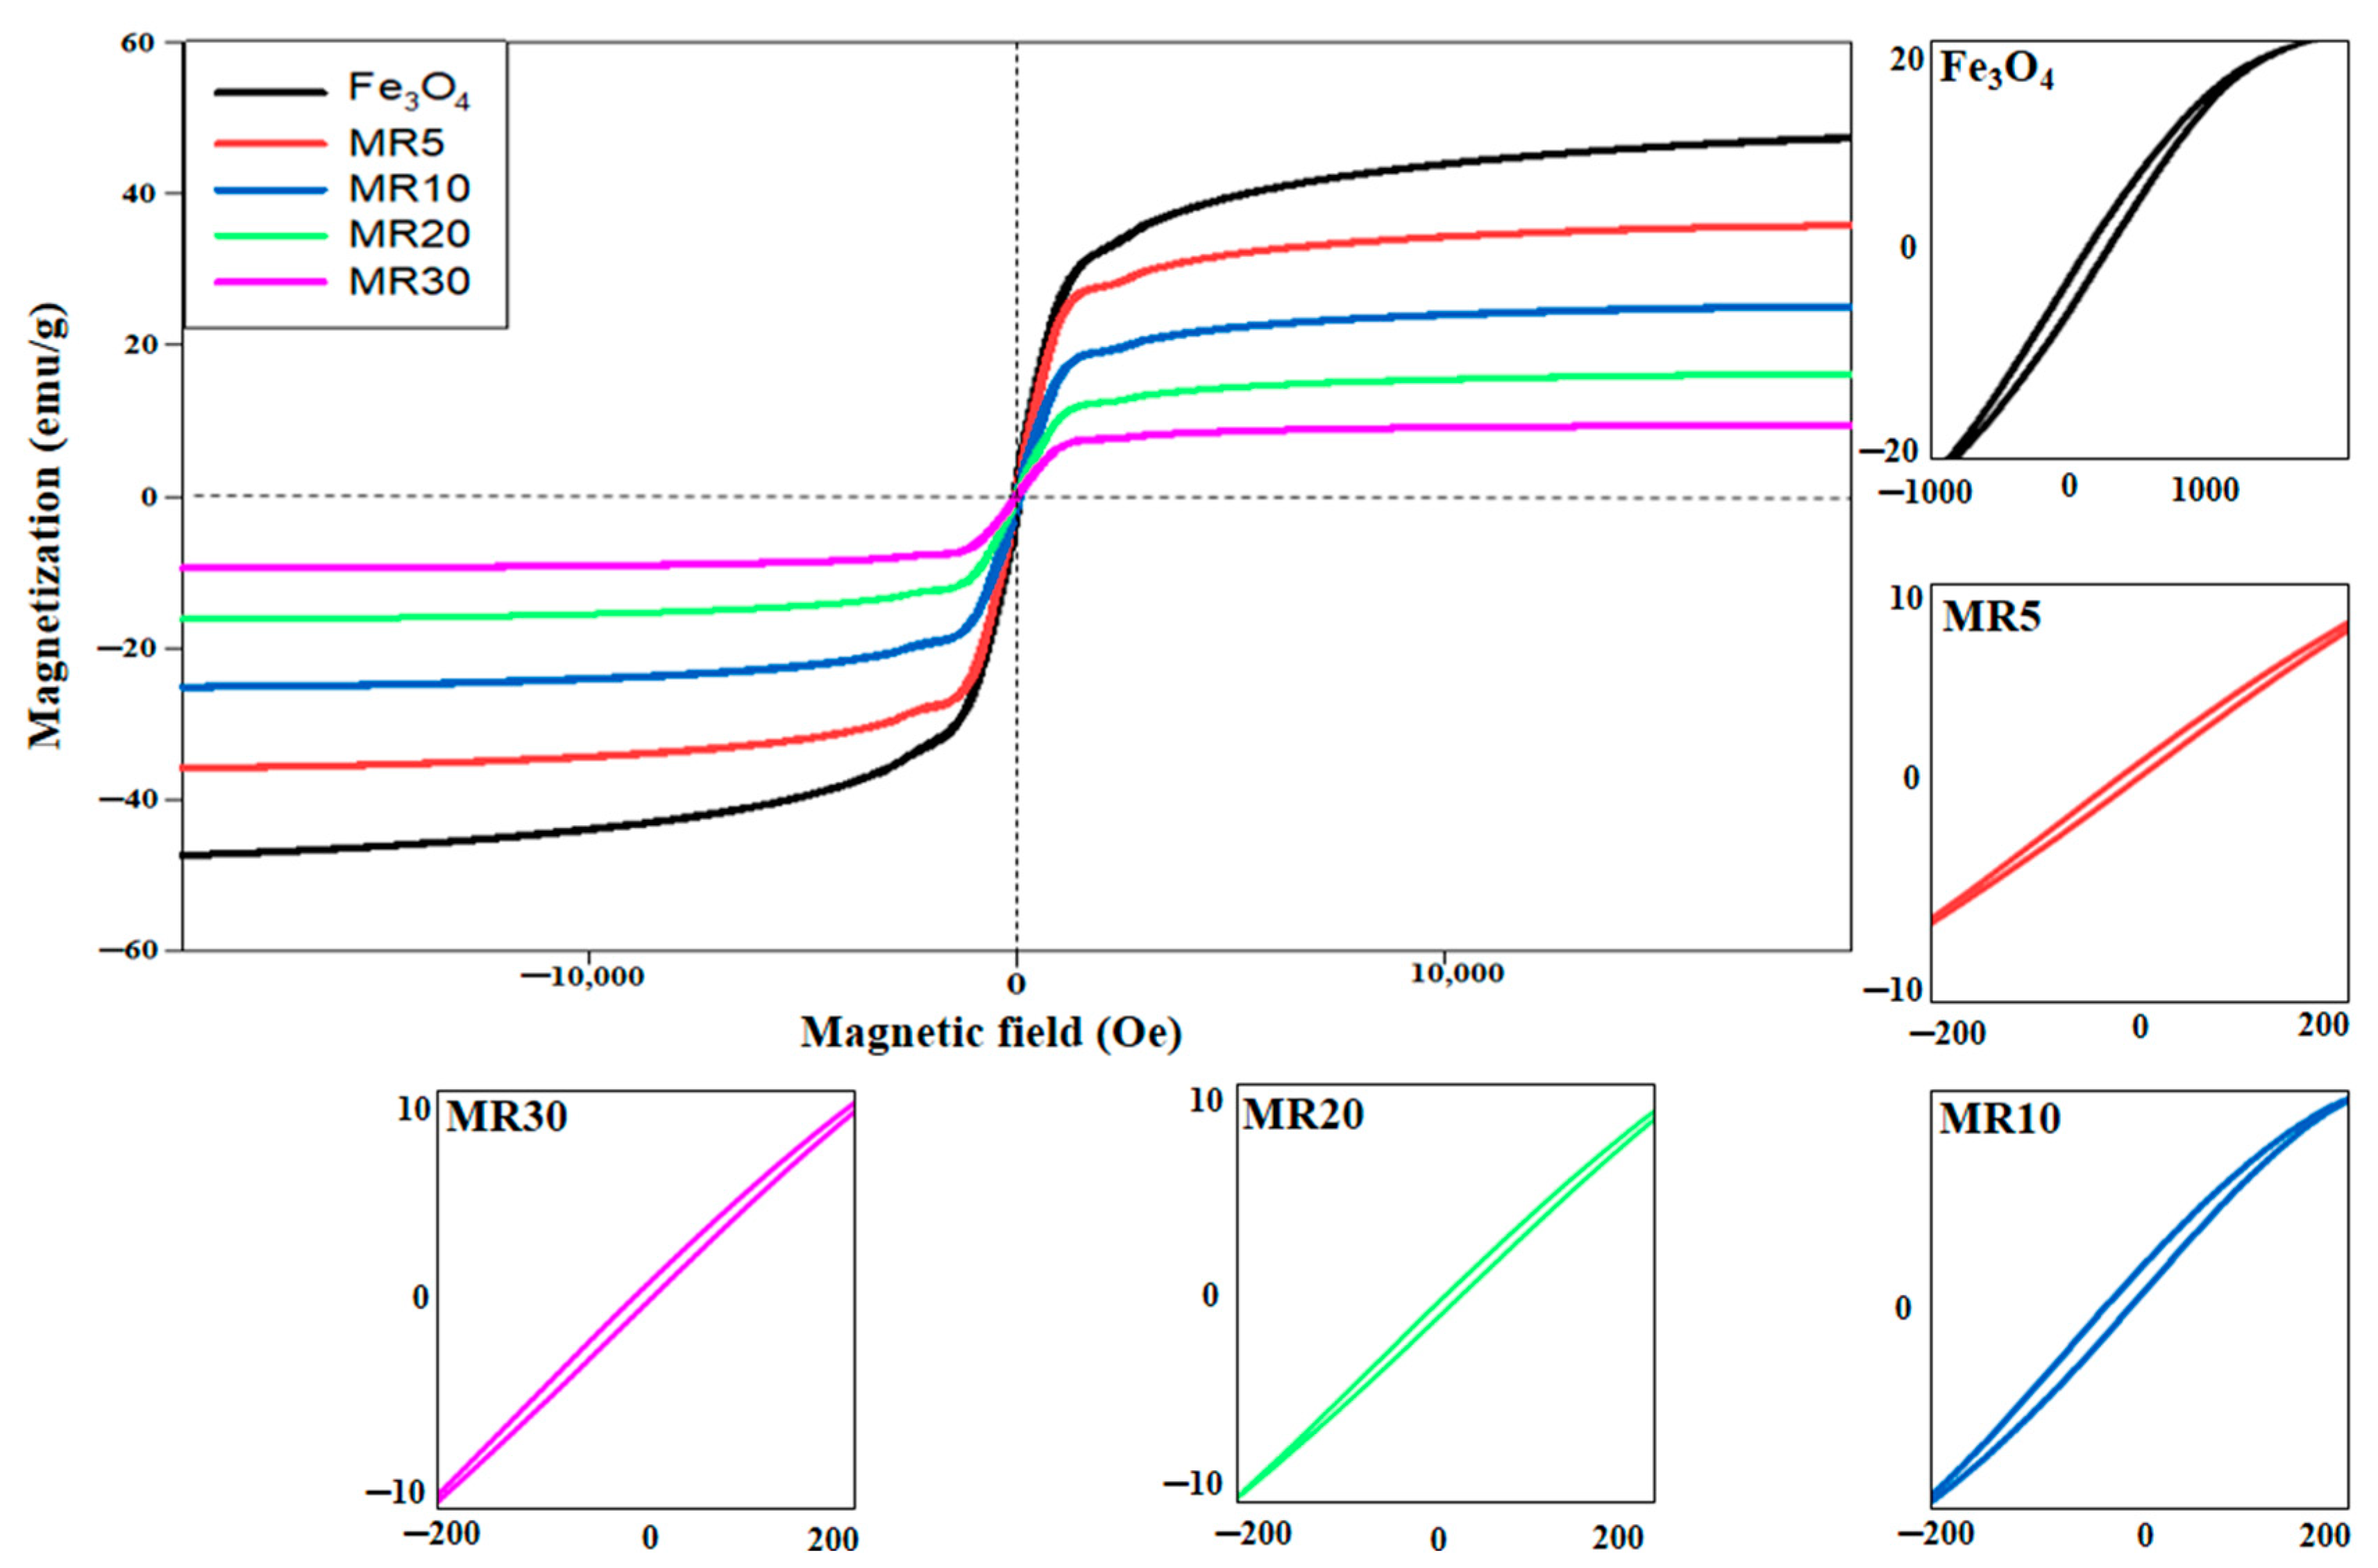
| Magnetic Properties | Saturation Magnetization (Ms, emu/g) | Magnetic Remanence (Mr, emu/g) | Coercivity (Hc, Oe) |
|---|---|---|---|
| Fe3O4 | 48.274 | 2.271 | 22.733 |
| MR5 | 36.754 | 0.994 | 31.895 |
| MR10 | 26.057 | 0.716 | 45.109 |
| MR20 | 16.971 | 0.427 | 64.934 |
| MR30 | 10.662 | 0.236 | 88.467 |
| Sample Type | Weight Loss (%) | Tmax | ||||
|---|---|---|---|---|---|---|
| 100 °C | 200 °C | 300 °C | 400 °C | 500 °C | ||
| Neat PU | 1.5 | 5.3 | 29.25 | 66.1 | 74.05 | 317 |
| P1MR20 | 1.6 | 5.1 | 29.08 | 56.6 | 63.73 | 322 |
| P2MR20 | 1.6 | 4.1 | 18.88 | 45.3 | 50.26 | 330 |
| P3MR20 | 1.5 | 5 | 28.04 | 71.7 | 77.62 | 318 |
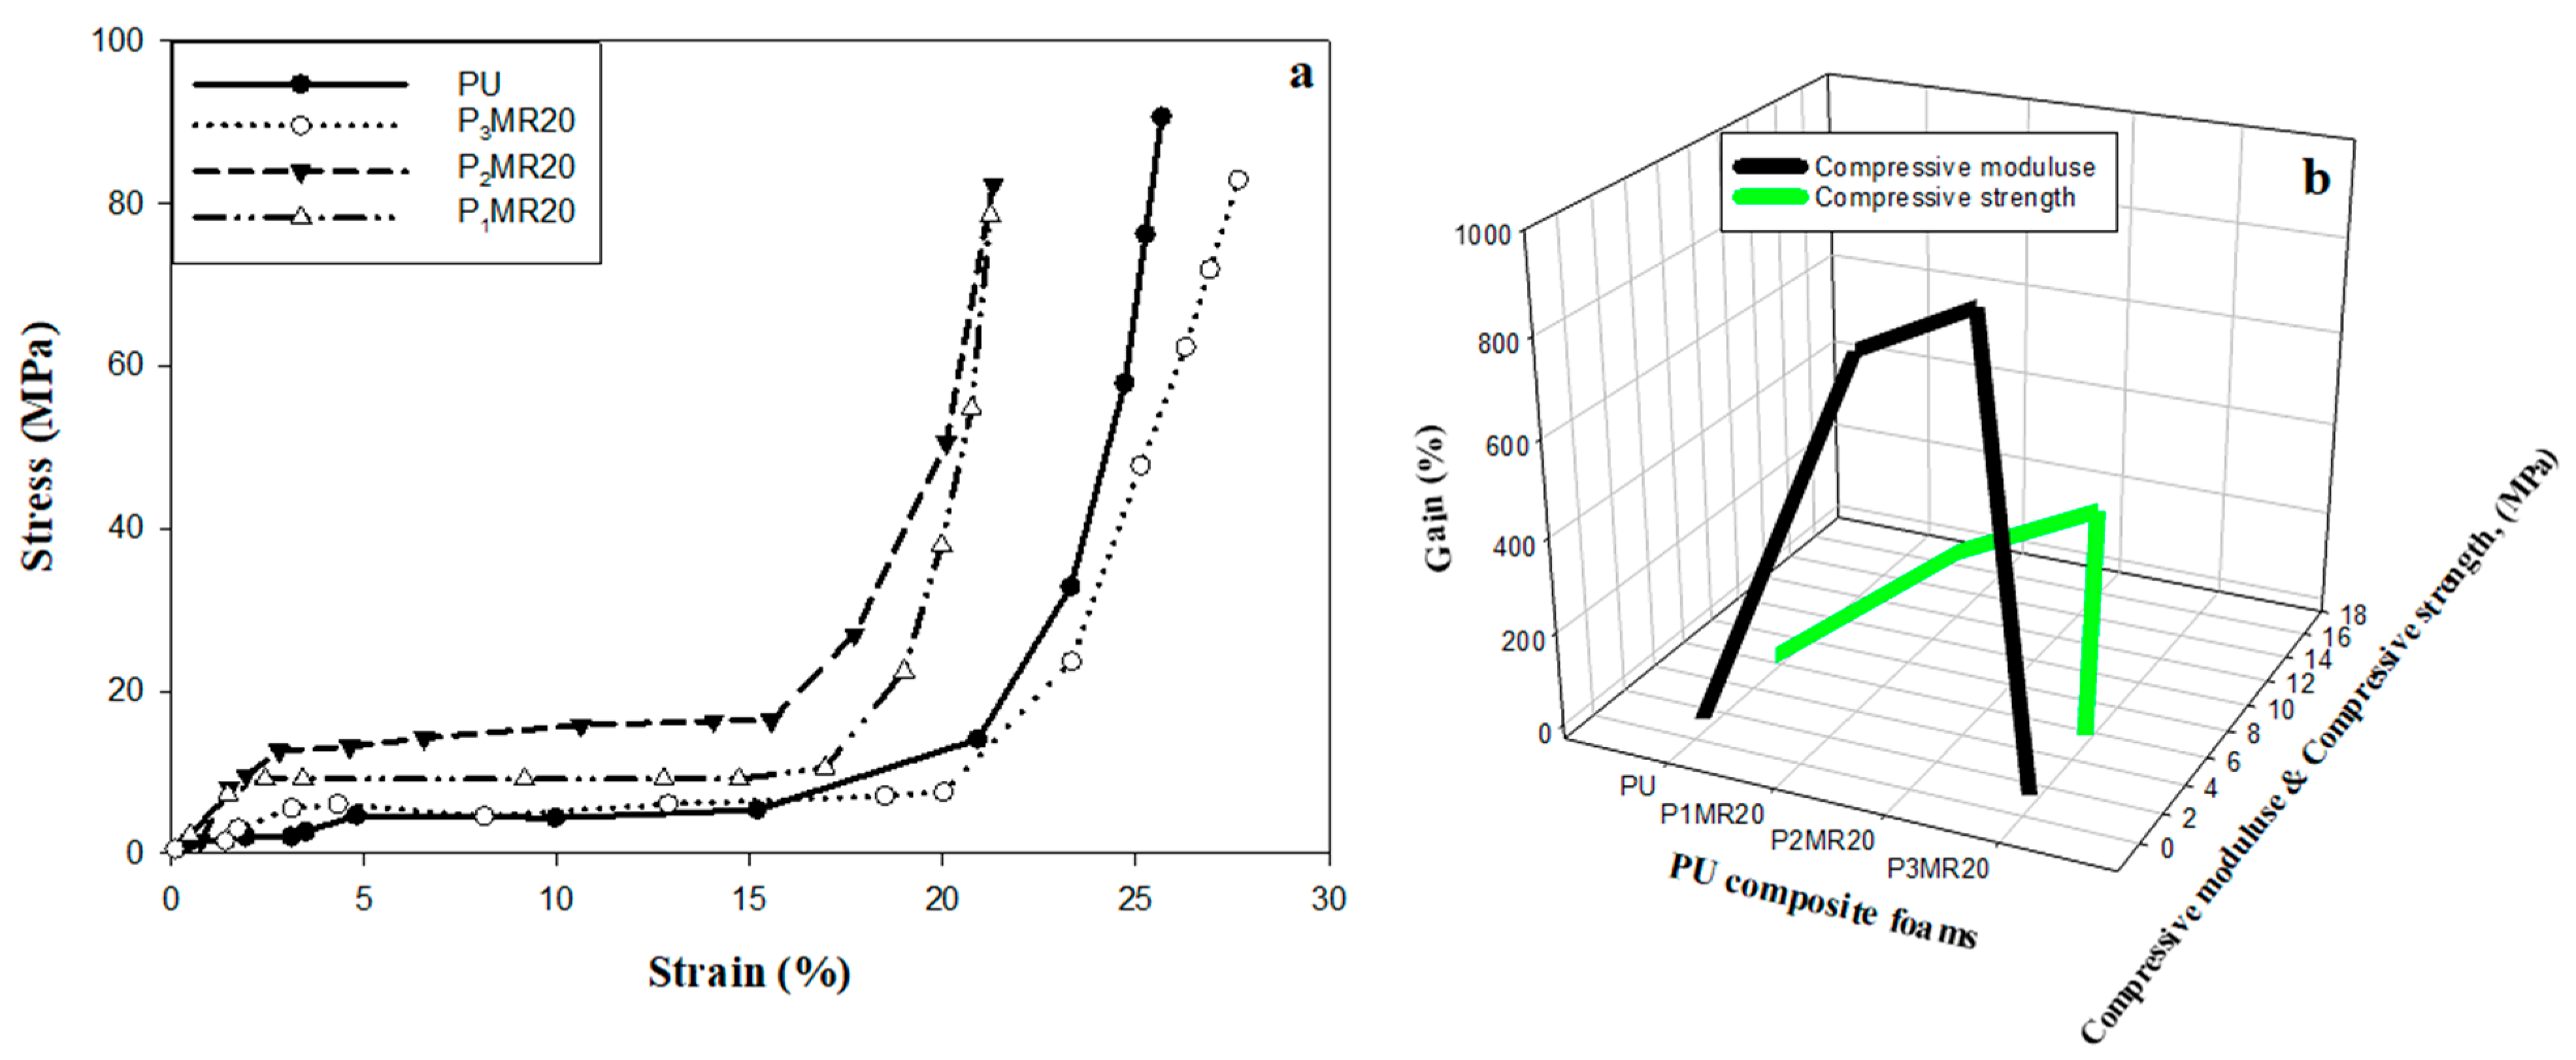
| Sample | Specimen | Compressive Modulus (MPa) | Compressive Strength (MPa) | ||||
|---|---|---|---|---|---|---|---|
| Data | Mean | Gain (%) | Data | Mean | Gain (%) | ||
| PU | 1 2 3 | 0.54 0.53 0.55 | 0.54 | - | 5.21 5.67 5.99 | 5.62 | - |
| P1MR20 | 1 2 3 | 4.35 4.54 4.44 | 4.44 | 722 % | 12.14 12.33 12.2 | 12.22 | 117% |
| P2MR20 | 1 2 3 | 5.03 5.02 5.04 | 5.03 | 831 % | 15.5 15.7 15.8 | 15.6 | 174% |
| P3MR20 | 1 2 3 | 0.56 0.53 0.52 | 0.53 | −1.85 % | 5.11 5.1 5.13 | 5.11 | −9.01% |
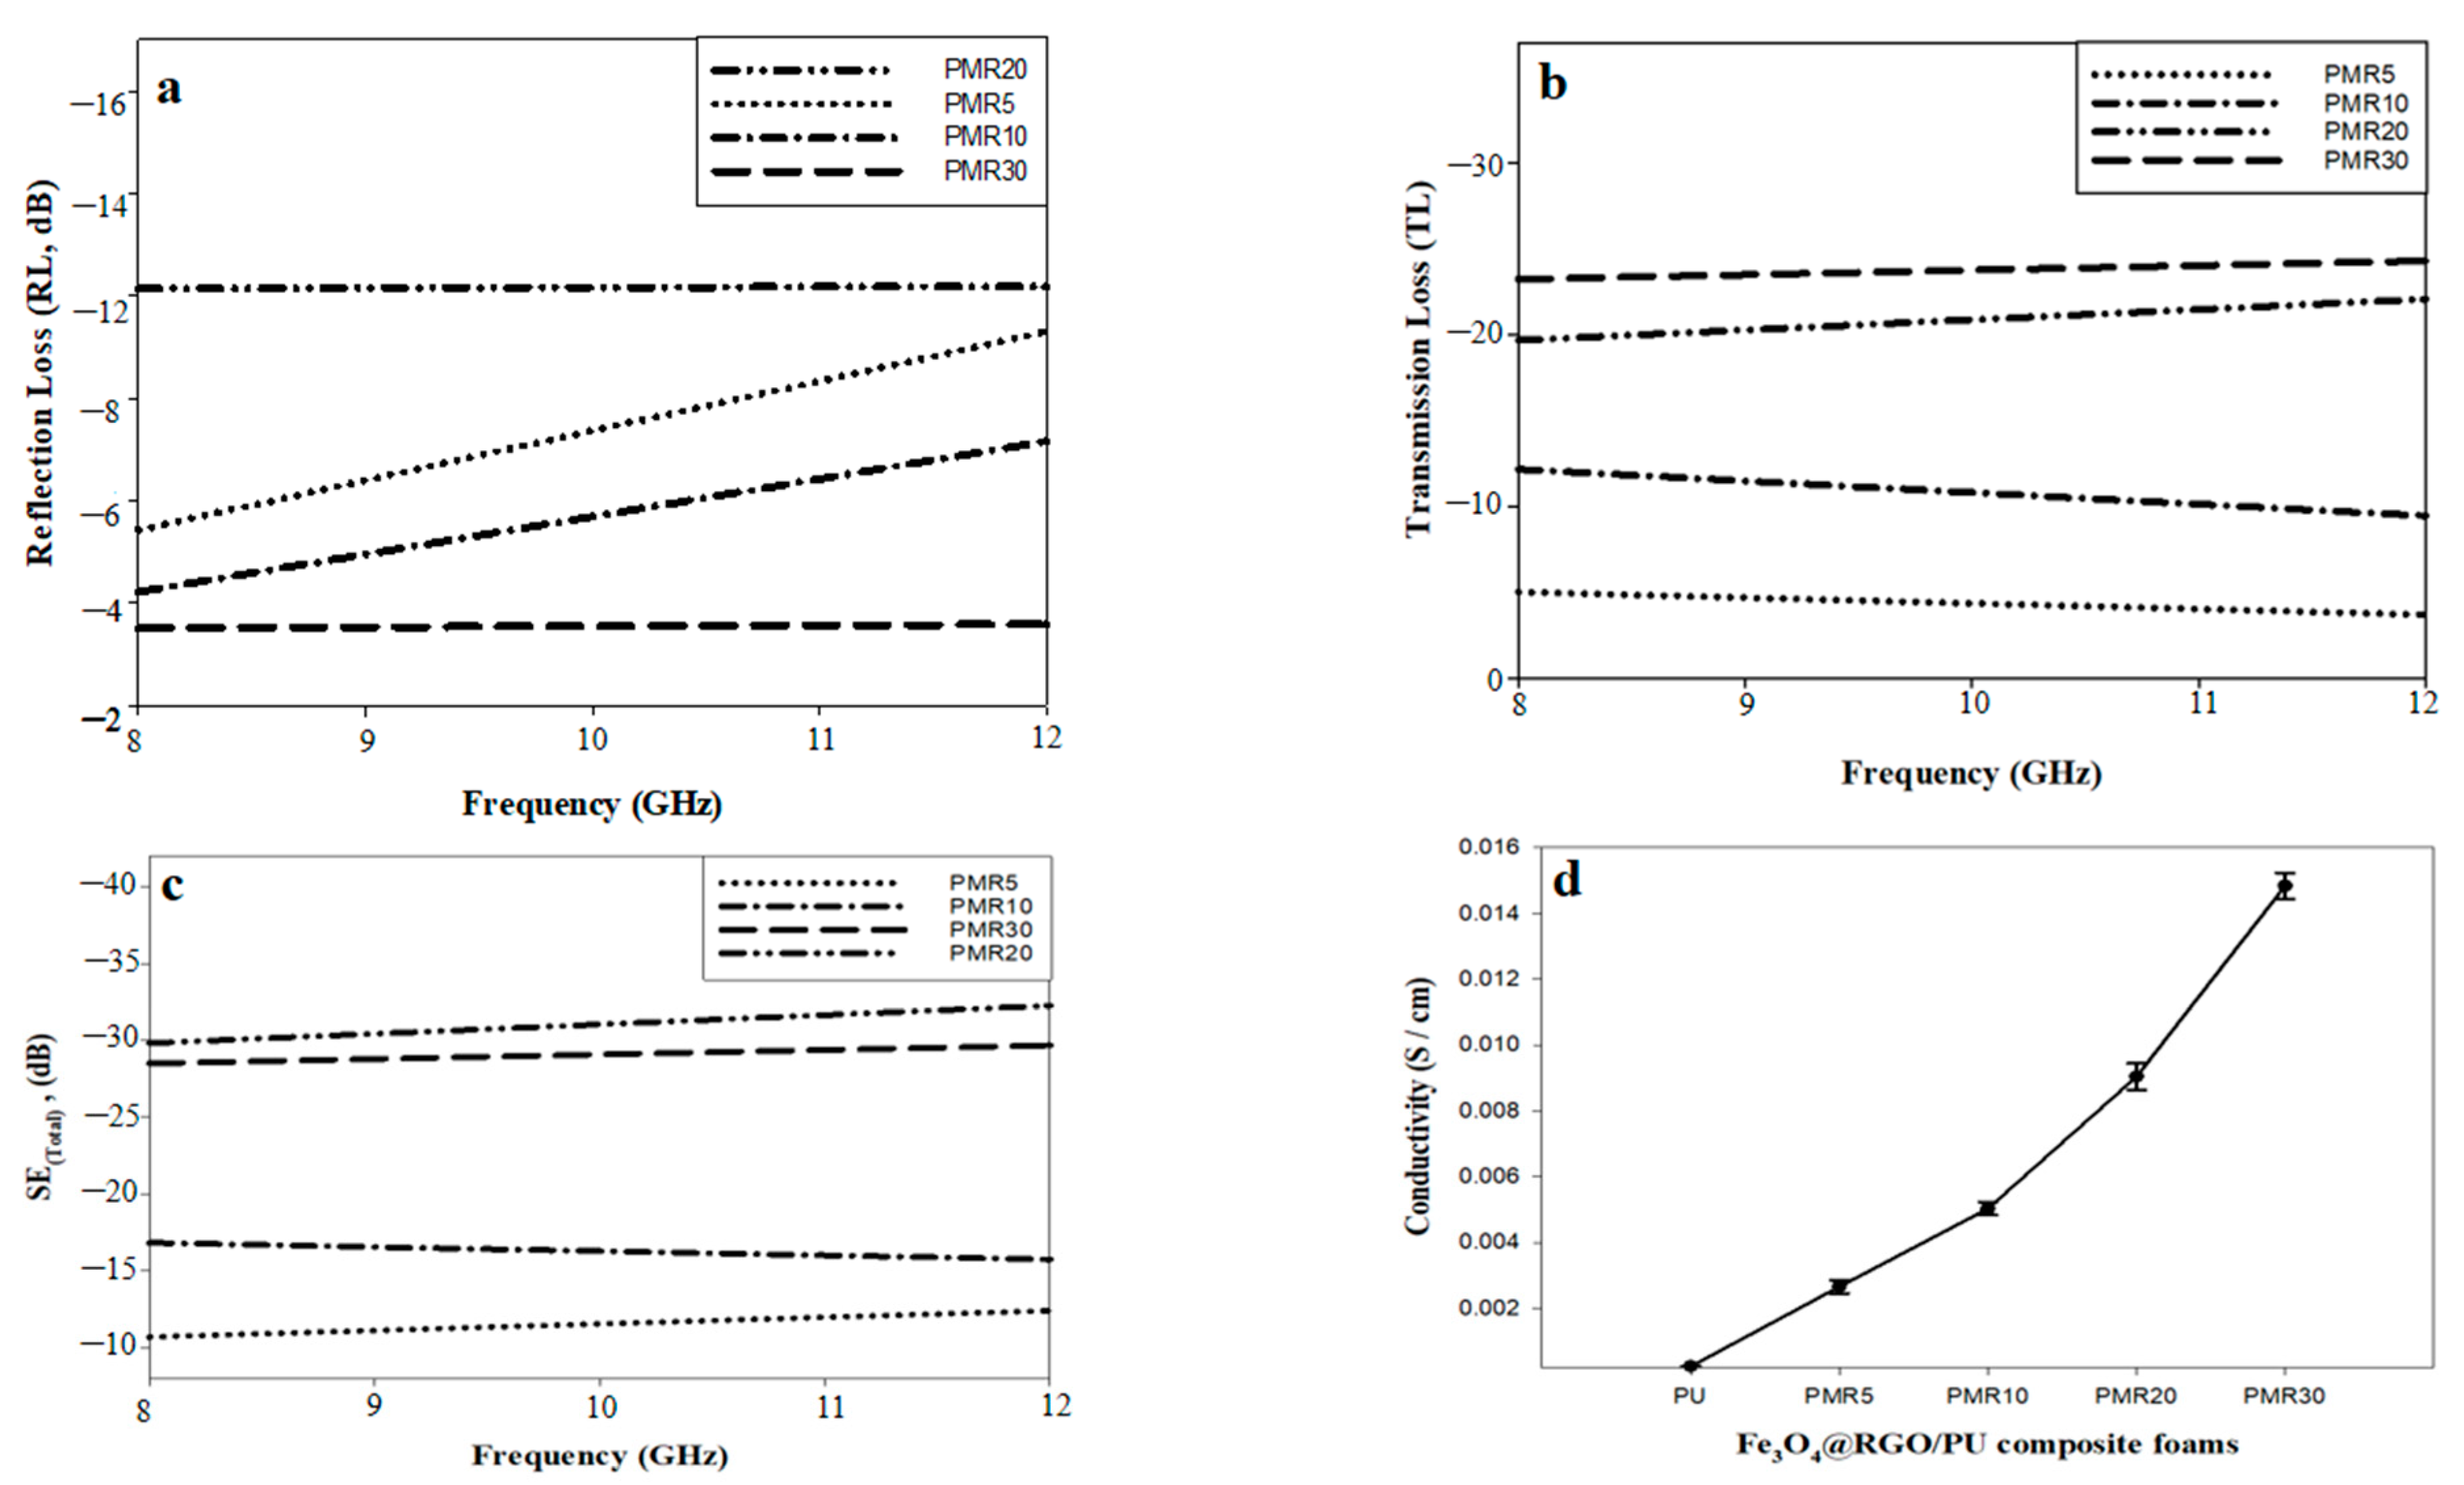
| Matrix | Filler | Filler Loading (%) | Thickness (mm) | Conductivity (S/cm) | Freq. Range (GHz) | SE (dB) | Ref. |
|---|---|---|---|---|---|---|---|
| PVA | Fe3O4@rGO | 35 wt% | 3 | ˂0.001 | 8–12 | −15 | [53] |
| PVC | 10 wt% | 1.8 | 7.7 × 10⁻⁶ | −13 | [54] | ||
| PANI | 66 wt% | 3 | 2.6 | −32 | [18] | ||
| PS | 2.24 v% | - | 0.21 | −30 | [55] | ||
| PU | 15 wt% | 6 | 2.844 × 10⁻³ | −13 | This work | ||
| PU | 25 wt% | 6 | 10.9 × 10⁻³ | −23.2 | |||
| PU | 35 wt% | 6 | 34.3 × 10⁻³ | −33 |
Publisher’s Note: MDPI stays neutral with regard to jurisdictional claims in published maps and institutional affiliations. |
© 2022 by the authors. Licensee MDPI, Basel, Switzerland. This article is an open access article distributed under the terms and conditions of the Creative Commons Attribution (CC BY) license (https://creativecommons.org/licenses/by/4.0/).
Share and Cite
Oraby, H.; Tantawy, H.R.; Correa-Duarte, M.A.; Darwish, M.; Elsaidy, A.; Naeem, I.; Senna, M.H. Tuning Electro-Magnetic Interference Shielding Efficiency of Customized Polyurethane Composite Foams Taking Advantage of rGO/Fe3O4 Hybrid Nanocomposites. Nanomaterials 2022, 12, 2805. https://doi.org/10.3390/nano12162805
Oraby H, Tantawy HR, Correa-Duarte MA, Darwish M, Elsaidy A, Naeem I, Senna MH. Tuning Electro-Magnetic Interference Shielding Efficiency of Customized Polyurethane Composite Foams Taking Advantage of rGO/Fe3O4 Hybrid Nanocomposites. Nanomaterials. 2022; 12(16):2805. https://doi.org/10.3390/nano12162805
Chicago/Turabian StyleOraby, Hussein, Hesham Ramzy Tantawy, Miguel A. Correa-Duarte, Mohammad Darwish, Amir Elsaidy, Ibrahim Naeem, and Magdy H. Senna. 2022. "Tuning Electro-Magnetic Interference Shielding Efficiency of Customized Polyurethane Composite Foams Taking Advantage of rGO/Fe3O4 Hybrid Nanocomposites" Nanomaterials 12, no. 16: 2805. https://doi.org/10.3390/nano12162805