
Trends in the Development of Electronic Noses Based on Carbon Nanotubes Chemiresistors for Breathomics


Abstract
:1. Introduction
- low-cost diagnosis in developing countries [20];
2. Materials and Methods
2.1. CNTs Functionalization
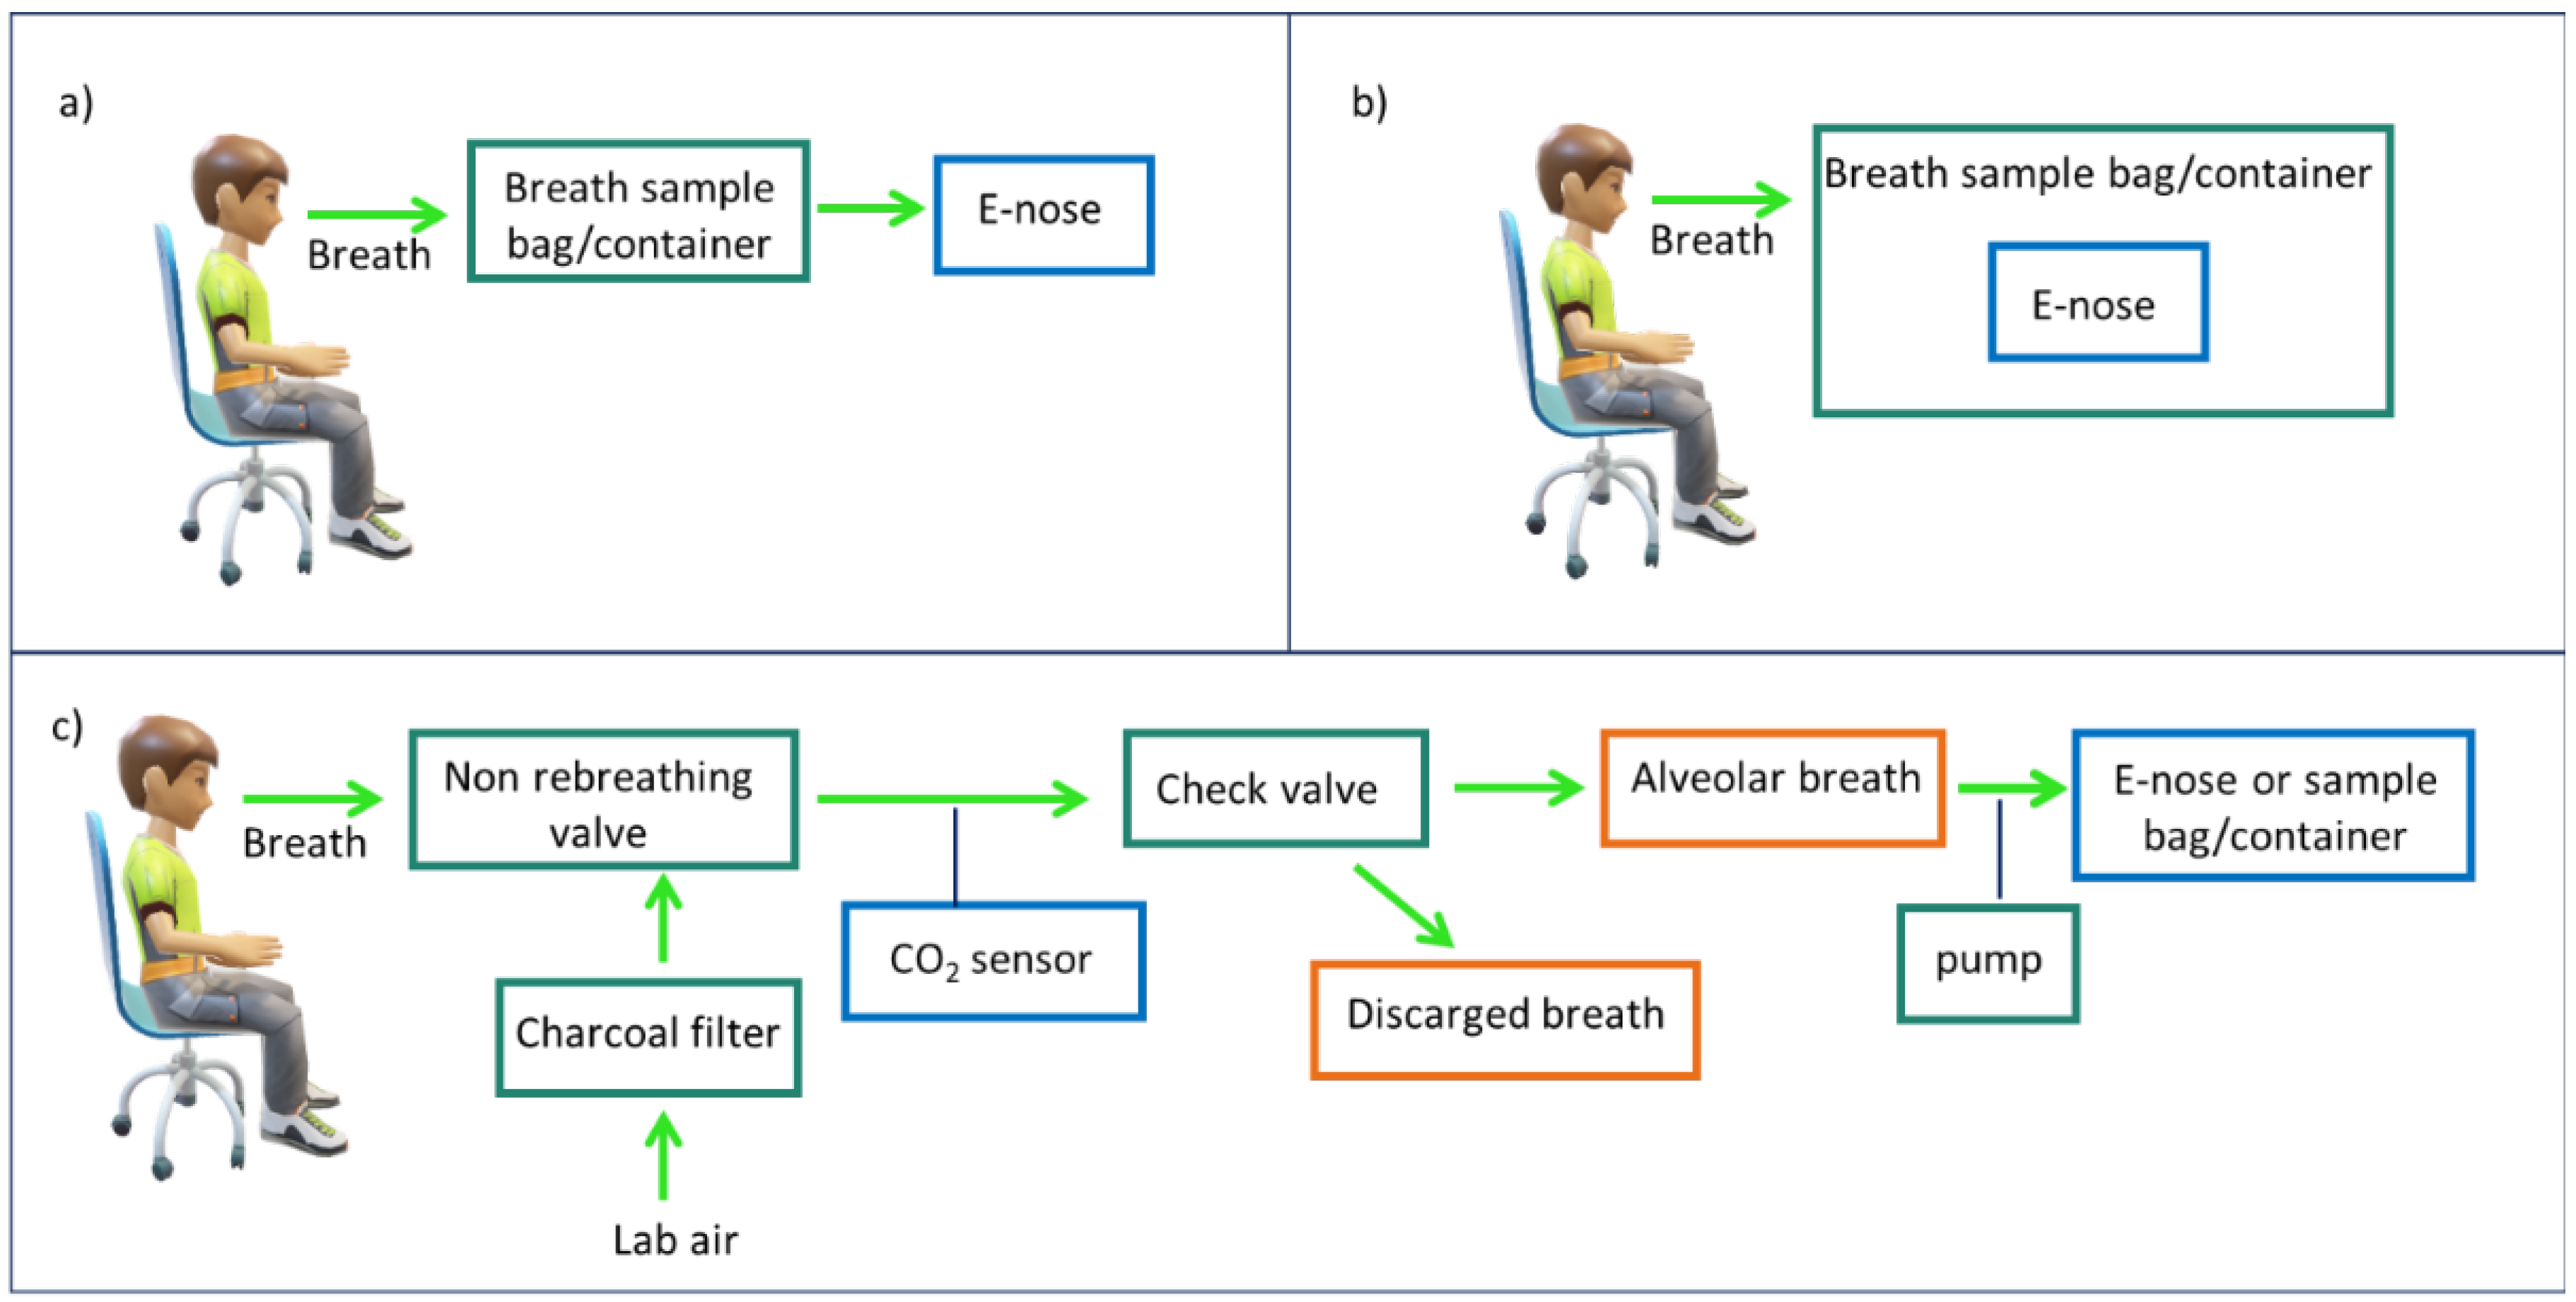
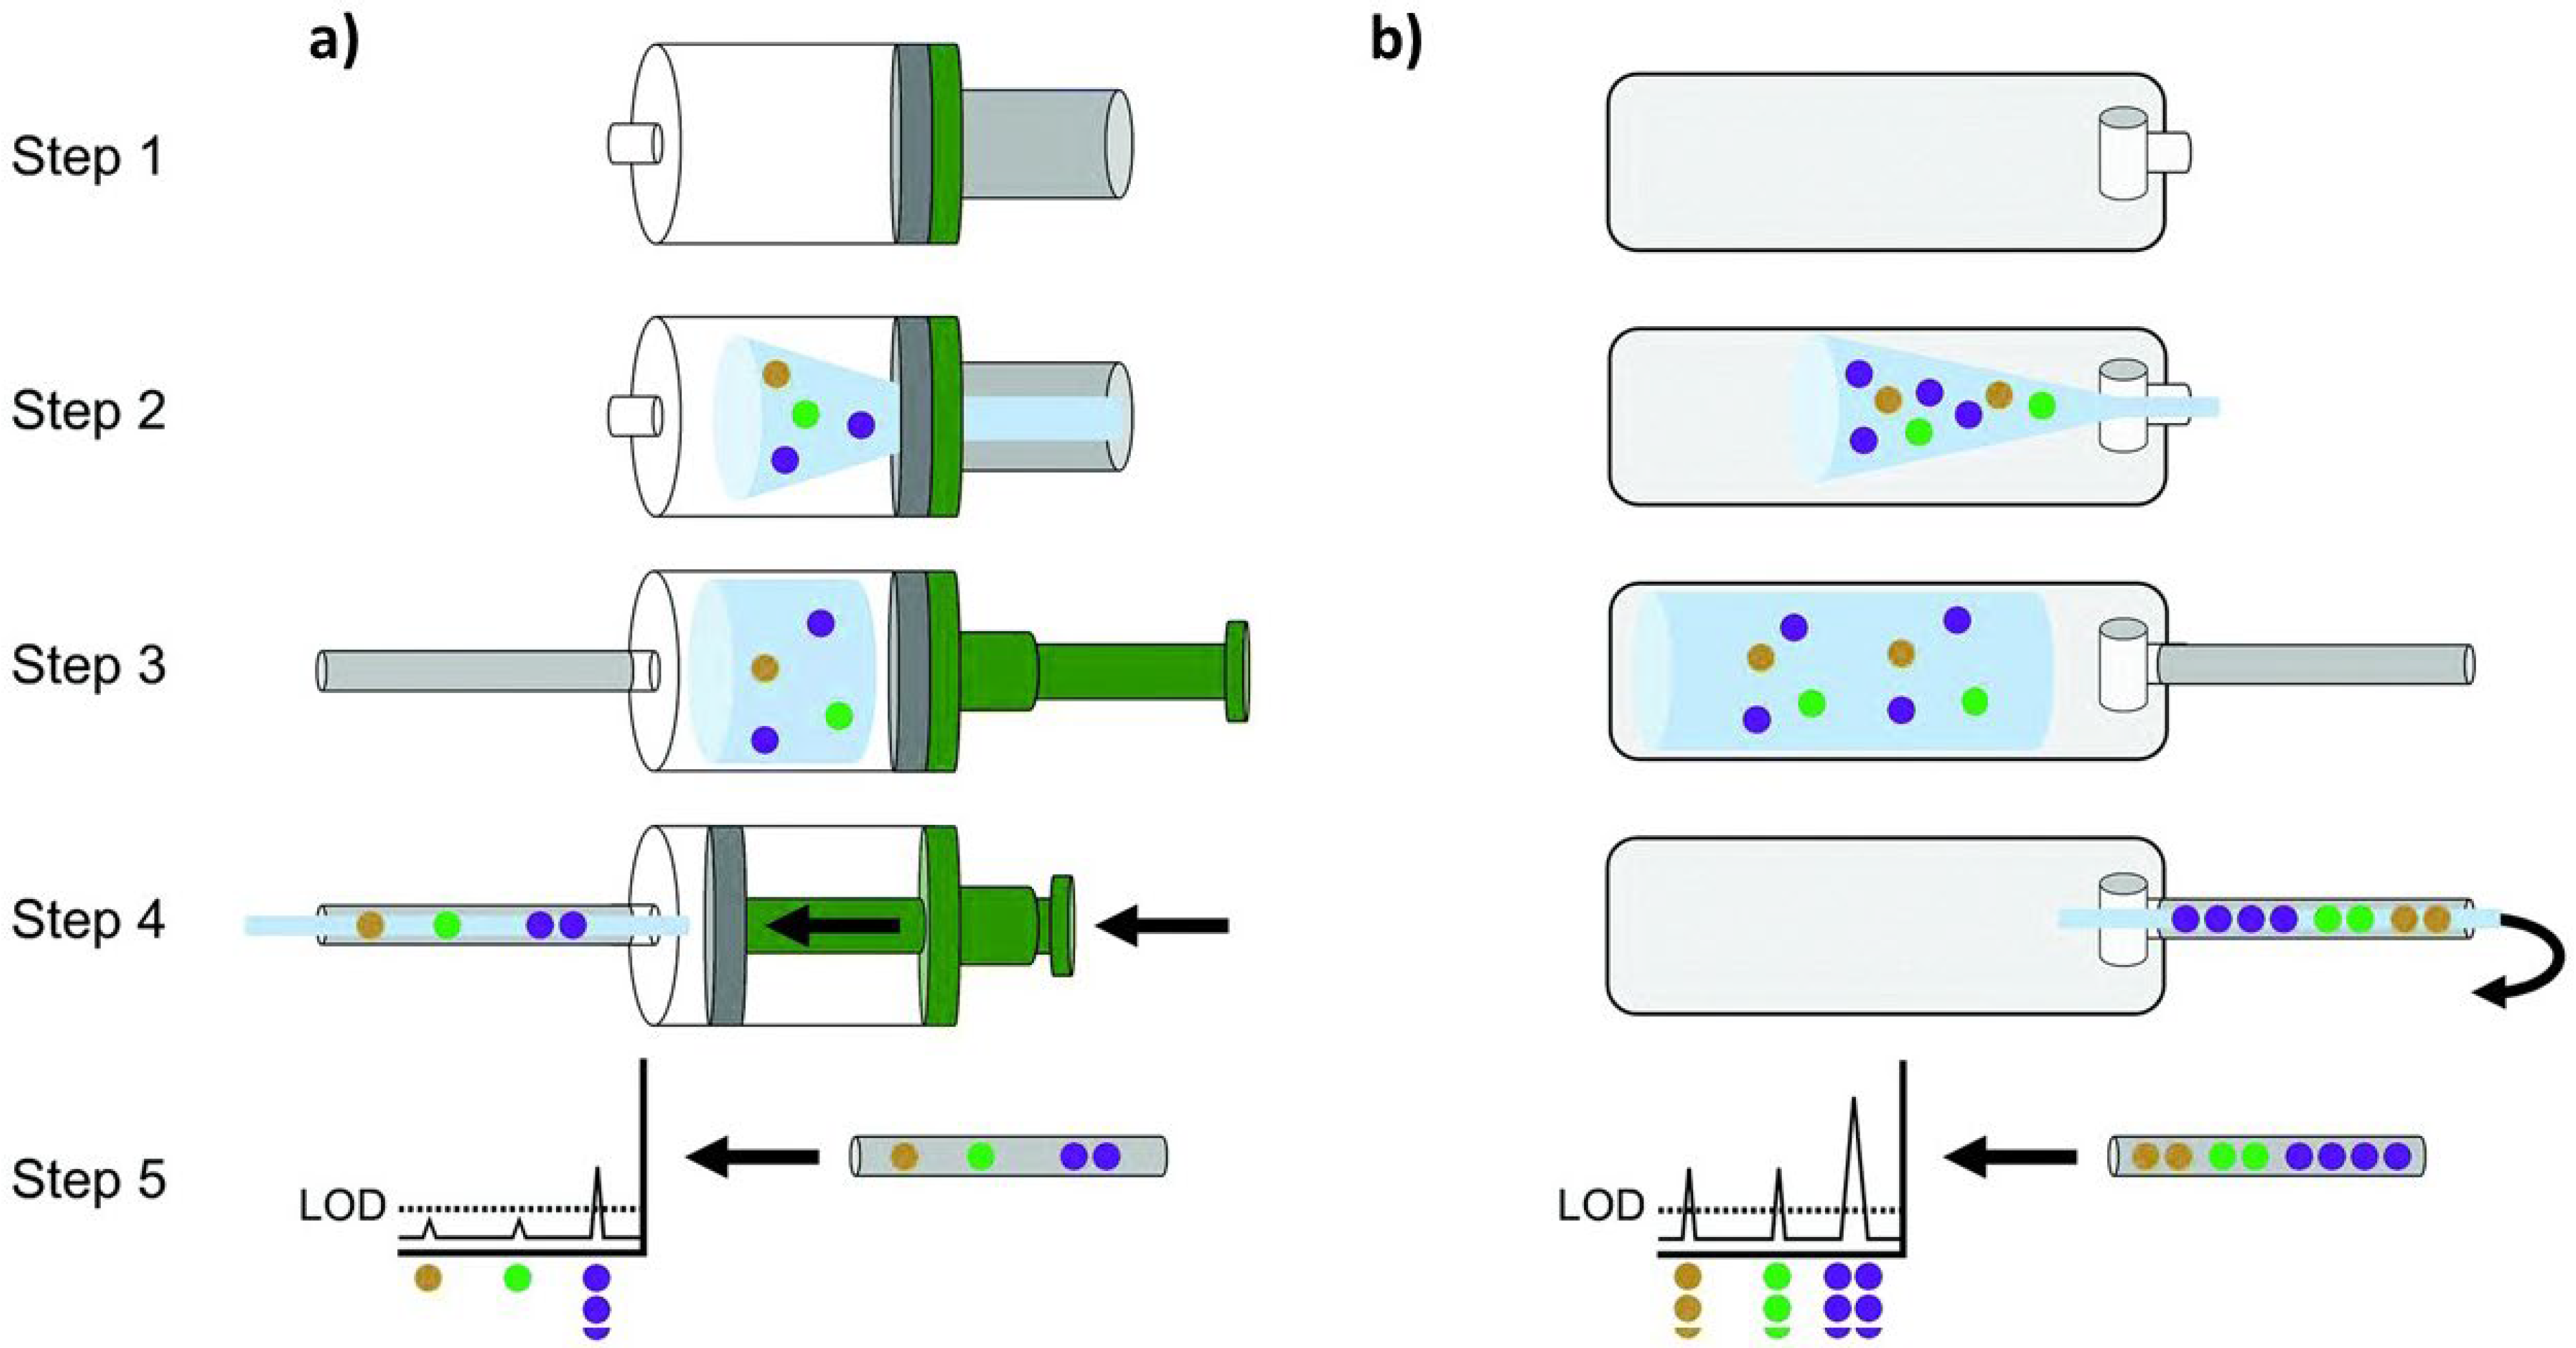
2.2. Breath Sampling Procedure
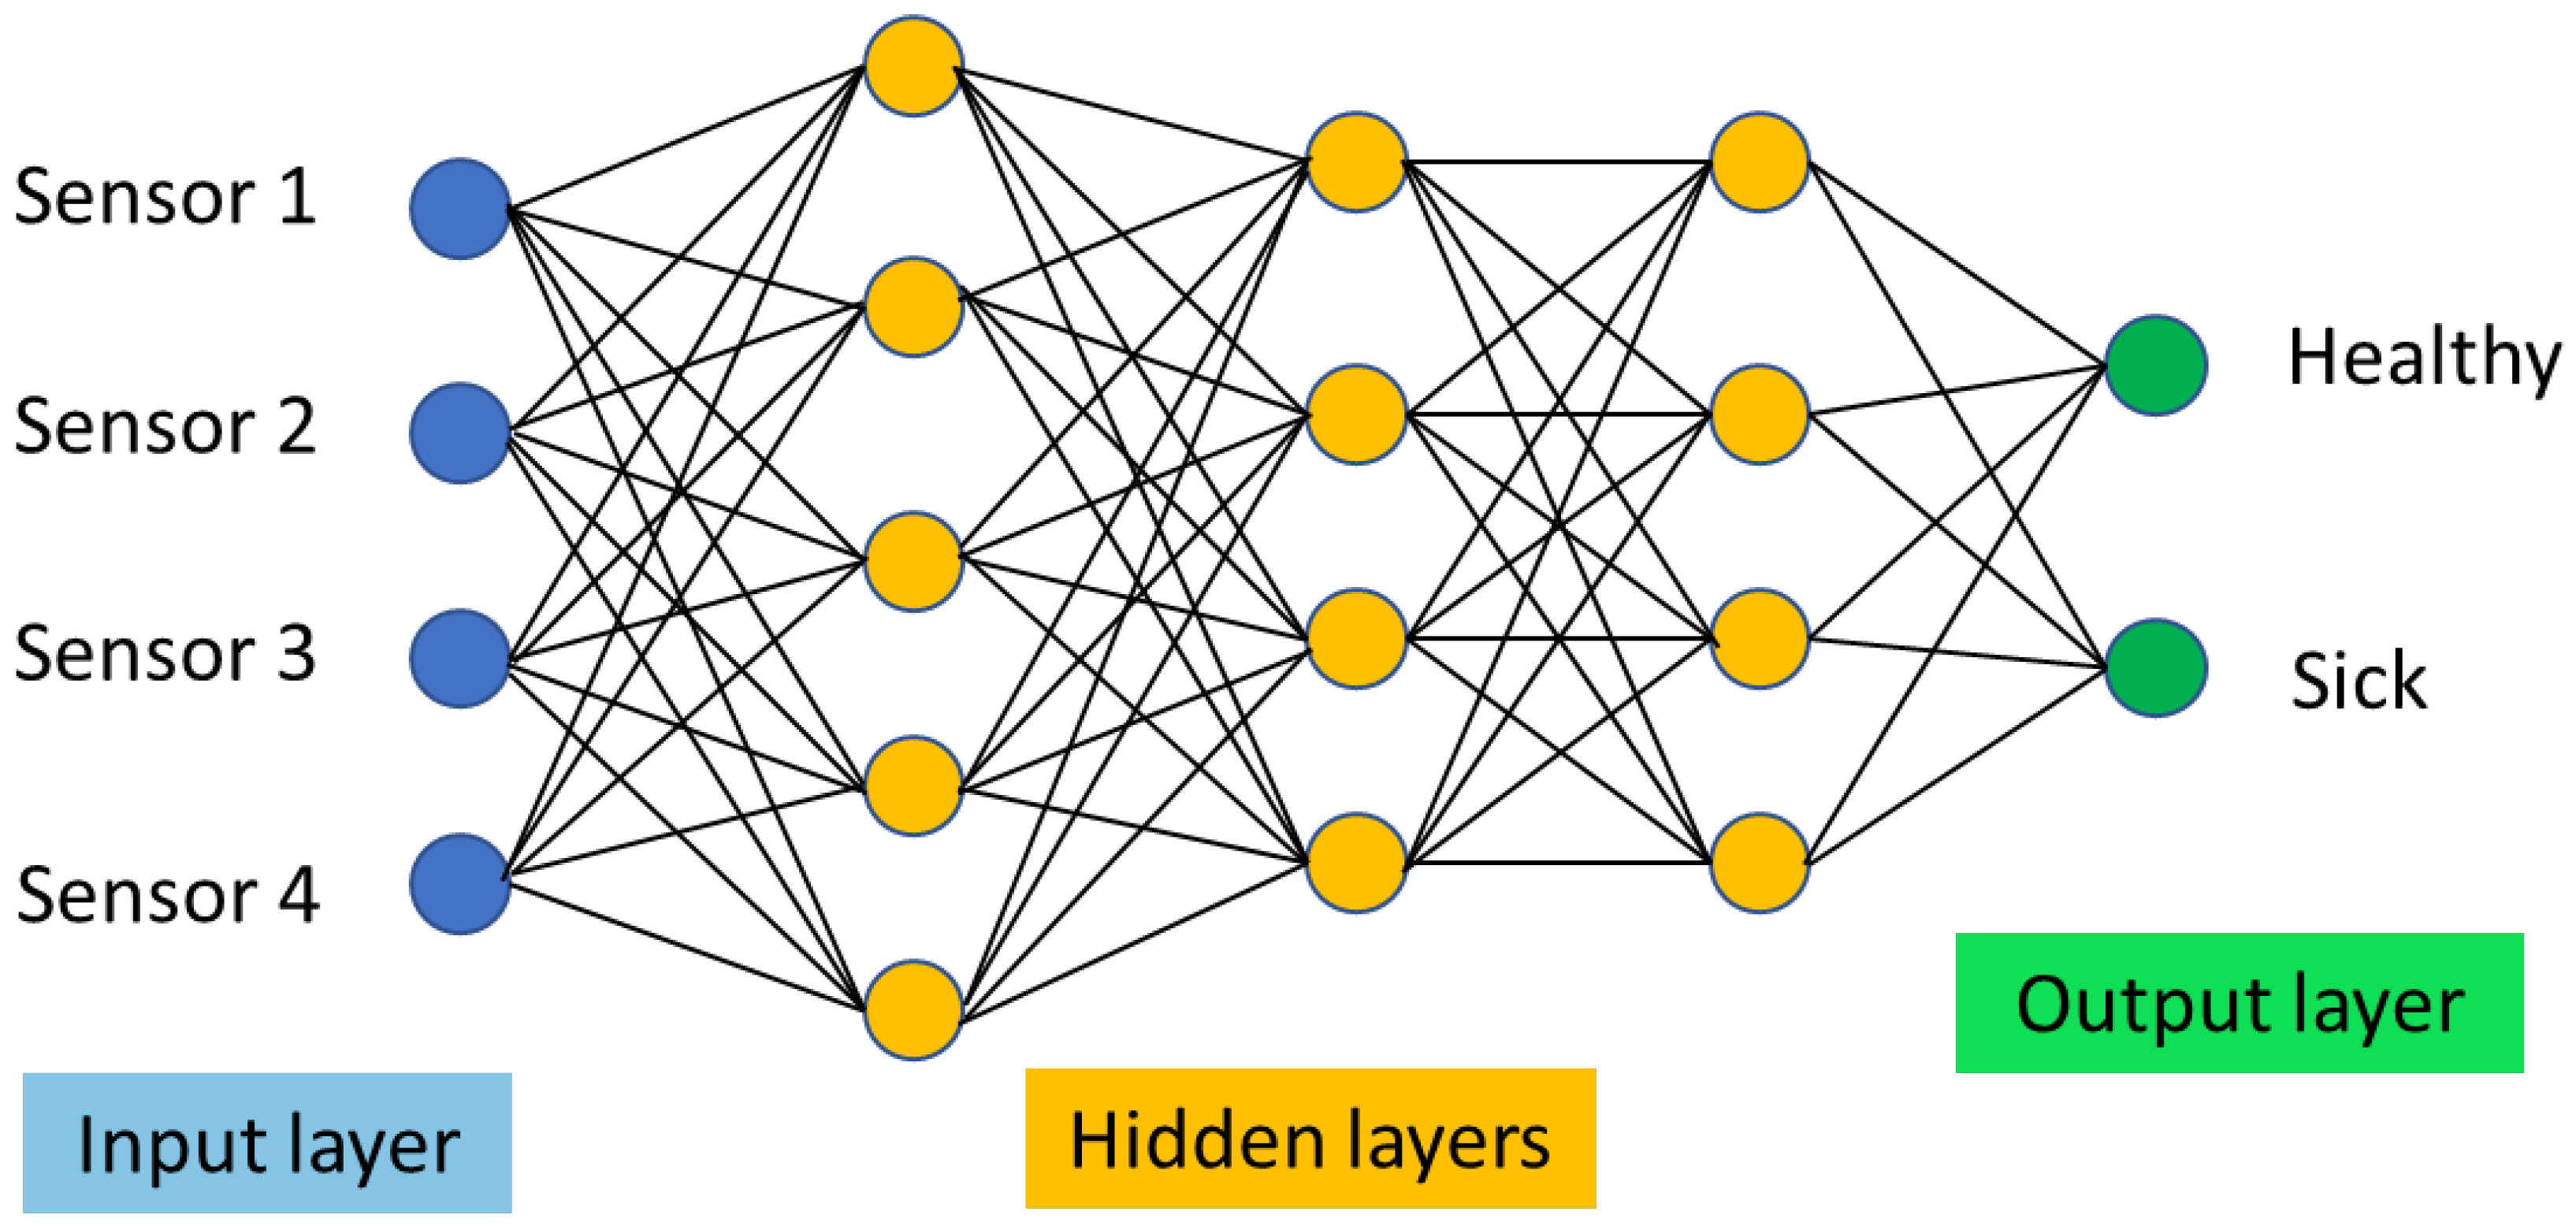
2.3. Statistical Data Analysis
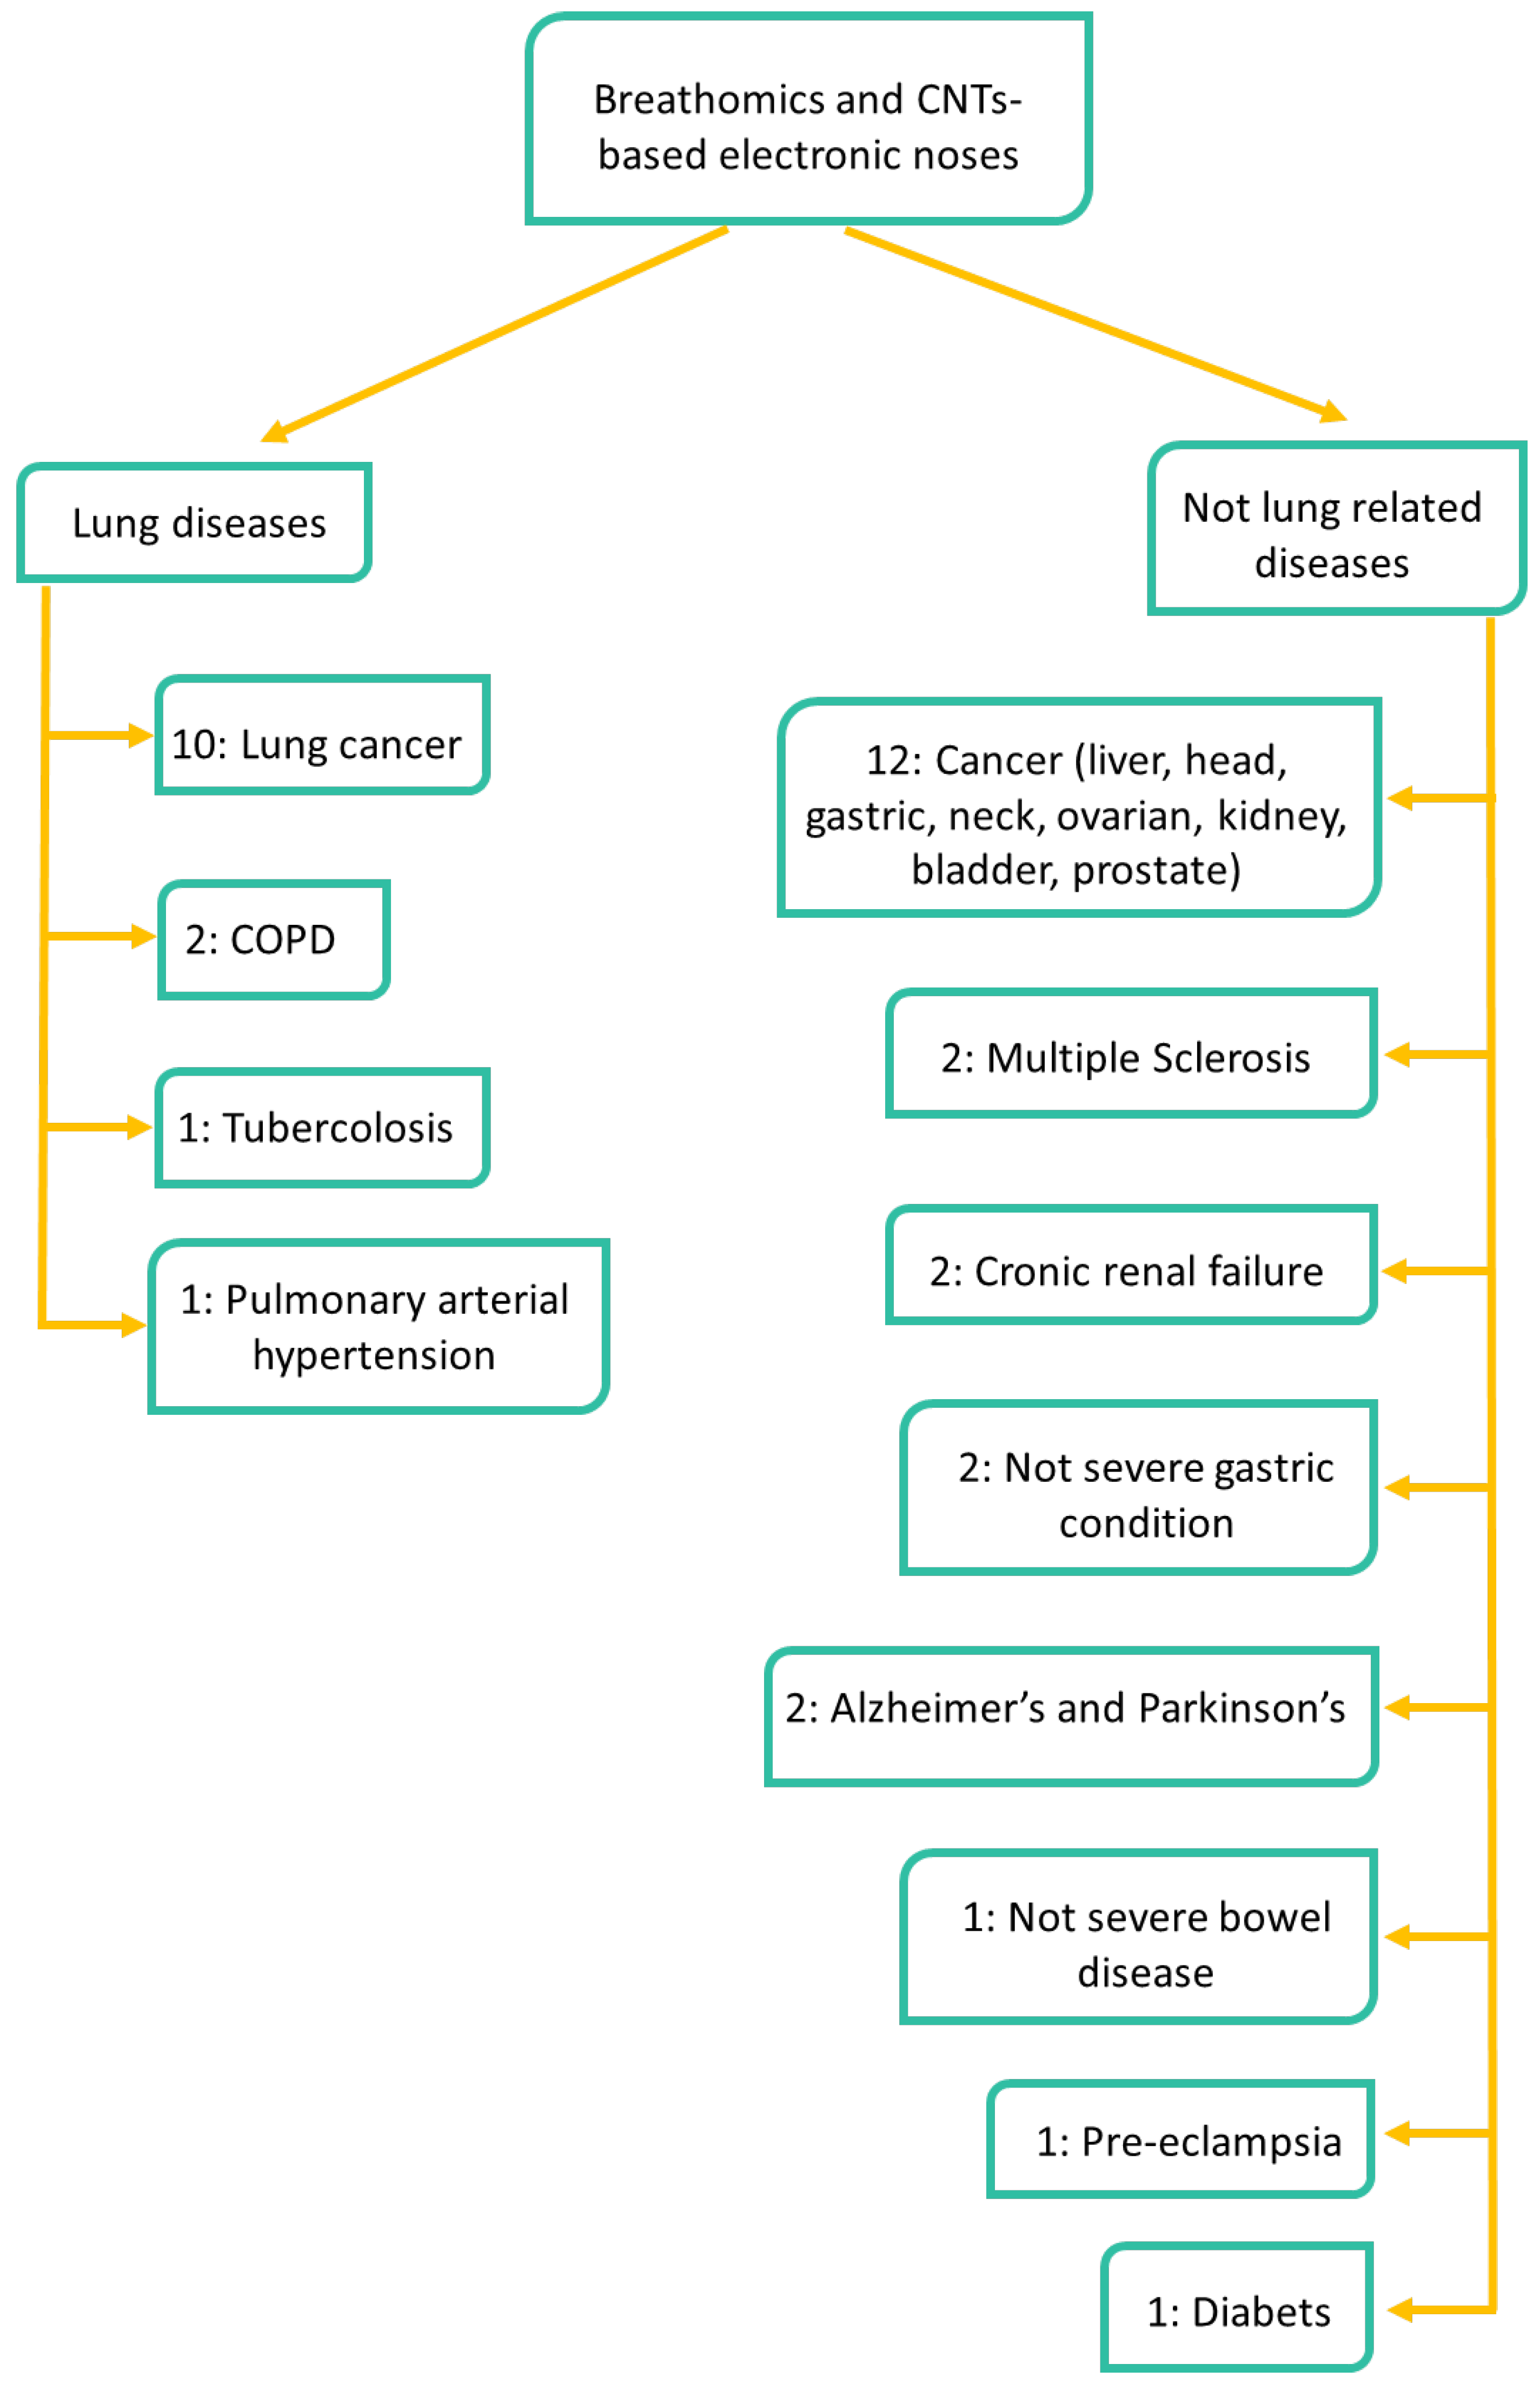
2.4. Targeted Diseases
2.5. Study Population
3. Results
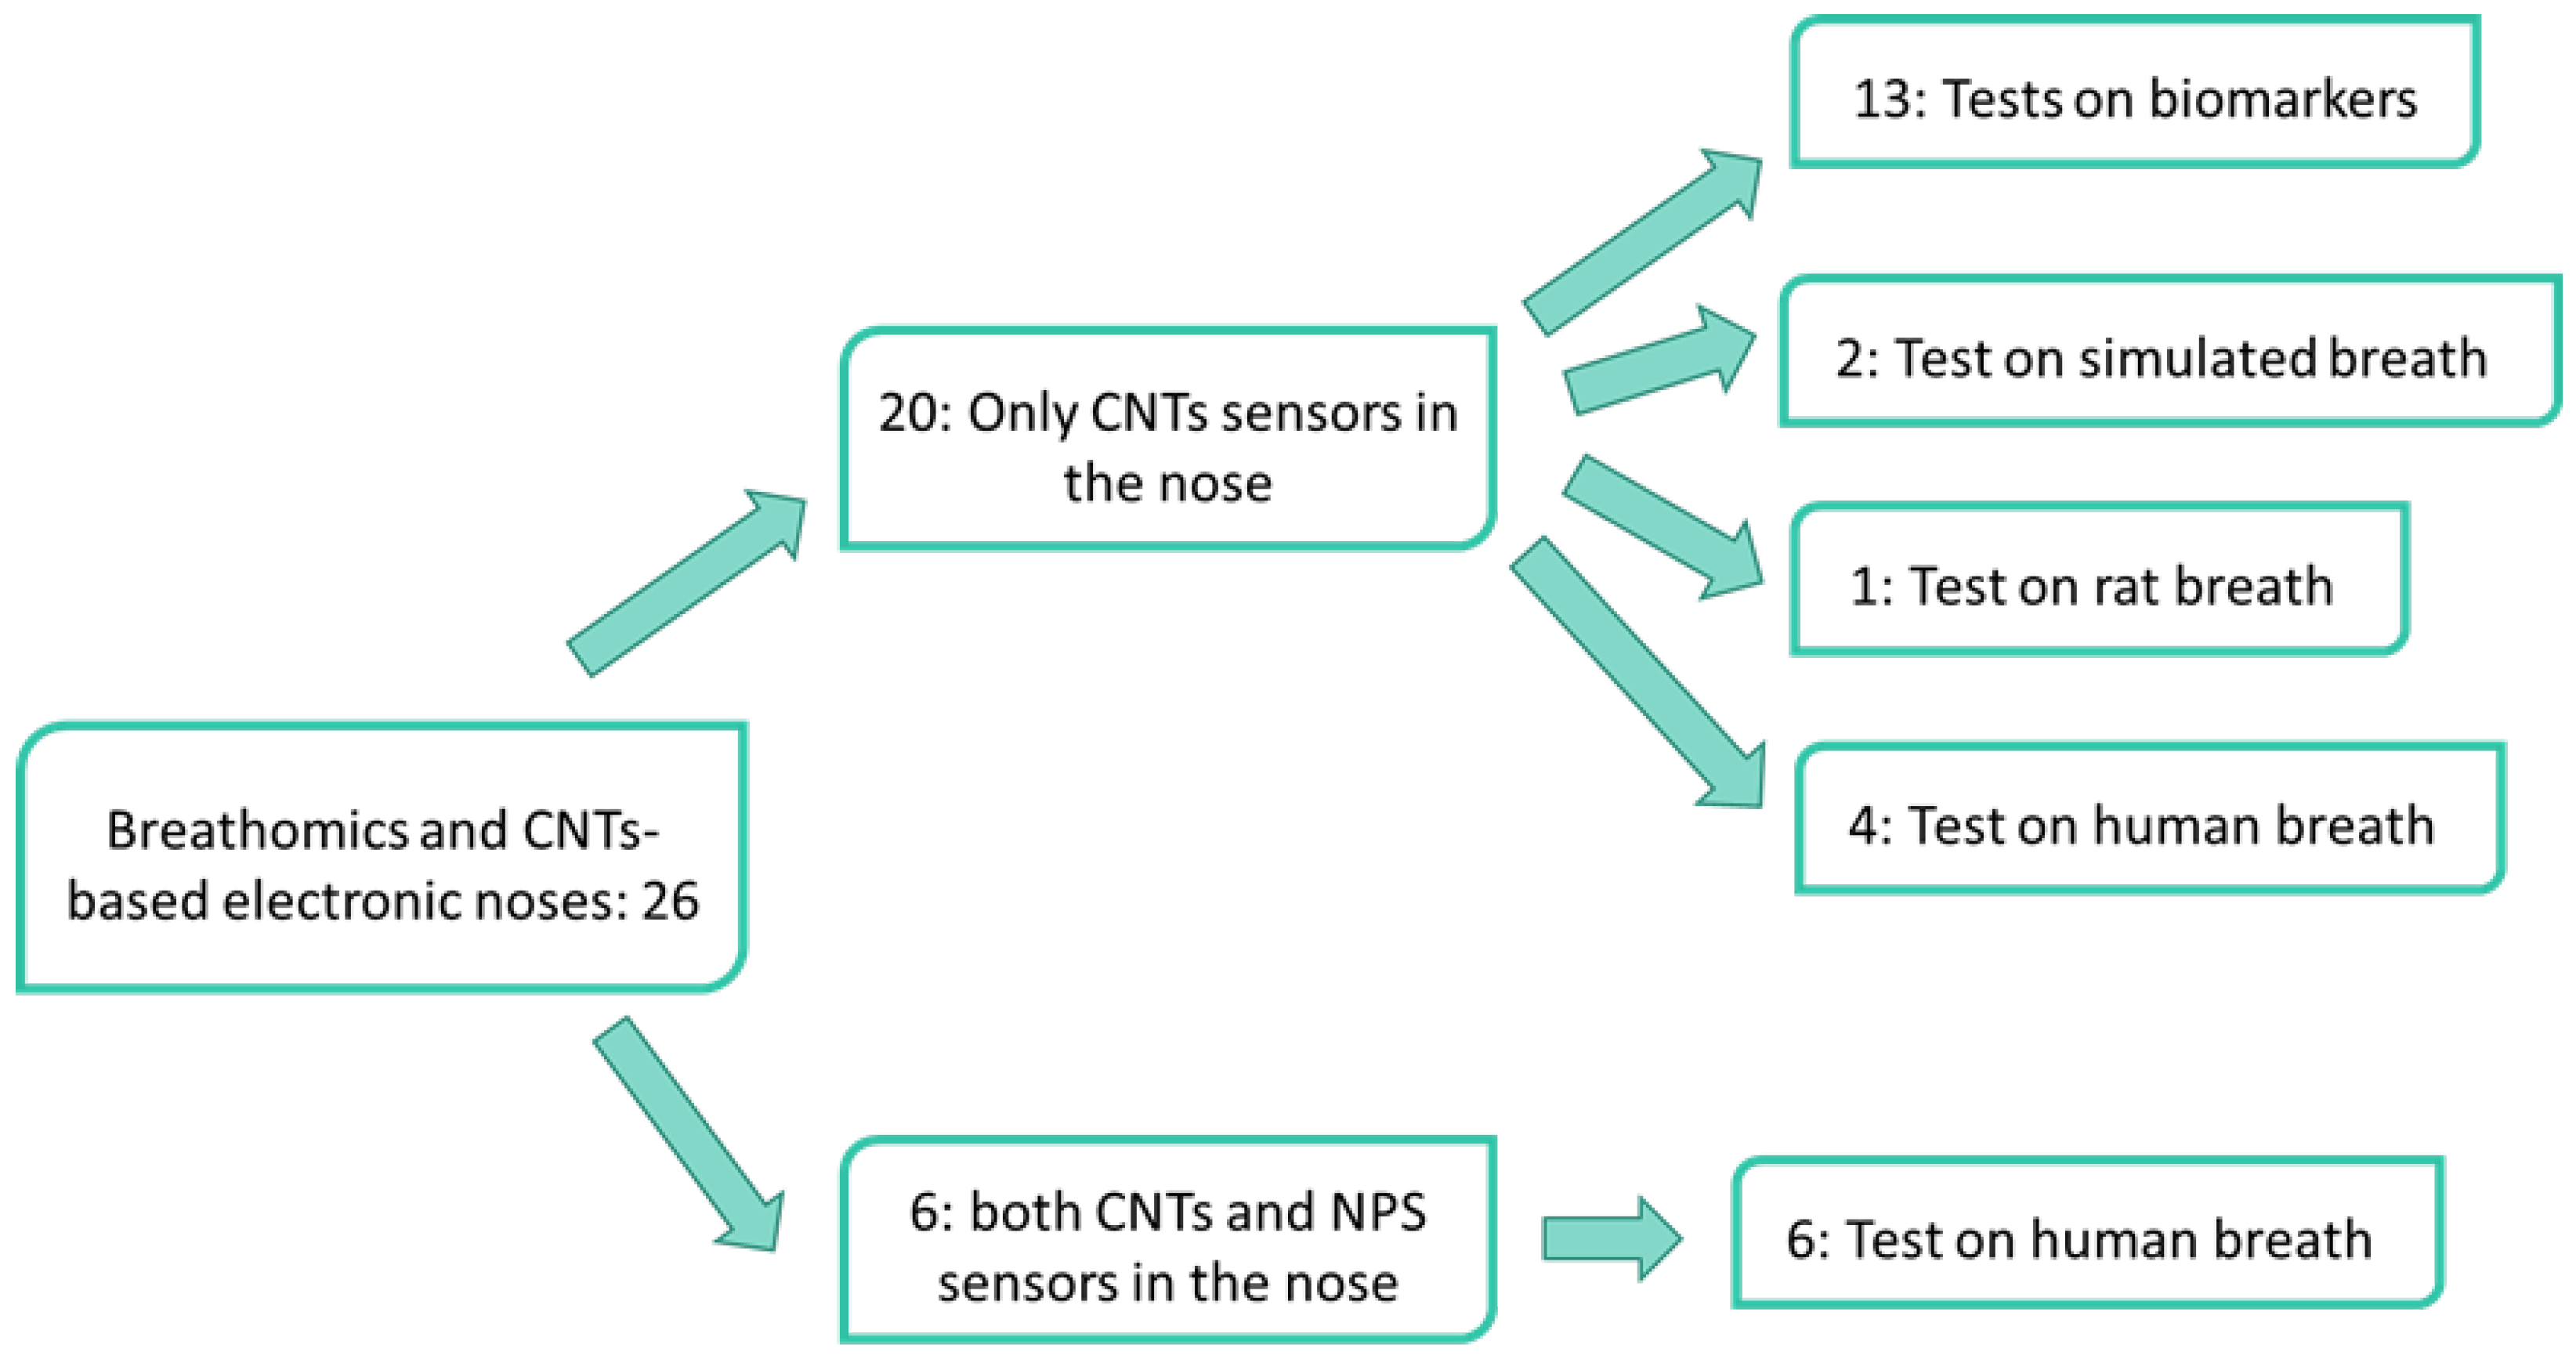
3.1. Electronic Noses Based on CNTs-Sensors
3.1.1. Biomarkers Discrimination
3.1.2. Simulated Breath
3.1.3. Non-Human Breath
3.1.4. Human Exhaled Breath
3.2. Electronic Noses Based on CNTs-Sensors and Gold NPs-Sensors
4. Conclusions
Author Contributions
Funding
Institutional Review Board Statement
Informed Consent Statement
Data Availability Statement
Conflicts of Interest
References
- Ibrahim, W.; Carr, L.; Wilde, R.C.M.J.; Salman, D.; Monks, P.S.; Thomas, P.; Brightling, C.E.; Siddiqui, S.; Greening, N.J. The use of volatile organic compounds in respiratory diseases. Thorax 2021, 76, 514–521. [Google Scholar] [PubMed]
- Pauling, L.; Robinson, A.B.; Teranishi, R.; Cary, P. Quantitative analysis of urine vapor and breath by gas-liquid partition chromatography. Proc. Natl. Acad. Sci. USA 1971, 68, 2374–2376. [Google Scholar] [PubMed]
- De Lacy Costello, B.; Amann, A.; Al-Kateb, H.; Flynn, C.; Filipiak, W.; Ratcliffe, N. A review of the volatiles from the healthy human body. J. Breath Res. 2014, 8, 014001. [Google Scholar]
- Di Natale, C.; Paolesse, R.; Martinelli, E.; Capuano, R. Solid-state gas sensors for breath analysis: A review. Anal. Chim. Acta 2014, 824, 1–17. [Google Scholar] [PubMed]
- Vishinkin, R.; Haick, H. Nanoscale Sensor Technologies for Disease Detection via Volatolomics. Small 2015, 11, 6142. [Google Scholar] [PubMed]
- Chuang, M.-Y.; Chen, C.C.; Zan, H.-W.; Meng, H.-F.; Lu, C.-J. Organic gas sensor with an improved lifetime for detecting breath ammonia in hemodialysis patients. ACS Sens. 2017, 2, 1788. [Google Scholar]
- Guo, D.; Zhang, D.; Li, N.; Zhang, L.; Yang, J. A Novel Breath Analysis System Based on Electronic Olfaction. IEEE Trans. Biomed. Eng. 2010, 57, 2753–2763. [Google Scholar]
- Gouma, P.I.; Kalyanasundaram, K. A selective nanosensing probe for nitric oxide. Appl. Phys. Lett. 2008, 93, 244102. [Google Scholar]
- Kao, K.W.; Hsu, M.C.; Chang, Y.H.; Gwo, S.; Yeh, J.A. A sub-ppm acetone gas sensor for diabetes detection using 10 nm thick ultrathin InN FETs. Sensors 2012, 12, 7157–7168. [Google Scholar]
- Righettoni, M.; Tricoli, A.; Pratsinis, S.E. Si:WO3 sensors for highly selective detection of acetone for easy diagnosis of diabetes by breath analysis. Anal. Chem. 2010, 82, 3581–3587. [Google Scholar]
- Zhao, H.; Liu, L.; Lin, X.; Dai, J.; Liu, S.; Fei, T.; Zhang, T. Proton-conductive gas sensor: A new way to realize highly selective ammonia detection for analysis of exhaled human breath. ACS Sens. 2019, 5, 346–352. [Google Scholar] [PubMed]
- Das, T.; Das, S.; Karmakar, M.; Chakraborty, S.; Saha, D.; Pal, M. Novel barium hexaferrite based highly selective and stable trace ammonia sensor for detection of renal disease by exhaled breath analysis. Sens. Actuators B Chem. 2020, 325, 128765. [Google Scholar]
- Haick, H.; Broza, Y.Y.; Mochalski, P.; Ruzsany, V.; Amann, A. Assessment, origin, and implementation of breath volatile cancer markers. Chem. Soc. Rev. 2014, 43, 1423. [Google Scholar] [PubMed]
- Queralto, N.; Berliner, A.N.; Goldsmith, B.; Martino, R.; Rhodes, P.; Lim, S.H. Detecting cancer by breath volatile organic compound analysis: A review of array-based sensors. J. Breath Res. 2014, 8, 027112. [Google Scholar]
- Buszewski, B.; Kesy, M.; Ligor, T.; Amann, A. Human exhaled air analytics: Biomarkers of diseases. Biomed Chromatogr. 2007, 21, 553–566. [Google Scholar] [PubMed]
- Van de Goor, R.; van Hooren, M.; Dingemans, A.M.; Kremer, B.; Kross, K. Training and validating a portable electronic nose for lung cancer screening. J. Thorac. Oncol. 2018, 13, 676–681. [Google Scholar] [PubMed]
- Behera, B.; Joshi, R.; Vishnu, G.A.; Bhalerao, S.; Pandya, H.J. Electronic nose: A non-invasive technology for breath analysis of diabetes and lung cancer patients. J. Breath Res. 2019, 13, 024001. [Google Scholar]
- David, P.; Shoenfeld, Y. The Smell in COVID-19 Infection: Diagnostic Opportunities. Is. Med. Assoc. J. 2020, 7, 335–337. [Google Scholar]
- McWilliams, A.; Beigi, P.; Srinidhi, A.; Lam, S.; MacAulay, C.E. Sex and smoking status effects on the early detection of early lung cancer in high-risk smokers using an electronic nose. IEEE Trans. Biomed. Eng. 2015, 62, 2044–2054. [Google Scholar]
- Mohamed, E.I.; Mohamed, M.A.; Moustafa, M.H.; Abdel-Mageed, S.M.; Moro, A.M.; Baess, A.I.; El-Kholy, S.M. Qualitative analysis of biological tuberculosis samples by an electronic nose-based artificial neural network. Int. J. Tuberc. Lung Dis. 2017, 21, 810–817. [Google Scholar]
- Karnon, J.; Goyder, E.; Tappenden, P.; McPhie, S.T.; Brazier, I.J.; Madan, J. A review and critique of modelling in prioritising and designing screening programmes. Health Technol. Assess. 2007, 11, 1. [Google Scholar]
- Montuschi, P.; Santini, G.; Mores, N.; Vignoli, A.; Macagno, F.; Shoreh, R.; Tenori, L.; Zini, G.; Fuso, L.; Mondino, C.; et al. Breathomics for assessing the effects of treatment and withdrawal with inhaled beclomethasone/formoterol in patients with COPD. Front. Pharmacol. 2018, 9, 258. [Google Scholar] [PubMed]
- Staerz, A.; Roeck, F.; Weimar, U.; Barsan, N. Electronic Nose: Current Status and Future Trends. In Surface and Interface Science: Applications of Surface Science I; Wandelt, K., Ed.; Wiley-VCH: Hoboken, NJ, USA, 2020; pp. 335–379. [Google Scholar]
- Wilson, A.D.; Baietto, M. Applications and Advances in Electronic-Nose Technologies. Sensors 2009, 9, 5099–5148. [Google Scholar] [PubMed]
- Ellis, J.E.; Star, A. Carbon nanotube-based gas sensors toward breath analysis. Chem. Plus Chem. 2016, 81, 1248. [Google Scholar]
- Norizan, M.N.; Moklis, M.H.; Demon, S.Z.N.; Halim, N.A.; Samsuri, A.; Mohamad, I.S.; Knight, V.F.; Abdullah, N. Carbon nanotubes: Functionalisation and their application in chemical sensors. RSC Adv. 2020, 10, 43704–43732. [Google Scholar]
- Schroeder, V.; Savagatrup, S.; He, M.; Lin, S.; Swager, T.M. Carbon nanotube chemical sensors. Chem. Rev. 2018, 119, 599–663. [Google Scholar]
- Kumar, S.; Pavelyev, V.; Mishra, P.; Tripathi, N. A review on chemiresistive gas sensors based on carbon nanotubes: Device and technology transformation. Sens. Actuator A Phys 2018, 283, 174–186. [Google Scholar]
- Goldoni, A.; Alijani, V.; Sangaletti, L.; D’Arsiè, L. Advanced promising routes of carbon/metal oxides hybrids in sensors: A review. Electrochim. Acta 2018, 266, 139–150. [Google Scholar]
- Rana, M.M.; Ibrahim, D.S.; Asyraf, M.M.; Jarin, S.; Tomal, A. A review on recent advances of CNTs as gas sensors. Sens. Rev. 2017, 37, 127–136. [Google Scholar]
- Meyyappan, M. Carbon nanotube-based chemical sensors. Small 2016, 12, 2118–2129. [Google Scholar]
- Kauffman, D.R.; Star, A. Carbon Nanotube Gas and Vapor Sensors. Angew. Chem. Int. Ed. 2008, 47, 6550–6570. [Google Scholar] [CrossRef] [PubMed]
- Zhang, T.; Mubeen, S.; Myung, N.V.; Deshusses, M.A. Recent progress in carbon nanotube-based gas sensors. Nanotechnology 2008, 19, 332001. [Google Scholar] [CrossRef] [PubMed]
- Freddi, S.; Drera, G.; Pagliara, S.; Goldoni, A.; Sangaletti, L. Enhanced selectivity of target gas molecules through a minimal array of gas sensors based on nanoparticle-decorated SWCNTs. Analyst 2019, 144, 4100–4110. [Google Scholar] [CrossRef] [PubMed]
- Nag, S.; Sachan, A.; Castro, M.; Choudhary, V.; Feller, J.F. Sulfonated poly (ether-ether-ketone)[SPEEK] nanocomposites based on hybrid nanocarbons for the detection and discrimination of some lung cancer VOC biomarkers. J. Mater. Chem. B 2017, 5, 348. [Google Scholar] [CrossRef] [PubMed]
- Nag, S.; Sachan, A.; Castro, M.; Choudhary, V.; Feller, J.F. Spray layer-by-layer assembly of POSS functionalized CNT quantum chemo-resistive sensors with tuneable selectivity and ppm resolution to VOC biomarkers. Sens. Actuator B-Chem. 2016, 222, 362. [Google Scholar] [CrossRef]
- Abdelhalim, A.; Winkler, M.; Loghin, F.; Zeiser, C.; Lugli, P.; Abdellah, A. Highly sensitive and selective carbon nanotube-based gas sensor arrays functionalized with different metallic nanoparticles. Sens. Actuator B-Chem. 2015, 220, 1288–1296. [Google Scholar] [CrossRef]
- Liu, S.F.; Moh, L.C.; Swager, T.M. Single-walled carbon nanotube–metalloporphyrin chemiresistive gas sensor arrays for volatile organic compounds. Chem. Mat. 2015, 27, 3560–3563. [Google Scholar] [CrossRef]
- Chatterjee, S.; Castro, M.; Feller, J.F. Tailoring selectivity of sprayed carbon nanotube sensors (CNT) towards volatile organic compounds (VOC) with surfactants. Sens. Actuator B-Chem. 2015, 220, 840. [Google Scholar] [CrossRef]
- Chatterjee, S.; Castro, M.; Feller, J.F. An e-nose made of carbon nanotube based quantum resistive sensors for the detection of eighteen polar/nonpolar VOC biomarkers of lung cancer. J. Mater. Chem. B 2013, 1, 4563. [Google Scholar]
- Kumar, B.; Castro, M.; Feller, J.F. Quantum resistive vapour sensors made of polymer coated carbon nanotubes random networks for biomarkers detection. Chem. Sens. 2013, 3, 20. [Google Scholar]
- Castro, M.; Kumar, B.; Feller, J.F.; Haddi, Z.; Amari, A.; Bouchikhi, B. Novel e-nose for the discrimination of volatile organic biomarkers with an array of carbon nanotubes (CNT) conductive polymer nanocomposites (CPC) sensors. Sens. Actuator B-Chem. 2011, 159, 213. [Google Scholar] [CrossRef]
- Wang, F.; Swager, T.M. Diverse chemiresistors based upon covalently modified multiwalled carbon nanotubes. J. Am. Chem. Soc. 2011, 133, 11181–11193. [Google Scholar] [CrossRef] [PubMed] [Green Version]
- Zilberman, Y.; Ionescu, R.; Feng, X.; Müllen, K.; Haick, H. Nanoarray of polycyclic aromatic hydrocarbons and carbon nanotubes for accurate and predictive detection in real-world environmental humidity. ACS Nano 2011, 5, 6743–6753. [Google Scholar] [CrossRef] [PubMed]
- Zilberman, Y.; Tisch, U.; Shuster, G.; Pisula, W.; Feng, X.; Müllen, K.; Haick, H. Carbon Nanotube/Hexa-peri-hexabenzocoronene Bilayers for Discrimination Between Nonpolar Volatile Organic Compounds of Cancer and Humid Atmospheres. Adv. Mater. 2010, 22, 4317. [Google Scholar] [CrossRef] [PubMed]
- Leghrib, R.; Felten, A.; Demoisson, F.; Reniers, F.; Pireaux, J.J.; Llobet, E. Selective detection of benzene traces at room temperature using metal decorated carbon nanotubes. Procedia Eng. 2010, 5, 385–388. [Google Scholar] [CrossRef]
- Peng, G.; Trock, E.; Haick, H. Detecting simulated patterns of lung cancer biomarkers by random network of single-walled carbon nanotubes coated with nonpolymeric organic materials. Nano Lett. 2008, 8, 3631. [Google Scholar] [CrossRef]
- Park, C.H.; Schroeder, V.; Kim, B.J.; Swager, T.M. Ionic liquid-carbon nanotube sensor arrays for human breath related volatile organic compounds. ACS Sens. 2018, 3, 2432. [Google Scholar] [CrossRef]
- Haick, H.; Hakim, M.; Patrascu, M.; Levenberg, C.; Shehada, N.; Nakhoul, F.; Abassi, Z. Sniffing chronic renal failure in rat model by an array of random networks of single-walled carbon nanotubes. ACS Nano 2009, 3, 1258–1266. [Google Scholar] [CrossRef]
- Ionescu, R.; Broza, Y.; Shaltieli, H.; Sadeh, D.; Zilberman, Y.; Feng, X.; Glass-Marmor, L.; Lejbkowicz, I.; Müllen, K.; Miller, A.; et al. Detection of multiple sclerosis from exhaled breath using bilayers of polycyclic aromatic hydrocarbons and single-wall carbon nanotubes. ACS Chem. Neurosci. 2011, 2, 687. [Google Scholar] [CrossRef]
- Eamsa-Ard, T.; Seesaard, T.; Kitiyakara, T.; Kerdcharoen, T. Screening and discrimination of Hepatocellular carcinoma patients by testing exhaled breath with smart devices using composite polymer/carbon nanotube gas sensors. In Proceedings of the 2016 9th Biomedical Engineering International Conference (BMEiCON), Laung Prabang, Laos, 7–9 December 2016; pp. 1–5. [Google Scholar]
- Freddi, S.; Emelianov, A.V.; Bobrinetskiy, I.I.; Drera, G.; Pagliara, S.; Kopylova, D.S.; Chiesa, M.; Santini, G.; Mores, N.; Moscato, U.; et al. Development of a Sensing Array for Human Breath Analysis Based on SWCNT Layers Functionalized with Semiconductor Organic Molecules. Adv. Healthc. Mater. 2020, 9, 200037. [Google Scholar] [CrossRef]
- Drera, G.; Freddi, S.; Emelianov, A.V.; Bobrinetskiy, I.I.; Chiesa, M.; Zanotti, M.; Pagliara, S.; Fedorov, F.S.; Nasibulin, A.G.; Montuschi, P.; et al. Exploring the performances of a functionalized CNT-based sensor array for breathomics through clustering and classification algorithms: From gas sensing of selective biomarkers to discrimination of chronic obstructive pulmonary disease. RSC Adv. 2021, 11, 30270–30282. [Google Scholar] [CrossRef] [PubMed]
- Nardi-Agmon, I.; Abud-Hawa, M.; Liran, O.; Gai-Mor, N.; Ilouze, M.; Onn, A.; Bar, J.; Shlomi, D.; Haick, H.; Peled, N. Exhaled breath analysis for monitoring response to treatment in advanced lung cancer. J. Thorac. Oncol. 2016, 11, 827. [Google Scholar] [PubMed] [Green Version]
- Amal, H.; Leja, M.; Funka, K.; Skapars, R.; Sivins, A.; Ancans, G.; Liepniece-Karele, I.; Kikuste, I.; Lasina, I.; Haick, H. Detection of precancerous gastric lesions and gastric cancer through exhaled breath. Gut 2016, 65, 400. [Google Scholar] [CrossRef] [PubMed]
- Xu, Z.-Q.; Broza, Y.Y.; Ionsecu, R.; Tisch, U.; Ding, L.; Liu, H.; Song, Q.; Pan, Y.-Y.; Xiong, F.-X.; Gu, K.-S.; et al. A nanomaterial-based breath test for distinguishing gastric cancer from benign gastric conditions. Br. J. Cancer 2013, 108, 941–950. [Google Scholar] [CrossRef]
- Gruber, M.; Tisch, U.; Jeries, R.; Amal, H.; Hakim, M.; Ronen, O.; Marshak, T.; Zimmerman, D.; Israel, O.; Amiga, E.; et al. Analysis of exhaled breath for diagnosing head and neck squamous cell carcinoma: A feasibility study. Br. J. Cancer 2014, 111, 790–798. [Google Scholar]
- Tisch, U.; Schlesinger, I.; Ionescu, R.; Nassar, M.; Axelrod, N.; Robertman, D.; Tessler, Y.; Azar, F.; Marmur, A.; Aharon-Peretz, J.; et al. Detection of Alzheimer’s and Parkinson’s disease from exhaled breath using nanomaterial-based sensors. Nanomedicine 2013, 8, 43–56. [Google Scholar]
- Nakhleh, M.K.; Amal, H.; Jeries, R.; Broza, Y.Y.; Aboud, M.; Gharra, A.; Ivgi, H.; Khatib, S.; Badarneh, S.; Har-Shai, L.; et al. Diagnosis and Classification of 17 Diseases from 1404 Subjects via Pattern Analysis of Exhaled Molecules. ACS Nano 2016, 11, 112–125. [Google Scholar] [CrossRef]
- Polyakov, M.S.; Ivanova, V.N.; Basova, T.V.; Saraev, A.A.; Köksoy, B.; Şenocak, A.; Demirbaş, E.; Durmuş, M. 3D, covalent and noncovalent hybrid materials based on 3-phenylcoumarin derivatives and single walled carbon nanotubes as gas sensing layers. Appl. Surf. Sci. 2020, 504, 144276. [Google Scholar] [CrossRef]
- Polyakov, M.S.; Basova, T.V.; Göksel, M.; Şenocak, A.; Demirbaş, E.; Durmuş, M.; Kadem, B.; Hassan, A. Effect of covalent and non-covalent linking of zinc (II) phthalocyanine functionalised carbon nanomaterials on the sensor response to ammonia. Synth. Met. 2017, 227, 78–86. [Google Scholar] [CrossRef]
- Zhou, Y.; Fang, Y.; Ramasamy, R.P. Non-covalent functionalization of carbon nanotubes for electrochemical biosensor development. Sensors 2019, 19, 392. [Google Scholar] [CrossRef]
- Herbig, J.; Titzmann, T.; Beauchamp, J.; Kohl, I.; Hansel, A. Buffered end-tidal (BET) sampling—A novel method for real-time breath-gas analysis. J. Breath Res. 2008, 2, 037008. [Google Scholar] [CrossRef]
- Miekisch, W.; Schubert, J.K.; Noeldge-Schomburg, G.F. Diagnostic potential of breath analysis-focus on volatile organic compounds. Clin. Chim. Acta 2004, 347, 25–39. [Google Scholar] [CrossRef] [PubMed]
- Lawal, O.; Ahmed, W.M.; Nijsen, T.M.; Goodacre, R.; Fowler, S.J. Exhaled breath analysis: A review of ‘breath-taking’methods for off-line analysis. Metabolomics 2017, 13, 110. [Google Scholar] [CrossRef] [PubMed]
- Guo, L.; Wang, C.; Chi, C.; Wang, X.; Liu, S.; Zhao, W.; Ke, C.; Xu, G.; Li, E. Exhaled breath volatile biomarker analysis for thyroid cancer. Transl. Res. 2015, 166, 188–195. [Google Scholar] [CrossRef]
- Miekisch, W.; Hengstenberg, A.; Kischkel, S.; Beckmann, U.; Mieth, M.; Schubert, J.K. Construction and evaluation of a versatile Co2 controlled breath collection device. IEEE Sens. J. 2010, 10, 211–215. [Google Scholar] [CrossRef]
- Miekisch, W.; Kischkel, S.; Sawacki, A.; Liebau, T.; Mieth, M.; Schubert, J.K. Impact of sampling procedures on the results of breath analysis. J. Breath Res. 2008, 2, 026007. [Google Scholar] [CrossRef]
- Berna, A.Z.; Schaber, C.L.; Bollinger, L.B.; Mwale, M.; Mlotha-Mitole, R.; Trehan, I.; John, A.R.O. Comparison of breath sampling methods: A post hoc analysis from observational cohort studies. Analyst 2019, 144, 2026–2033. [Google Scholar] [CrossRef]
- Montuschi, P.; Mores, N.; Trove, A.; Mondino, C.; Barnes, P.J. The electronic nose in respiratory medicine. Respiration 2013, 85, 72–84. [Google Scholar] [CrossRef] [PubMed]
- Beauchamp, J.; Herbig, J.; Gutmann, R.; Hansel, A. On the use of Tedlar (R) bags for breath-gas sampling and analysis. J. Breath Res. 2008, 2, 046001. [Google Scholar] [CrossRef]
- Mochalski, P.; Wzorek, B.; Sliwka, I.; Amann, A. Improved pre-concentration and detection methods for volatile sulphur breath constituents. J. Chromatogr. B 2009, 877, 1856–1866. [Google Scholar] [CrossRef] [PubMed]
- Gashimova, E.; Temerdashev, A.; Porkhanov, V.; Polyakov, I.; Perunov, D.; Azaryan, A.; Dmitrieva, E. Investigation of different approaches for exhaled breath and tumor tissue analyses to identify lung cancer biomarkers. Heliyon 2020, 6, e04224. [Google Scholar]
- Cordella, C.B.Y. PCA: The basic building block of chemometrics. Anal. Chem. 2012, 47, 1–46. [Google Scholar]
- Bro, R.; Smilde, A.K. Principal component analysis. Anal. Methods 2014, 6, 2812. [Google Scholar]
- Burges, C. A tutorial on support vector machines for pattern recognition. In Data Mining and Knowledge Discovery; Kluwer Academic Publishers: Boston, MA, USA, 1998; Volume 2. [Google Scholar]
- Ramos, S.D.S.; Liow, S.R. Discriminant function analysis. In The Encyclopedia of Applied Linguistics; Wiley-Blackwell: Hoboken, NJ, USA, 2020. [Google Scholar]
- Büyüköztürk, S.; Çokluk-Bökeoğlu, Ö. Discriminant function analysis: Concept and application. Eurasian J. Educ. Res. 2008, 33, 73–92. [Google Scholar]
- Reimann, P.; Schütze, A. Sensor arrays, virtual multisensors, data fusion, and gas sensor data evaluation. In Gas Sensing Fundamentals; Springer: Berlin/Heidelberg, Germany, 2013; pp. 67–107. [Google Scholar]
- Zanotti, M. A neural network analysis of a dataset obtained through a carbon nanotube sensors array for breathomics applications. Nuovo Cim. 2022, 45, 87. [Google Scholar] [CrossRef]
- Liao, Y.H.; Shih, C.H.; Abbod, M.F.; Shieh, J.S.; Hsiao, Y.J. Development of an E-nose system using machine learning methods to predict ventilator-associated pneumonia. Microsyst. Technol. 2020, 28, 341–351. [Google Scholar]
- Van Hooren, M.R.; Leunis, N.; Brandsma, D.S.; Dingemans, A.M.C.; Kremer, B.; Kross, K.W. Differentiating head and neck carcinoma from lung carcinoma with an electronic nose: A proof of concept study. Eur. Arch. Oto-Rhino-Laryngol. 2016, 273, 3897–3903. [Google Scholar]
- Wang, D.; Yu, K.; Wang, Y.; Hu, Y.; Zhao, C.; Wang, L.; Ying, K.; Wang, P. A hybrid electronic nose’s system based on MOS-SAW detection units intended for lung cancer diagnosis. J. Innov. Opt. Health Sci. 2012, 5, 1150006. [Google Scholar] [CrossRef]
- Van der Sar, I.G.; Wijbenga, N.; Nakshbandi, G.; Aerts, J.G.J.V.; Manintveld, O.C.; Wijsenbeek, M.S.; Hellemons, M.E.; Moor, C.C. The smell of lung disease: A review of the current status of electronic nose technology. Respir. Res. 2021, 22, 246. [Google Scholar]
- Farraia, M.V.; Rufo, J.C.; Paciência, I.; Mendes, F.; Delgado, L.; Moreira, A. The electronic nose technology in clinical diagnosis: A systematic review. Porto Biomed. J. 2019, 4, e42. [Google Scholar] [CrossRef]
- Freddi, S. Development of nanostructured carbon-based platforms for advanced gas sensing. Ph.D. Thesis, Università Cattolica del Sacro Cuore, Milan, Italy; KU Leuven: Leuven, Belgium, 13 April 2022. [Google Scholar]
- Reinhold, P.; Knobloch, H. Exhaled Breath Condensate: Lessons Learned from Veterinary Medicine. J. Breath Res. 2010, 4, 017001. [Google Scholar] [CrossRef] [PubMed]
- Wilson, A.D. Application of electronic-nose technologies and VOC-biomarkers for the noninvasive early diagnosis of gastrointestinal diseases. Sensors 2018, 18, 2613. [Google Scholar] [CrossRef] [PubMed]
- Portegies, M.L.; Lahousse, L.; Joos, G.F.; Hofman, A.; Koudstaal, P.J.; Stricker, B.H.; Brusselle, G.G.; Ikram, M.A. Chronic obstructive pulmonary disease and the risk of stroke: The Rotterdam study. Am. J. Respir. Crit. Care Med. 2016, 193, 251–258. [Google Scholar] [CrossRef] [PubMed]
- Hashemi, S.Y.; Momenabadi, V.; Faramarzi, A.; Kiani, A. Trends in burden of chronic obstructive pulmonary disease in Iran, 1995–2015: Findings from the global burden of disease study. Arch. Public Health 2020, 78, 45. [Google Scholar] [CrossRef] [PubMed]


| Online/Offline Measurements with e-Nose | Type of Breath | Bag/Container | Reference |
|---|---|---|---|
| Online | Alveolar | - | [49] |
| Offline | Alveolar | Mylar | [50] |
| Offline | Total | Glass vials | [51] |
| Online | Total | PTFE | [52] |
| Online | Total | PTFE | [53] |
| Offline | Alveolar | Mylar | [54] |
| Offline | Alveolar | GaSample | [55] |
| Offline | Alveolar | Tedlar | [56] |
| Offline | Alveolar | Mylar | [57] |
| Offline | Alveolar | Mylar | [58] |
| Offline | Alveolar | Mylar | [59] |
| Reference | Class | Gender (M:F) | Average Age | Smoker |
|---|---|---|---|---|
| [50] | Sick | 13:21 | N.A. | 41% |
| Healthy control | 6:11 | N.A. | 41% | |
| [51] | Sick | 5:0 | 60–69 | N.A. |
| Healthy | 5:0 | 35–60 | N.A. | |
| [52] | Sick | 7:5 | 71 ± 6 | 83% |
| Healthy | 5:4 | 45 ± 15 | 12% | |
| [53] | Sick | 2:5 | 65 ± 17 | 29% * |
| Healthy | 2:2 | 34 ± 12 | 0% * | |
| [54] | LC | 31:8 | 62 ± 11 | 18% |
| [55] | OLGIM | 102:223 | 59 ± 14 | 14% |
| PUD | 34:19 | 53 ± 15 | 45% | |
| GC | 77:22 | 63 ± 13 | 29% | |
| Dysplasia | 4:3 | 73 ± 8 | 14% | |
| [56] | GC | 28:9 | 58 ± 9 | 41% |
| Non-malignant condition | 23:9 | 51 ± 14 | 44% | |
| Less severe condition | 30:31 | 51 ± 9 | 21% | |
| [57] | HNSCC | 19:3 | 62 ± 12 | 59% |
| Benign tumour | 14:7 | 55 ± 14 | 57% | |
| Healthy | 6:14 | 50 ± 12 | 25% | |
| [58] | AD | 7:8 | 68 ± 10 | N.A. |
| PD | 17:13 | 62 ± 10 | N.A. | |
| Healthy | 5:7 | 61 ± 7 | N.A. | |
| [59] | LC | 23:22 | 67 ± 9 | 98% |
| LC-control | 12:11 | 56 ± 14 | 52% | |
| CRC | 42:29 | 66 ± 10 | 11% | |
| CRC-control | 67:22 | 60 ± 14 | 13% | |
| HNC | 19:3 | 62 ± 12 | 59% | |
| HNC-control | 6:13 | 50 ± 12 | 25% | |
| OC | 0:48 | 51 ± 11 | 0% | |
| OC-control | 0:48 | 47 ± 9 | 0% | |
| BC | 68:5 | 69 ± 11 | 68% | |
| PC | 11:0 | 66 ± 8 | 45% | |
| PC-control | 31:4 | 66 ± 12 | 71% | |
| KC | 22:11 | 65 ± 13 | 45% | |
| GC | 57:42 | 63 ± 12 | 27% | |
| GC-control | 55:100 | 57 ± 15 | 15% | |
| CD | 23:18 | 38 ± 12 | 50% | |
| UC | 20:17 | 41 ± 16 | 43% | |
| UC-control | 28:16 | 41 ± 2 | 15% | |
| IBS | 8:19 | 38 ± 13 | 30% | |
| IPD | 23:21 | 65 ± 14 | 15% | |
| PDISM | 7:9 | 67 ± 8 | 35% | |
| PDISM-control | 19:18 | 62 ± 12 | 24% | |
| MS | 42:76 | 38 ± 10 | 32% | |
| MS-control | 17:27 | 39 ± 11 | 34% | |
| PAH | 6:16 | 48 ± 12 | 54% | |
| PAH-control | 10:13 | 38 ± 8 | 43% | |
| PET | 0:24 | 30 ± 6 | 0% | |
| PET-control | 0:47 | 29 ± 4 | 0% | |
| CKD | 52:30 | 65 ± 12 | 64% | |
| CKD-control | 12:15 | 46 ± 2 | 40% |
| # and Type of Sensor | # and Type of Biomarkers | Target Disease | Type of Data Analysis | Reference |
|---|---|---|---|---|
| 5: Metal/metal oxide NPs decoreated SWCNTs | 9: Ammonia, nitrogen dioxide, acetone, ethanol, 2-propanol, benzene, sodium hypochlorite, hydrogen sulfide, water | - | PCA | [34] |
| 6: SPEEK nanocomposites based on hybrid nanocarbons | 7: Ethanol, methanol, propanol, acetone, butanone, toluene, and benzene | Lung cancer | PCA | [35] |
| 3: COOH-MWCNT functionalized with POSS | 9: Acetone, butanone, propanol, ethanol, toluene, cyclohexane, pentene, methanol, water | Lung cancer, Diabetes, Malignant pleural mesothelioma | PCA | [36] |
| 4: Metal NPs decorated CNTs | 4: NH3, Ethanol, CO, CO2 | - | PCA | [37] |
| 10: SWCNTs−Metalloporphyrin | 15: Pentane, Hexane, cyclohexane, acetone, MEK, 3-pentanone, methanol, ethanol, isopropanol, p-exylene, mephedrone, PhH, butylamine, DIPA, TEA | - | PCA | [38] |
| 6: Surfactant-CNTs | 6: Water, methanol, ethanol, toluene, acetone, chloroform | Lung cancer | PCA | [39] |
| 6: CNTs conductive polymer nanocomposites | 18: Water, ethanol, methanol, acetone, propanol, isopropanol, 2-butanone, chloroform, toluene, benzene, styrene, cyclohexane, o-xylene, n-pentane, n-decane, 1,2,4-trimethyl benzene, isoprene, (2-methyl-1,3-butadiene), 1-hexene | Lung cancer | PCA | [40] |
| 6: Polymer coated CNTs | 9: Chloroform, buthanol, THF, DCM, Acetone, isopropanol, toluene, water, ethanol | Lung cancer | PCA | [41] |
| 5: CNTs conductive polymer nanocomposites | 9: Dichloromethane, heptane, isopropanol, methanol, tetrahydrofuran, ethanol, toluene, cyclohexane, water | Lung cancer | PCA | [42] |
| 8: Organic functionalized MWCNTs | 20: Dodecane, octane, decane, trimethyl benzene, xylanes, toluene, benzene, chlorobenzene, dichloromethane, dihexyl ether, dibutyl ether, 2-decadone, cyclohexanone, methylethyl ketone, 1-octanol, 1-pentol, 1-butanol, ethanol | - | PCA | [43] |
| 8: Polycyclic Aromatic Hydrocarbons/SWCNT | 3: octane, ethyl benzene, ethanol | - | DFA | [44] |
| 4: CNT/hexa-peri-hexabenzocoronene bilayers | 5: Decane, octane, hexane, ethanol, water | Cancer | PCA | [45] |
| 4: Metal NPs decorated CNTs | 4: Benzene, ethylene, CO, NO2 | - | LDA | [46] |
| # and Type of Sensor | Target Disease | Type of Data Analysis | # of Patients | Reference |
|---|---|---|---|---|
| 4: Bilayers of polycyclic aromatic hydrocarbons and SWCNT | Multiple sclerosis | DFA | 51 17 healthy + 34 sick | [50] |
| 8: Polymer/SWCNTs composite | Liver Cancer | PCA | 10 5 healthy + 5 sick | [51] |
| 8: SWCNTs-organic semiconductor layers | COPD | PCA/SVM | 21 9 healthy + 12 sick | [52] |
| 8: SWCNTs-organic semiconductor layers | COPD | PCA/SVM/LDA | 50 30 sick + 20 healthy | [53] |
| # of Sensors | Target Disease | # of Patients | Reference |
|---|---|---|---|
| 40: composition N.A. | Lung cancer | 39, all sick | [54] |
| 8: 6 Au NPs + 2 CNTs | Precancerous gastric lesion, peptic ulcers (PUD) and gastric cancer (GC) | 484, all sick (325 precancerous lesion, 53 PUD, 99 GC, 7 dysplasia) | [55] |
| 14: 10 Au NPs + 4 CNTs | Gastric cancer and benign gastric condition | 130, all sick (37 cancer, 32 non-malignant gastric condition, 61 less severe condition) | [56] |
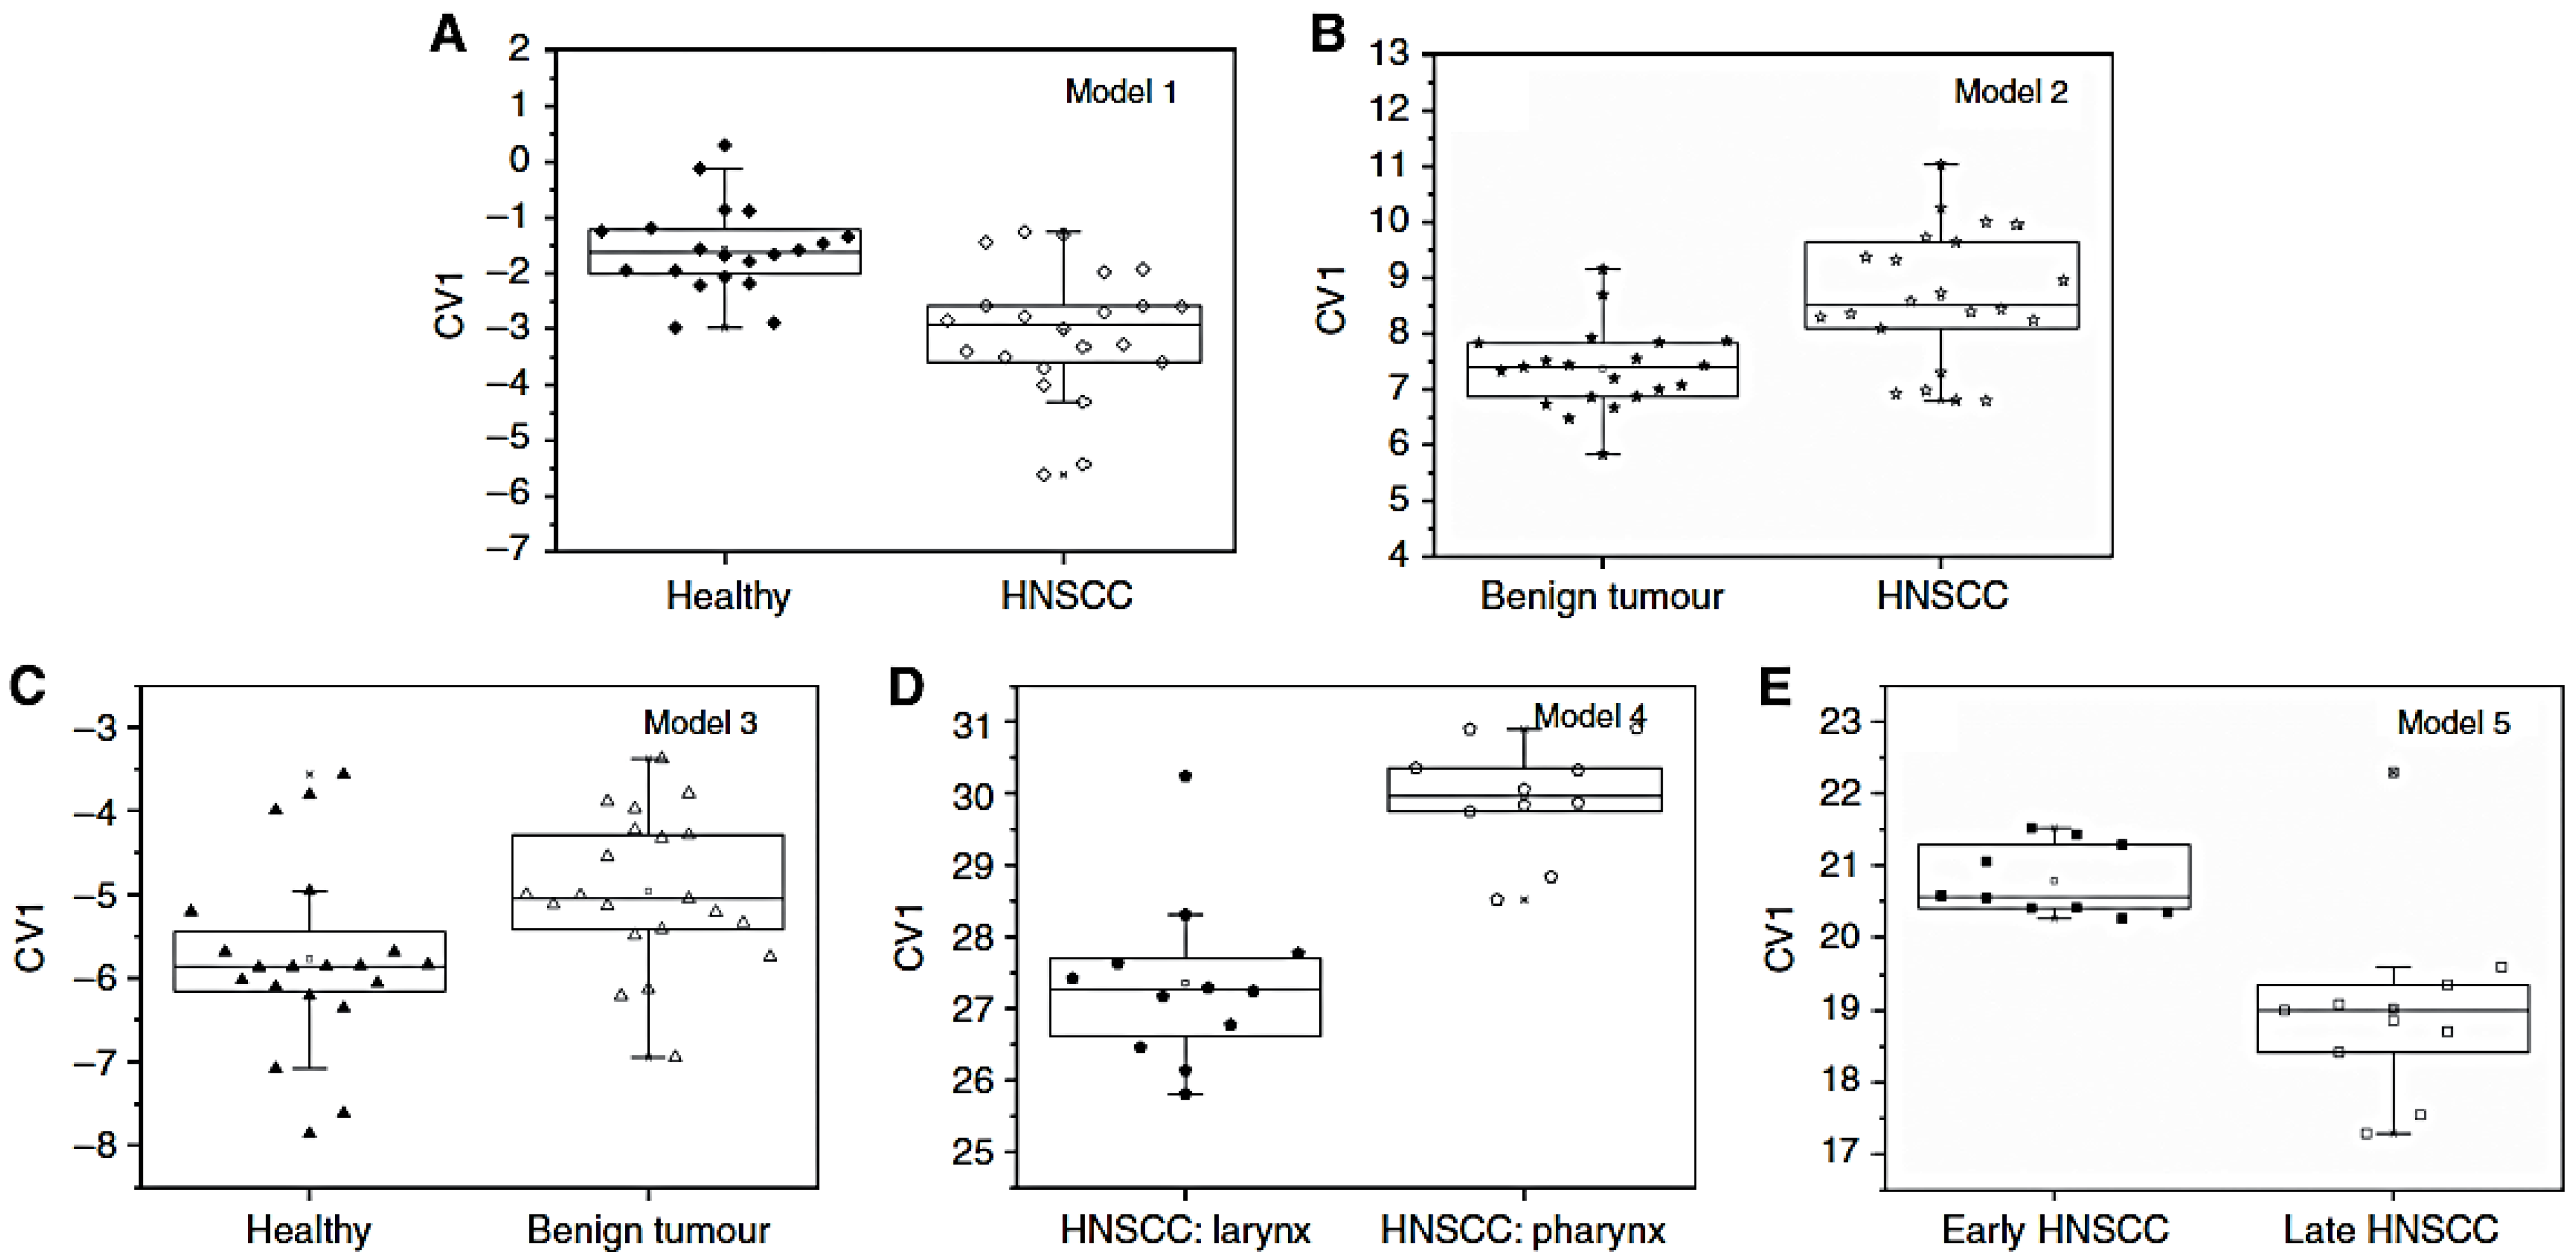
| 6: 5 Au NPs + 1 CNTs | Head and Neck squamous cell carcinoma (HNSCC) | 62, sick and healthy (22 HNSCC, 21 benign tumours, 19 healthy) | [57] |
| 8: 6 Au NPs + 2 CNTs | Alzheimer’s (AD) and Parkinson’s (PD) disease | 57, sick and healthy (15 AD, 30 PD, 12 healthy) | [58] |
| 20: 17 Au NPs + 3 CNTs | Lung cancer (LC), colorectal cancer (CRC), head and neck cancer (HNC), ovarian cancer (OC), bladder cancer (BC), prostate cancer (PC), kidney cancer (KC), gastric cancer (GC), Crohn’s disease (CD), ulcerative colitis (UC), irritable bowel syndrome (IBS), idiopathic Parkinson’s (IPD), atypical Parkinsonism (PDISM), multiple sclerosis (MS), pulmonary arterial hypertension (PAH), pre-eclampsia (PET), chronic kidney disease (CKD), healthy | 1404, sick and healthy (45 LC, 71 CRC, 22 HCN, 48 OC, 73 BC, 11 PC, 33 KC, 99 GC, 41 CD, 37 UC, 27 IBS, 44 IPD, 16 PIDSM, 118 MS, 22 PAH, 24 PET, 82 CKD, 591 healthy | [59] |
Publisher’s Note: MDPI stays neutral with regard to jurisdictional claims in published maps and institutional affiliations. |
© 2022 by the authors. Licensee MDPI, Basel, Switzerland. This article is an open access article distributed under the terms and conditions of the Creative Commons Attribution (CC BY) license (https://creativecommons.org/licenses/by/4.0/).
Share and Cite
Freddi, S.; Sangaletti, L. Trends in the Development of Electronic Noses Based on Carbon Nanotubes Chemiresistors for Breathomics. Nanomaterials 2022, 12, 2992. https://doi.org/10.3390/nano12172992
Freddi S, Sangaletti L. Trends in the Development of Electronic Noses Based on Carbon Nanotubes Chemiresistors for Breathomics. Nanomaterials. 2022; 12(17):2992. https://doi.org/10.3390/nano12172992
Chicago/Turabian StyleFreddi, Sonia, and Luigi Sangaletti. 2022. "Trends in the Development of Electronic Noses Based on Carbon Nanotubes Chemiresistors for Breathomics" Nanomaterials 12, no. 17: 2992. https://doi.org/10.3390/nano12172992