Article

Copper-Modified Titania-Based Photocatalysts for the Efficient Hydrogen Production under UV and Visible Light from Aqueous Solutions of Glycerol

by
Anna Yu. Kurenkova
1,
Anastasiya Yu. Yakovleva
1,2,
Andrey A. Saraev
1,
Evgeny Yu. Gerasimov
1,
Ekaterina A. Kozlova
1,* and
Vasily V. Kaichev
1
1
Federal Research Center, Boreskov Institute of Catalysis SB RAS, Lavrentieva Ave. 5, 630090 Novosibirsk, Russia
2
Department of Natural Science, Novosibirsk State University, Pirogova St. 1, 630090 Novosibirsk, Russia
*
Author to whom correspondence should be addressed.
Nanomaterials 2022, 12(18), 3106; https://doi.org/10.3390/nano12183106
Submission received: 9 August 2022 / Revised: 2 September 2022 / Accepted: 3 September 2022 / Published: 7 September 2022
(This article belongs to the Special Issue Synthesis of Nanocomposites and Catalysis Applications II)

Abstract

:
In this study, we have proposed titania-based photocatalysts modified with copper compounds for hydrogen evolution. Thermal pre-treatment of commercial TiO2 Degussa P25 (DTiO2) and Hombifine N (HTiO2) in the range from 600 to 800 °C was carried out followed by the deposition of copper oxides (1–10 wt. % of Cu). The morphology and chemical state of synthesized photocatalysts were studied using X-ray diffraction, UV–Vis diffuse reflectance spectroscopy, high-resolution transmission electron microscopy, X-ray photoelectron spectroscopy, and XANES/EXAFS X-ray absorption spectroscopy. Photocatalytic activity was tested in the hydrogen evolution from aqueous solutions of glycerol under ultraviolet (λ = 381 nm) and visible (λ = 427 nm) light. The photocatalysts 2% CuOx/DTiO2 T750 and 5% CuOx/DTiO2 T700 showed the highest activity under UV irradiation (λ = 380 nm), with the rate of H2 evolution at the level of 2.5 mmol (H2) g−1 h−1. Under the visible light irradiation (λ = 427 nm), the highest activity of 0.6 mmol (H2) g−1 h−1 was achieved with the 5% CuOx/DTiO2 T700 photocatalyst. The activity of these photocatalysts is 50% higher than that of the platinized 1% Pt/DTiO2 sample. Thus, it was shown for the first time that a simple heat treatment of a commercial titanium dioxide in combination with a deposition of non-noble metal particles led to a significant increase in the activity of photocatalysts and made it possible to obtain materials that were active in hydrogen production under visible light irradiation.

1. Introduction

The use of hydrogen as an energy source makes it possible to solve many problems associated with environmental pollution. Currently, there are various industrial methods for producing hydrogen, such as steam reforming of natural gas, coal gasification, biomass processing, etc. [1]. Unfortunately, as a rule, these methods are energy-consuming and can be cost-effective only for large-scale production. Therefore, one of the promising methods of hydrogen production is the use of renewable energy sources, in particular its photocatalytic synthesis under the action of solar radiation. The photocatalytic production of hydrogen is also of interest because hydrogen can be produced from inexpensive raw materials: water and many organic compounds, e.g., ethanol, methanol, glycerol, sugars, or carboxylic acids [2].
The photocatalytic splitting of water using semiconductors as a photocatalyst was first described in 1972 [3], and this initiated the worldwide development of photocatalytic hydrogen production. However, photocatalytic water splitting is accompanied by the recombination of photogenerated charge carriers, which reduces the quantum efficiency of the process. An addition of various compounds as electron donors can hinder the recombination of electron–hole pairs formed in the photocatalytic process and makes it possible to obtain hydrogen without admixture of oxygen [4,5]. In addition, the use of organic compounds as the sacrificial agent is attractive from a practical point of view. Indeed, along with hydrogen production, it helps to solve important environmental problems associated with water purification from various organic pollutants [6,7,8,9]. Among the various organic substances used to produce hydrogen, glycerol is of particular interest [10]. Indeed, since glycerol is a by-product of the synthesis of biodiesel from vegetable oils, the growing production of biodiesel will induce an increase in the production of glycerol as well. Thus, the use of glycerol as an electron donor in photocatalytic systems can help reduce the cost of hydrogen production [11,12].
The most common photocatalysts are semiconductors capable of absorbing light in the ultraviolet and visible regions. There are a number of different materials that can be used as the basis for photocatalysts for hydrogen production, and one of them is titanium dioxide [13,14,15,16,17]. This compound attracts special attention due to its stability under the action of light, availability, nontoxicity, and relatively low cost [5]. The band gap of TiO2 is 3.2 eV for the anatase phase and 3.0 eV for the rutile phase; therefore, TiO2 is photocatalytically active only under UV irradiation. Since UV radiation in sunlight constitutes only a small part (about 5%), it is necessary to increase the activity of TiO2 under visible light [18]. A common method here is to reduce the band gap. It can be achieved via several approaches, for example, by calcination of TiO2 at high temperatures and doping it with metals [19,20,21,22,23,24]. As a dopant, copper has attracted attention due to its high electron work function, which greatly improves the separation efficiency of photogenerated electrons and holes [25,26,27]. Copper oxides are promising cocatalysts in the processes under visible light irradiation, since both CuO and Cu2O have a narrow band gap and absorb light in the visible region [27,28].
The purpose of this work was to develop a method for the synthesis of photocatalysts based on TiO2 and copper compounds for the photocatalytic production of hydrogen under UV and visible irradiation. Photocatalysts with the composition of CuOx/TiO2 (Degussa P25) and CuOx/TiO2 (Hombifine N) were synthesized by the deposition of a cocatalyst on the surface of TiO2, which was preliminarily calcined at different temperatures. The catalysts were tested in the photocatalytic production of hydrogen from aqueous solutions of glycerol. The effects of calcination temperature and cocatalyst deposition on the activity in the target process were determined.

2. Materials and Methods

2.1. Reagents

The CuOx/TiO2 catalysts were synthesized using the following reagents: Cu(NO3)2·3H2O (Acros Organics, 98%+, Geel, Belgium), H2PtCl6·6H2O (Aurat, Pt 37.8%+, Moscow, Russia), NaBH4 (Acros Organics, 98%+, Geel, Belgium), Na2S (Acros Organics, 60%+, Geel, Belgium), TiO2 Degussa (Evonik) P25 (Evonik Industries, Essen, Germany), and TiO2 Hombifine N (Sachtleben Chemie, Duisburg, Germany). Photocatalytic experiments were carried out using analytical-grade glycerol (Reakhim, Moscow, Russia).

2.2. Pretreatment of TiO2 Samples

The TiO2 samples were obtained using titanium dioxides of commercial grades, Degussa P25 and Hombifine N. For calcination, 500 mg of TiO2 was placed in a crucible and kept in a muffle furnace at a constant temperature (600–850 °C in increments of 50 °C) for 3 h.

2.3. Synthesis of Photocatalysts CuOx/TiO2 and Pt/TiO2

To obtain the photocatalysts with 1, 2, 5, and 10 wt. % of copper, TiO2 samples (495, 490, 475, and 450 mg, respectively) were impregnated with a proper amount of 0.1 M solution of Cu(NO3)2 under constant stirring for 40 min, and then an excess of a fresh 0.1 mol solution of NaBH4 was added and stirred for 1 h. The resulting suspension was washed and centrifuged 5 times and then dried in air at 50 °C for 5 h. To prepare a 1 wt. % Pt/TiO2 sample, a TiO2 sample (495 mg) was impregnated with a 0.2 M solution of H2PtCl6 and then reduced with NaBH4 and then washed and dried in the same way as for photocatalysts with deposited copper.
In the case of using Hombifine N, the synthesized samples contained 1 wt. % and 5 wt. % Cu. In the case of using Degussa P25, the samples contained 1, 2, and 5 wt. % Cu. The obtained photocatalysts were labeled as y% CuOx/DTiO2 T or y% CuOx/HTiO2 T, where y corresponds to the weight content of copper, and T is the temperature of TiO2 calcination, DTiO2 denotes TiO2 Degussa P25, and HTiO2 denotes TiO2 Hombifine N. For example, the label 5% CuOx/DTiO2 T700 denotes a TiO2 Degussa P25 sample calcined at 700 °C and modified with copper with a calculated content of 5 wt. %. We decided to indicate the mass percentage of copper, because it was difficult to determine the stoichiometric composition of CuOx and accordingly calculate the content of copper oxide.

2.4. Sample Testing Methods

2.4.1. Physical Methods

The synthesized samples were characterized by X-ray diffraction (XRD), low-temperature nitrogen adsorption, diffuse reflectance spectroscopy (DRS), X-ray photoelectron spectroscopy (XPS), high-resolution transmission electron microscopy (HR TEM), and XANES/EXAFS X-ray absorption spectroscopy.
The phase composition of the photocatalysts was determined by XRD with a Bruker D8 Advance diffractometer (Bruker AXS GmbH, Ettlingen, Germany) using monochromatized Cu Kα radiation with a wavelength of 1.5418 Å. The crystal size (CS) was estimated as the coherent scattering domain size using the Scherrer formula. The specific surface area (SSA) and pore volume of the catalysts were obtained by low-temperature N2 adsorption–desorption (N2 adsorption at 77 K) using an ASAP 2400 apparatus (ASAP Industries Manufacturing, Houma, LA, USA). Their optical properties were studied by the DRS method. Diffuse reflection spectra in UV and visible regions were obtained using a Shimadzu UV-2501 PC spectrophotometer (Shimadzu, Kyoto, Japan) with an ISR-240A diffuse reflection attachment.
The chemical composition of the catalyst surface was studied by XPS with a photoelectron spectrometer (SPECS Surface Nano Analysis GmbH, Berlin, Germany) using non-monochromatized Al Kα radiation (hυ = 1486.6 eV). The spectrometer was equipped with a PHOIBOS-150 hemispherical analyzer (SPECS Surface Nano Analysis GmbH, Berlin, Germany) and an XR-50 X-ray source with a double Al/Mg anode. The charging effect was corrected using the binding energy of the Ti2p3/2 peak at 459.0 eV.
The chemical state of copper in the bulk of the catalysts was studied using XANES X-ray absorption spectroscopy at the station of the Kurchatov Synchrotron Radiation Source (Moscow, Russia). The electron energy in the storage ring was 2.5 GeV at a beam current of 50–150 mA. To monochromatize synchrotron radiation, we used a silicon single crystal with (111) orientation in the form of a cut-out monoblock mounted on a goniometric head. The energy resolution achieved was ΔE/E = 2 × 10⁻⁴. The X-ray absorption spectra of the catalysts were obtained in fluorescence geometry (a sample with 20% Cu was tested in the transmission mode). The X-ray beam intensity before and after passing through the sample was measured using ionization chambers equipped with Keithley 6487 digital picoammeters.
The microstructure of the photocatalysts was studied by HRTEM using a ThemisZ electron microscope (Thermo Fisher Scientific, Waltham, MA, USA) at an accelerating voltage of 200 kV. The microscope was equipped with a SuperX energy-dispersive spectrometer and a spherical aberration corrector. The maximum resolution of the microscope was 0.06 nm. For the HR TEM analysis, the samples were ultrasonically dispersed onto perforated carbon substrates attached to aluminum grids.

2.4.2. Catalytic Tests

The photocatalytic activity of synthesized samples was determined using the setup shown in Figure 1. The setup consisted of a glass reactor with a quartz window (Swindow = 22 cm2), an LED source of irradiation, and a magnetic stirrer.
The reaction mixture consisted of a photocatalyst (50 mg) and a 2.8% aqueous solution of glycerol. The total volume of the suspension was 100 mL. Before the experiment, the reaction mixture was purged with Ar for 15 min to remove atmospheric oxygen. After the purge, either an LED-381 nm (for UV irradiation) or an LED-427 nm (for visible light irradiation) was turned on (Figure 1). Under irradiation of the photocatalyst, the reaction mixture evolved hydrogen. During the experiment, the gas phase (250 μL) was sampled with a gas syringe (Hamilton) every 15 min. The experiment lasted from 90 to 150 min, depending on the photocatalyst activity. The amount of hydrogen was determined using a Chromos GC-1000 chromatograph (Chromos, Moscow, Russia) with a thermal conductivity detector and with Ar as the carrier gas.

3. Results and Discussion

3.1. Physical Methods

3.1.1. XRD and BET Methods

The changes in the structure of TiO2 during its calcination were studied by XRD. The X-ray diffraction patterns of the photocatalysts CuOx/HTiO2 with copper contents of 1 and 5 wt. % calcined at temperatures from 600 to 750 °C are shown in Figure 2a. As can be seen, the patterns show only peaks due to the anatase phase with the addition of low-intensity peaks due to copper and copper oxides. Since there are no rutile peaks, it can be concluded that Hombifine N does not undergo any phase transformation at these calcination temperatures.
In contrast, the calcination of Degussa P25 leads to the phase transition of anatase to rutile. As seen from Table 1 and Figure 2b, the calcination of Degussa P25 at temperatures from 600 to 750 °C leads to an increase in the rutile content, and starting from 800 °C, the sample contains only the rutile phase. The textural characteristics of the Degussa P25 samples were determined using low-temperature nitrogen adsorption. As seen from Table 1, the specific surface area and pore volume of the uncalcined TiO2 sample and the sample calcined at 600 °C practically coincide, whereas the calcination at 700 °C or 800 °C leads to a significant decrease in the specific surface area and pore volume. Thus, the calcination of the commercial titanium dioxides at temperatures up to 600 °C does not change the textural characteristics and phase composition of the samples.
The XRD data imply that the thermal treatment of the photocatalysts based on Hombifine N could not lead to an increase in their photocatalytic activity (see below). The samples based on Degussa P25 were characterized in more detail.

3.1.2. UV–Vis Spectroscopy

The optical properties of uncalcined Degussa P25 and Degussa P25 calcined at temperatures from 650 to 750 °C were studied by DRS. It is found that the calcination of this TiO2 shifts the absorption edge to the longer waves due to an increase in the content of rutile (Figure 3a), which is consistent with the XRD data.
To determine the band gap, the absorption spectra were plotted in the Tauc coordinates (Figure 3b). First, the adsorption coefficient F(R) was found from the DRS data according to the Kubelka–Munk Equation (1):
F R = 1 R 2 2 R ,
where R is the reflection coefficient of the sample. Then, the absorption curves were plotted in the Tauc coordinates for allowed indirect transitions. According to the calculated data, the calcination leads to a decrease in the band gap from 3.14 eV (for the uncalcined sample) to ca. 3.0 eV for the samples calcined at temperatures from 650 to 750 °C.
In addition, the DRS method was used to study the samples with deposited cocatalysts. As seen from Figure 3c, the addition of cocatalysts also enhances the absorption in the visible region. In the case of Cu-containing catalysts, this effect is a result of the formation of copper oxides [29] (see the XPS and XANES results below).

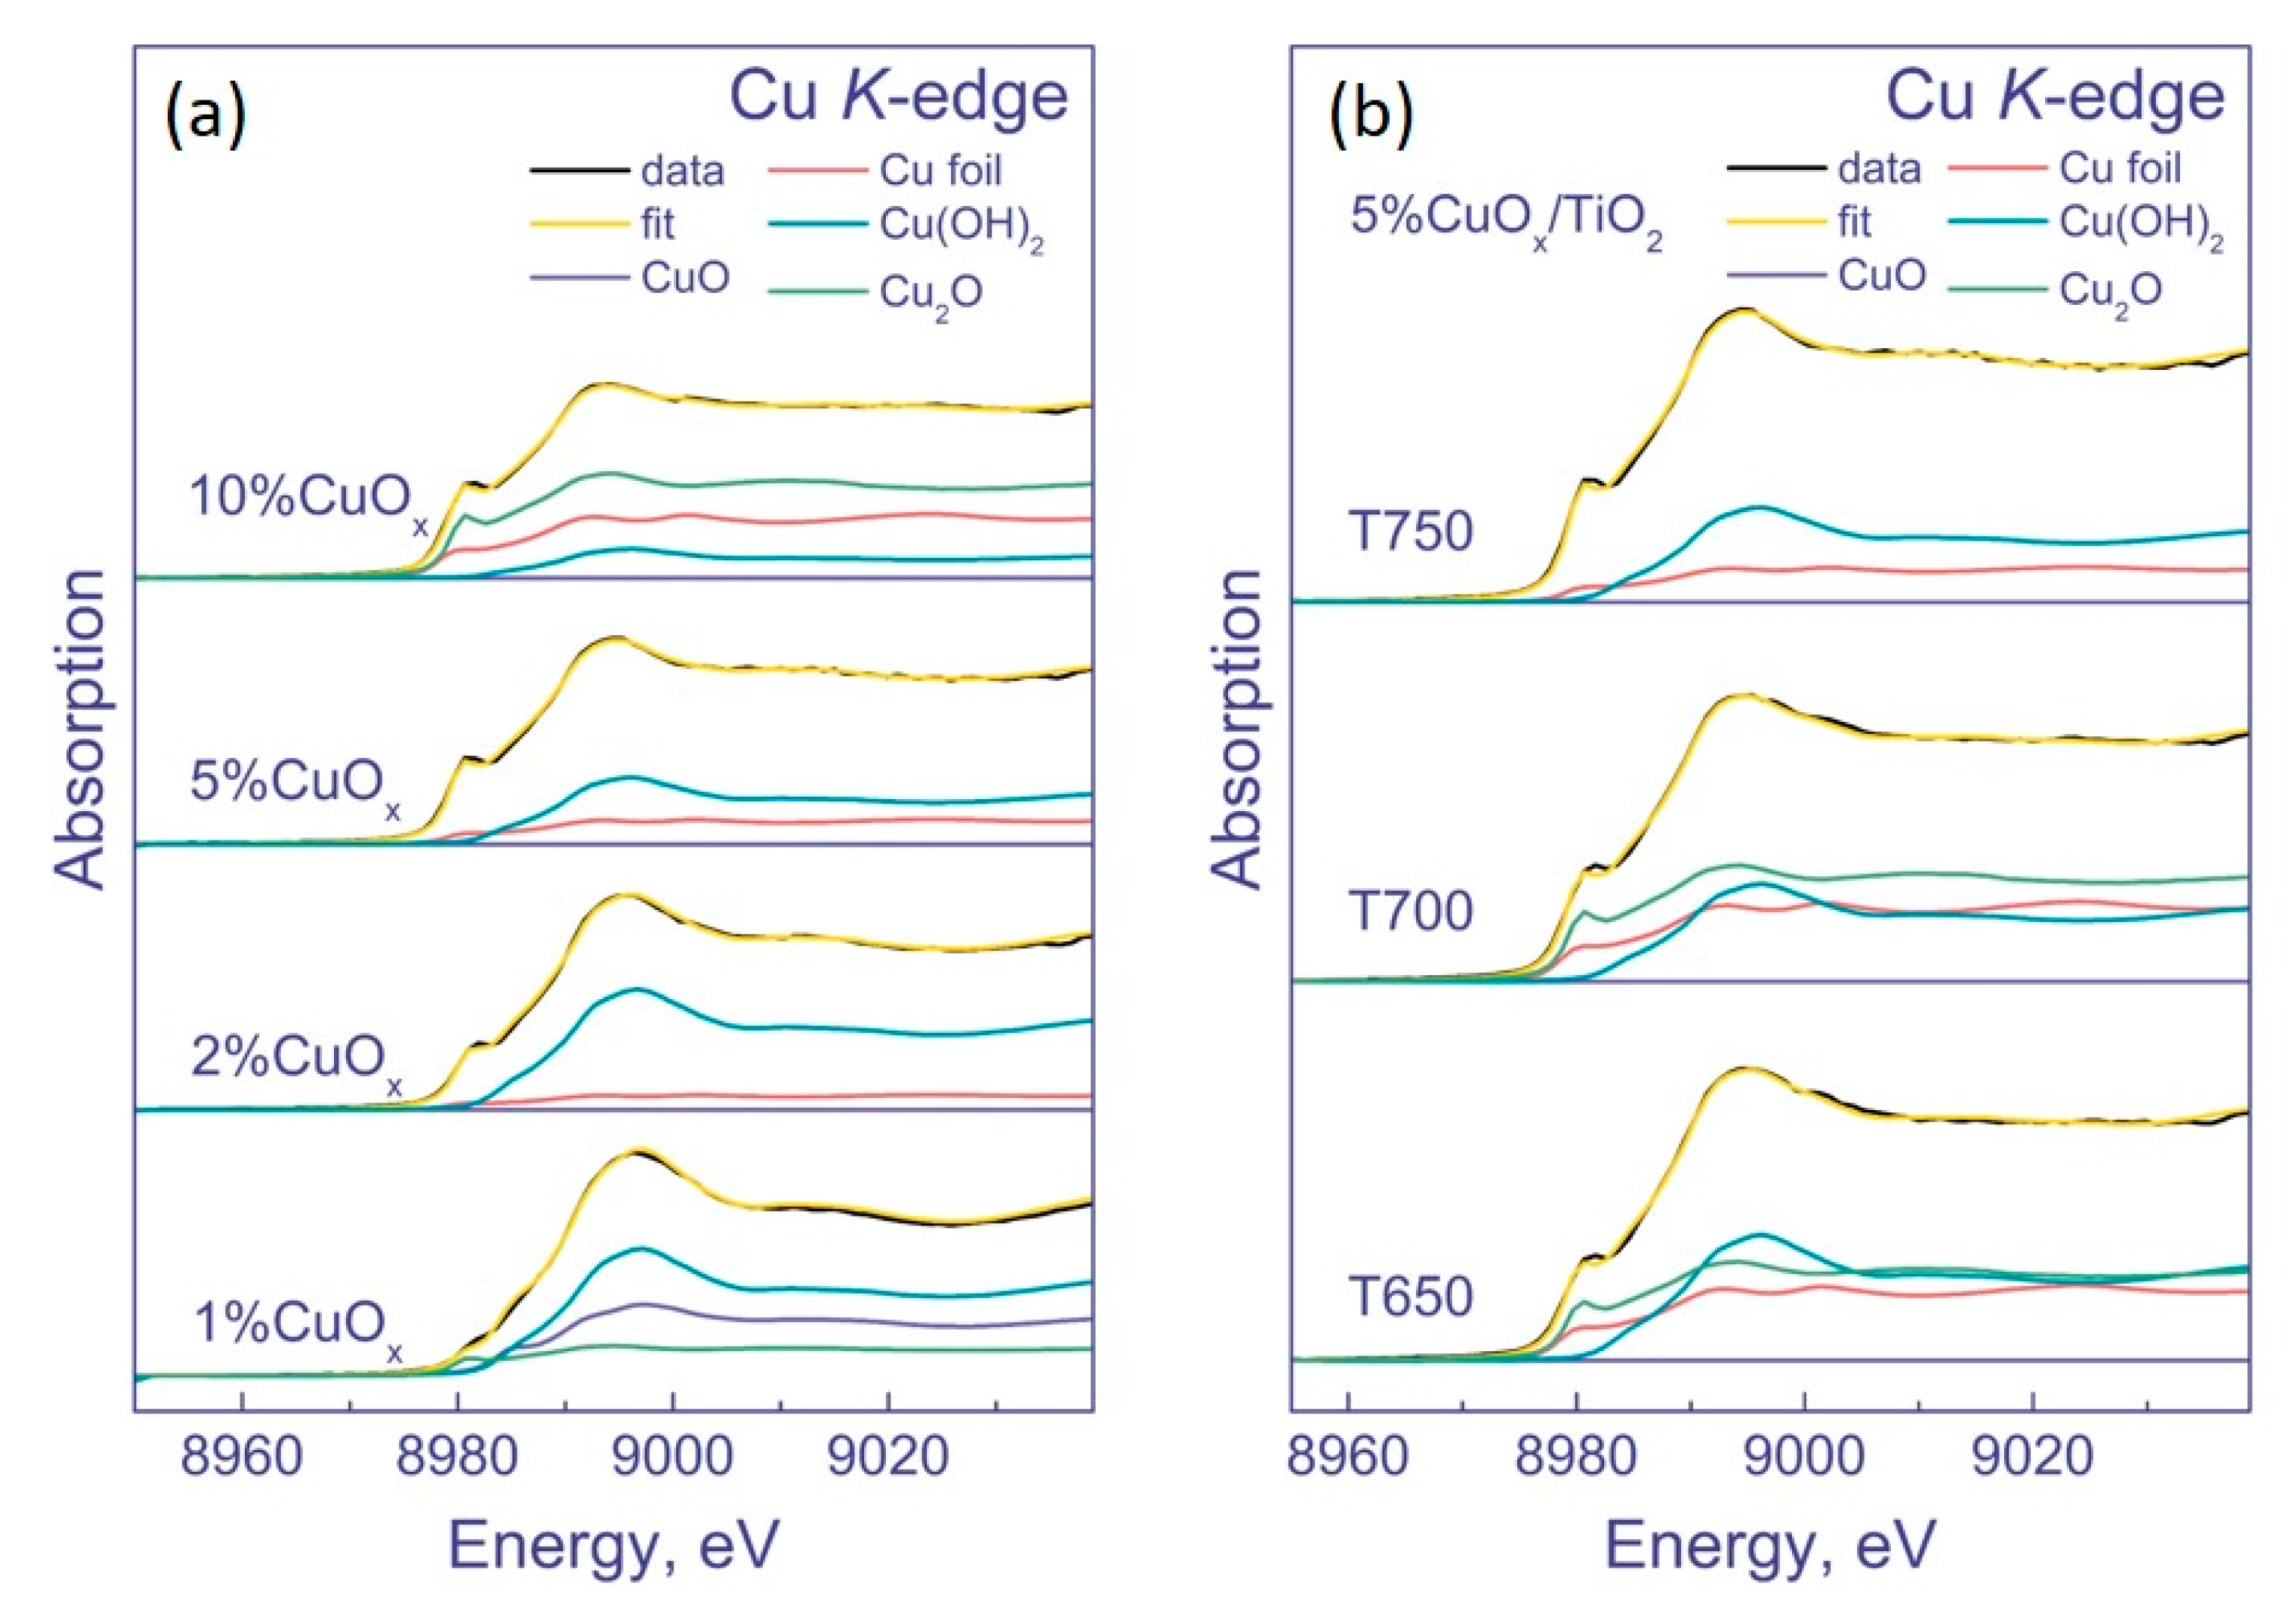
3.1.3. XPS and XANES Methods

The surface of the samples CuOx/DTiO2 was characterized using the XPS method (Figure 4). There were two series of the samples: a series 5% CuOx/DTiO2 T (where T = 600, 650, 700, and 750 °C) and a series y % CuOx/DTiO2 T750 (where y = 1, 2, 5, and 10 wt. %). With their use, we studied how the mass fraction of the copper cocatalyst and the temperature of the Degussa P25 pre-calcination affect the properties of the photocatalyst.
The Cu2p3/2 spectra of the catalysts show two symmetric peaks at 933.0–933.6 eV and 934.8–935.4 eV, respectively. The spectra also contain two shake-up satellites, which are related to the peak at 934.8–935.4 eV. These data indicate that the peak at 934.8–935.4 eV and its satellites belong to copper in the Cu2+ state (presumably in the composition of CuO), while the peak at 933.0–933.6 eV corresponds to copper in the state Cu0 or Cu1+. It should be noted that the Cu2p3/2 binding energies of the Cu1+ and Cu0 states are close; thus, the unambiguous identification of these states using XPS is complicated. However, as seen from Table 2, the predominant state of copper in the samples is Cu2+.
Unfortunately, the XPS method does not provide unambiguous information on the state of copper; moreover, under conditions of an XPS experiment, Cu2+ can be reduced to Cu1+ under X-ray radiation. Therefore, to clarify the state of copper in the samples, they were studied by XANES (Figure 5). We tested the samples prepared based on DTiO2 pretreatment at 750 °C. As a result, it was shown that Cu2+ in the samples was in the form of Cu(OH)2 and CuO. With an increase in the amount of copper, the percentage of Cu2+ decreases, and the percentage of Cu1+ in the form of Cu2O increases (Table 3). In addition, an increase in the amount of copper leads to the appearance of copper in the metallic state. Its amount gradually increases and achieves the maximum in the sample 5% CuOx/DTiO2 T700.
At the Cu K-edge, the sample 1% Cu/DTiO2 T750 has a broad intense peak in the region of 8996.2 eV, which is characteristic of copper in the Cu2+ state. This state can exist in the form of Cu(OH)2, Cu(NO3)2, and CuO nanoparticles; thus, a comparison with the reference spectra in this case does not allow an unambiguous conclusion about the state of copper in this sample [30,31,32]. The spectra of other samples show a shoulder at the absorption edge in the region of 8981.2–8981.9 eV, which is characteristic of bulk CuO, Cu2O, and metallic copper. With an increase in the amount of deposited copper, its oxidation state decreases from Cu2+ to Cu0.
The spectra of the 5 wt. % CuOx/DTiO2 samples obtained at different calcination temperatures are similar. However, upon closer examination, it can be noted that the increase in the calcination temperature from 650 to 750 °C leads to the sharpening of both the peak and the shoulder. A sharper shoulder at the absorption edge is characteristic of copper in the form of Cu2O, and its appearance indicates that higher calcination temperatures facilitate the formation of this oxide. To clarify the chemical composition of the samples, their Cu K-edge XANES spectra were fitted by a linear combination of reference spectra in the energy range from −20 to 30 eV relative to the absorption edge (Figure 6).
Table 3 presents the results of the linear combination fitting (LCF). As seen, the sample with 1% Cu contains approximately half of the copper in the Cu2+ state in the form of Cu(OH)2, while the rest of the copper is in the form of CuO and Cu2O. As the amount of copper in the samples increases, the percentage of Cu2+ decreases and Cu1+ increases, so that for the samples 5–10% CuOx/DTiO2 T750, the percentage of Cu1+ achieves 50–60%. The percentage of copper in the metallic state also increases and achieves the maximum in the sample 10% CuOx/DTiO2 T750. Analyzing the state of copper in the 5 wt. % Cu sample, one can see that an increase in calcination temperature leads to an increase in the percentage of Cu1+ and a decrease in the percentage of Cu2+ and metallic Cu.

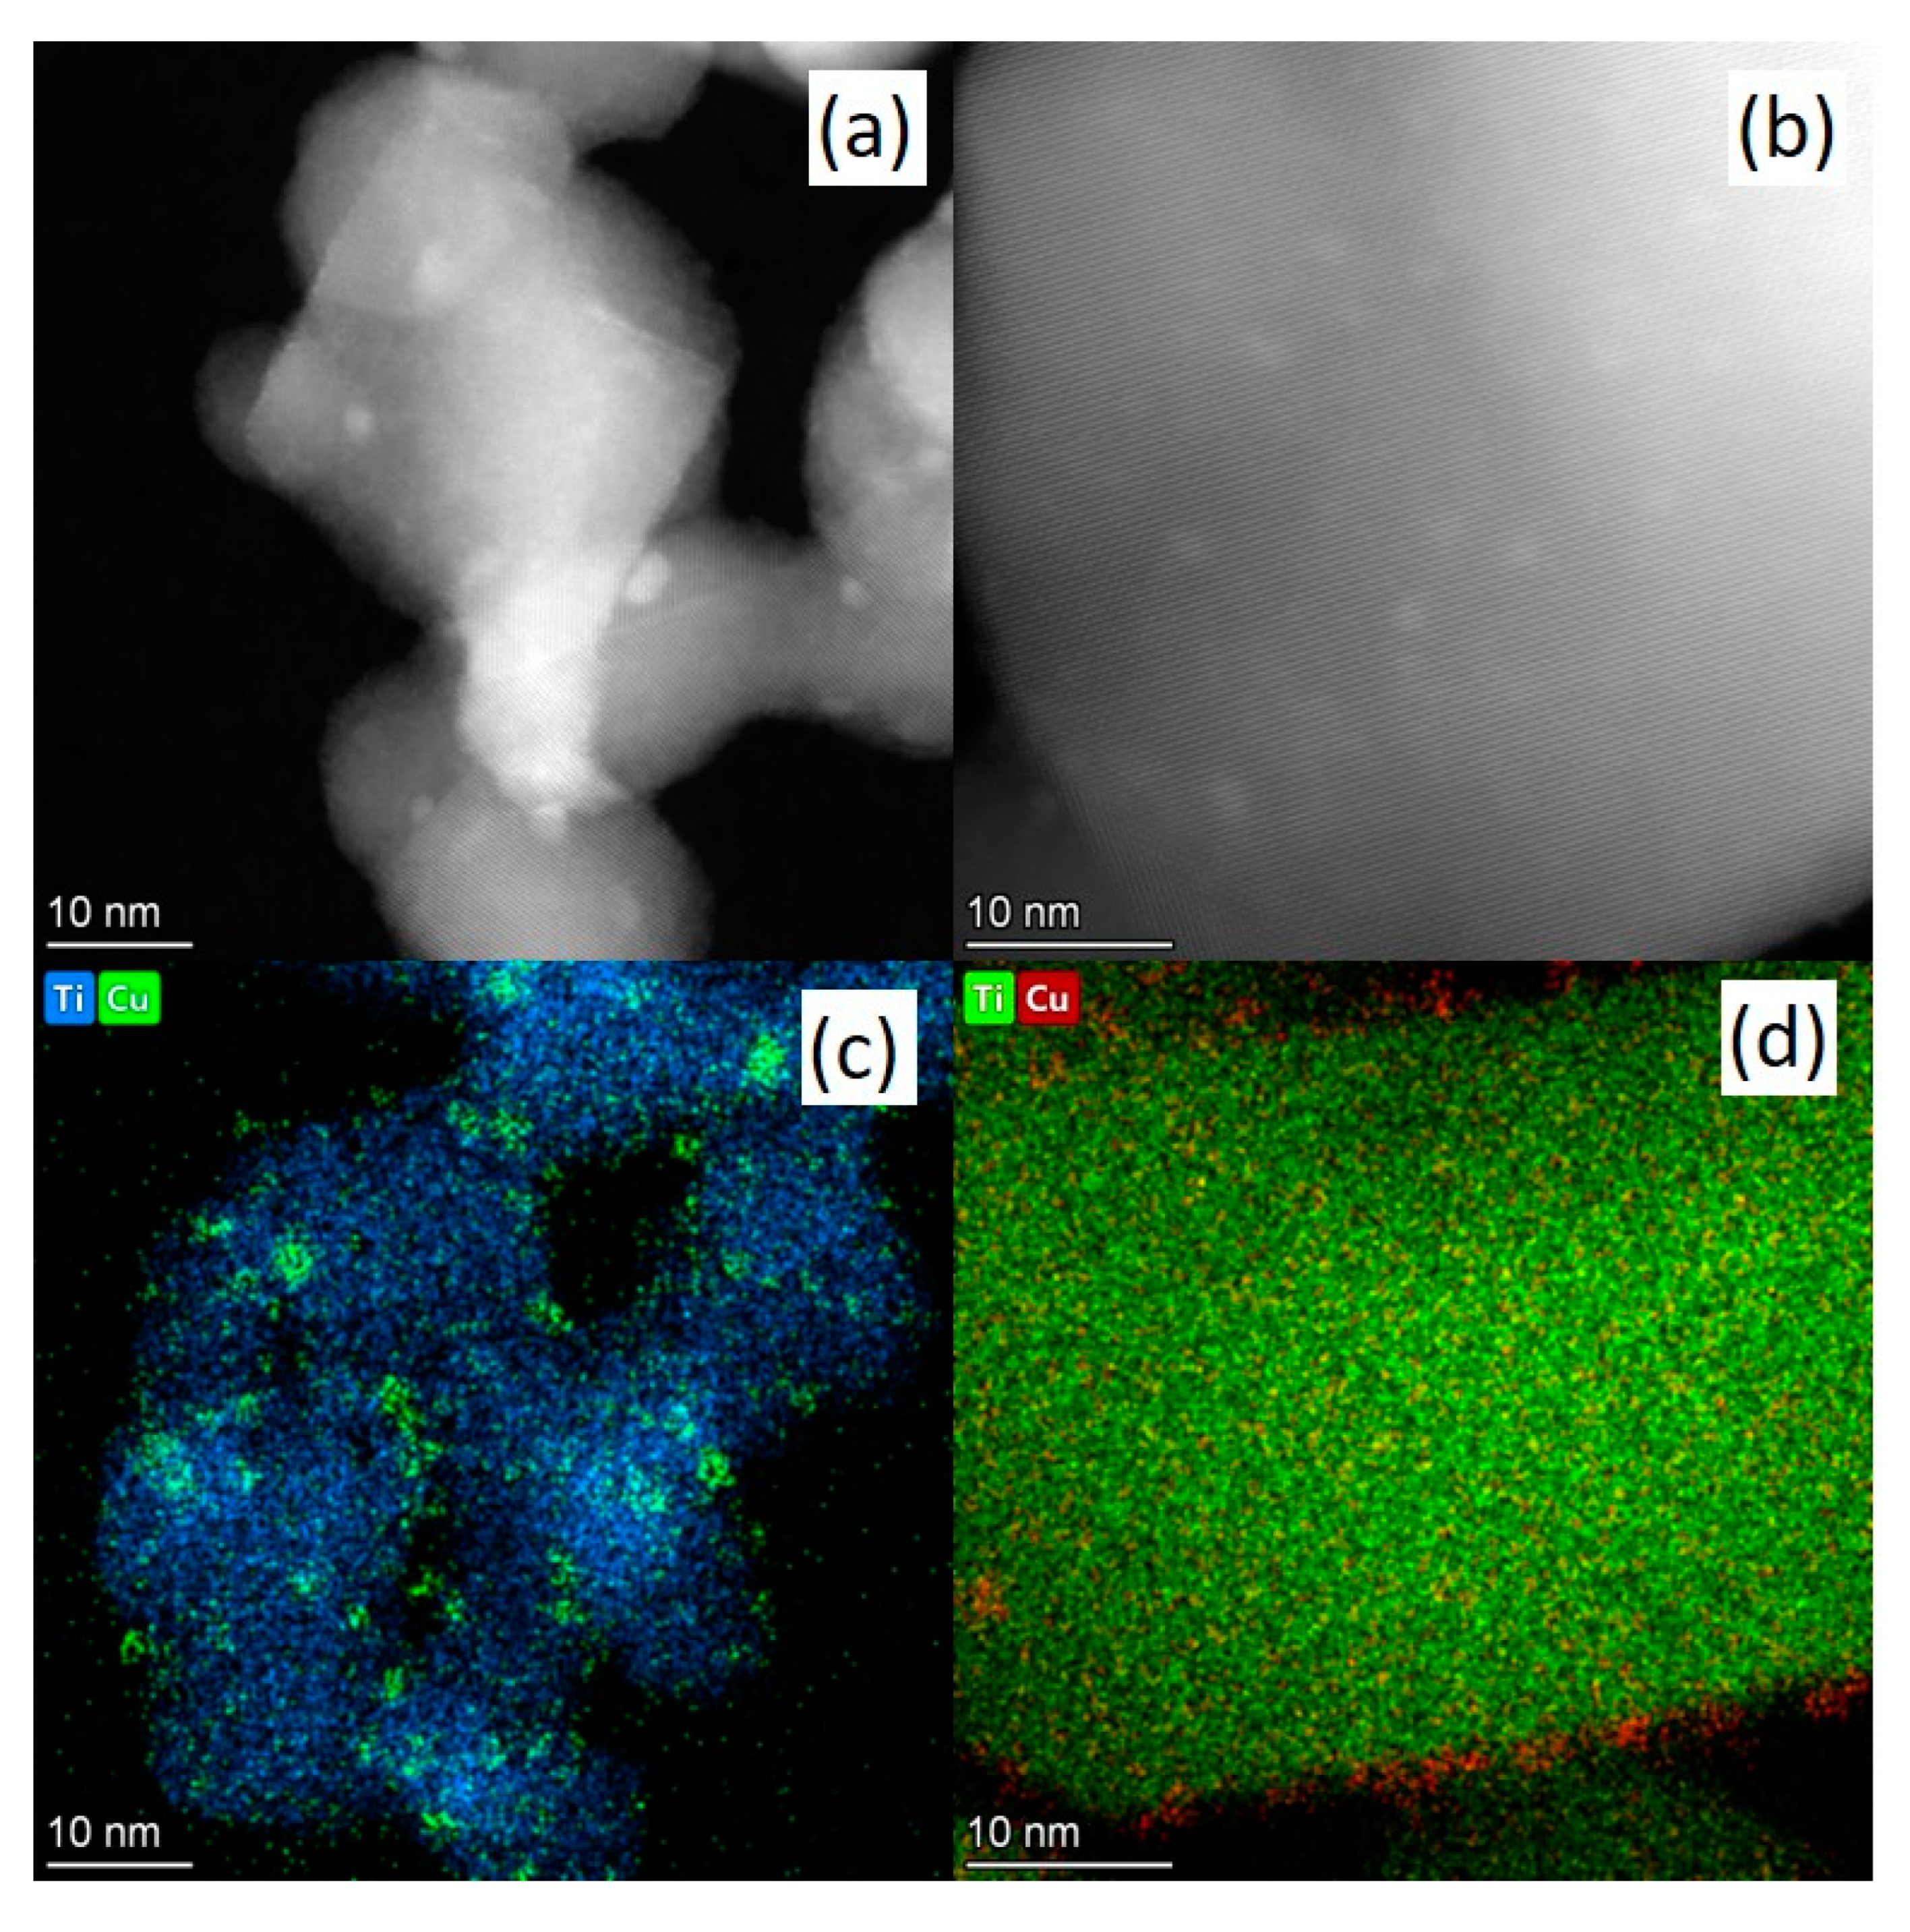
3.1.4. HR TEM Method

The samples 5 wt. % CuOx/DTiO2 (without calcination) and 5 wt. % CuOx/DTiO2 T700 were studied by HRTEM in the dark field mode (Figure 6), which provides high contrast images with the bright regions corresponding to heavier atoms. As seen from Figure 7, the particle size of copper in the sample 5 wt. % CuOx/DTiO2 is in a wide range from 1.5 to 5 nm, whereas the deposition of copper on calcined TiO2 facilitates the formation of Cu particles with a size of 1–2 nm. It can also be seen (Figure 7c) that in the sample 5 wt. % CuOx/DTiO2, copper forms surface agglomerates, whereas in the sample 5 wt. % CuOx/DTiO2 T700, it is uniformly distributed over the surface (Figure 7d). Probably, the uniform distribution of copper is a result of the following effect: the calcination of DTiO2 leads to the formation of various defects that act as fixation centers for copper particles, thus preventing their agglomeration. Figure S1 (scale 1 μm) shows that the calcination at 700 C leads to a growth of titanium dioxide particles, which completely confirms the XRD data.
Thus, the entire set of physicochemical methods demonstrates that the preliminary calcination of DTiO2 significantly affects not only its structural and textural properties but also the state of the cocatalyst: the calcination of DTiO2 at temperatures above 600 °C leads to a shift of the absorption edge to longer wavelengths and provides the uniform deposition of the cocatalyst on the DTiO2 surface.

3.2. Kinetic Experiments

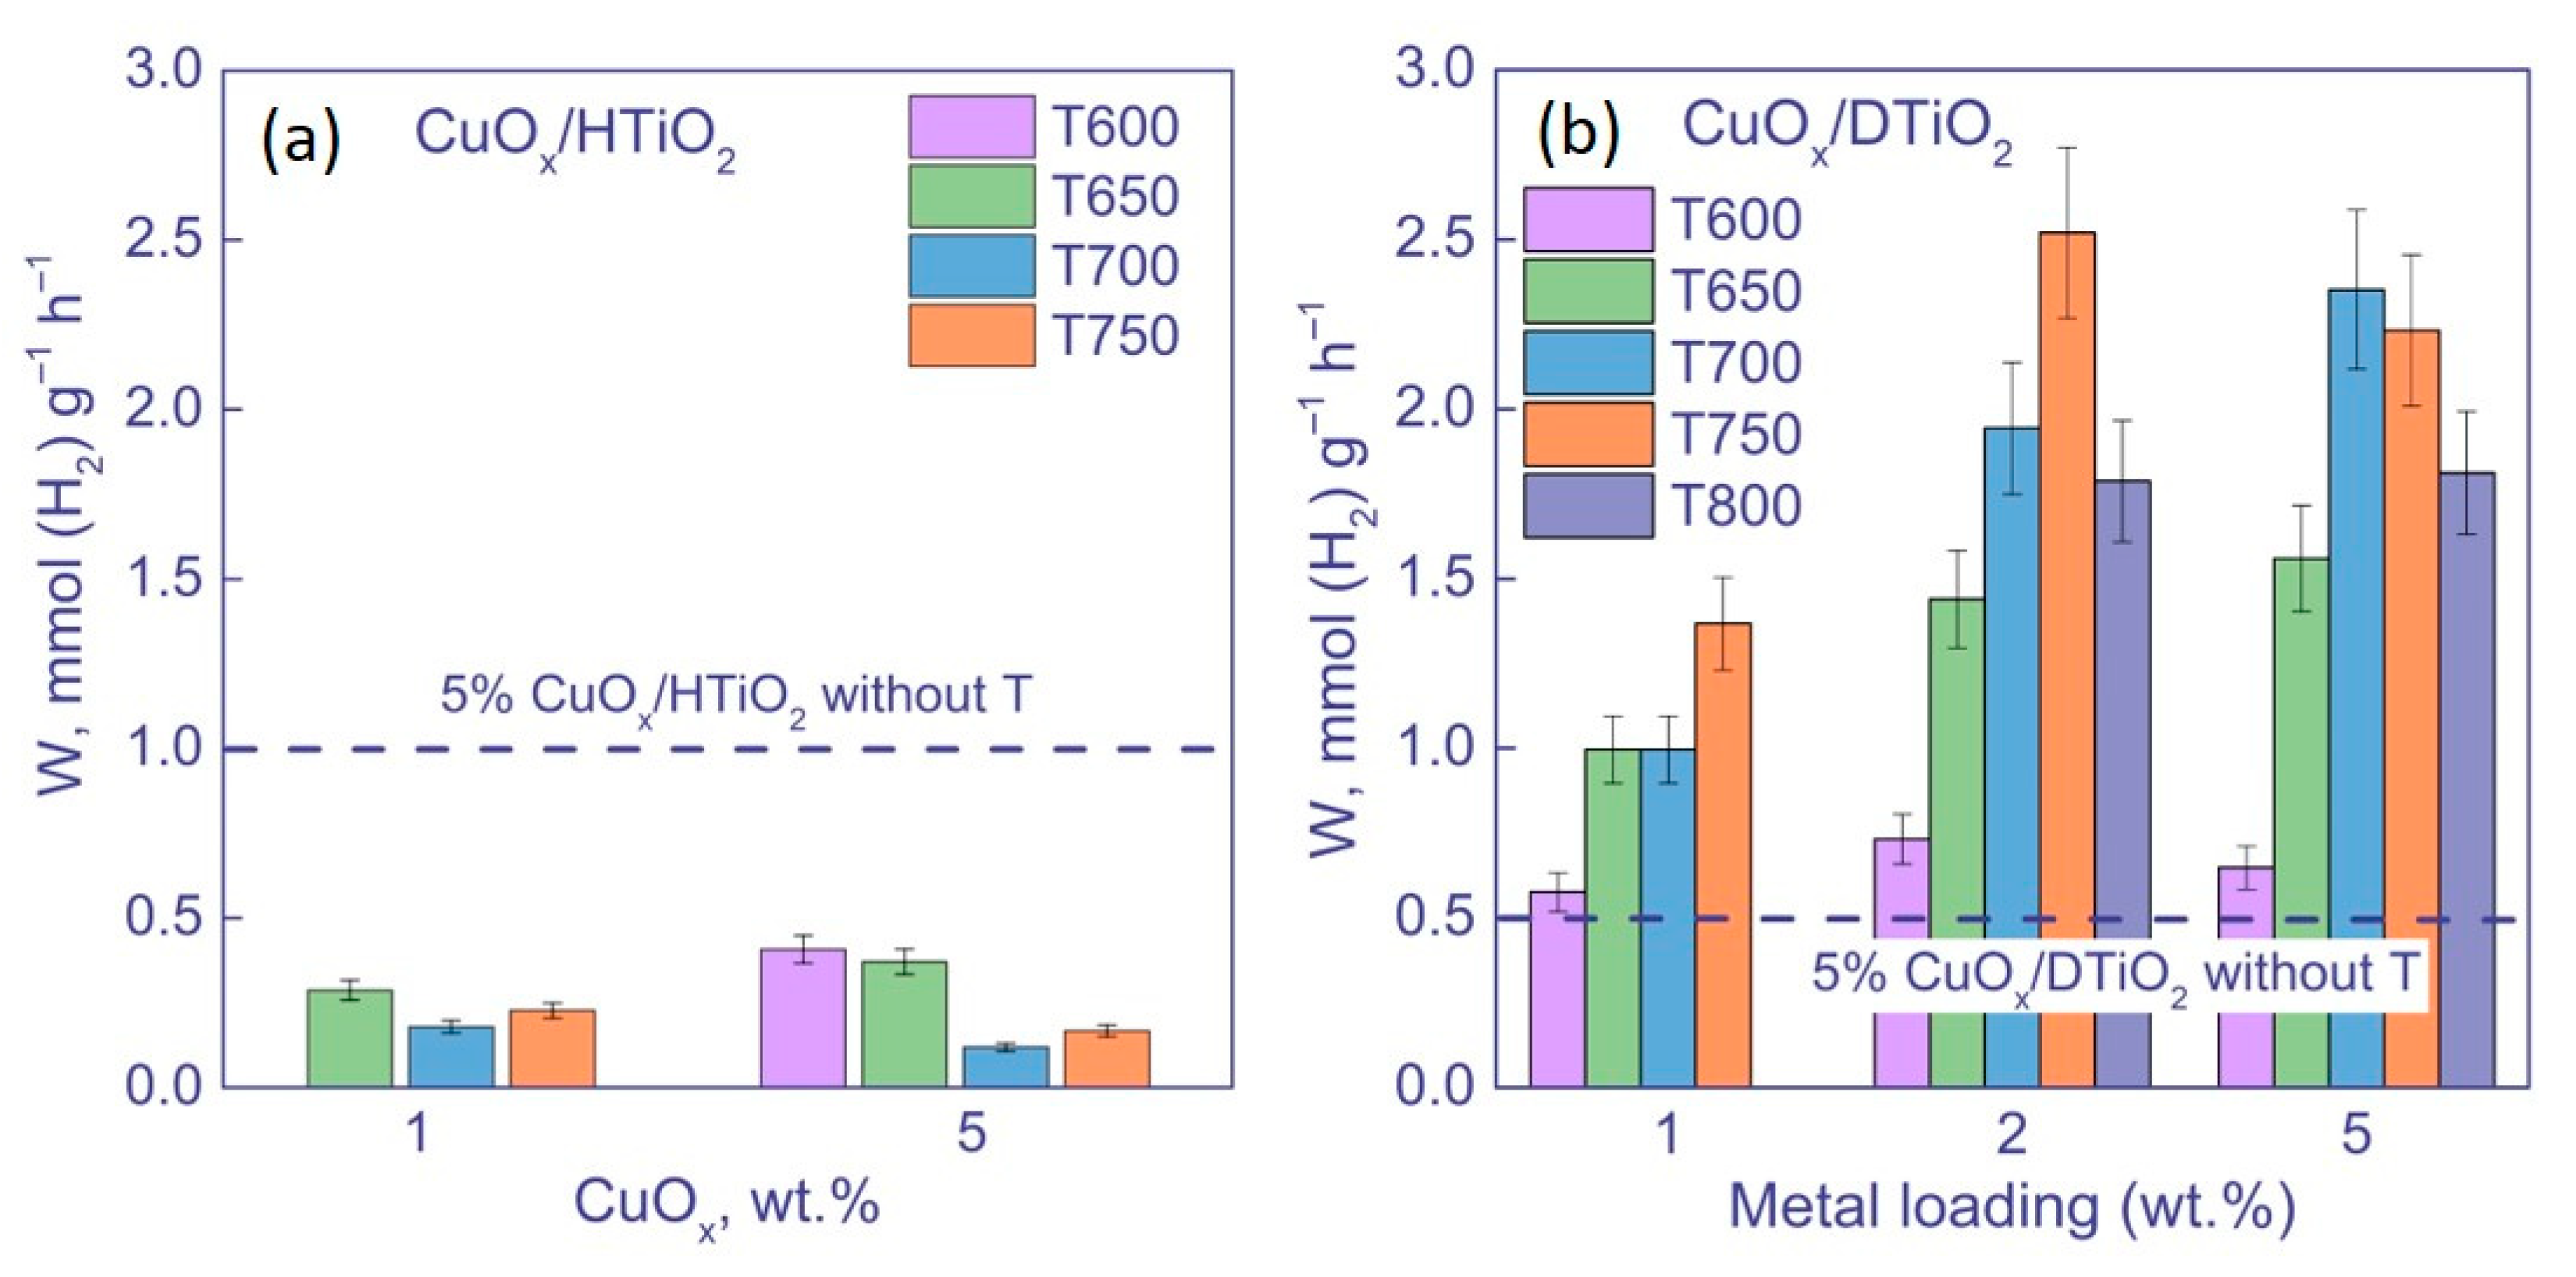
3.2.1. Activity of Photocatalysts under UV Irradiation

In these experiments, we studied how the kinetics and rate of photocatalytic hydrogen evolution depend on the amount of cocatalyst and the temperature of TiO2 calcination (Figure 8).
As seen, in the series of HTiO2 samples, the photocatalyst with 5 wt. % CuOx on uncalcined TiO2 has the highest activity: the hydrogen evolution rate over it achieves 1.0 ± 0.1 mmol (H2) g−1 h−1 (Figure 8a). In contrast, the catalysts based on calcined HTiO2 show much lower activity (about 0.2–0.4 mmol (H2) g−1 h−1). As noted above, the calcination of Hombifine N does not lead to the conversion of anatase to rutile, and as a result, the photocatalytic activity of the calcined samples is lower due to a decrease in their specific surface area and increase in crystallite size. The higher activity of the samples with the higher content of cocatalyst is caused by an increase in the efficiency of charge separation due to the transfer of photogenerated electrons between TiO2 and copper compounds.
For the series of CuOx/DTiO2 samples, the rates of hydrogen formation are significantly higher than in the previous case. At that, the reaction rate increases with an increase in the calcination temperature (Figure 8b). In contrast to the previous series, the calcination of TiO2 at temperatures of 700–750 °C provides a significant increase in the activity of photocatalysts, while the further increase in the calcination temperature to 800 °C leads to the formation of less active photocatalysts. Indeed, the rate of hydrogen evolution over the uncalcined sample is 0.5 mmol (H2) g−1 h−1, whereas the most active samples (2 wt. % CuOx/DTiO2 T750 and 5 wt. % CuOx/DTiO2 T700) provide the rates of 2.5 and 2.4 mmol (H2) g−1 h−1, respectively. It should be noted that these rates, obtained under UV irradiation, are among the highest published for TiO2-based systems (Table 4). As shown in Section 3.1.3, the calcination of DTiO2 leads to an increase in the amount of rutile and to a decrease in the sample surface area. Thus, based on the results of kinetic experiments, it can be concluded that, for the photocatalytic production of H2, a decrease in the band gap of the photocatalyst is of crucial importance.

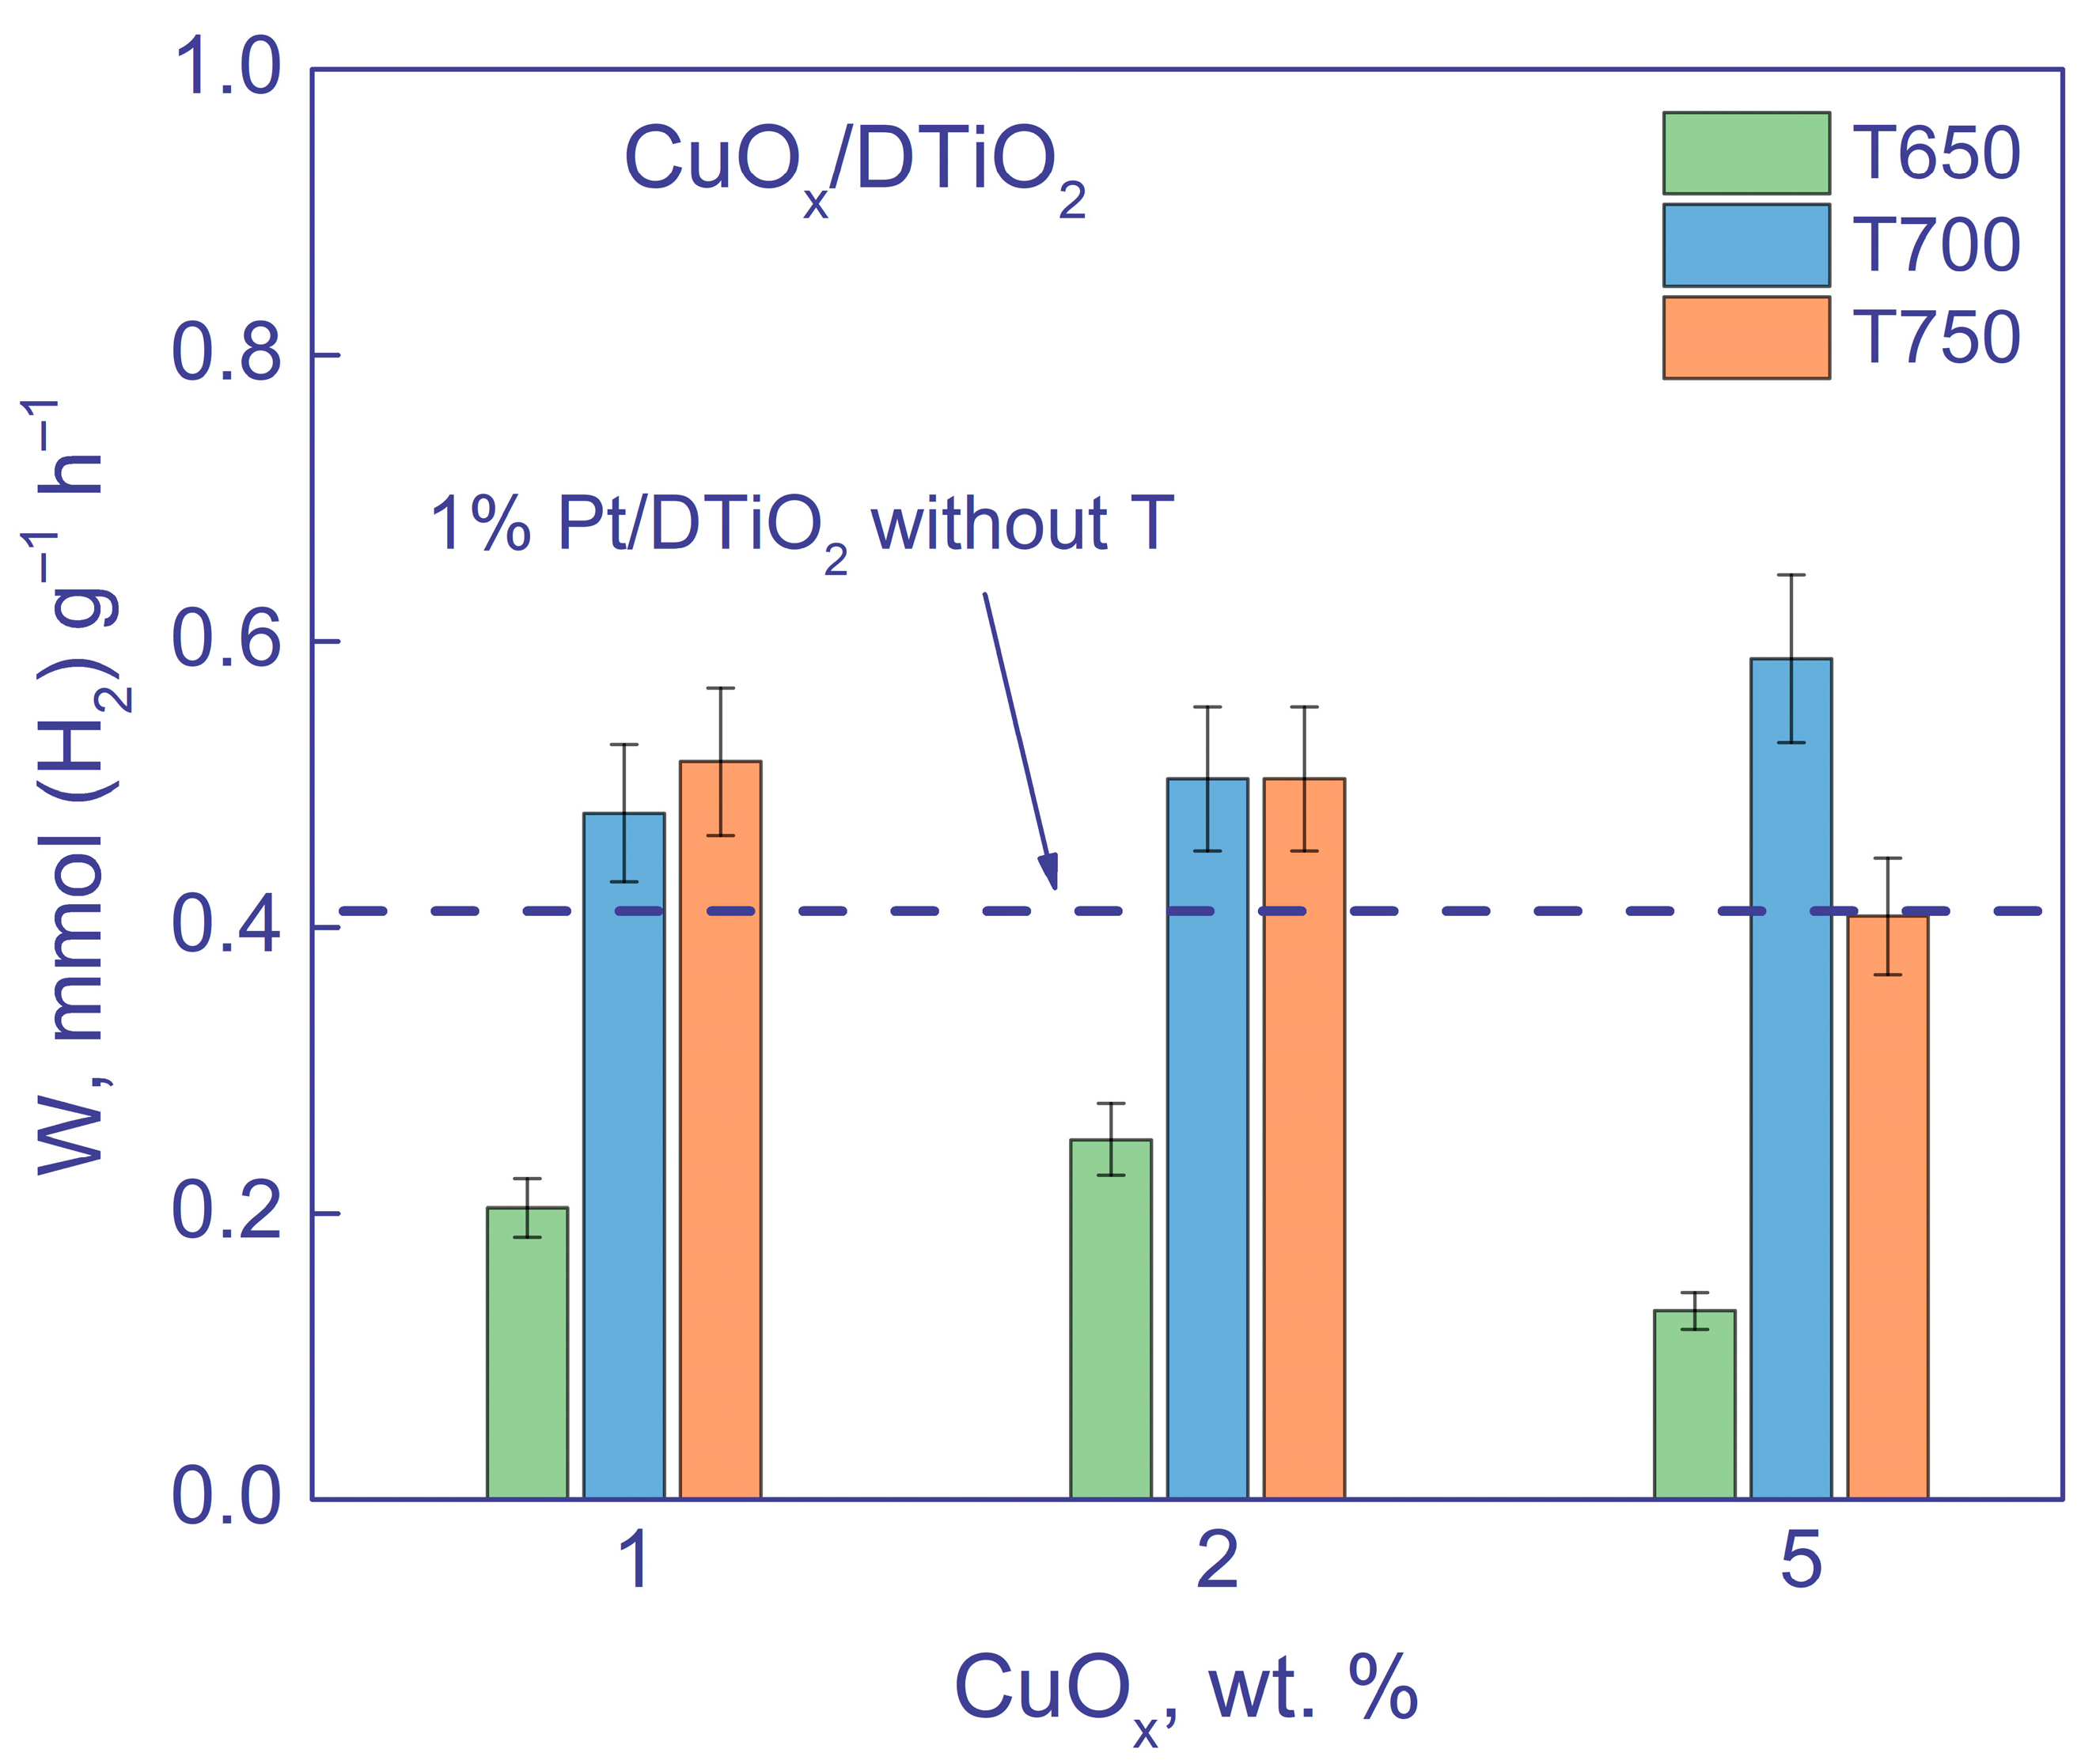
3.2.2. Activity of Photocatalysts under Visible Light Irradiation

As noted, a significant part of the solar spectrum is represented by visible light. Therefore, it was of interest to study the activity of the synthesized catalysts under visible light irradiation (Figure 9).
The activities of all the photocatalysts are summarized in Table 5. As seen, the photocatalysts based on HTiO2 are inactive under visible light. The activity of photocatalysts based on DTiO2, as in the case of UV irradiation, significantly increases after calcination. The maximum activity of 0.6 ± 0.06 mmol (H2) g−1 h−1 was achieved with the photocatalyst 5 wt. % CuOx/DTiO2 700, as well as in the case of UV irradiation (Figure 8), while the activity of the uncalcined sample 1% CuOx/DTiO2 was close to zero, the same as for all samples calcined at 600. Note that the photocatalysts 5 wt. % CuOx/DTiO2 700 demonstrate the activity that exceeds the activity of 1% Pt/DTiO2 by 50%. Moreover, the obtained activity exceeds that for similar systems described in the literature (Table 4).
Therefore, the highest activity both under UV irradiation and visible light is shown by the sample 5 wt. % CuOx/DTiO2 700. This fact can be explained by the optimal combination of the following factors:
  • An increase in the absorption of the photocatalyst due to the shift in the absorption edge of DTiO2 and the deposition of copper compounds as a cocatalyst;
  • The optimal ratio of anatase and rutile phases for the formation of heterojunctions;
  • The size of DTiO2 particles after calcination at 700 °C does not increase as much as after calcination at higher temperatures;
  • Deposition of Cu/CuOx on the surface of calcined DTiO2 leads to a uniform distribution of small cocatalyst particles;
  • The presence of copper in the composition of various compounds (Cu, Cu2O, Cu(OH)2) facilitates the formation of a complex set of photogenerated charge heterojunctions, which significantly increases the electron lifetime and process efficiency.
Thus, when light reaches the photocatalyst, an electron–hole pair is generated both on titanium dioxide and on copper compounds. The presence of copper in various states significantly increases the absorption of light by the photocatalyst in the visible region [35]. Depending on the mutual arrangement of copper particles, copper oxides, and titanium dioxide, various types of heterojunctions can be formed [36]. If metallic copper is located between the particles of titanium dioxide and copper oxide, the charge transfer Z-scheme is realized, and proton reduction occurs on the particles of Cu2O. Electrons in the conduction band of Cu2O have a significant reduction potential, which greatly accelerates the rate of photocatalytic hydrogen production [37].

4. Conclusions

Thus, a series of photocatalysts based on TiO2 of commercial grades, Hombifine N (HTiO2) and Degussa P25 (DTiO2), modified with copper compounds such as Cu, Cu2O, CuO, and Cu(OH)2 was synthesized and characterized by a set of physicochemical methods. It has been shown that the calcination of DTiO2 at temperatures above 600 °C leads to a significant increase in the amount of the rutile phase in the photocatalyst, a shift in the absorption edge, and a uniform distribution of cocatalyst particles on the TiO2 surface. The calcination of Hombifine N does not lead to the transformation of anatase to rutile. It has been shown that an increase in the amount of rutile and the addition of copper in the Cu2+ oxidation state increase the absorption of DTiO2 photocatalysts in the visible region and accordingly provide their high activity under visible light irradiation.
The samples 2% CuOx/DTiO2 T750 and 5% CuOx/DTiO2 T700 showed the maximum activity under UV irradiation (380 nm) in obtaining hydrogen from aqueous solutions of glycerol, with the rate of H2 evolution at the level of 2.5 mmol (H2) g−1 h−1. Under the visible light irradiation (427 nm), the highest activity of 0.6 mmol (H2) g−1 h−1 was achieved with the 5% CuOx/DTiO2 T700 photocatalyst. The activity of these photocatalysts is 50% higher than that of the platinized 1% Pt/DTiO2 sample. The pre-calcination of Hombifine N does not lead to the enhancement of photocatalyst activity due to the absence of phase transformation. It has been shown that the presence of CuO increases the activity of the photocatalysts to the greatest extent, and the reduction of Cu2+ to the Cu+ or Cu0 states leads to a slowdown of the H2 evolution.
In general, it can be concluded that a simple heat treatment of a commercial titanium dioxide in combination with a deposition of non-noble metal particles (e.g., copper) leads to a significant increase in the activity of photocatalysts and makes it possible to obtain materials that are active in the formation of hydrogen under visible light irradiation.

Supplementary Materials

The following supporting information can be downloaded at: https://www.mdpi.com/article/10.3390/nano12183106/s1, Figure S1: HAADF STEM micrographs of (a) CuOx/DTiO2 and (b) CuOx/DTiO2 T700.

Author Contributions

A.Y.K.: investigation, data curation, visualization and writing—original draft preparation; A.Y.Y.: investigation, data curation, visualization and writing—original draft preparation; A.A.S.: investigation, data curation and visualization; E.Y.G.: investigation and data curation; E.A.K.: writing—original draft preparation, supervision and conceptualization; V.V.K.: conceptualization, funding acquisition and project administration. All authors have read and agreed to the published version of the manuscript.

Funding

This work was supported by the Russian Science Foundation (grant # 19-73-20020).

Institutional Review Board Statement

Not applicable.

Informed Consent Statement

Not applicable.

Data Availability Statement

The data presented in this study are available on request from the corresponding author.

Acknowledgments

The XPS and HR TEM experiments were performed using facilities of the shared research center “National center of investigation of catalysts” at Boreskov Institute of Catalysis. The authors are grateful to S. Cherepanova for XRD experiments, T. Larina for the UV–vis measurements, and D. Vasilchenko for the LED emission spectra measurements.

Conflicts of Interest

The authors declare no conflict of interest.

References

  1. Turner, J.A. Sustainable hydrogen production. Science 2004, 305, 972–974. [Google Scholar] [CrossRef] [PubMed]
  2. Clarizia, L.; Vitiello, G.; Pallotti, D.K.; Silvestri, B.; Nadagouda, M.; Lettieri, S.; Luciani, G.; Andreozzi, R.; Maddalena, P.; Marotta, R. Effect of surface properties of copper-modified commercial titanium dioxide photocatalysts on hydrogen production through photoreforming of alcohols. Int. J. Hydrogen Energy 2017, 42, 28349–28362. [Google Scholar] [CrossRef]
  3. Fujishima, A.; Honda, K. Electrochemical photolysis of water at a semiconductor electrode. Nature 1972, 238, 37–38. [Google Scholar] [CrossRef]
  4. Vorontsov, A.V.; Kozlova, E.A.; Besov, A.S.; Kozlov, D.V.; Kiselev, S.A.; Safatov, A.S. Photocatalysis: Light energy conversion for the oxidation, disinfection, and decomposition of water. Kinet. Catal. 2010, 51, 801–808. [Google Scholar] [CrossRef]
  5. Valeeva, A.A.; Dorosheva, I.B.; Kozlova, E.A.; Kamalov, R.V.; Vokhmintsev, A.S.; Selishchev, D.S.; Saraev, A.A.; Gerasimov, E.Y.; Weinstein, I.A.; Rempel, A.A. Influence of Calcination on Photocatalytic Properties of Nonstoichiometric Titanium Dioxide Nanotubes. J. Alloys Compnd. 2019, 796, 293–299. [Google Scholar] [CrossRef]
  6. Rioja-Cabanillas, A.; Valdesueiro, D.; Fernández-Ibáñez, P.; Byrne, J.A. Hydrogen from wastewater by photocatalytic and photoelectrochemical treatment. J. Phys. Energy 2020, 3, 012006. [Google Scholar] [CrossRef]
  7. Hoffmann, M.R.; Martin, S.T.; Choi, W.; Bahnemann, D.W. Environmental Applications of Semiconductor Photocatalysis. Chem. Rev. 1995, 95, 69–96. [Google Scholar] [CrossRef]
  8. Kozlova, E.A.; Vorontsov, A.V. Photocatalytic hydrogen evolution from aqueous solutions of organophosphorous compounds. Int. J. Hydrogen Energy 2010, 35, 7337–7343. [Google Scholar] [CrossRef]
  9. Zhang, S.; Wang, L.; Liu, C.; Luo, J.; Crittenden, J.; Liu, X.; Cai, T.; Yuan, J.; Pei, Y.; Liu, Y. Photocatalytic wastewater purification with simultaneous hydrogen production using MoS2 QD-decorated hierarchical assembly of ZnIn2S4 on reduced graphene oxide photocatalyst. Water Res. 2017, 121, 11–19. [Google Scholar] [CrossRef]
  10. Sang, H.X.; Wang, X.T.; Fan, C.C.; Wang, F. Enhanced photocatalytic H2 production from glycerol solution over ZnO/ZnS core/shell nanorods prepared by a low temperature route. Int. J. Hydrogen Energy 2012, 37, 1348–1355. [Google Scholar] [CrossRef]
  11. Quispe, C.A.G.; Coronado, C.J.R.; Carvalho, J.A. Glycerol: Production, consumption, prices, characterization and new trends in combustion. Renew. Sustain. Energy Rev. 2013, 27, 475–493. [Google Scholar] [CrossRef]
  12. Kozlova, E.A.; Kurenkova, A.Y.; Gerasimov, E.Y.; Gromov, N.V.; Medvedeva, T.B.; Saraev, A.A.; Kaichev, V.V. Comparative study of photoreforming of glycerol on Pt/TiO2 and CuOx/TiO2 photocatalysts under UV light. Mater. Lett. 2021, 283, 128901. [Google Scholar] [CrossRef]
  13. Markovskaya, D.V.; Zhurenok, A.V.; Kurenkova, A.Y.; Kremneva, A.M.; Saraev, A.A.; Zharkov, S.M.; Kozlova, E.A.; Kaichev, V.V. New titania-based photocatalysts for hydrogen production from aqueous-alcoholic solutions of methylene blue. RSC Adv. 2020, 10, 34137–34148. [Google Scholar] [CrossRef]
  14. Leung, D.Y.C.; Fu, X.; Wang, C.; Ni, M.; Leung, M.K.H.; Wang, X.; Fu, X. Hydrogen production over titania-based photocatalysts. ChemSusChem 2010, 3, 681–694. [Google Scholar] [CrossRef] [PubMed]
  15. Hu, N.; Cai, Y.; Li, L.; Wang, X.; Gao, J. Amino-Functionalized Titanium Based Metal-Organic Framework for Photocatalytic Hydrogen Production. Molecules 2022, 27, 4241. [Google Scholar] [CrossRef] [PubMed]
  16. Ren, X.; Liu, F.; Wang, Q.; Song, H.; Luo, S.; Li, S.; Yang, G.; Deng, B.; Huang, Z.; Wang, X.S.; et al. Engineering interfacial charge transfer channel for efficient photocatalytic H2 evolution: The interplay of CoPx and Ca2+ dopant. Appl. Catal. B Environ. 2022, 303, 120887. [Google Scholar] [CrossRef]
  17. Wang, X.S.; Li, L.; Li, D.; Ye, J. Recent Progress on Exploring Stable Metal–Organic Frameworks for Photocatalytic Solar Fuel Production. Sol. RRL 2020, 4, 1900547. [Google Scholar] [CrossRef]
  18. Lee, A.C.; Lin, R.H.; Yang, C.Y.; Lin, M.H.; Wang, W.Y. Preparations and characterization of novel photocatalysts with mesoporous titanium dioxide (TiO2) via a sol–gel method. Mater. Chem. Phys. 2008, 109, 275–280. [Google Scholar] [CrossRef]
  19. Amano, F.; Nakata, M.; Yamamoto, A.; Tanaka, T. Rutile titanium dioxide prepared by hydrogen reduction of Degussa P25 for highly efficient photocatalytic hydrogen evolution. Catal. Sci. Technol. 2016, 6, 5693–5699. [Google Scholar] [CrossRef]
  20. Nair, R.V.; Gummaluri, V.S.; Matham, M.V.; Vijayan, C. A review on optical bandgap engineering in TiO2 nanostructures via doping and intrinsic vacancy modulation towards visible light applications. J. Phys. D. Appl. Phys. 2022, 55, 313003. [Google Scholar] [CrossRef]
  21. Puga, A.V. Photocatalytic production of hydrogen from biomass-derived feedstocks. Coord. Chem. Rev. 2016, 315, 1–66. [Google Scholar] [CrossRef]
  22. Sun, T.; Liu, E.; Liang, X.; Hu, X.; Fan, J. Enhanced hydrogen evolution from water splitting using Fe-Ni codoped and Ag deposited anatase TiO2 synthesized by solvothermal method. Appl. Surf. Sci. 2015, 347, 696–705. [Google Scholar] [CrossRef]
  23. Li, Z.; Liu, J.; Wang, D.; Gao, Y.; Shen, J. Cu2O/Cu/TiO2 nanotube Ohmic heterojunction arrays with enhanced photocatalytic hydrogen production activity. Int. J. Hydrogen Energy 2012, 37, 6431–6437. [Google Scholar] [CrossRef]
  24. Taylor, S.; Mehta, M.; Samokhvalov, A. Production of Hydrogen by Glycerol Photoreforming Using Binary Nitrogen–Metal-Promoted N-M-TiO2 Photocatalysts. ChemPhysChem 2014, 15, 942–949. [Google Scholar] [CrossRef]
  25. Clarizia, L.; Vitiello, G.; Luciani, G.; Di Somma, I.; Andreozzi, R.; Marotta, R. In situ photodeposited nanoCu on TiO2 as a catalyst for hydrogen production under UV/visible radiation. Appl. Catal. A Gen. 2016, 518, 142–149. [Google Scholar] [CrossRef]
  26. Yu, J.; Hai, Y.; Jaroniec, M. Photocatalytic hydrogen production over CuO-modified titania. J. Colloid Interface Sci. 2011, 357, 223–228. [Google Scholar] [CrossRef]
  27. Nishikiori, H.; Harata, N.; Yamaguchi, S.; Ishikawa, T.; Kondo, H.; Kikuchi, A.; Yamakami, T.; Teshima, K. Formation of CuO on TiO2 Surface Using its Photocatalytic Activity. Catalysts 2019, 9, 383. [Google Scholar] [CrossRef]
  28. Yin, M.; Wu, C.K.; Lou, Y.; Burda, C.; Koberstein, J.T.; Zhu, Y.; O’Brien, S. Copper oxide nanocrystals. J. Am. Chem. Soc. 2005, 127, 9506–9511. [Google Scholar] [CrossRef] [PubMed]
  29. Cheng, S.P.; Wei, L.W.; Wang, H.P. Photocatalytic Reduction of CO2 to Methanol by Cu2O/TiO2 Heterojunctions. Sustainability 2021, 14, 374. [Google Scholar] [CrossRef]
  30. Gombac, V.; Sordelli, L.; Montini, T.; Delgado, J.J.; Adamski, A.; Adami, G.; Cargnello, M.; Bernai, S.; Fornasiero, P. CuOx-TiO2 Photocatalysts for H2 production from ethanol and glycerol solutions. J. Phys. Chem. A 2010, 114, 3916–3925. [Google Scholar] [CrossRef]
  31. Sharma, A.; Varshney, M.; Park, J.; Ha, T.K.; Chae, K.H.; Shin, H.J. XANES, EXAFS and photocatalytic investigations on copper oxide nanoparticles and nanocomposites. RSC Adv. 2015, 5, 21762–21771. [Google Scholar] [CrossRef]
  32. Sekine, R.; Marzouk, E.R.; Khaksar, M.; Scheckel, K.G.; Stegemeier, J.P.; Lowry, G.V.; Donner, E.; Lombi, E. Aging of Dissolved Copper and Copper-based Nanoparticles in Five Different Soils: Short-term Kinetics vs. Long-term Fate. J. Environ. Qual. 2017, 46, 1198–1205. [Google Scholar] [CrossRef] [PubMed]
  33. Yang, X.; Wu, L.; Du, L.; Li, X. Photocatalytic Water Splitting Towards Hydrogen Production on Gold Nanoparticles (NPs) Entrapped in TiO2 Nanotubes. Catal. Lett. 2015, 145, 1771. [Google Scholar] [CrossRef]
  34. Chen, J.L.; Liu, M.M.; Xie, S.Y.; Yue, L.J.; Gong, F.L.; Chai, K.M.; Zhang, Y.H. Cu2O-loaded TiO2 heterojunction composites for enhanced photocatalytic H2 production. J. Mol. Struct. 2022, 1247, 131294. [Google Scholar] [CrossRef]
  35. Díaz, L.; Rodríguez, V.D.; González-Rodríguez, M.; Rodríguez-Castellón, E.; Algarra, M.; Núñez, P.; Moretti, E. M/TiO2 (M = Fe, Co, Ni, Cu, Zn) catalysts for photocatalytic hydrogen production under UV and visible light irradiation. Inorg. Chem. Front. 2021, 8, 3491–3500. [Google Scholar] [CrossRef]
  36. Yao, G.Y.; Zhao, Z.Y. Unraveling the role of cuprous oxide and boosting solar energy conversion: Via interface engineering in a Cu/TiO2 plasmonic photocatalyst. J. Mater. Chem. C 2020, 8, 8567–8578. [Google Scholar] [CrossRef]
  37. Lv, S.; Wang, Y.; Zhou, Y.; Liu, Q.; Song, C.; Wang, D. Oxygen vacancy stimulated direct Z-scheme of mesoporous Cu2O/TiO2 for enhanced photocatalytic hydrogen production from water and seawater. J. Alloys Compd. 2021, 868, 159144. [Google Scholar] [CrossRef]
Figure 1. (a) Spectra of LEDs with the wavelength at maximum intensity; (b) scheme of reaction set-up for photocatalytic study. 1—LED, 2—quartz window, 3—sampler, 4—reactor, 5—reaction mixture, 6—stir bar, 7—magnetic stirrer.
Nanomaterials 12 03106 g001
Figure 2. XRD patterns of the samples based on (a) TiO2 Hombifine N and (b) TiO2 Degussa P25.
Nanomaterials 12 03106 g002
Figure 3. (a,c) Diffuse reflectance spectra of photocatalysts and (b,d) Tauc plots with tangent to graph (dotted line).
Nanomaterials 12 03106 g003
Figure 4. XPS spectra of Cu2p (a) 5% CuOx/DTiO2 T600–T750; (b) (1–10)% CuOx/DTiO2 T750.
Nanomaterials 12 03106 g004
Figure 5. XANES spectra of the K-absorption edge of Cu (a) (1–10)% CuOx/DTiO2 T750; (b) 5% CuOx/DTiO2 T650–T750 in comparison with the spectra of metallic copper, Cu2O, CuO, and Cu(OH)2.
Nanomaterials 12 03106 g005
Figure 6. XANES spectra of the K-edge of Cu and their decomposition into a linear set of spectra of metallic copper, CuO, Cu2O, and Cu(OH)2 (a) (1–10)% CuOx/DTiO2 T750; (b) 5% CuOx/DTiO2 T650–T750.
Nanomaterials 12 03106 g006
Figure 7. HAADF STEM micrographs of (a) CuOx/DTiO2 and (b) CuOx/DTiO2 T700; EDX mapping of (c) CuOx/DTiO2 and (d) CuOx/DTiO2 T700.
Nanomaterials 12 03106 g007
Figure 8. Rates of H2 evolution over (a) CuOx/HTiO2 and (b) CuOx/DTiO2. Conditions: m(cat.) = 50 mg, V = 100 mL, C0(glycerol) = 0.38 M, λ = 381 nm.
Nanomaterials 12 03106 g008
Figure 9. Rates of H2 evolution over CuOx/DTiO2. Conditions: m(cat.) = 50 mg, V = 100 mL, C0(glycerol) = 0.38 M, λ = 427 nm.
Nanomaterials 12 03106 g009
Table 1. Structural and textural characteristics of calcined Degussa P25 samples.
No.SamplePhase Composition, wt. %CS, nmSSA, m2 g−1V, cm3 g−1
1DTiO285% (Anatase)/15% (Rutile)19/30550.48
2DTiO2 60075% (Anatase)/25% (Rutile)21/40550.52
3DTiO2 65068% (Anatase)/32% (Rutile)35/65410.16
4DTiO2 70036% (Anatase)/63% (Rutile)45/85190.074
5DTiO2 7505% (Anatase)/95% (Rutile)62/>100120.046
6DTiO2 800100% (Rutile)>100100.035
Table 2. Surface contents of atoms for the analyzed photocatalysts according to XPS data.
No.Sample[Cu]/[Ti][O]/[Ti]Cu2+, %
15% CuOx/DTiO2 T6000.264.885
25% CuOx/DTiO2 T6500.143.352
35% CuOx/DTiO2 T7000.223.251
45% CuOx/DTiO2 T7500.243.460
51% CuOx/DTiO2 T7500.173.163
62% CuOx/DTiO2 T7500.253.264
710% CuOx/DTiO2 T7500.483.764
Table 3. Phase composition of the samples according to the results of the linear combination fitting of Cu K-edge XANES spectra.
No.SampleCu2+, %Cu1+, %Cu0, %
Weight content of copper
11% CuOx/DTiO2 T7508515
22% CuOx/DTiO2 T75049428
35% CuOx/DTiO2 T750275913
410% CuOx/DTiO2 T75012 5435
Temperature of TiO2 Degussa P25 calcination
15% CuOx/DTiO2 T65036 3628
25% CuOx/DTiO2 T70028 4230
35% CuOx/DTiO2 T750275913
Table 4. Activity of photocatalysts based on TiO2 in the formation of H2 from aqueous solutions of alcohols.
PhotocatalystModification MethodElectron DonorRadiation SourceW, μmol (H2) g−1 h−1AQE, %Ref
Fe/TiO2Doping with metal atoms and deposition of metals10% EthanolXenon lamp, 500 W (λ > 400 nm)2480.1[22]
Ni/TiO2205
Ag/TiO2265
Fe-Ni/TiO2348
Fe/Ag/TiO2512
Ni/Ag/TiO2336
Fe-Ni/Ag/TiO27930.2
Cr-N@TiO2Doping with non-metal atoms and metal cations10% GlycerolMedium pressure mercury lamp, 450 W126-[24]
Co-N@TiO2313
Ni-N@TiO2506
Cu-N@TiO21615
1.5% Au@TiO2 (nanotubes)Vacuum-assisted-impregnation route25% MethanolXenon lamp,
100 mW·cm−1
(λ > 400 nm)
4820.1[33]
1.5% Au/TiO2 (nanotubes)223
CuOx/TiO2Surface deposition of metals0.5% GlycerolLED source, 30 W
(λ = 380 nm)
550-[12]
Pt/TiO21350
80% Cu2O/TiO2Microemulsion method20% MethanolXenon lamp215-[34]
60% Cu2O/TiO2892
40% Cu2O/TiO21242
30% Cu2O/TiO21388
20% Cu2O/TiO21345
TiO228
Cu2O3
2% Cu/TiO2Impregnation reduction25% MethanolUV lamp,
300 W (λ = 340 nm)
5000-[35]
2% Ni/TiO22300
2% Co/TiO22250
2% Zn/TiO2200
2% Cu/TiO2Halogen lamp,
500 W (λ > 420 nm)
220-
2% Ni/TiO210
2% Co/TiO220
2% Zn/TiO211
Table 5. Activity of synthesized photocatalysts.
No.SampleCatalytic Activity, mmol (H2) g−1 h−1
381 nm427 nm
Cu/TiO2 (Degussa P25)
11% CuOx/DTiO20.5 ± 0.050
21% CuOx/DTiO2 T6000.6 ± 0.06-
31% CuOx/DTiO2 T6501.0 ± 0.10.2 ± 0.02
41% CuOx/DTiO2 T7001.0 ± 0.10.5 ± 0.05
51% CuOx/DTiO2 T7501.3 ± 0.10.5 ± 0.05
62% CuOx/DTiO2 T6000.7 ± 0.07
72% CuOx/DTiO2 T6501.4 ± 0.10.3 ± 0.03
82% CuOx/DTiO2 T7002.0 ± 0.10.5 ± 0.05
92% CuOx/DTiO2 T7502.5 ± 0.250.5 ± 0.05
105% CuOx/DTiO2 T6000.6 ± 0.06
115% CuOx/DTiO2 T6501.6 ± 0.20.1 ± 0.01
125% CuOx/DTiO2 T7002.4 ± 0,20.6 ± 0.06
135% CuOx/DTiO2 T7502.2 ± 0.20.4 ± 0.04
1410% CuOx/DTiO2 T7001.4 ± 0.1
1510% CuOx/DTiO2 T7501.0 ± 0.1
Cu/TiO2 (Hombifine N)
165% CuOx/HTiO2 T6000.4 ± 0.04
175% CuOx/HTiO2 T6500.4 ± 0.04
185% CuOx/HTiO2 T7000.1 ± 0.01
195% CuOx/HTiO2 T7500.2 ± 0.02
201% CuOx/HTiO2 T6500.3 ± 0.03
211% CuOx/HTiO2 T7000.2 ± 0.02
221% CuOx/HTiO2 T7500.2 ± 0.02
Publisher’s Note: MDPI stays neutral with regard to jurisdictional claims in published maps and institutional affiliations.

