Article

Facile Synthesis, Characterization, and Photocatalytic Evaluation of In2O3/SnO2 Microsphere Photocatalyst for Efficient Degradation of Rhodamine B

1
School of Science, Xi’an Polytechnic University, Xi’an 710048, China
2
Guangxi Key Laboratory of Processing for Nonferrous Metals and Featured Material, School of Resources, Environment and Materials, Guangxi University, Nanning 530004, China
*
Authors to whom correspondence should be addressed.
Nanomaterials 2022, 12(18), 3151; https://doi.org/10.3390/nano12183151
Submission received: 23 August 2022 / Revised: 3 September 2022 / Accepted: 9 September 2022 / Published: 11 September 2022
(This article belongs to the Special Issue Nanophotonics and Optoelectronic Devices)

Abstract

:
The tin dioxide (SnO2) photocatalyst has a broad application prospect in the degradation of toxic organic pollutants. In this study, micron-sized spherical SnO2 and flower indium oxide (In2O3) structures were prepared by a simple hydrothermal method, and the In2O3/SnO2 composite samples were prepared by a “two-step method”. Using Rhodamine B (RhB) as a model organic pollutant, the photocatalytic performance of the In2O3/SnO2 composites was studied. The photocurrent density of 1.0 wt.% In2O3/SnO2 was twice that of pure SnO2 or In2O3, and the degradation rate was as high as 97% after 240 min irradiation (87% after 120 min irradiation). The reaction rate was five times that of SnO2 and nine times that of In2O3. Combined with the trapping experiment, the transient photocurrent response, and the corresponding characterization of active substances, the possible degradation mechanism was that the addition of In2O3 inhibited the efficiency of electron–hole pair recombination, accelerated the electron transfer and enhanced the photocatalytic activity.

1. Introduction

The rapid development of modern industry has led to a large number of new organic pollutants that are difficult to degrade into water bodies, which pose a significant potential threat to human, animal and environmental health [1]. Therefore, there is an urgent need for economic and efficient catalysts and technologies to degrade organic pollutants [2]. It is worth noting that the textile industry discharges the largest amount of dye wastewater, accounting for almost half of the organic pollutant wastewater worldwide [3]. Textile dyes are also classified as carcinogenic and neurotoxic, causing respiratory infections, skin, gastrointestinal irritation and eye infections, with developmental and mimic toxicity in animals and humans [4]. Therefore, it is still a great challenge to find an efficient method for handling industrial wastewater.
The catalysts are the “chip” of wastewater treatment, which have always been closely related to the development and application of the modern chemical industry, and are also emerging as a potential material to promote energy conversion and storage applications [5,6]. In recent years, advanced oxidation processes (AOPs) have received more and more attention as an effective method to decompose organic wastewater [7]. At the same time, researchers emphasize that the varying chemical and structural properties of catalysts should be the focus when analyzing the active factors of catalysts [8]. It is well known that various AOPs have been used for the decontamination of wastewater, in which photocatalytic degradation is one of the most fascinating techniques owing to its simplicity, superior removal efficiency and lack of secondary pollution.
Rhodamine B (RhB) is one of the most toxic dyes in textile wastewater. Due to its high stability and non-biodegradability, it is often chosen as a typical model dye for photocatalytic degradation experiments. Many scientists tried to degrade RhB with different semiconductor photocatalysts, such as TiO2 [9], SnO2 [10], ZnO [11], WO3 [12] and In2O3 [13]. Among all the photocatalysts, due to its advantages of environmental friendliness, non-toxicity, low cost, excellent photoelectrochemical properties, and especially its lower conduction band (CB) position, SnO2 is a better electron acceptor than TiO2 and ZnO [14]. However, due to the high recombination rate of photogenerated electron–hole pairs in pure SnO2, the photocatalytic efficiency is low. Therefore, it is crucial to promote the photocatalytic performance of SnO2 by accelerating the separation of photoinduced charge pairs. In particular, the preparation of composites by coupling SnO2 with other photocatalytic materials has been shown to be an effective strategy for suppressing the rapid complexation of photogenerated electron–hole pairs [15]. Furthermore, the photocatalytic activity of SnO2 is significantly enhanced when the metal oxide is coupled with short-bandgap or wide-bandgap semiconductors [16]. Indium oxide (In2O3) is also an important metal–oxide semiconductor, which has been proved to be an effective sensitizer. Due to its perfect physicochemical properties, aqueous stability and low toxicity, it is a suitable candidate for the effective photodegradation of pollutants in wastewater [17]. Therefore, the coupling effect of SnO2 and In2O3 was chosen to enhance the photocatalytic activity.
In this study, micron-sized spherical SnO2 and flower In2O3 structures were prepared by a simple hydrothermal method. In2O3-doped SnO2 (In2O3/SnO2) samples with different percentages of In2O3 contents were prepared by a “two-step method”. The crystal structure and physical properties of the In2O3/SnO2 composites were studied in detail. Using RhB as a model organic pollutant, the photocatalytic performance of the In2O3/SnO2 composites was studied. Finally, the photodegradation mechanism of the In2O3/SnO2 composites was discussed.

2. Materials and Methods

2.1. Materials

All the chemicals used in this study were purchased from Sinopharm Chemical Reagent Co., Ltd. (Shanghai, China), and were of analytical grade purity and did not require further purification. All the solutions were prepared with deionized (DI) water.

2.2. Synthesis of Photocatalysts

SnO2 was prepared by the hydrothermal method [18]. Firstly, 1.4 g SnCl4·5H2O, 2.94 g Na3C6H5O7·2H2O and 0.16 g NaOH were dissolved in a mixture of 30 mL absolute ethanol and 45 mL deionized (DI) water, and then stirred vigorously for 1 h to form a homogeneous solution. Then, it was transferred to a Teflon-lined stainless-steel autoclave and heated at 180 °C for 12 h. After cooling to room temperature, the precipitate was collected by centrifugation, then washed successively with deionized water and absolute ethanol. Finally, the obtained SnO2 was dried at 60 °C in air for 12 h.
In2O3 was also prepared by a simple hydrothermal route [19]. Firstly, 0.42 g InCl3·4H2O and 1.22 g sodium dodecyl sulfate (SDS) were dispersed into 80 mL deionized water and stirred for 30 min. Next, 0.42 g CO(NH2)2 was added to the above mixed solution and stirred vigorously for 1 h. The solution was completely dissolved and transferred to a stainless-steel autoclave lined with Teflon, placed in an electric oven and heated at 120 °C for 12 h. The following steps were the same as synthesizing the SnO2. Finally, the synthesized samples were calcined in a Muffle furnace at 500 °C for 2 h at a heating rate of 2 °C/min. After cooling to room temperature, In2O3 was obtained.
In2O3/SnO2 was prepared by the hydrothermal method. Firstly, 30 mL absolute ethanol and 45 mL DI water were mixed and stirred for 30 min to form solution A. Different amounts of In2O3 were dispersed into solution A and ultrasonically dispersed for 30 min to form solution B. Next, 1.4 g SnCl4·5H2O was added to solution B and fully dissolved. Then, 2.94 g Na3C6H5O7·2H2O was added and stirred for 20 min until completely dissolved. Finally, 0.16 g NaOH was added and stirred for 10 min to form solution C. The following steps were the same as the synthesis of SnO2. The synthesized sample was calcined in Muffle furnace at 700 °C for 1 h. After cooling to room temperature, the composite material In2O3/SnO2 was synthesized. The amounts of In2O3 were 0.1, 0.5, 1.0 and 1.5 wt.%.

2.3. Characterization of Photocatalysts

The crystal structure of the composite was studied by Mini Flex600 X-ray diffractometry (XRD, Rigaku, Tokyo, Japan, Cu-Kα, 10°~80°, 5° min−1). A field emission scanning electron microscope (SEM, Oxford Anta-450, FEI, Oxford, England) characterized the morphology of the synthetic materials. Transmission electron microscopy (TEM, Tecnai G2, FEI, Oxford, England) was used to obtain the morphology and element distribution. The surface chemical composition was investigated by X-ray photoelectron spectroscopy (XPS, Thermo ESCALAB 250X, Waltham, MA, USA, C1s revised at 284.8 eV). The absorption spectra were carried out by a UV–Visible spectrophotometer (Lambda 750, Perkin-Elmer, Shelton, CT, USA) and the electron–hole binding capacity was examined by photoluminescence spectroscopy (PL, HORIBA FluoroMax-4, Piscataway, NJ, USA) using an excitation wavelength of 320 nm.

2.4. Photocatalytic Activity Tests

The photocatalytic performances of the catalyst were investigated by the photodegradation of RhB under the ultraviolet light irradiation of a 200 W Hg lamp (CEL-LAM500, Beijing Au Light, Beijing, China). In all the experiments, 50 mg of the catalyst powder was dispersed into 50 mL of the RhB solution (10 mg·L−1). Before the photoreaction began, the solution was magnetically mixed in the dark for 30 min to complete the adsorption–desorption equilibrium. During the photoreaction, 1.6 mL of the suspension was collected every 20 min and centrifuged. The strongest absorption peak of the RhB solution was determined by a UV–Vis–NIR PE Lambda 950 spectrophotometer. In the cycle experiment, the samples were washed with DI and absolute ethanol several times before starting the new cycle photocatalytic test. In addition, triethanolamine (TEA) was used as hole radical, p-benzoquinone (BQ) as a superoxide radical, and tert-butanol (TBA) as a hydroxyl radical.

2.5. Photocurrent Experiments

The photochemical properties of the samples were studied by a photocurrent experiment. The prepared samples were coated onto FTO glass as the working electrode, platinum wire was used as the counter electrode, Ag/AgCl as the counter reference electrode, and 0.1 M Na2SO4 as the electrolyte solution. A bias potential of 0.5 V was applied to the photoanode when the photocurrent test was performed under switching light conditions. Electrochemical impedance spectroscopy (EIS) measurements were carried out in the frequency range of 0.01 Hz–10 kHz in 0.1 M Na2SO4 solution, and were performed using ZENNIUM electrochemical workstation (Zahner Instruments, Kronach, Germany). The electrochemical signals for all the tests were recorded by a CHI660E electrochemical analyzer (Chenhua Instruments, Shanghai, China).

3. Results and Discussion

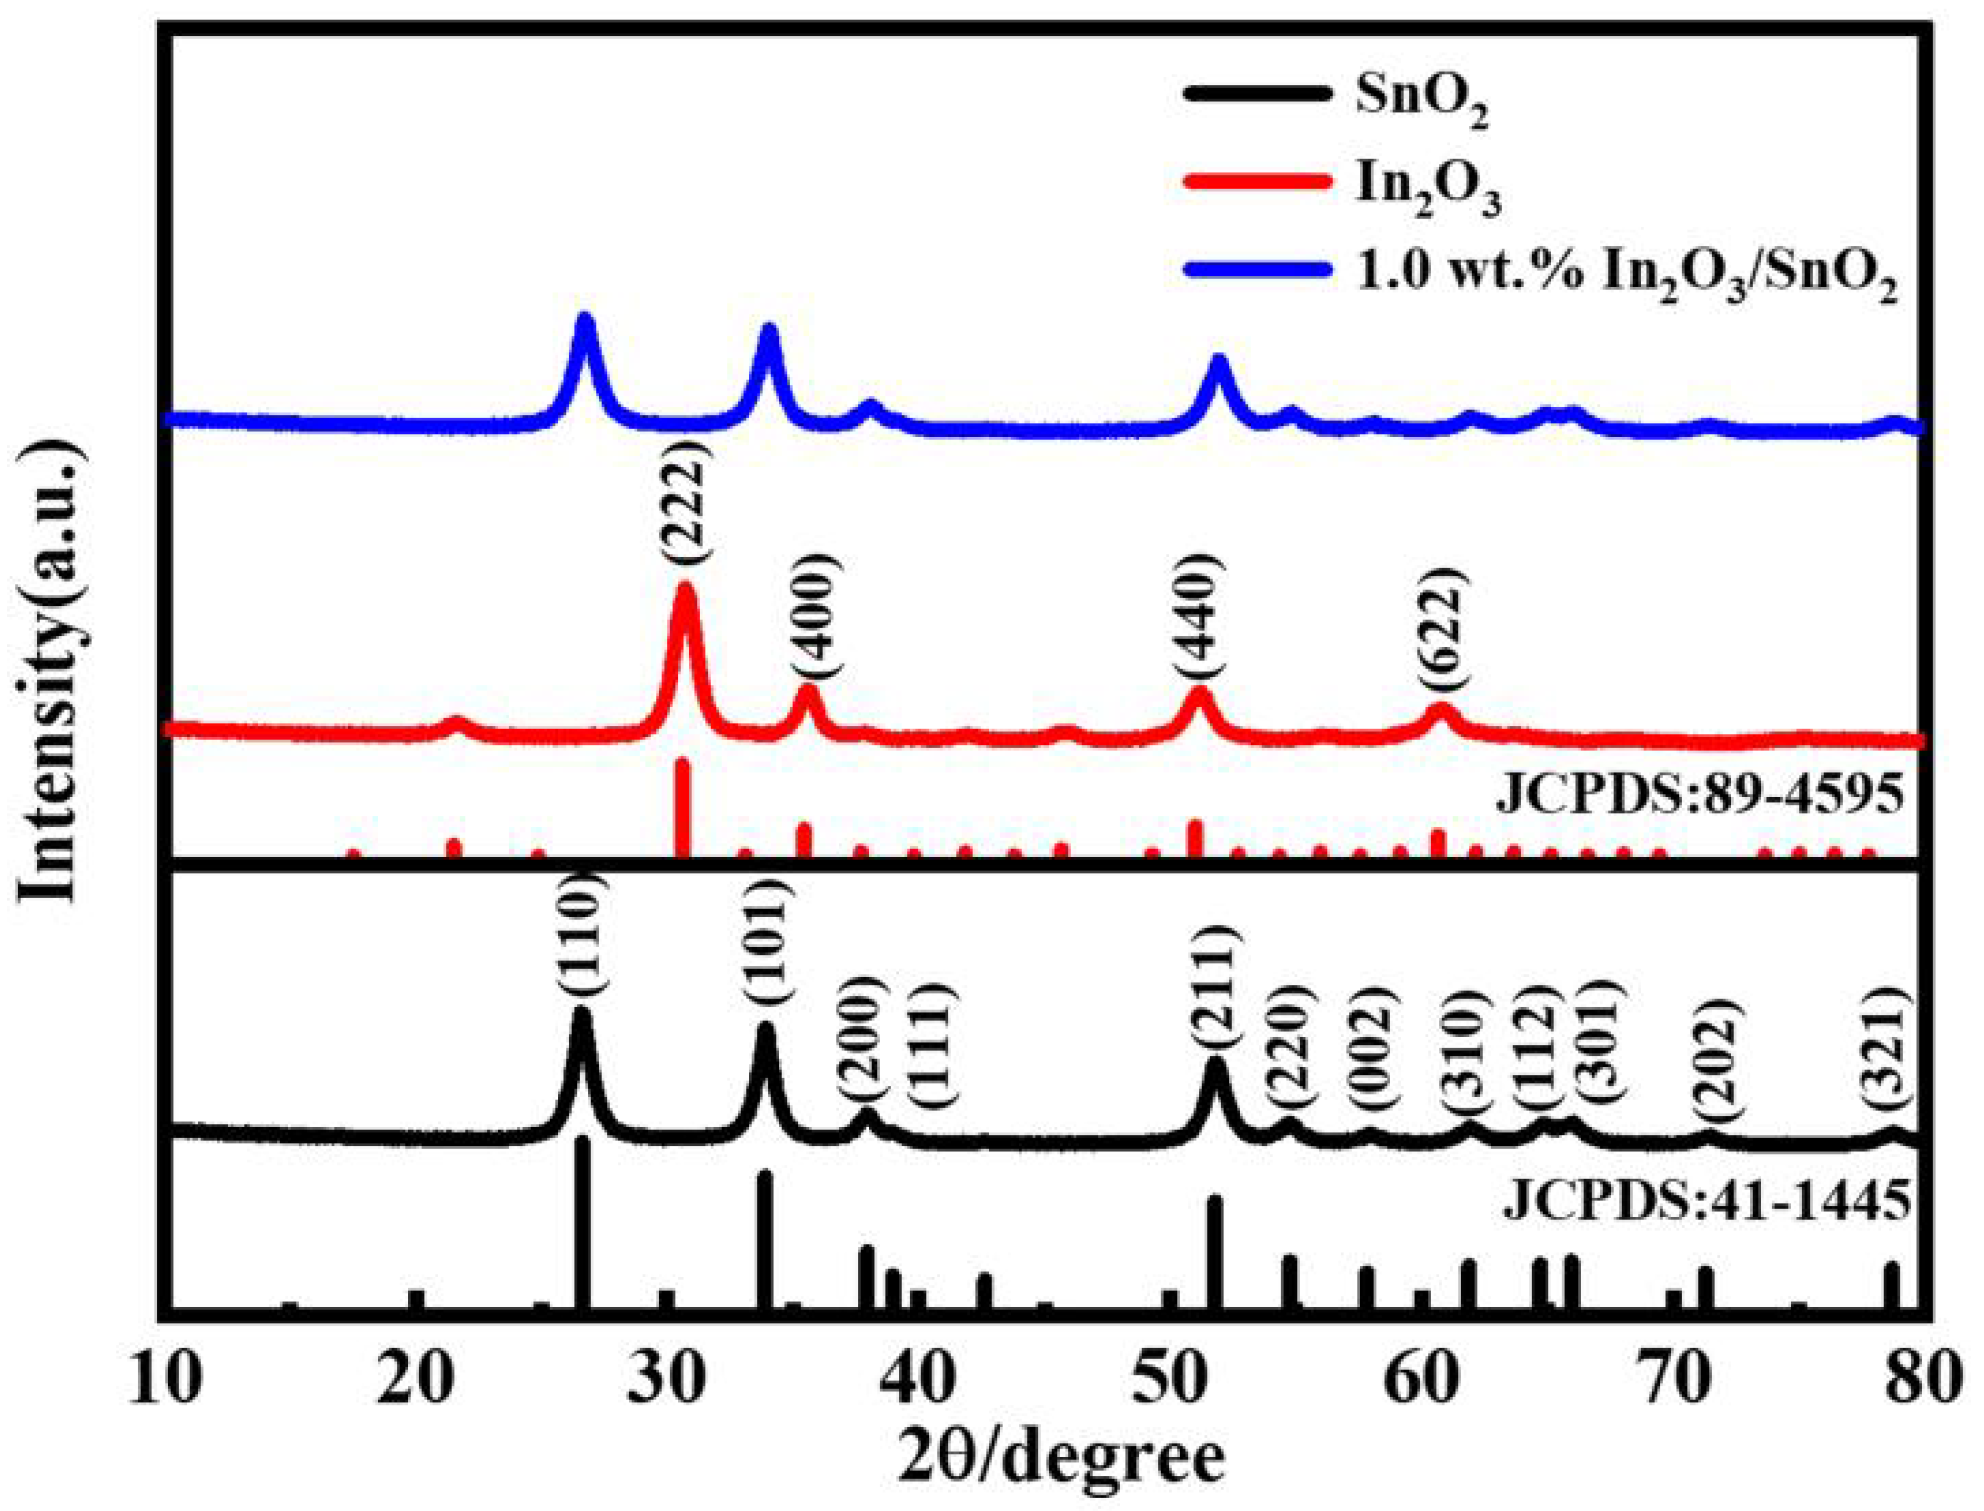
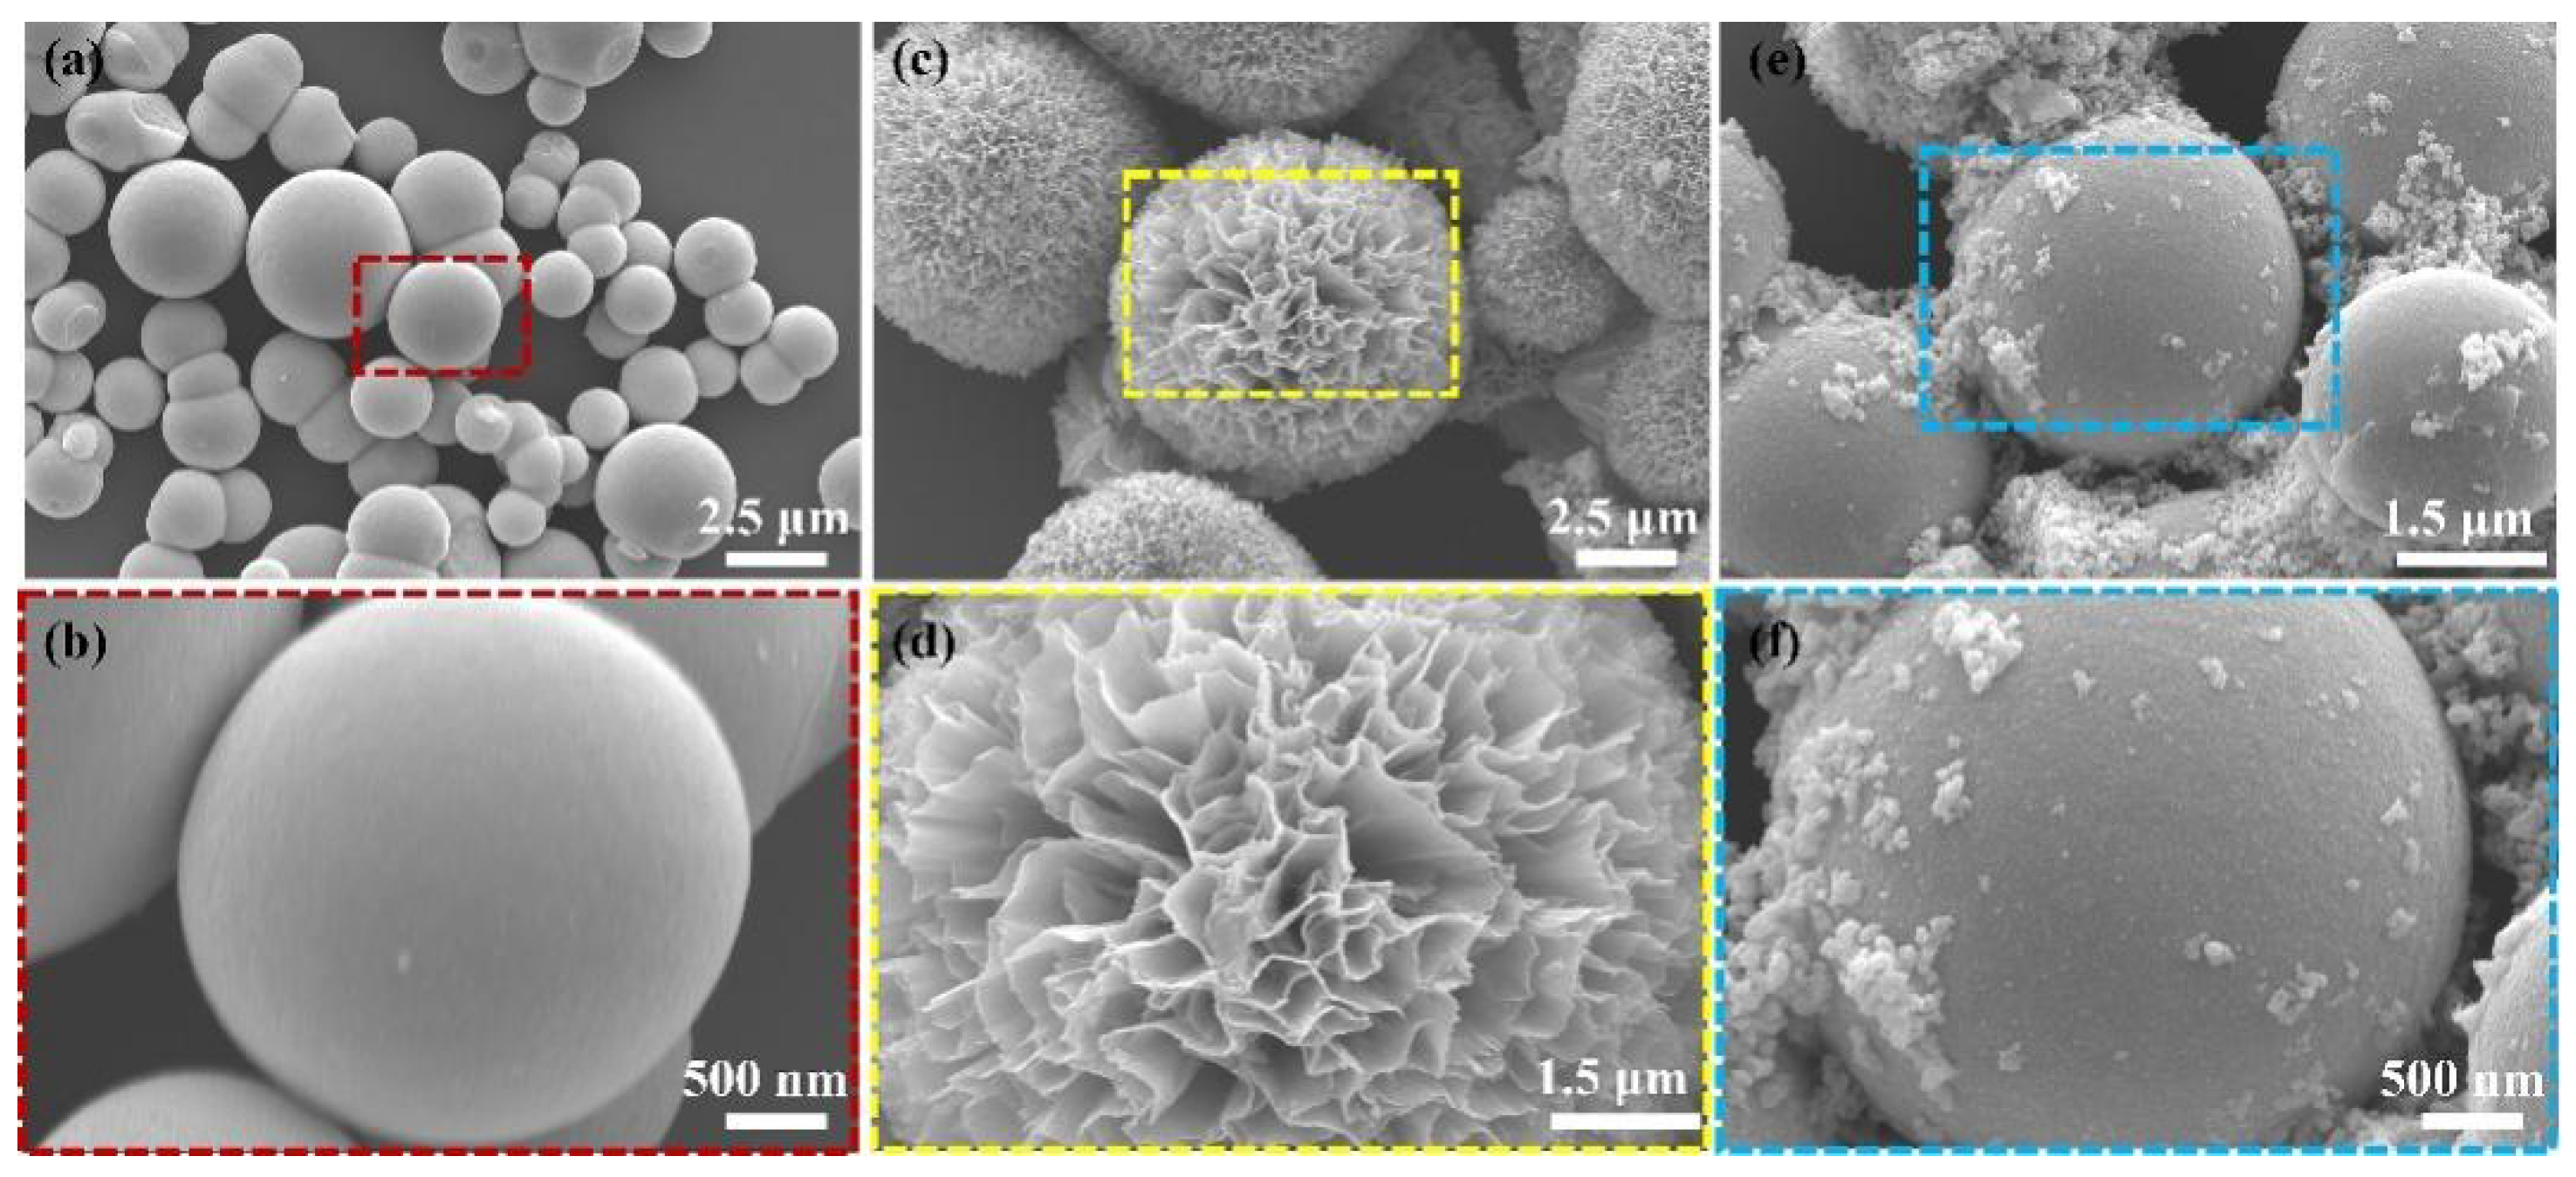
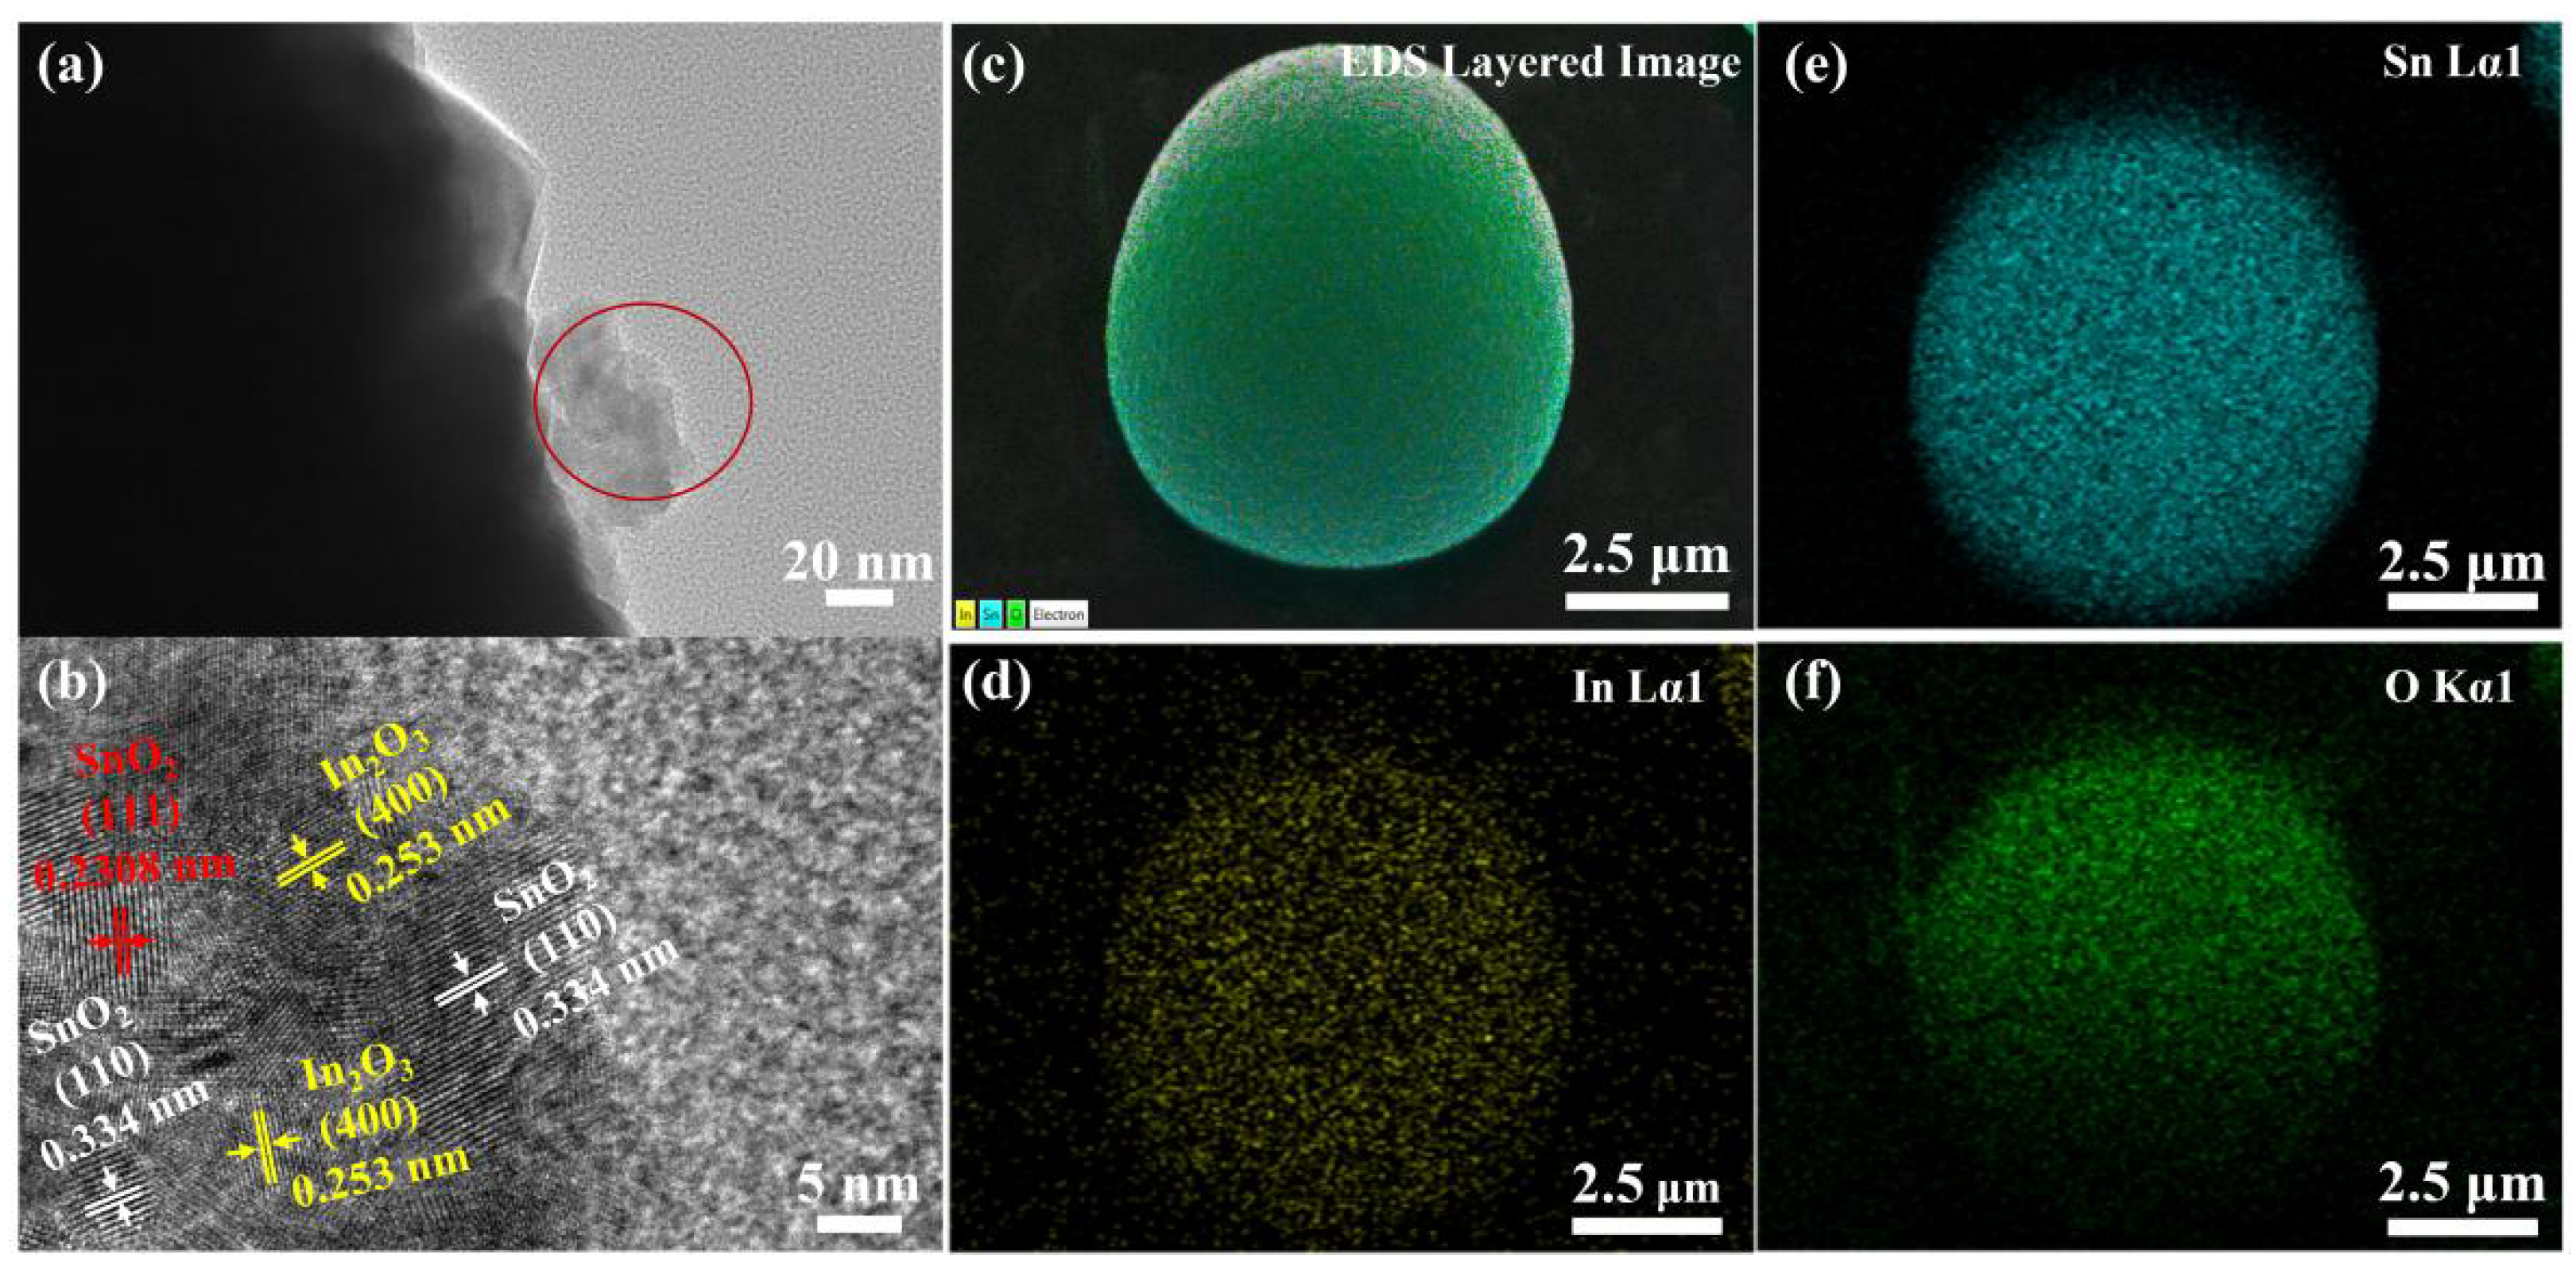
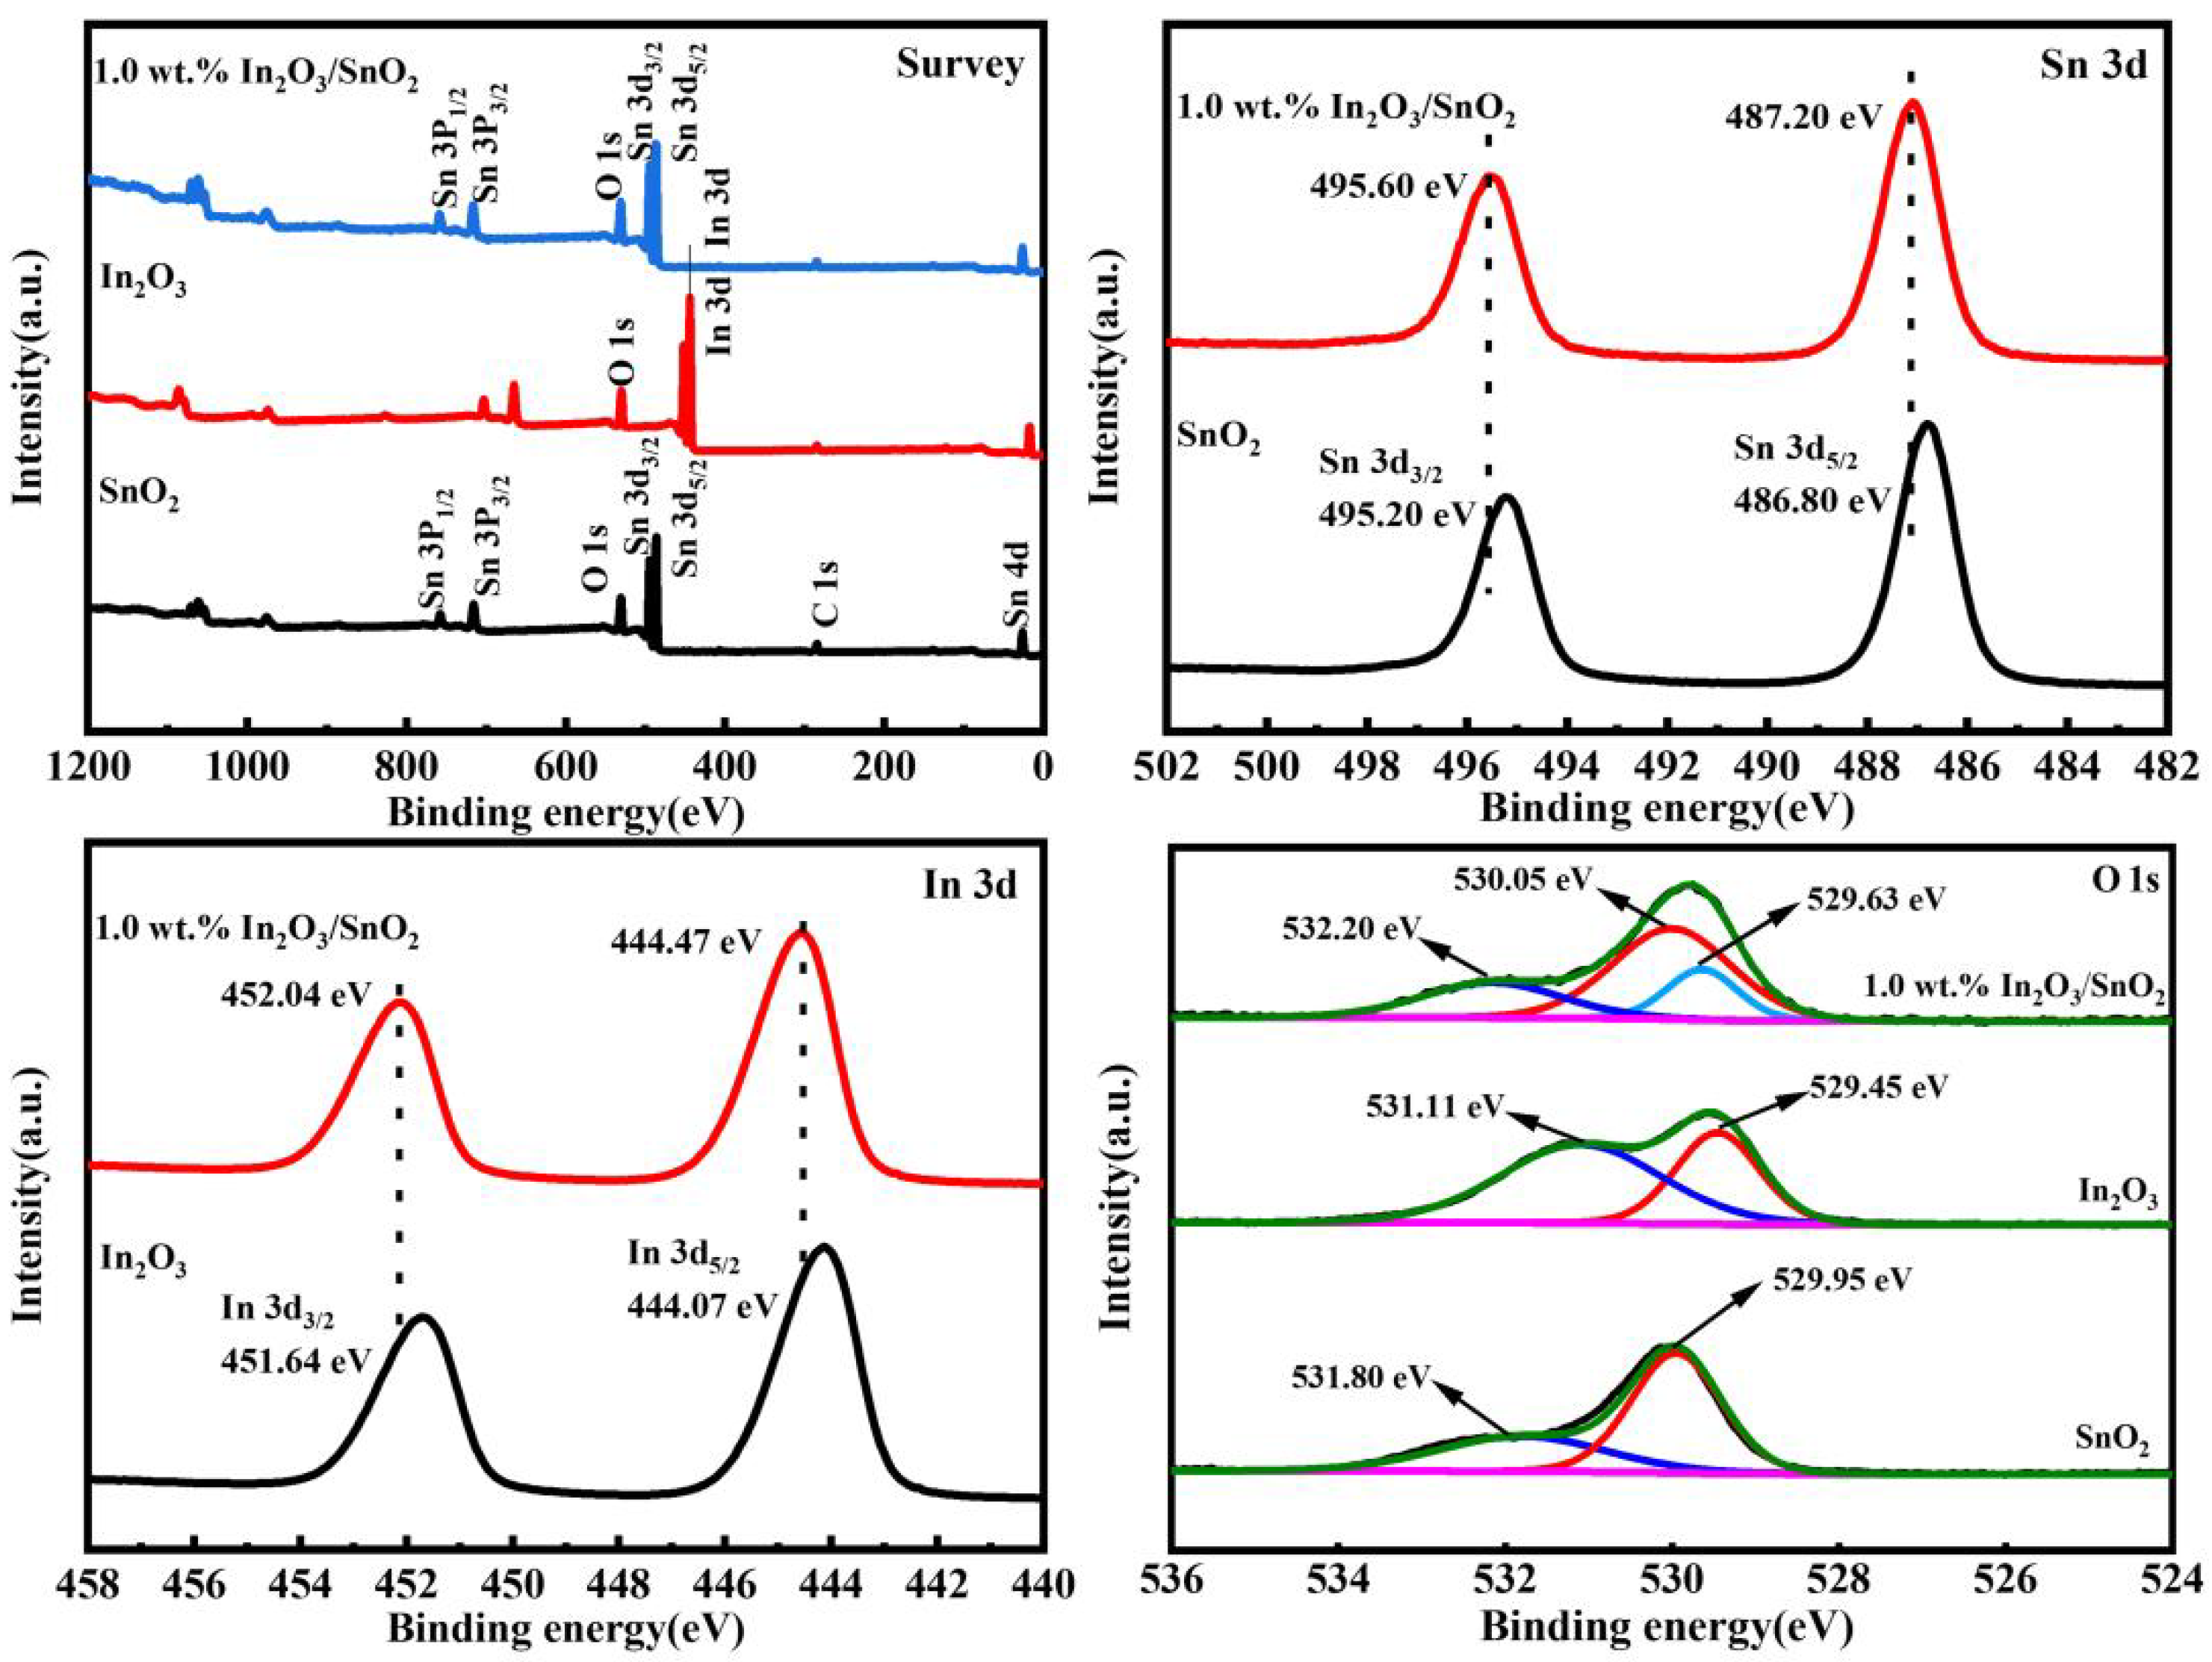
3.1. Morphology and Structure of the Catalyst

The crystalline phases of the synthesized materials were investigated using the XRD method, and the effects are shown in Figure 1. The significant characteristic peaks of pure SnO2 at 2θ = 26.6°, 33.9°, 37.9°, 51.8°, 54.8° and 65.9° were attributed to the (110), (101), (200), (211), (220) and (301) crystal planes of tetragonal SnO2 (JCPDS No.41-1445), respectively [20]. The distinctive characteristic peaks of In2O3 at 2θ = 30.6°, 35.5°, 51.0° and 60.7° were attributed to the (222), (400), (440) and (622) crystal planes of cubic In2O3 (JCPDS No.89-4595), respectively [19]. The SnO2 peak intensity of the 1.0 wt.% In2O3/SnO2 photocatalyst was lower than that of pure SnO2. The study determined that the doping of In2O3 did not appreciably alter the crystal shape of SnO2. This may have also been due to the low-doping-content material of In2O3 in the composites. Additionally, it was shown that “In” was integrated into the SnO2 lattice.
The morphology and structure of the synthesized materials were investigated by SEM. The effects are shown in Figure 2, and Figure 2b,d,f show the magnifications of Figure 2a,c,e, respectively. Figure 2a,b show that SnO2 was a spherical structure in which the particle size was about 2.8 μm. Figure 2c,d show that In2O3 was a three-dimensional flower-like structure consisting of an effective stacking of nanosheets, of which the particle size was about 8.3 μm. Figure 2e,f show the morphological structure of the 1.0 wt.% In2O3/SnO2 photocatalyst, and a layer of In2O3 attached to the surface of SnO2.
TEM and HRTEM analysis was performed on the 1.0 wt.% In2O3/SnO2 composite photocatalyst material. Figure 3a is the TEM image of the 1.0 wt.% In2O3/SnO2 photocatalyst. It was found that not only was a layer of In2O3 attached to the surface of SnO2, but a portion of In2O3 was also embedded in the SnO2 sphere. Figure 3b shows the HRTEM image of the selected part of Figure 3a. The fringes with the surface spacing of 0.2308 nm and 0.334 nm belonged to the lattice surface of SnO2, corresponding to the spacings of (111) and (110) of SnO2 (JPCDS 41-1445), respectively. The fringe with a surface spacing of 0.253 nm belonged to the lattice surface of In2O3, corresponding to the (400) spacing of In2O3 (JCPDS No.89-200 4595). The crystallinity and composition of the samples were analyzed by TEM–EDS. The elemental composition and distribution of the 1.0 wt.% In2O3/SnO2 samples were studied by TEM–EDS spectroscopy (Figure 3c–f). In the 1.0 wt.% In2O3/SnO2 sample, the elements of Sn, In and O were uniformly distributed. These results confirmed the formation of the In2O3/SnO2 heterostructure, which was beneficial for suppressing electron–hole recombination.
The chemical state and surface composition of the synthesized materials were investigated by XPS. As shown in Figure 4a, the XPS survey spectrum showed characteristic peaks of Sn, In, O and C elements. The spectrum was calibrated relative to the C-element peak. Figure 4b shows the Sn3d spectrum of SnO2 with two peaks at 486.80 eV and 495.20 eV for the Sn3d5/2 and Sn3d3/2 orbitals of Sn4+, respectively [21]. In addition, after binding with In2O3, the binding energies of Sn3d5/2 and Sn3d3/2 of the 1.0 wt.% In2O3/SnO2 photocatalyst shifted to 487.20 eV and 495.60 eV, respectively.
Figure 4c shows that the In3d spectrum of In2O3 has two peaks at 440.07 eV and 451.64 eV, belonging to the In3d5/2 and In3d3/2 orbitals of In3+, respectively [22]. In addition, the binding energies of the 1.0 wt.%In2O3/SnO2 photocatalysts for In3d5/2 and In3d3/2 were shifted to 444.47 eV and 452.04 eV, respectively. The characteristic peaks of Sn3d and In3d for the 1.0 wt.% In2O3/SnO2 photocatalyst had a negative shift of 0.4 eV. This was due to the strong electronic interaction between SnO2 and In2O3, was beneficial to improve the migration efficiency of photogenerated carriers at the interface [23].
Figure 4d shows the XPS spectra of In2O3, SnO2 and the 1.0 wt.% In2O3/SnO2 photocatalyst O1s. The asymmetric O1s in SnO2 was decomposed into two peaks located around 529.95 eV and 531.80 eV. One of the bands placed at 531.80 eV (Ov) belonged to the O atoms close to OVs or hydroxyl-like groups. Another band at 529.95 eV (Olatt) was viewed to be the Sn-O-Sn oxygen bond. The asymmetric O1s in In2O3 was decomposed into two peaks. One of the bands at 531.11 eV (Ov) belonged to the O atoms close to OVs or hydroxyl-like groups. Another band at 529.45 eV (Olatt) was considered to be the In-O-In oxygen bond. The O1s spectrum of the 1.0 wt.% In2O3/SnO2 photocatalyst was decomposed into three peaks. The binding energy around 529.63 eV corresponded to the lattice oxygen of the In-O-In bond, the binding energy around 530.05 eV corresponded to the lattice oxygen of the Sn-O-Sn bond, and the peak at 532.20 eV should be from the oxygen of the -OH group at the composite surface [21]. All the binding energies were negatively shifted relative to those of pure SnO2 and In2O3. The XPS analysis implied the coexistence of SnO2 and In2O3 in the 1.0 wt.% In2O3/SnO2 photocatalyst.
The optical absorption characteristics and bandgaps of In2O3, SnO2 and the 1.0 wt.% In2O3/SnO2 were studied by UV–Vis DRS. As shown in Figure 5a, the absorption edges of In2O3, SnO2 and the 1.0 wt.% In2O3/SnO2 were located at about 550, 459 and 455 nm, respectively. Compared with pure SnO2, the absorption edge of the 1.0 wt.% In2O3/SnO2 showed a slight red shift, which indicated that the composite photocatalyst had the most reliable absorption capacity. The absorbing edge was calculated using the usual Tauc’s diagram [24]:
( α h v ) n = A ( h v E g )
where α is the absorption coefficient, hυ is the energy of the incident photon, Eg is the optical bandgap energy (hereinafter referred to as the bandgap energy), A is a constant, and n depends on the type of electronic transition. Here, In2O3 and SnO2 were both direct bandgap semiconductors, and their n values were both taken as 2.
As shown in Figure 5b, the Eg obtained by In2O3 and SnO2 were 2.65 eV and 3.19 eV, respectively, and the band energy of the 1.0 wt.% In2O3/SnO2 heterojunction was reduced to 3.04 eV, which was due to the strong interaction between In2O3 and SnO2. In order to find out about the separation mechanism of photogenerated cost carriers in the system of degrading pollutants, the CB and VB potentials of In2O3 and SnO2 were preliminarily calculated by Equation (2):
E C B = E V B E g
ECB and EVB are the conduction band and valence band potential, respectively. Eg is the bandgap of the semiconductor material. As shown in Figure 5c,d, the positive slope of the Mott–Schottky curve confirmed that In2O3 and SnO2 were N-type semiconductors. Compared with saturated Ag/AgCl electrodes, the flat-band potentials of In2O3 and SnO2 were −0.82 and −0.70 eV. The flat-band potentials transformed to NHE were −0.63 eV and −0.51 eV. Meanwhile, the CB position of the N-type semiconductor was 0.1~0.3 eV greater than the flat-band potential [25]. Therefore, the CB potentials of In2O3 and SnO2 were speculated to be −0.93 and −0.81 eV. Combining the CB and bandgap, the VB potentials of the In2O3 and SnO2 were obtained using Equation (2). Therefore, the VB positions of In2O3 and SnO2 were +1.72 eV and +2.38 eV, respectively.

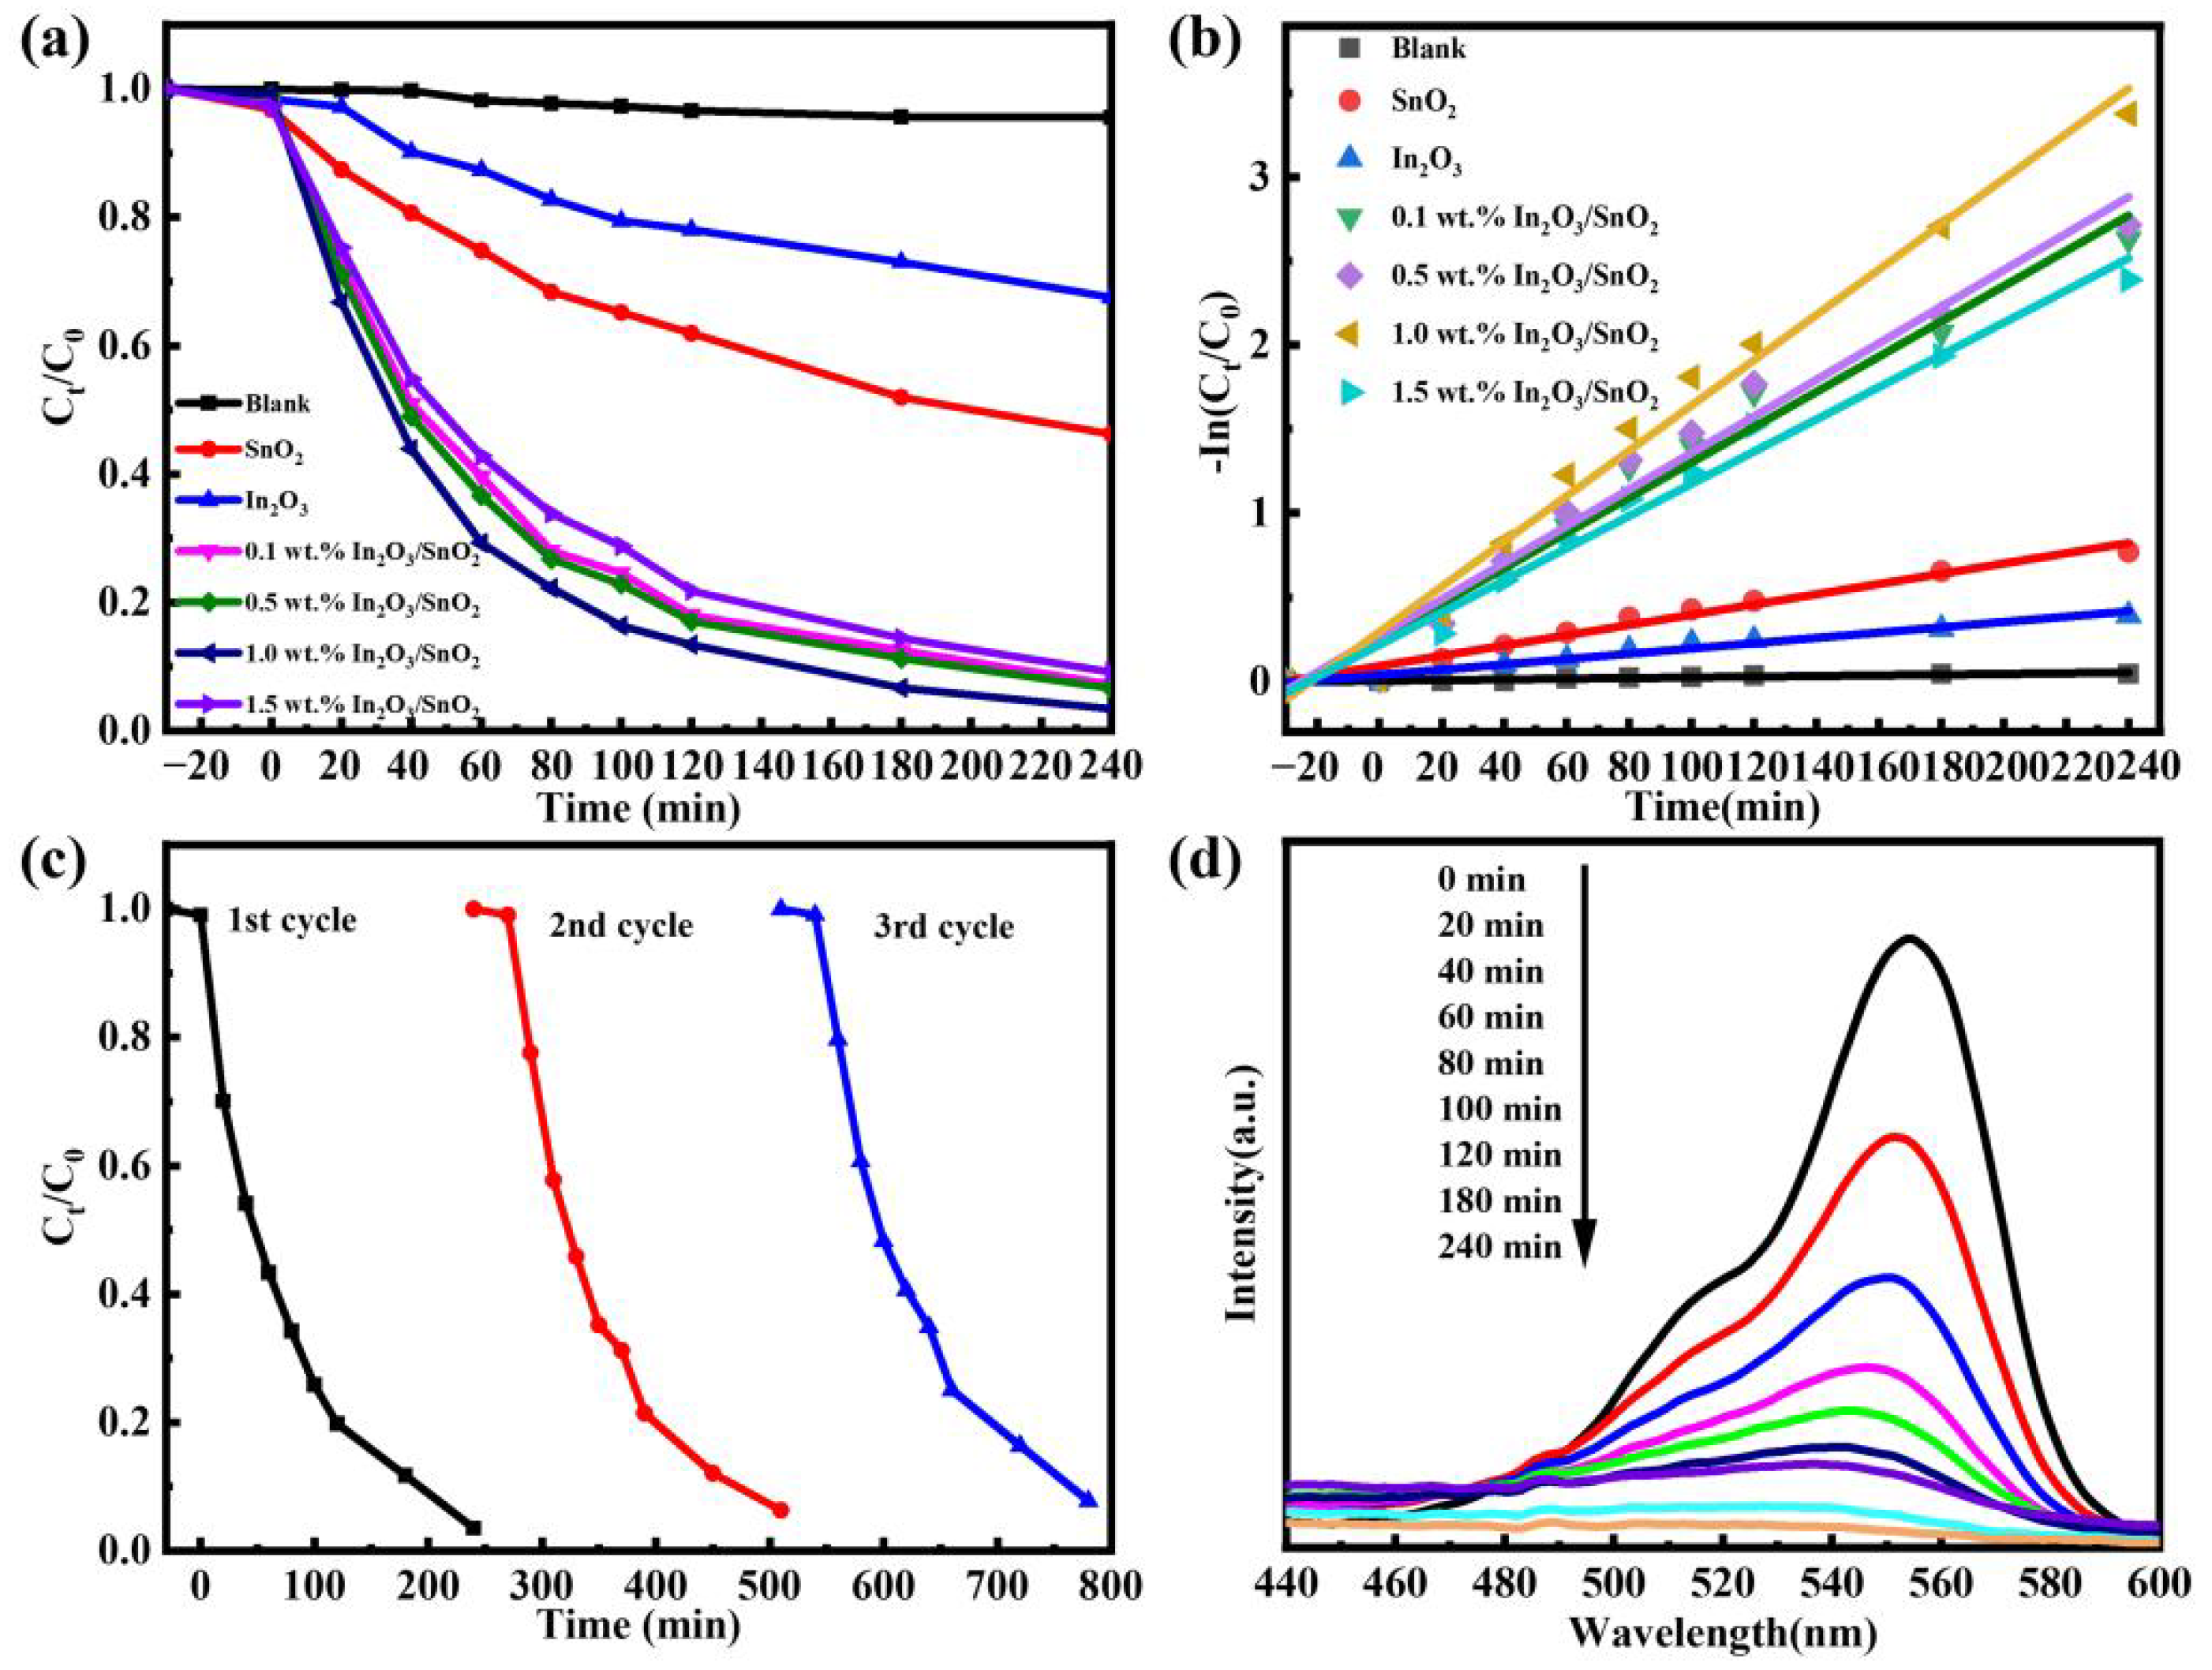
3.2. Photocatalytic Performance

The degradation of RhB was investigated using the synthesized SnO2 samples and In2O3/SnO2 composites under UV light. Figure 6a shows the degradation of RhB. It was observed that the synthesis of the In2O3/SnO2 composites had a synergistic effect on the decomposition of RhB. In total, 54% of RhB was degraded by SnO2 after 240 min of UV-light irradiation. The composite of a small quantity of In2O3 and SnO2 considerably improved the effectivity of the photocatalytic degradation of RhB. The degradation rate of the 1.0 wt.% In2O3/SnO2 composite photocatalyst reached about 97% after 240 min, and reached 87% after 120 min of UV-lamp irradiation.
As shown in Figure 6b, the photodegradation kinetics of the synthesized sample in terms of RhB were investigated. Table 1 shows the photodegradation kinetic constant ln(C0/C) = ĸ · t, the fitting equation, the rate constant ĸ and the correlation coefficient R2. The reaction rate constant of SnO2 was 0.00305 min−1. The reaction rate constant of the 1.0 wt.% In2O3/SnO2 was five and nine times that of SnO2 and In2O3, respectively. This result also indicated that In2O3 facilitates the increase in photoactivity.
We studied the stability and reproducibility of the 1.0 wt.% In2O3/SnO2 photocatalyst. Under the identical experimental conditions, two additional cycles of degradation experiments were performed on RhB. Figure 6c indicates that the degradation rate did not change much after three cycles of the photocatalytic process. The synthesized 1.0 wt.% In2O3/SnO2 photocatalyst had good consistency and reproducibility.
The catalytic degradation process of RhB by the samples was studied. As shown in Figure 6d, the UV–Vis absorption spectrum images of the 1.0 wt.% In2O3/SnO2 for RhB dye degradation at unique times were investigated. During photodegradation, the depth of the attribute height of RhB at 554 nm decreased drastically between 0 min and 240 min of light radiation. The maximum absorption peak was shifted from 554 nm to 526 nm. These changes may have been caused by the generation of intermediates in the reaction mixture as well as the n-demethylation and conjugated structure damage of RhB during photodegradation [26]. The disruption of the conjugated chromophore structure of RhB caused a rapid decrease in RhB uptake, indicating that RhB could be degraded to small molecules such as CO2 and H2O [19]. The above results indicated that the process of n-demethylation and the destruction of the conjugated chromophore structure were synchronized for the duration of the photocatalytic reaction [27].

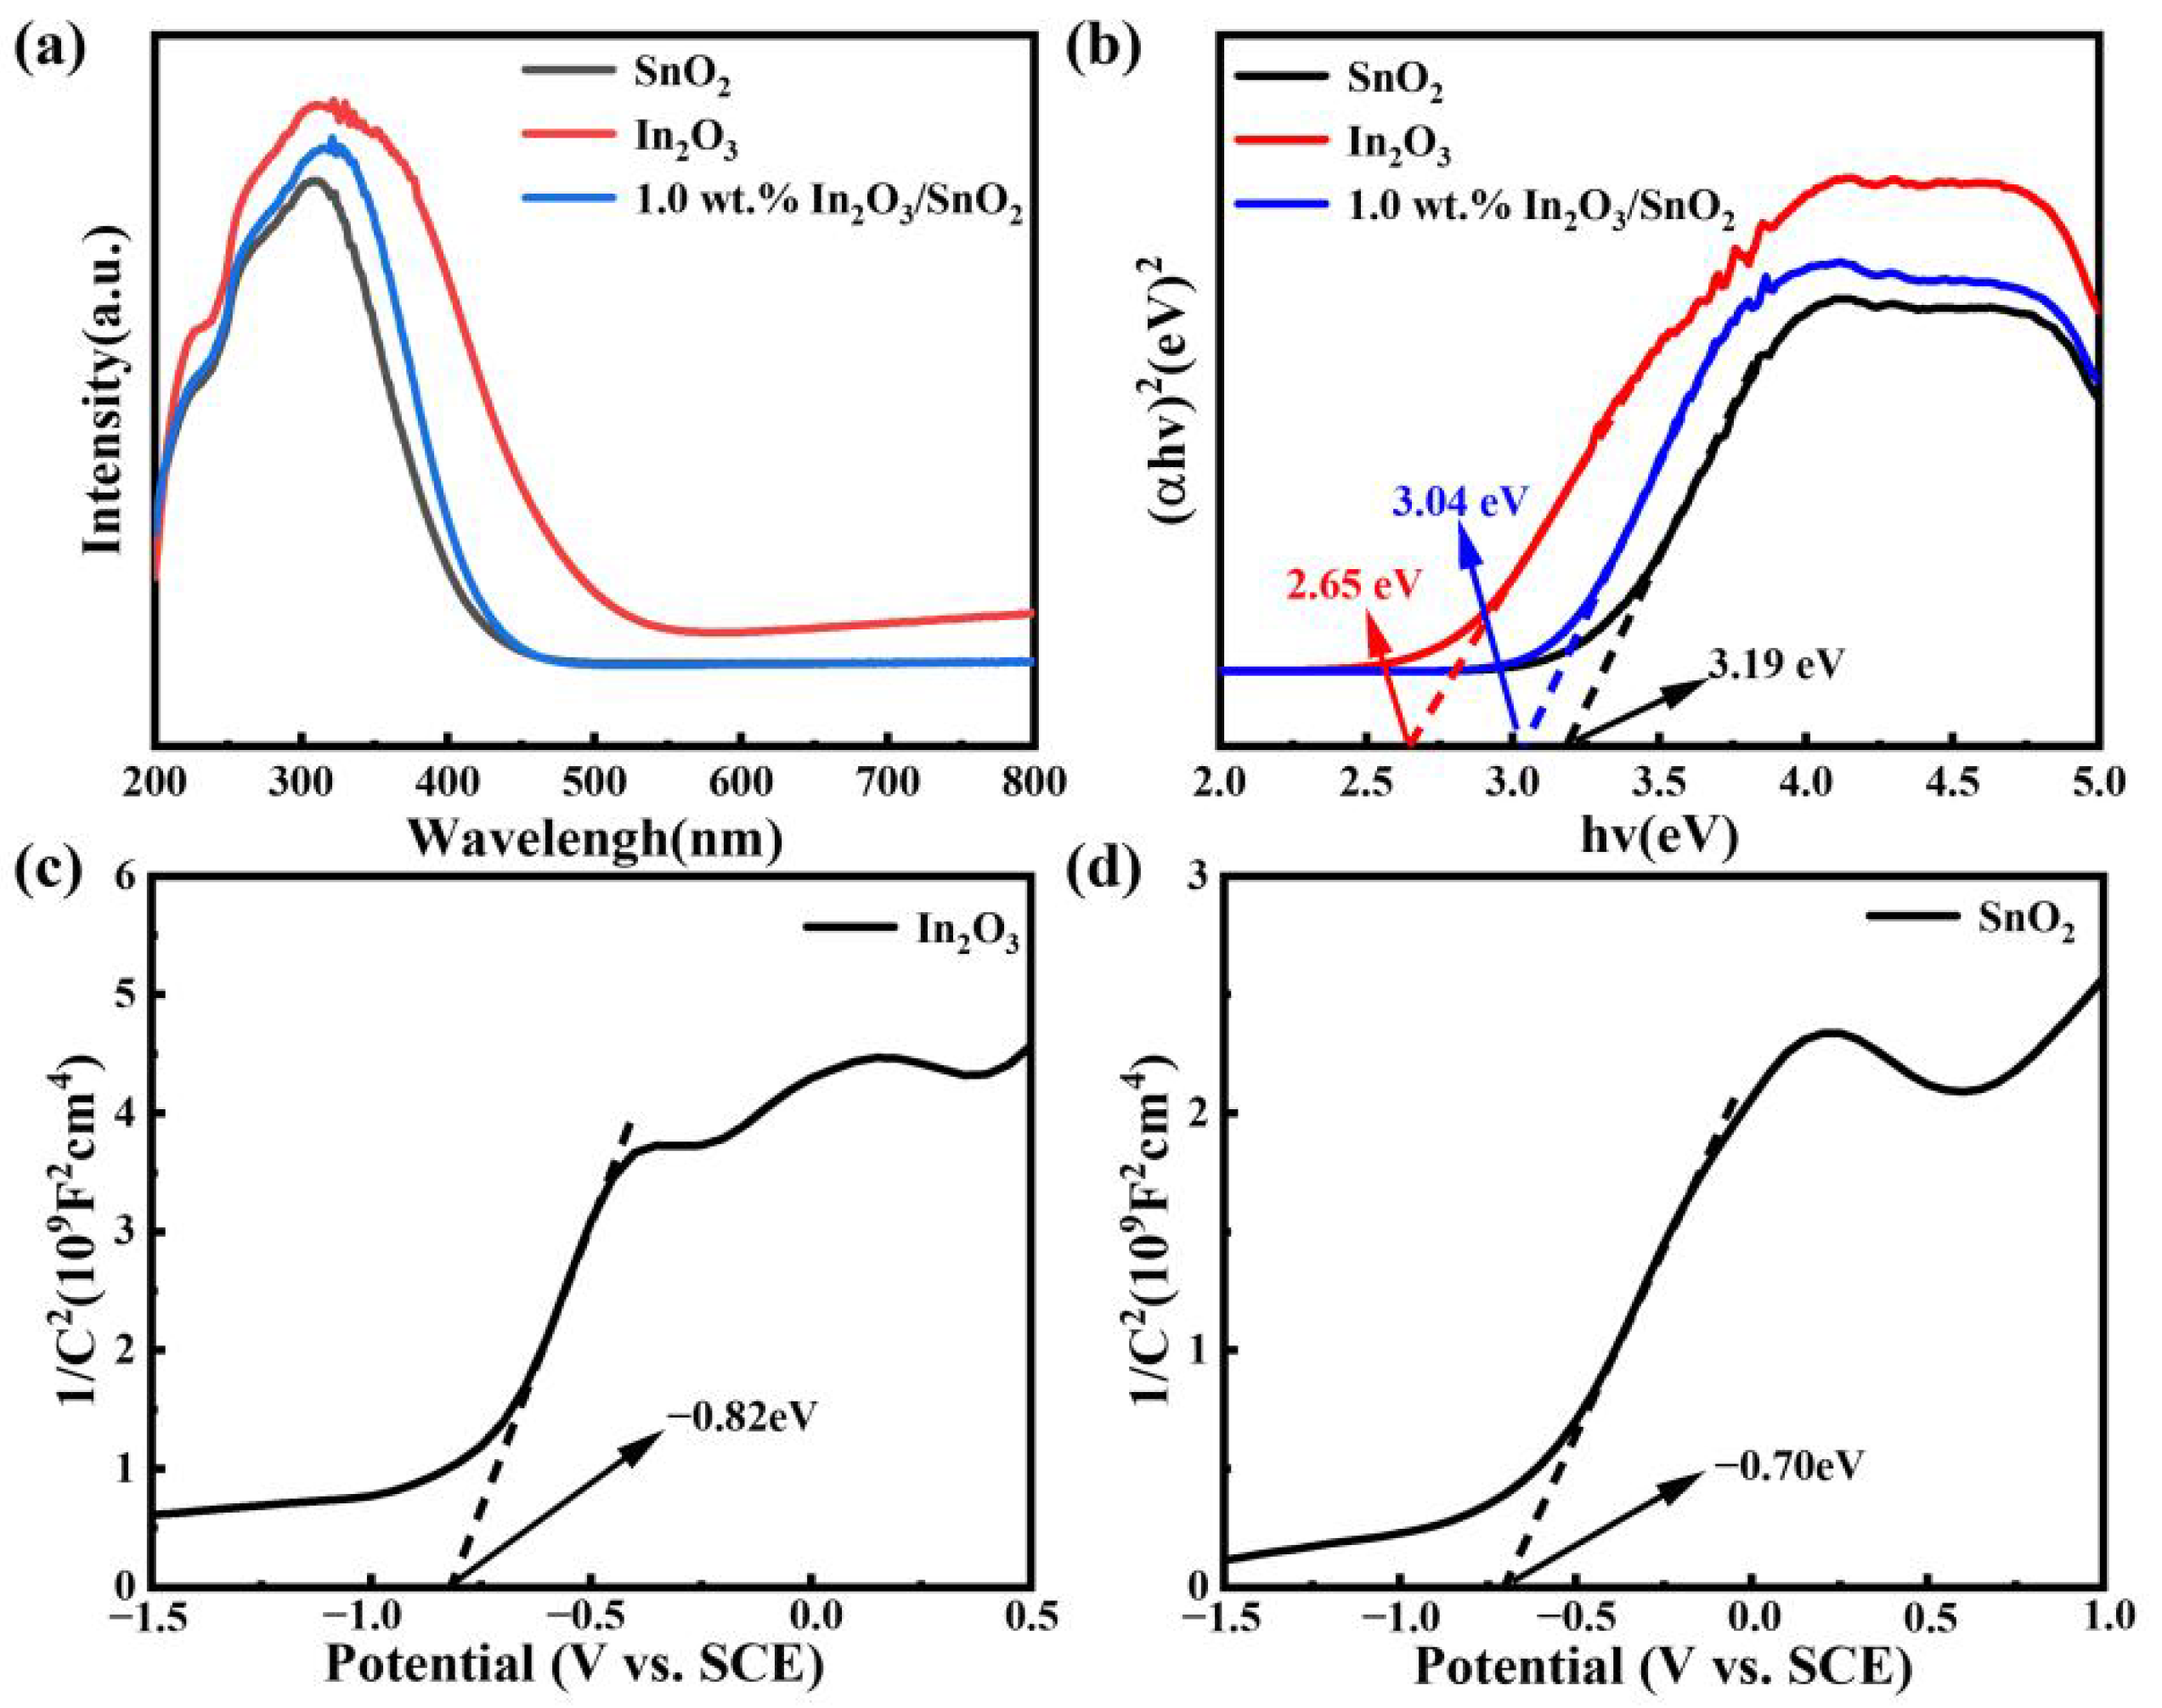
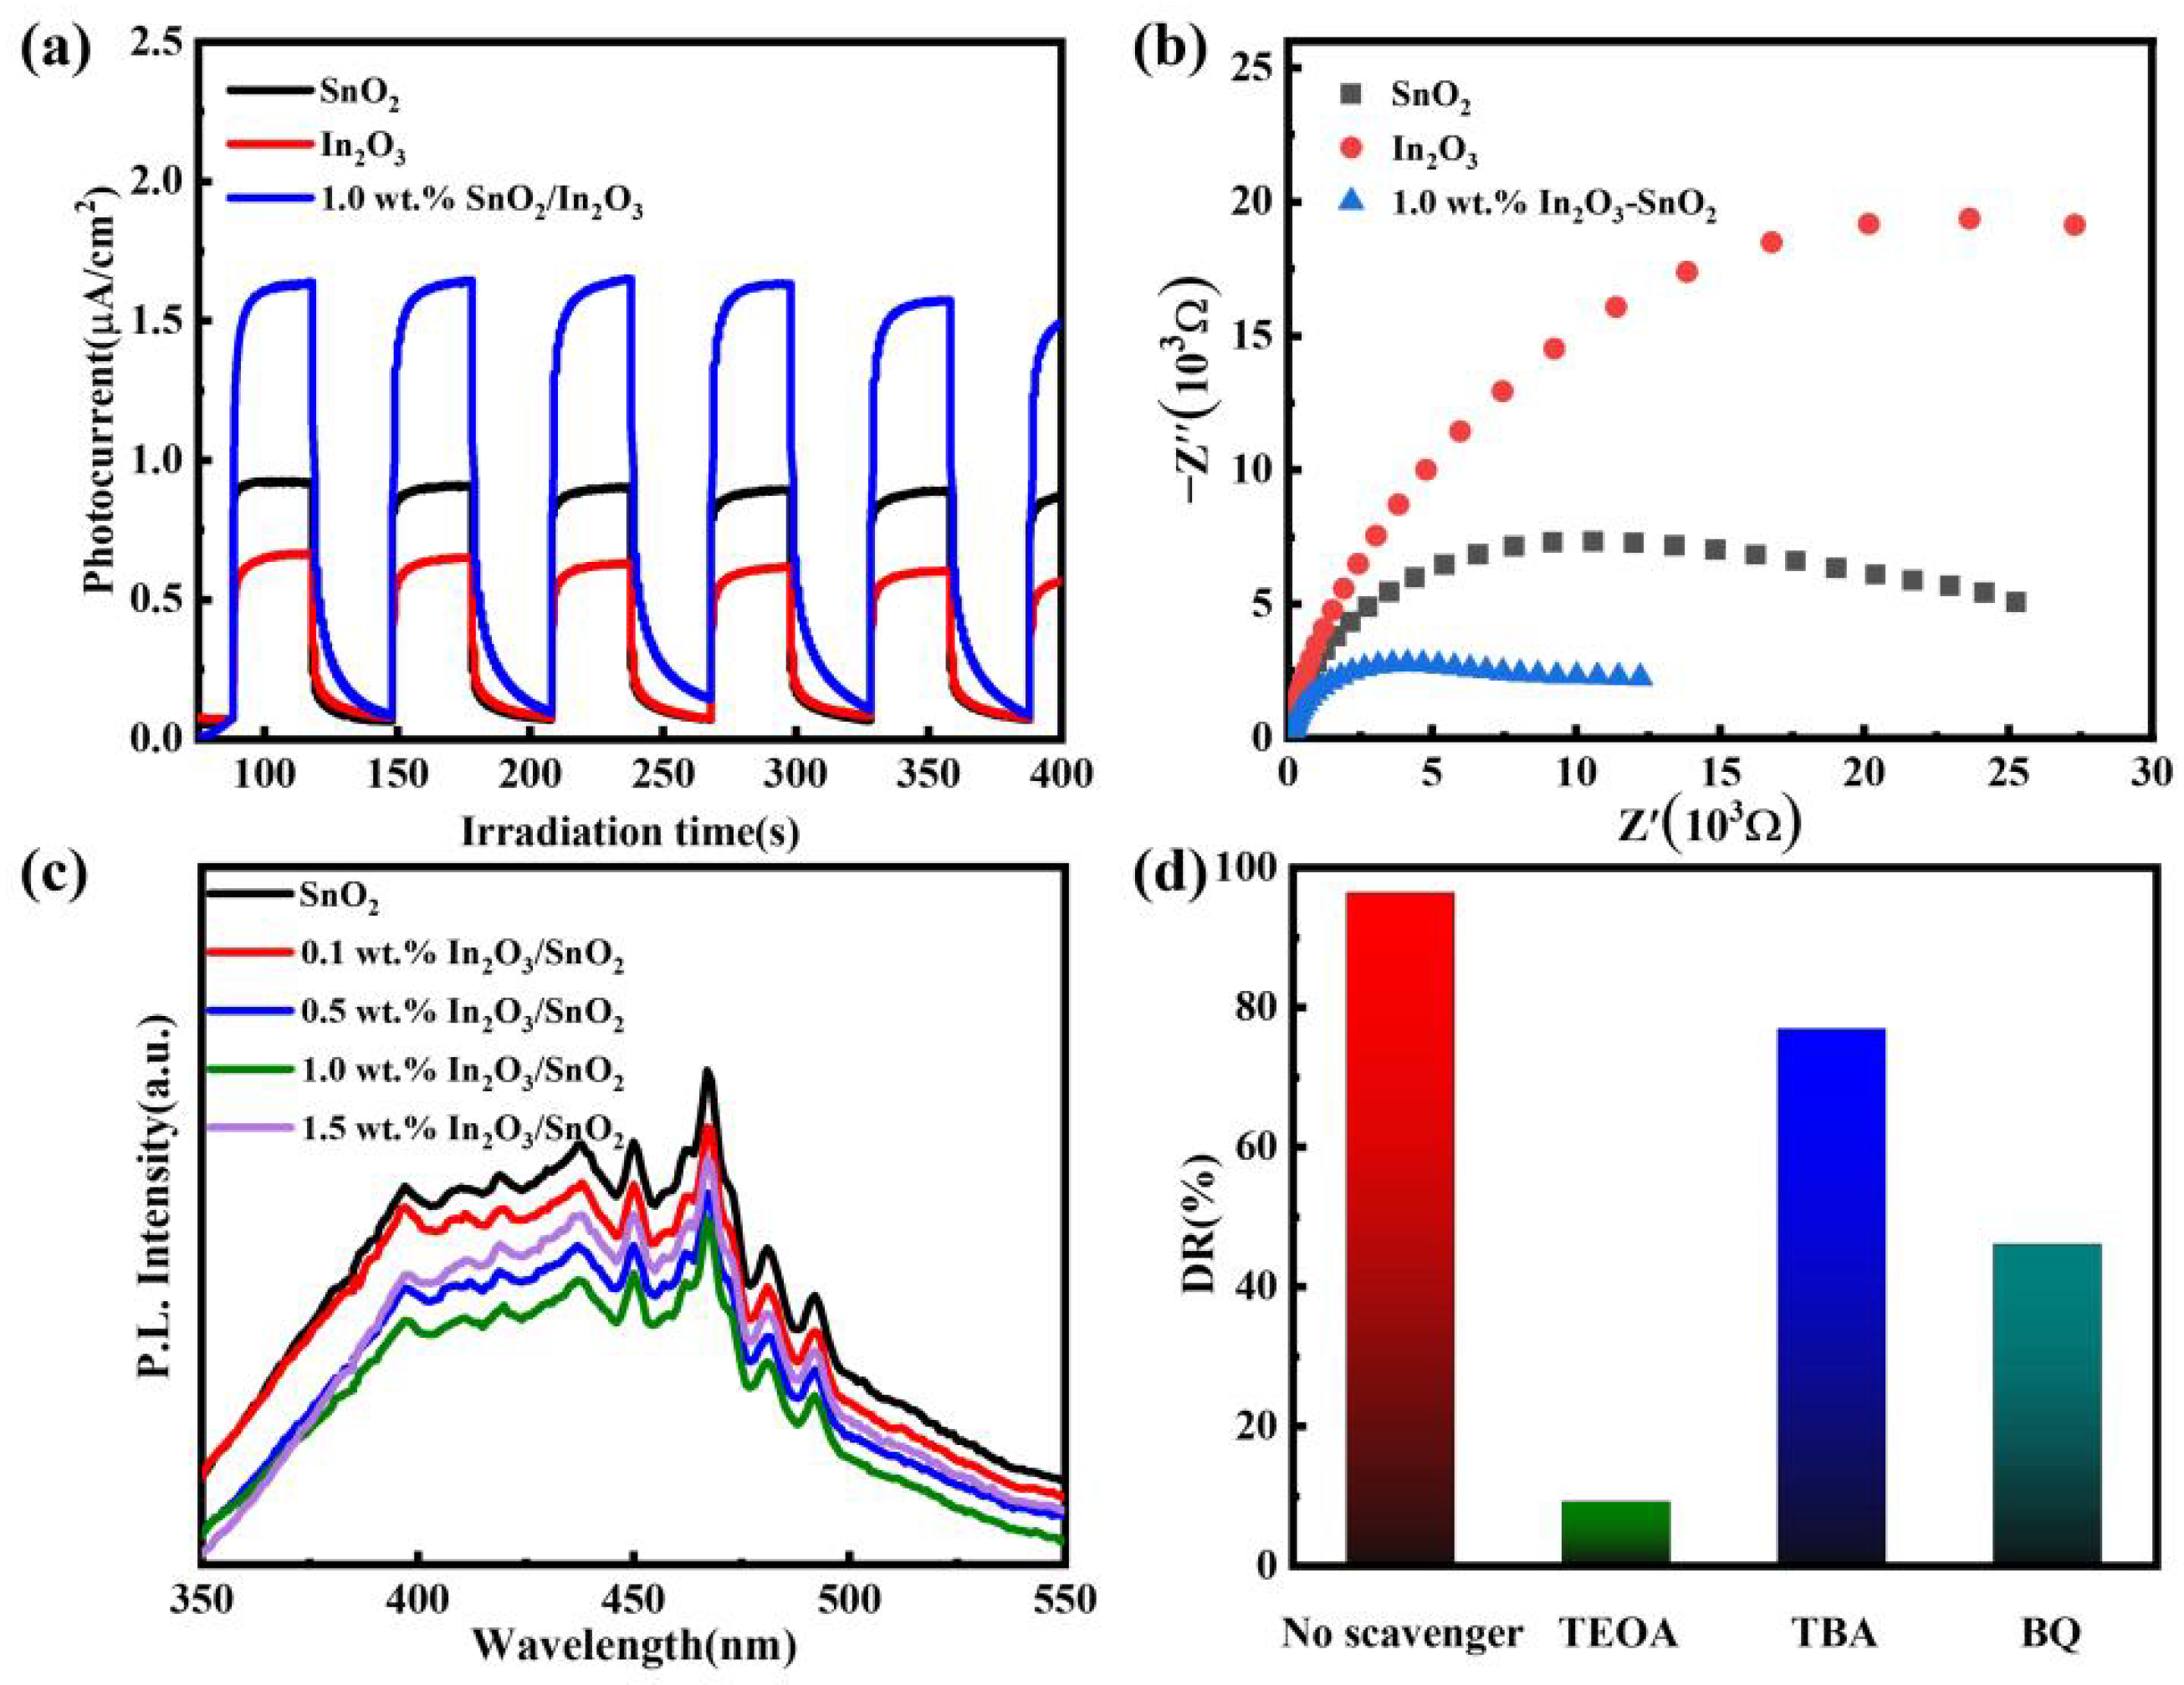
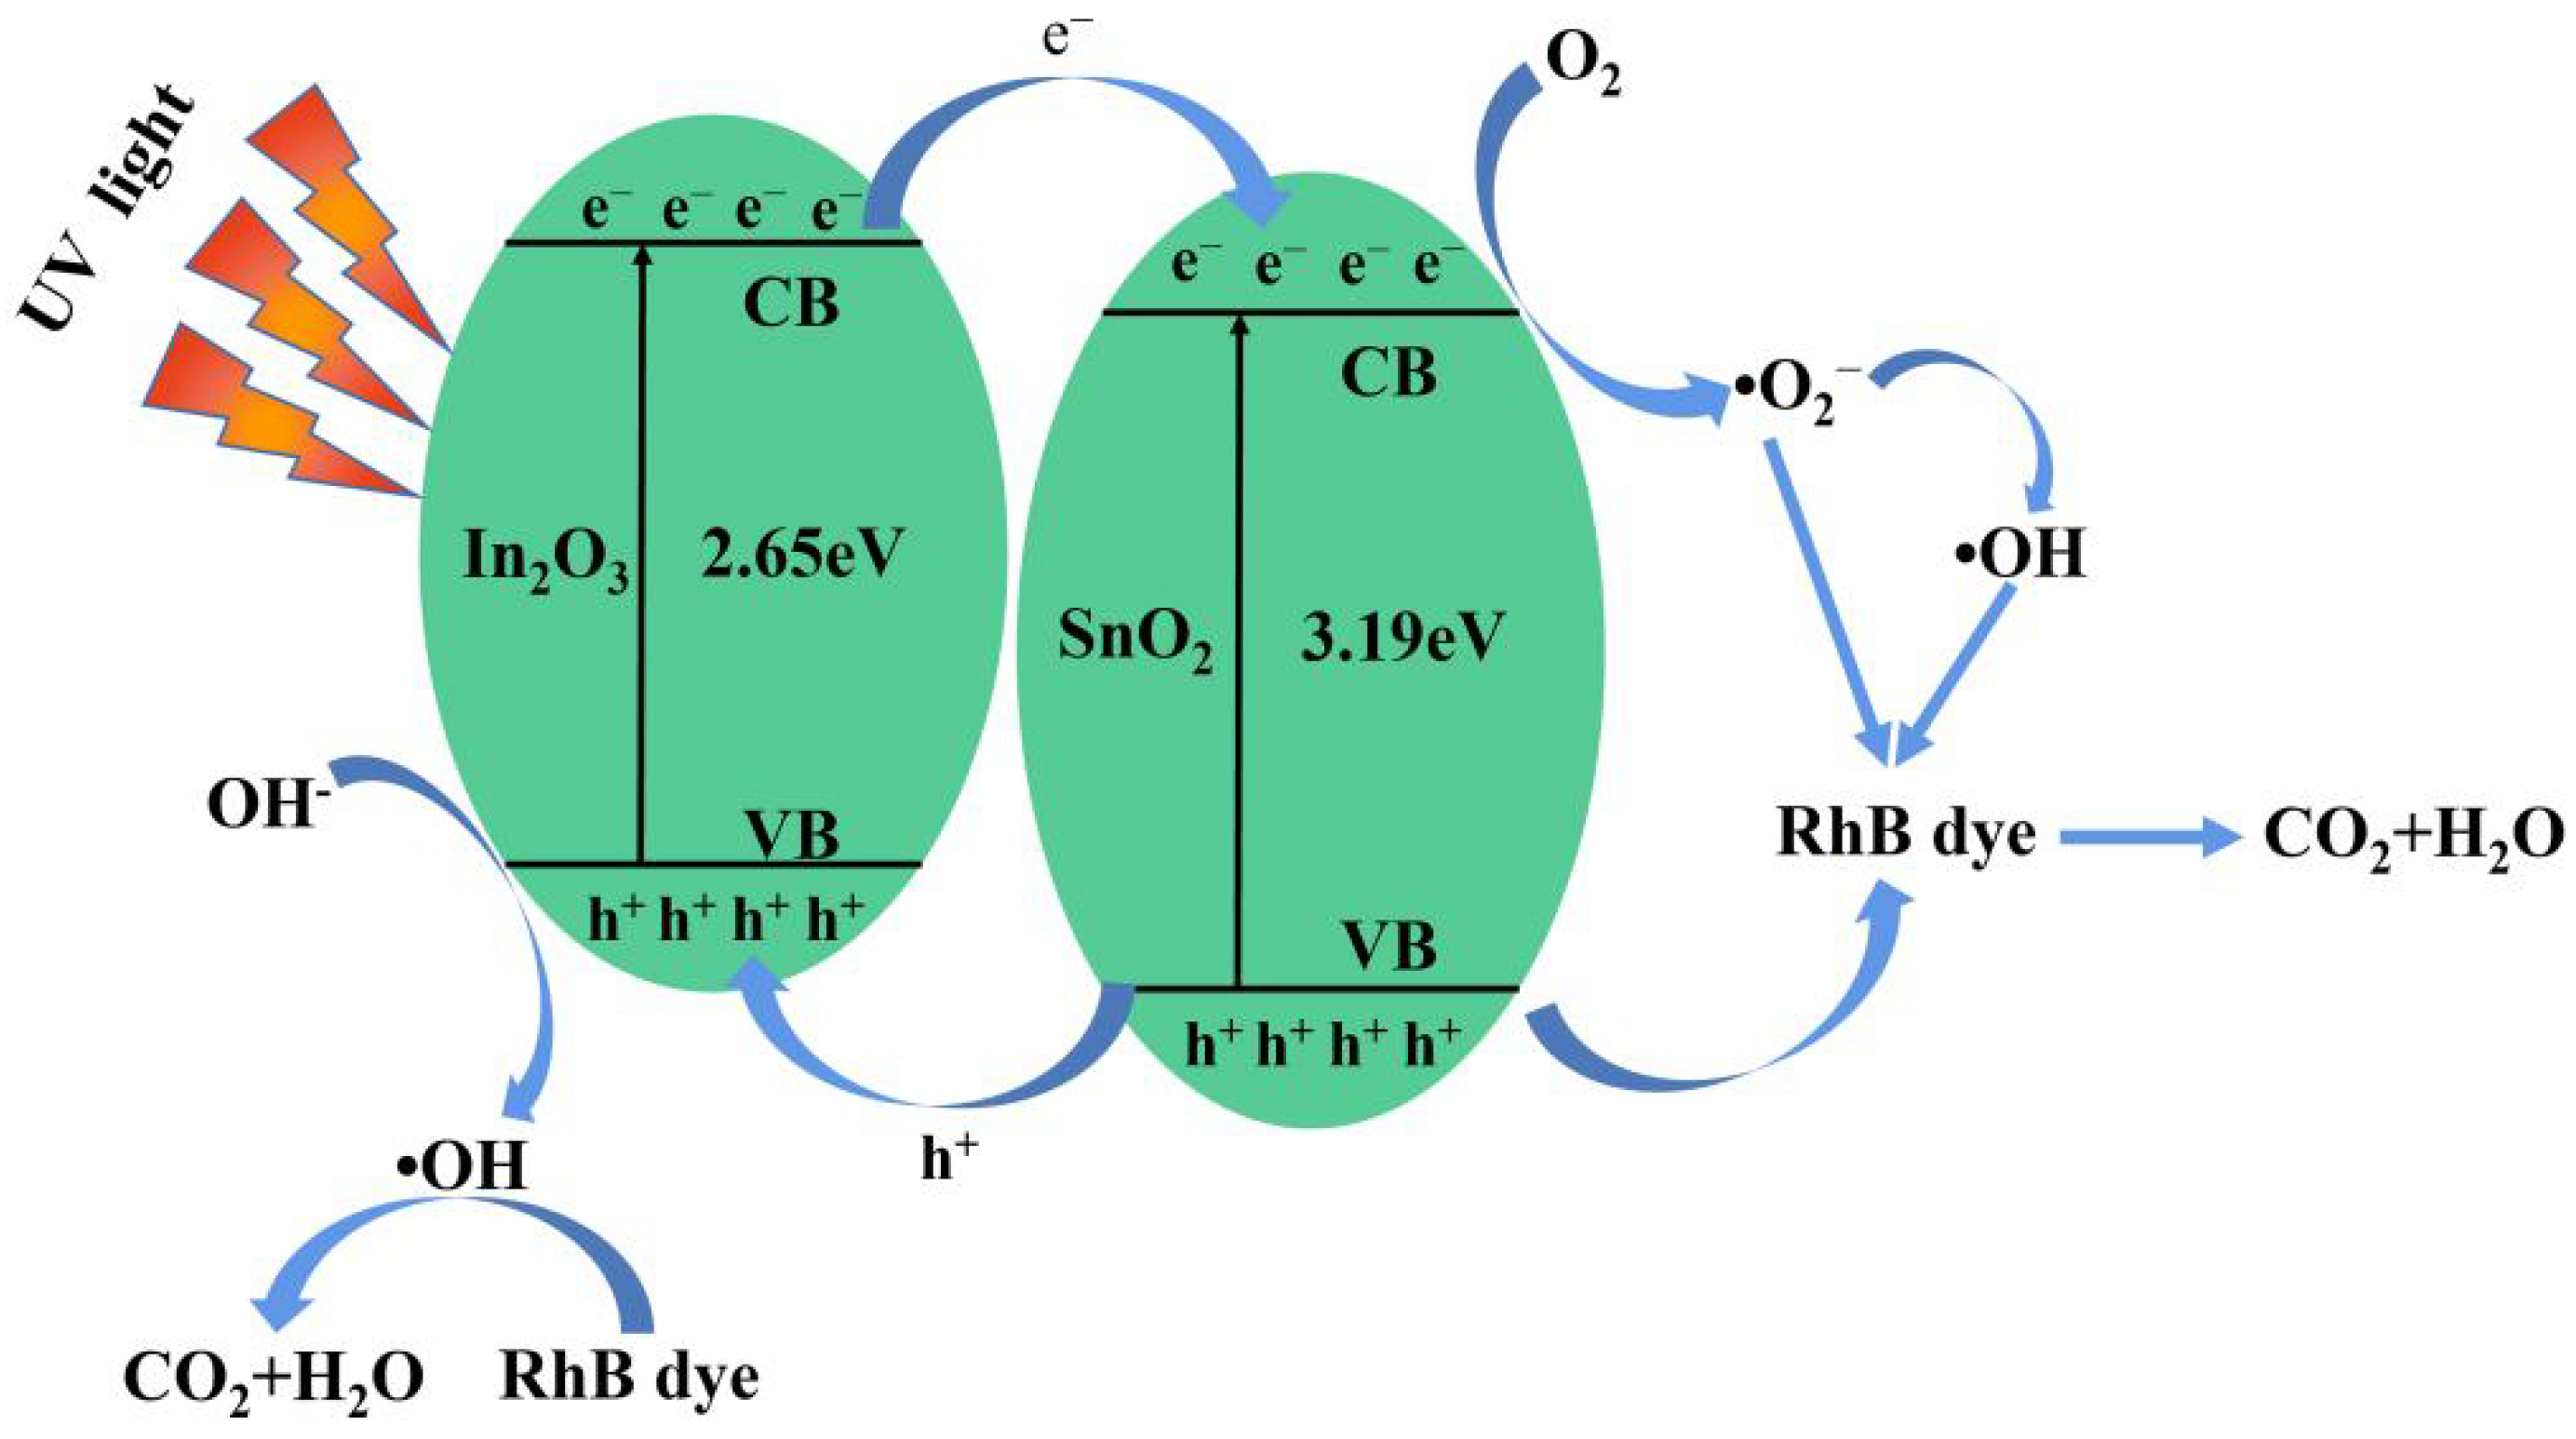
3.3. Catalytic Mechanism

The electron–hole separation efficiency during photocatalytic degradation was investigated using the transient photocurrent response. As shown in Figure 7a, the photocurrent of the 1.0 wt.% In2O3/SnO2 was higher than that of SnO2 and In2O3. The photocurrent density of the 1.0 wt.% In2O3/SnO2 (1.92 μA·cm−2) was 1.5 and 2.3 times that of pure SnO2 (1.32 μA·cm−2) and In2O3 (0.84 μA·cm−2), respectively. The elevated photocurrent signified that the carriers generated in the 1.0 wt.% In2O3/SnO2 could be separated more efficiently than those in pure SnO2 and In2O3. In general, the electron–hole transport effectivity was positively related to the photocurrent depth [28]. Therefore, in order to acquire higher photocatalytic activity, the 1.0 wt.% In2O3/SnO2 generated a greater number of electron–hole pairs to participate in the photodegradation process. As shown in Figure 7b, the EIS Nyquist plot of the samples was investigated. Compared with the pure SnO2, the 1.0 wt.% In2O3/SnO2 composite photocatalyst had the smallest arc radius in the EIS Nyquist diagram. The results indicated that In2O3/SnO2 composite photocatalyst could effectively increase the electron–hole separation rate [29].
Meanwhile, in order to further confirm of the photoactivity of the 1.0 wt.% In2O3/SnO2, photoluminescence (PL) spectroscopy tests were performed. It is well known that PL emission spectroscopy has been widely used to study the capture, transfer, and separation efficiencies of photogenerated charges in semiconductor materials. The lower the PL emission intensity, the lower the recombination rate of photogenerated electron–hole pairs [30]. Figure 7c shows the PL spectra of SnO2, 0.1, 0.5, 1.0 and 1.5 wt.% In2O3/SnO2. It can be seen that the luminescence intensity of the composite photocatalysts was lower than that of pure SnO2. With the increase in the In2O3 doping amount, the luminescence intensity first decreased and then increased, and reached the minimum value at 1.0 wt.% In2O3/SnO2. This means that the recombination of electron–hole pairs was hindered and the photocatalytic activity was enhanced [31].
To explore the degradation of RhB by a range of active species, trapping experiments were carried out. The influence of the main substances exposed to the 1.0 wt.% In2O3/SnO2 on the degradation of RhB was studied. As shown in Figure 7d, benzoquinone (BQ) was used to remove •O2, triethanolamine (TEOA) to remove h+, and tert-butanol (TBA) to remove •OH. After the addition of BQ and TEOA, the effectivity of the degradation of RhB was significantly reduced. The photocatalytic activity of TBA was also decreased, but the decrease was smaller than that of the others. Therefore, •O2 and h+ played the leading role in RhB degradation, while •OH played an auxiliary role.
According to the above evaluation results, the feasible photocatalytic mechanism of the composite In2O3/SnO2 photocatalyst material was proposed. As shown in Figure 8, the energy band positions of In2O3 and SnO2 were well matched, which can effectively separate photogenerated electrons and holes. In2O3 and SnO2 can be excited by ultraviolet light. A hole (h+) was generated in VB, and an electron (e) was generated in CB. The high carrier-recombination rate of pure SnO2 led to the poor photocatalytic performance. The synergistic effect of the nanocomposites reduced the composite defects that generate charge, which in turn improved the photocatalytic activity of SnO2.
The semiconductor components generate the electron–holes pairs, which is initiated by the absorption of photons with energy equal to or higher than the bandgap (Equations (3) and (4)). A part of the h+ of SnO2 was transferred to the VB of In2O3 (Equation (5)), and a part of the e of In2O3 was transferred to the CB of SnO2 (Equation (6)). Some h+ on the surface of SnO2 remained in the VB, oxidizing pollutants. The e reacts with oxygen molecules to form the superoxide anion (•O2) (Equation (7)). At the same time, the photocatalytic degradation of RhB in the VB may be due to a direct reaction with holes instead of •OH (Equations (8)–(10)). The viable response steps were summarized as follows [19,27].
S n O 2 + h v e ( S n O 2 ) + h + ( S n O 2 )
I n 2 O 3 + h v e ( I n 2 O 3 ) + h + ( I n 2 O 3 )
h + ( S n O 2 ) h + ( I n 2 O 3 )
e ( I n 2 O 3 ) e ( S n O 2 )
e ( S n O 2 ) + O 2 O 2
R h B + O 2 C O 2 + H 2 O
R h B + h + C O 2 + H 2 O
R h B + O H C O 2 + H 2 O
Table 2 shows the photocatalytic activity of the 1.0 wt.% In2O3/SnO2 nanocomposites for the degradation of RhB compared with several recently reported papers for the photocatalytic degradation of organic dyes. The 1.0 wt.% In2O3/SnO2 exhibited both the Fenton effect and photocatalytic activity under UV-light irradiation, verifying that it was an efficient photocatalyst. The reaction conditions such as the concentration of the dye and the content of the catalyst will have a great influence on the performance of the photocatalyst.

4. Conclusions

In this study, micron-sized spherical SnO2 and flower In2O3 structures were prepared by a simple hydrothermal method. In2O3-doped SnO2 (In2O3/SnO2) samples with different percentages of In2O3 contents were prepared by a “two-step method”, and their catalytic performance in RhB degradation was studied. The results showed that the photocurrent density of the 1.0 wt.% In2O3/SnO2 (1.92 μA·cm−2) was about 1.5 and 2.3 times that of pure SnO2(1.32 μA·cm−2) and In2O3(0.84 μA·cm−2), respectively. Compared with pure SnO2, the 1.0 wt.% In2O3/SnO2 composite photocatalyst had the smallest EIS Nyquist graph arc radius, which indicated that the In2O3/SnO2 composite photocatalyst could effectively increase the electron–hole separation rate. When the optimal loading capacity of In2O3 was 1.0 wt.%, the rate constant ĸ value of In2O3 was five and nine times that of SnO2 and In2O3, respectively. After 240 min irradiation, the photocatalytic performance of In2O3 was improved from 54% to 97%, and the degradation rate reached 87% after 120 min. These results indicated that the photocatalytic performance of the In2O3/SnO2 composite in RhB degradation was enhanced. A small quantity of In2O3 modified SnO2 to synthesize the composite In2O3/SnO2 materials, which accelerated the photocatalytic efficiency of pure SnO2 and suppressed the electron–hole recombination efficiency. Therefore, the In2O3/SnO2 composite was an effective method to improve the photocatalytic activity of SnO2.

Author Contributions

C.W. conceived the idea and designed the experiments; G.G. completed the whole preparation process, luminescence test, photocatalytic performance and other experiments, and analyzed the results to complete the manuscript; C.Z. was responsible for revealing the growth mechanism; Y.L. was responsible for the XRD test; Y.J. was responsible for the SEM test experiment; B.Z. was responsible for the mechanism interpretation and catalytic performance characterization; H.H. and A.W. conducted the XPS and UV–DRS tests. All authors have read and agreed to the published version of the manuscript.

Funding

This work was supported by the National Natural Science Foundation of China (Nos. 11604252), the Program of State key Laboratory of Infrared Physics (Nos. M202001), the Program of the key Laboratory of Artificial Microstructure, Ministry of Education (Nos. 13022019af002), the Science and Technology Program of Shaanxi Province (Nos. 2017JQ1015), the Program Fund of Shaanxi Provincial Education Department (Nos. 16JK1335), and the Start-Up Funds of Xi’an Polytechnic University (No. BS15026).

Institutional Review Board Statement

Not Applicable.

Informed Consent Statement

Not Applicable.

Data Availability Statement

Data presented in this study are available by requesting from the corresponding author.

Acknowledgments

The authors would like to acknowledge the of Xi’an Polytechnic University of Science for their support on the experimental investigations.

Conflicts of Interest

The authors declare no conflict of interest.

References

  1. Yaseen, D.A.; Scholz, M. Textile dye wastewater characteristics and constituents of synthetic effluents: A critical review. Int. J. Environ. Sci. Technol. 2018, 16, 1193–1226. [Google Scholar] [CrossRef]
  2. Liu, H.; Chen, M.; Zhang, H.; Wang, B.; Peng, J.; Liu, G. One-Step Synthesis of Hierarchical Flower-like SnO2/BiOCOOH Microspheres with Enhanced Light Response for the Removal of Pollutants. Langmuir 2020, 36, 9005–9013. [Google Scholar] [CrossRef] [PubMed]
  3. Hegazey, R.M.; Abdelrahman, E.A.; Kotp, Y.H.; Hameed, A.M.; Subaihi, A. Facile fabrication of hematite nanoparticles from Egyptian insecticide cans for efficient photocatalytic degradation of rhodamine B dye. J. Mater. Res. Technol. 2020, 9, 1652–1661. [Google Scholar] [CrossRef]
  4. Hamdaoui, O. Intensification of the sorption of Rhodamine B from aqueous phase by loquat seeds using ultrasound. Desalination 2011, 271, 279–286. [Google Scholar] [CrossRef]
  5. Liu, S.; Kang, L.; Zhang, J.; Jung, E.; Lee, S.; Jun, S.C. Structural engineering and surface modification of MOF-derived cobalt-based hybrid nanosheets for flexible solid-state supercapacitors. Energy Storage Mater. 2020, 32, 167–177. [Google Scholar] [CrossRef]
  6. Kang, L.; Huang, C.; Zhang, J.; Zhang, M.; Zhang, N.; Liu, S.; Ye, Y.; Luo, C.; Gong, Z.; Wang, C.; et al. Effect of fluorine doping and sulfur vacancies of CuCo2S4 on its electrochemical performance in supercapacitors. Chem. Eng. J. 2020, 390, 124643. [Google Scholar] [CrossRef]
  7. Zhao, Y.; Deng, N.; Fan, Z.; Hu, Z.-T.; Fan, L.; Zhou, J.; Huang, X. On-site H2O2 electro-generation process combined with ultraviolet: A promising approach for odorous compounds purification in drinking water system. Chem. Eng. J. 2022, 430, 132829. [Google Scholar] [CrossRef]
  8. Rui, J.; Deng, N.; Zhao, Y.; Tao, C.; Zhou, J.; Zhao, Z.; Huang, X. Activation of persulfate via Mn doped Mg/Al layered double hydroxide for effective degradation of organics: Insights from chemical and structural variability of catalyst. Chemosphere 2022, 302, 134849. [Google Scholar] [CrossRef]
  9. Sridevi, A.; Ramji, B.R.; Venkatesan, G.K.D.P.; Sugumaran, V.; Selvakumar, P. A facile synthesis of TiO2/BiOCl and TiO2/BiOCl/La2O3 heterostructure photocatalyst for enhanced charge separation efficiency with improved UV-light catalytic activity towards Rhodamine B and Reactive Yellow 86. Inorg. Chem. Commun. 2021, 130, 108715. [Google Scholar] [CrossRef]
  10. Chen, N.; Liu, B.; Zhang, P.; Wang, C.; Du, Y.; Chang, W.; Hong, W. Enhanced photocatalytic performance of Ce-doped SnO2 hollow spheres by a one-pot hydrothermal method. Inorg. Chem. Commun. 2021, 132, 108848. [Google Scholar] [CrossRef]
  11. Nie, M.; Liao, J.; Cai, H.; Sun, H.; Xue, Z.; Guo, P.; Wu, M. Photocatalytic property of silver enhanced Ag/ZnO composite catalyst. Chem. Phys. Lett. 2021, 768, 138394. [Google Scholar] [CrossRef]
  12. Li, H.; Zhao, Y.; Yin, C.; Jiao, L.; Ding, L. WO3 nanocrystal prepared by self-assembly of phosphotungstic acid and dopamine for photocatalytic degradation of Congo red. Colloids Surf. A Physicochem. Eng. Asp. 2019, 572, 147–151. [Google Scholar] [CrossRef]
  13. Jabeen, S.; Iqbal, J.; Arshad, A.; Awan, M.S.; Warsi, M.F. (In1-xFex)2O3 nanostructures for photocatalytic degradation of various dyes. Mater. Chem. Phys. 2020, 243, 122516. [Google Scholar] [CrossRef]
  14. Ding, S.-S.; Huang, W.-Q.; Zhou, B.-X.; Peng, P.; Hu, W.-Y.; Long, M.-Q.; Huang, G.-F. The mechanism of enhanced photocatalytic activity of SnO2 through fullerene modification. Curr. Appl. Phys. 2017, 17, 1547–1556. [Google Scholar] [CrossRef]
  15. Ahn, K.; Pham-Cong, D.; Choi, H.S.; Jeong, S.-Y.; Cho, J.H.; Kim, J.; Kim, J.-P.; Bae, J.-S.; Cho, C.-R. Bandgap-designed TiO2/SnO2 hollow hierarchical nanofibers: Synthesis, properties, and their photocatalytic mechanism. Curr. Appl. Phys. 2016, 16, 251–260. [Google Scholar] [CrossRef]
  16. Srinivasan, N.R.; Bandyopadhyaya, R. SnxTi1-xO2 solid-solution-nanoparticle embedded mesoporous silica (SBA-15) hybrid as an engineered photocatalyst with enhanced activity. Faraday Discuss. 2016, 186, 353–370. [Google Scholar] [CrossRef]
  17. Zhou, B.; Li, Y.; Bai, J.; Li, X.; Li, F.; Liu, L. Controlled synthesis of rh-In2O3 nanostructures with different morphologies for efficient photocatalytic degradation of oxytetracycline. Appl. Surf. Sci. 2019, 464, 115–124. [Google Scholar] [CrossRef]
  18. Guan, Y.; Wang, D.; Zhou, X.; Sun, P.; Wang, H.; Ma, J.; Lu, G. Hydrothermal preparation and gas sensing properties of Zn-doped SnO2 hierarchical architectures. Sens. Actuators B Chem. 2014, 191, 45–52. [Google Scholar] [CrossRef]
  19. Qin, Y.; Li, H.; Lu, J.; Ding, Y.; Ma, C.; Liu, X.; Meng, M.; Yan, Y. Fabrication of Bi2WO6/In2O3 photocatalysts with efficient photocatalytic performance for the degradation of organic pollutants: Insight into the role of oxygen vacancy and heterojunction. Adv. Powder Technol. 2020, 31, 2890–2900. [Google Scholar] [CrossRef]
  20. Mohammad, A.; Khan, M.E.; Karim, M.R.; Cho, M.H. Synergistically effective and highly visible light responsive SnO2-g-C3N4 nanostructures for improved photocatalytic and photoelectrochemical performance. Appl. Surf. Sci. 2019, 495, 143432. [Google Scholar] [CrossRef]
  21. Jourshabani, M.; Shariatinia, Z.; Badiei, A. In Situ fabrication of SnO2/S-doped g-C3N4 nanocomposites and improved visible light driven photodegradation of methylene blue. J. Mol. Liq. 2017, 248, 688–702. [Google Scholar] [CrossRef]
  22. Shanmugasundaram, A.; Basak, P.; Manorama, S.V.; Krishna, B.; Sanyadanam, S. Hierarchical mesoporous In2O3 with enhanced CO sensing and photocatalytic performance: Distinct morphologies of In(OH)3 via self assembly coupled in situ solid-solid transformation. ACS Appl. Mater. Interfaces 2015, 7, 7679–7689. [Google Scholar] [CrossRef] [PubMed]
  23. Wang, H.; Yan, J.; Wang, R.; Li, S.; Brett, D.J.L.; Key, J.; Ji, S. Toward high practical capacitance of Ni(OH)2 using highly conductive CoB nanochain supports. J. Mater. Chem. A 2017, 5, 92–96. [Google Scholar] [CrossRef]
  24. Clark, A.H. Electrical and Optical Properties of Amorphous Germanium. Phys. Rev. 1967, 154, 750–757. [Google Scholar] [CrossRef]
  25. Li, Y.; Tian, X.; Wang, Y.; Yang, Q.; Diao, Y.; Zhang, B.; Yang, D. In Situ Construction of a MgSn(OH)6 Perovskite/SnO2 Type-II Heterojunction: A Highly Efficient Photocatalyst towards Photodegradation of Tetracycline. Nanomaterials 2019, 10, 53. [Google Scholar] [CrossRef]
  26. Soltanabadi, Y.; Jourshabani, M.; Shariatinia, Z. Synthesis of novel CuO/LaFeO3 nanocomposite photocatalysts with superior Fenton-like and visible light photocatalytic activities for degradation of aqueous organic contaminants. Sep. Purif. Technol. 2018, 202, 227–241. [Google Scholar] [CrossRef]
  27. Chen, Y.; Jiang, Y.; Chen, B.; Ye, F.; Duan, H.; Cui, H. Facile fabrication of N-doped carbon quantum dots modified SnO2 composites for improved visible light photocatalytic activity. Vacuum 2021, 191, 110371. [Google Scholar] [CrossRef]
  28. Zhu, Z.; Ma, C.; Yu, K.; Lu, Z.; Liu, Z.; Huo, P.; Tang, X.; Yan, Y. Synthesis Ce-doped biomass carbon-based g-C3N4 via plant growing guide and temperature-programmed technique for degrading 2-Mercaptobenzothiazole. Appl. Catal. B: Environ. 2020, 268, 118432. [Google Scholar] [CrossRef]
  29. Akhundi, A.; Habibi-Yangjeh, A.; Abitorabi, M.; Pouran, S.R. Review on photocatalytic conversion of carbon dioxide to value-added compounds and renewable fuels by graphitic carbon nitride-based photocatalysts. Catal. Rev. 2019, 61, 595–628. [Google Scholar] [CrossRef]
  30. Mousavi, M.; Habibi-Yangjeh, A.; Pouran, S.R. Review on magnetically separable graphitic carbon nitride-based nanocomposites as promising visible-light-driven photocatalysts. J. Mater. Sci. Mater. Electron. 2017, 29, 1719–1747. [Google Scholar] [CrossRef]
  31. Guo, M.-Z.; Poon, C.S. Superior photocatalytic NOx removal of cementitious materials prepared with white cement over ordinary Portland cement and the underlying mechanisms. Cem. Concr. Compos. 2018, 90, 42–49. [Google Scholar] [CrossRef]
  32. Li, Y.; Yang, Q.; Wang, Z.; Wang, G.; Zhang, B.; Zhang, Q.; Yang, D. Rapid fabrication of SnO2 nanoparticle photocatalyst: Computational understanding and photocatalytic degradation of organic dye. Inorg. Chem. Front. 2018, 5, 3005–3014. [Google Scholar] [CrossRef]
  33. Davis, M.; Hung-Low, F.; Hikal, W.M.; Hope-Weeks, L.J. Enhanced photocatalytic performance of Fe-doped SnO2 nanoarchitectures under UV irradiation: Synthesis and activity. J. Mater. Sci. 2013, 48, 6404–6409. [Google Scholar] [CrossRef]
  34. Chen, H.; Wang, Z.; Xue, Z.; Yu, C.; Pei, L.; Fan, C. Constructing Z-Scheme Bi2O3/In2O3 Heterojunction for Efficient Photocatalytic Degradation of Rhodamine B. Cryst. Res. Technol. 2020, 55, 2000093. [Google Scholar] [CrossRef]
  35. Jansanthea, P.; Kanthabangharn, J.; Chomkitichai, W.; Ketwaraporn, J.; Saovakon, C.; Wansao, C.; Wanaek, A.; Kraivuttinun, P.; Pookmanee, P.; Phanichphant, S. Temperature-controlled synthesis and photocatalytic properties of ZnO–SnO2 nanocomposites. J. Aust. Ceram. Soc. 2021, 57, 579–588. [Google Scholar] [CrossRef]
Figure 1. XRD patterns of pure SnO2, In2O3 and 1.0 wt.% In2O3/SnO2 composite photocatalysts.
Nanomaterials 12 03151 g001
Figure 2. SEM images: (a,b) of the pure SnO2; (c,d) of the prepared In2O3; (e,f) of the prepared 1.0 wt.% In2O3/SnO2 composite photocatalysts.
Nanomaterials 12 03151 g002
Figure 3. TEM image: (a) of the prepared 1.0 wt.% In2O3/SnO2 composite photocatalysts; (b) HRTEM images; TEM–EDS elemental mapping of 1.0 wt.% In2O3/SnO2 composite photocatalysts: (c) EDS layered image; (d) In Lα1; (e) Sn Lα1; (f) O Kα1.
Nanomaterials 12 03151 g003
Figure 4. XPS spectra of pure SnO2, In2O3 and 1.0 wt.% In2O3/SnO2 composite photocatalysts: (a) survey; (b) Sn3d; (c) In3d; (d) O1s.
Nanomaterials 12 03151 g004
Figure 5. The optical performance of catalytic: (a) UV–Vis DRS; (b) The bandgap; The Mott–Schottky plot; (c) In2O3; and (d) SnO2.
Nanomaterials 12 03151 g005
Figure 6. Photo-oxidation activity: (a) RhB variation curves; (b) degradation kinetics; (c) stability test; and (d) temporal evolution of UV–Vis spectra during decolorization of RhB.
Nanomaterials 12 03151 g006
Figure 7. Photoelectrochemical characterization: (a) photocurrent of the samples; (b) EIS of the samples; (c) PL spectra of different samples; and (d) degradation of RhB with the addition of BQ, EDTA, TBA.
Nanomaterials 12 03151 g007
Figure 8. Schematic illustration of the separation and migration mechanism of photogenerated electron–hole pairs of In2O3/SnO2 composites.
Nanomaterials 12 03151 g008
Table 1. The fitted equation, the rate constant ĸ and correlation coefficient (R2) of as-prepared samples.
SamplesFitted Equationĸ (min−1)Correlation Coefficient (R2)
Blankln(C0/C) = 0.0002056 t0.00020560.91181
SnO2ln(C0/C) = 0.00305 t0.003050.98214
In2O3ln(C0/C) = 0.00158 t0.001580.96773
0.1 wt.% In2O3/SnO2ln(C0/C) = 0.01049 t0.010490.97336
0.5 wt.% In2O3/SnO2ln(C0/C) = 0.01087 t0.010870.9719
1.0 wt.% In2O3/SnO2ln(C0/C) = 0.0002056 t0.013470.98141
1.5 wt.% In2O3/SnO2ln(C0/C) = 0.0002056 t0.009580.98119
Table 2. Comparison of photocatalytic efficiencies of various SnO2-based photocatalysts for degradation of organic pollutants.
CatalystPollutant ConcentrationCatalyst Dosage (mg)Light SourceIrradiation
Time (min)
Activity (%)Reference
SnO2a RhB (10 mg/L)45 mghigh-pressure Hg lamp (175 w)270 min~92%[32]
Fe/SnO2RhB (10 mg/L)25 mgUV light (250 w)120 min~55%[33]
Bi2O3/In2O3RhB (10 mg/L)10 mgHg lamp (175 w)240 min~92%[34]
ZnO/SnO2RhB (2 × 10⁻⁶ M)50 mgtwo 6 W UV tube lamps120 min~80%[35]
1.0 wt.%
In2O3/SnO2
RhB (10 mg/L)50 mghigh-pressure Hg lamp (200 w)120 min
180 min
240 min
~87%
~92%
~97%
This work
a RhB = Rhodamine B.
Publisher’s Note: MDPI stays neutral with regard to jurisdictional claims in published maps and institutional affiliations.

