Article

The Lattice Distortion, Defect Evolution and Electrochemical Performance Improvement in Zn-VO2(B) Nanorods

Henan Key Laboratory of Magnetoelectronic Information Functional Materials, School of Physics and Electronic Engineering, Zhengzhou University of Light Industry, 136 Kexue Road, Zhengzhou 450002, China
*
Author to whom correspondence should be addressed.
Nanomaterials 2022, 12(18), 3196; https://doi.org/10.3390/nano12183196
Submission received: 13 August 2022 / Revised: 12 September 2022 / Accepted: 13 September 2022 / Published: 14 September 2022

Abstract

:
Cathode materials of energy storage batteries have attracted extensive attention because of the importance in deciding the rate performance and long cycle property of batteries. Herein, we report a simple and environmentally friendly solvothermal method to prepare Zn-doped VO2(B) cathode materials. The introduction of zinc ions can effectively regulate the lattice structure, surface morphology and internal defect state of Zn-VO2(B) nano materials. The sample with Zn content x = 1.5% has smaller cell volume and grain size, and higher concentration of vacancy defects. These microstructures ensure the structural stability during ion embedding process and, thus, this sample shows excellent electrochemical performances. The capacitance retention rate still maintains 88% after 1000 cycles at the current density of 0.1 A·g−1. The enhanced performances of Zn-doped VO2(B) samples may lay a foundation for the improvement of electrochemical performances of VO2(B) cathode materials for energy storage batteries in the future.

1. Introduction

The development of green, sustainable and environmentally friendly energy storage technologies was considered to be an effective way to alleviate the energy crisis and environmental pollution [1]. As the most promising electrochemical energy storage devices, energy storage batteries (lithium ion battery, sodium ion battery, potassium ion battery, zinc ion battery, etc.) and supercapacitors have attracted widespread attention for academia studies and industrial applications [2,3,4]. Throughout the development history of all kinds of energy storage batteries, cathode materials, as one of the key factors affecting the rate performance and long cycle property of batteries, determined the capability of electrochemical energy storage devices [5,6]. Therefore, the selection and structural optimization of cathode materials have become the main research area recently.
Vanadium oxides have gained extensive attention due to their widely variable oxidation states (II-V) providing much wider potential windows and much higher theoretical specific capacity [7]. Among various vanadium oxides, monoclinic phase VO2(B) stands out because of the unique layered structure formed by corners and/or edge-sharing VO6 octahedra, which supports the intercalation and deintercalation of Mg2+ (0.66 Å), Li+ (0.69 Å), Zn2+ (0.74 Å), Na+ (1.02 Å) and K+ ions (1.38 Å) [8,9]. Therefore, VO2(B) has been considered as one of the most promising cathode electrode materials of storage batteries [10]. However, VO2(B) cathode materials suffer from the reduction of specific capacity and poor cyclic stability due to the disproportionation reaction of V4+ ions in the charge and discharge process [11]. Thus, the design of superior VO2(B) cathode materials for high-performance energy storage battery is highly desirable but much more challenging.
Nanostructured materials have unique advantages in energy storage, such as shorter ion diffusion distance, larger surface area and more reactive active sites [12,13]. Ion doping can not only efficiently regulate the microstructure of electrode material but also facilitate ionic/electronic conductivity and provide more active sites. Therefore, researchers are committed to synthesizing electrode materials with different nanostructures by optimizing the preparation process. For example, Li et al. [14] prepared W-doped VO2(B) nanosheets as the cathode material for water-based zinc ion batteries. The introduction of W ion expanded the lattice distance of VO2(B) and accelerated the diffusion rate of zinc ion in the electrochemical reaction process, and thus enhanced the structural stability of the material. The specific capacity retention rate of W-doped VO2(B) cathode material was 76.4% after 1000 cycles at the current density of 4 A·g−1. Liu et al. [15] introduced Mn ions and polyvinylpyrrolidone (PVP) into the VO2(B) system and prepared MnVO2-PVP composite with the morphology of nanoprisms and nanosheets. The material had faster ionic diffusion kinetics and better long-term cyclic stability. The specific capacity of synthesized MnVO2-PVP was 176.5 mA·h·g−1 after 5000 cycles at the current density of 10 A·g−1. It also had high energy density (179 w·h·kg−1) and power density (7000 W·kg−1). N-doped nano-VO2(B) cathode material prepared by Lv et al. [16] had many active sites and high conductivity and showed excellent electrochemical performances. Compared with carbon coating and organometallic hybridization [6,17], which were used to improve the surface area and specific capacitance of VO2, ion doping can not only regulate the crystal structure and electron distribution state in materials, but also introduce moderate amount of defects by controlling the doping concentration, which is convenient to study the evolution of defects.
As an important part of microstructures, microdefects are a deep factor affecting the electrochemical performances of cathode materials. By adjusting the internal microdefects of materials, the local density of electronic states of metal ions can be effectively regulated, the intrinsic conductivity of materials can be improved and more active sites can be provided for the embedding of carriers, thus promoting the embedding and de-embedding of metal ions. In recent years, researchers have also made some explorations on the microdefects of VO2(B) cathode materials. Li et al. [18] confirmed through density functional theory analysis that oxygen vacancies could reduce the band gap of VO2(B) and the energy barrier of zinc ions diffusion, which were conducive to improving the reaction kinetics and the storage capacity of zinc ions in VO2(B) cathode materials. Zhang et al. [19,20] developed VO2(B) rich in oxygen vacancies as the cathode material of water-based zinc ion battery. Due to the existence of oxygen defects, the diffusion of zinc ion in an aqueous Zn/VO2−x(B) battery was significantly enhanced and then the electrochemical performance was improved. The above results show that the defects have important effects on the electrochemical properties of cathode materials, which play a good guiding role in the experimental study of this project. Through simulation calculation, our research group found that there are many kinds of vacancy defects in the VO2(B) crystal structure, and positron annihilation lifetime spectrum can be used to determine the type of vacancy defects. In our previous studies, positron annihilation and other techniques were used to study the microdefects and electrochemical properties of nano-VO2(B) cathode materials doped with magnesium, manganese and other ions, and it was found that vanadium vacancy is one of the important factors affecting the electrochemical properties of the materials [21,22].
Inspired by the previous works, we successfully constructed Zn-doped VO2(B) nanorods as cathode material of storage batteries. The crystal structure, surface morphology, microdefects and electrochemical performances of Zn-VO2(B) samples with different Zn doping concentration x had been studied comprehensively. Under the combined actions of lattice distortion and microdefects, the Zn-VO2(B) sample with doping concentration x = 1.5% had a larger specific capacitance and significantly improved electrochemical performances. These results demonstrated that Zn doping was an efficient way to improve the electrochemical performances of VO2(B) nanorods, which could promote the application of VO2(B) cathode materials in storage batteries.

2. Materials and Methods

The Zn-VO2(B) nanorods with the doping content x = 0.0%, 0.5%, 1.5% and 3.0% were prepared by a solvothermal reaction method using V2O5 (99.99%), H2C2O4 (99.0%) and Zn(CH3COO)2·2H2O (99.99%) as starting raw materials. For each composition, the starting materials were weighed in required molar ratios and dissolved in the corresponding solvent. The V2O5 was dissolved in H2C2O4 (99.0%) according to mole ratio 1:3. The Zn(CH3COO)2·2H2O (99.99%) was dissolved in the mixture of H2O2 (30.0%) and deionized water. The two mixed solutions were put into the reaction kettle and heated up to 180 °C for 48 h. The sediment was washed with deionized water and anhydrous ethanol and then dried in a vacuum for 10 h at 80 °C. The sediment was annealed at a tubular furnace in a vacuum environment by a two-stage heating program: from room temperature to 200 °C for 2 h and then increased to 350 °C for 6 h with a heating rate of 3 °C/min. The schematic diagram of the preparation process was shown in Figure 1.
The crystal structure and morphology of the prepared samples were characterized by X-ray diffraction (XRD, Bruker D8 Advance, Cu Kα radiation: λ = 1.5418 Å) and field-emission scanning electron microscope (FESEM, Quanta 250 FEG), respectively. The elemental composition and valence states of the prepared samples were measured by X-ray photoelectron spectroscopy (XPS, Escalab 250XI). The positron annihilation lifetime spectra of the samples were measured using a fast-fast coincidence lifetime spectrometer with 13 μCi 22Na positron source at room temperature. Furthermore, the lifetime spectra were analyzed by the PATFIT program.
The electrochemical properties of the samples were performed on a CHI760E electrochemical workstation. The working electrode was obtained by mixing 80 wt% active material (Zn-VO2), 10 wt% acetylene black and 10 wt% PTFE on nickel foam. Pt metal electrode and saturated calomel electrode were used as counter electrode and reference electrode, respectively. The electrolyte was 2 mol/L KOH solution.

3. Results and Discussion

3.1. XRD

Figure 2a showed the XRD patterns of Zn-VO2(B) samples for x = 0.0%, 0.5%, 1.5% and 3.0%. The properties (e.g., the phase composition, purity and crystallinity) of the synthesized samples were clearly presented in Figure 2a. The Bragg reflections of all samples were indexed to the monoclinic structure of VO2(B) (PDF-# 31-1438) in C2/m space groups, and no traces of any obvious impurity phases and secondary phases were detected within the detection limits of the instrument. As shown in Figure 2b, with the increasing of Zn content, the (110) peak started to widen and weaken, and shifted towards to small angle side, which was due to the larger ionic radius of doped Zn2+ (0.88 Å) compared to that of V4+ (0.58 Å). The introduction of Zn ions resulted in an expansive lattice and distorted crystal structure in the samples.
Table 1 illustrated the variation of lattice parameters (a, b, c) and unit cell volumes (V) with doping concentration x. Compared with the undoped sample, the lattice constants and cell volume of all doped samples were increased, which was attributed to the lattice expansion caused by large radius ion doping. It was worth noting that the lattice parameters and cell volume did not increase linearly with the increase of doping amount, but showed a nonlinear change with the x, namely, decreased with x between 0.5% and 1.5%, and then had a sharp increase over 1.5%. The irregular variation was attributable to the distortion of VO6 octahedral caused by Zn2+ doping [23].

3.2. XPS

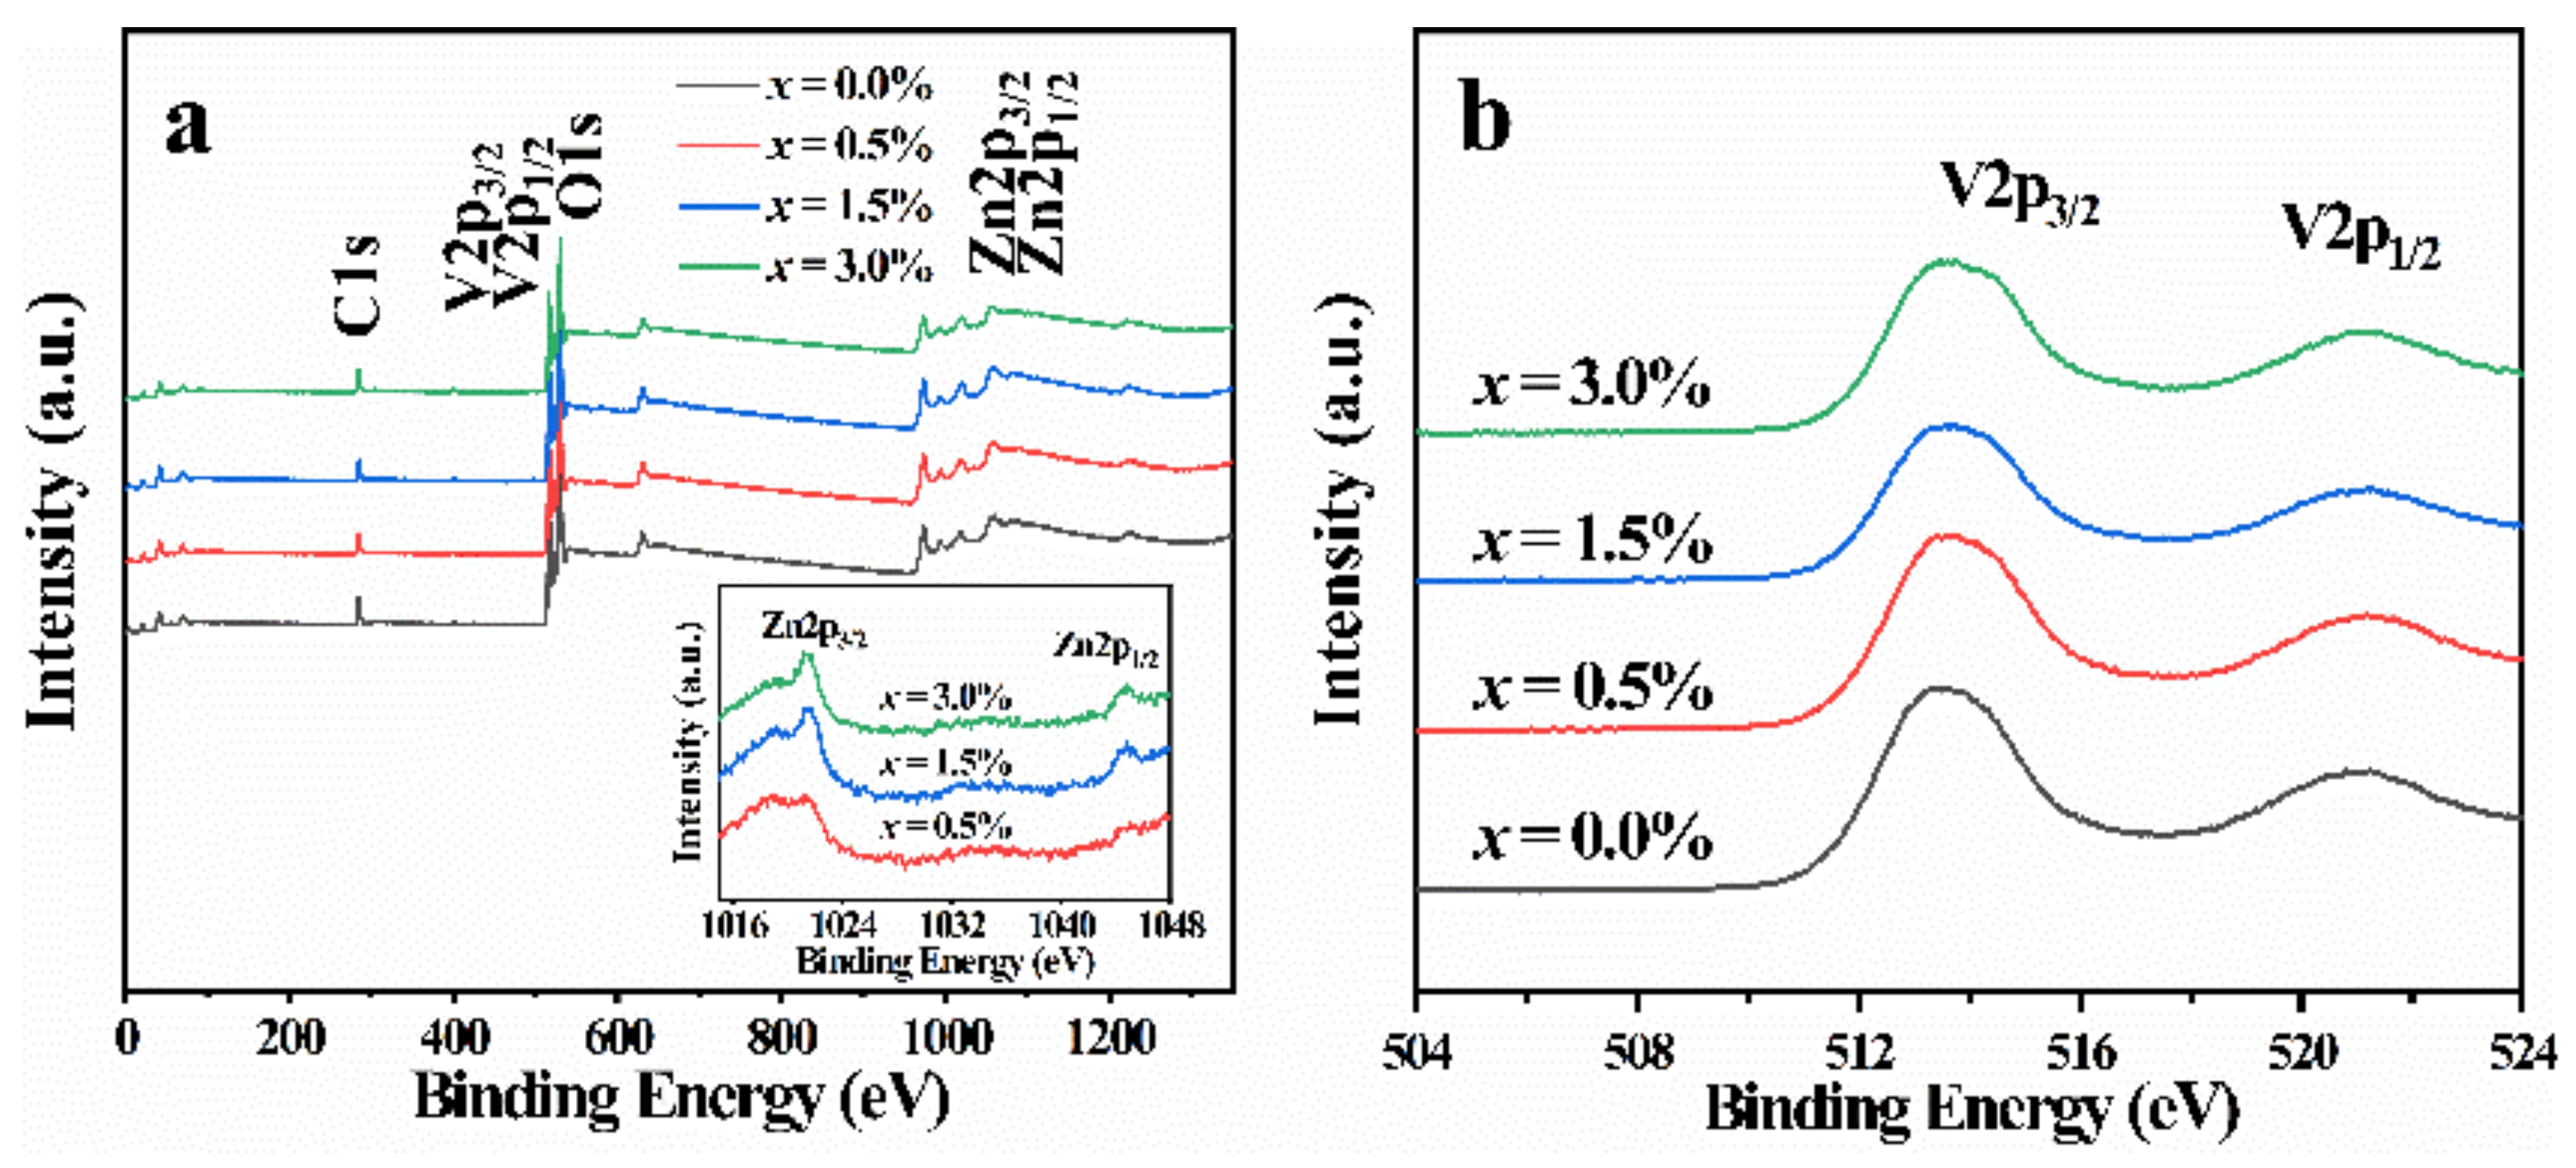
The chemical microenvironment of the Zn-VO2(B) samples was identified by X-ray photoelectron spectroscopy (XPS). As shown in Figure 3a, the XPS full survey spectra presented C, V, O, and Zn element signals. The presence of the elements C was due to the sample contamination. The high-resolution spectrum of Zn 2p showed two peaks at 1021.38 and 1044.78 eV, corresponding to Zn 2p3/2 and Zn 2p1/2, respectively, as depicted in the illustration of Figure 3a. As shown in Figure 3b, the peaks at 513.7 and 520.9 eV were derived from V4+ in VO2(B). XPS analysis showed that the Zn atom had been doped into VO2(B) successfully and the valence state of V atom did not change during the preparation.

3.3. SEM

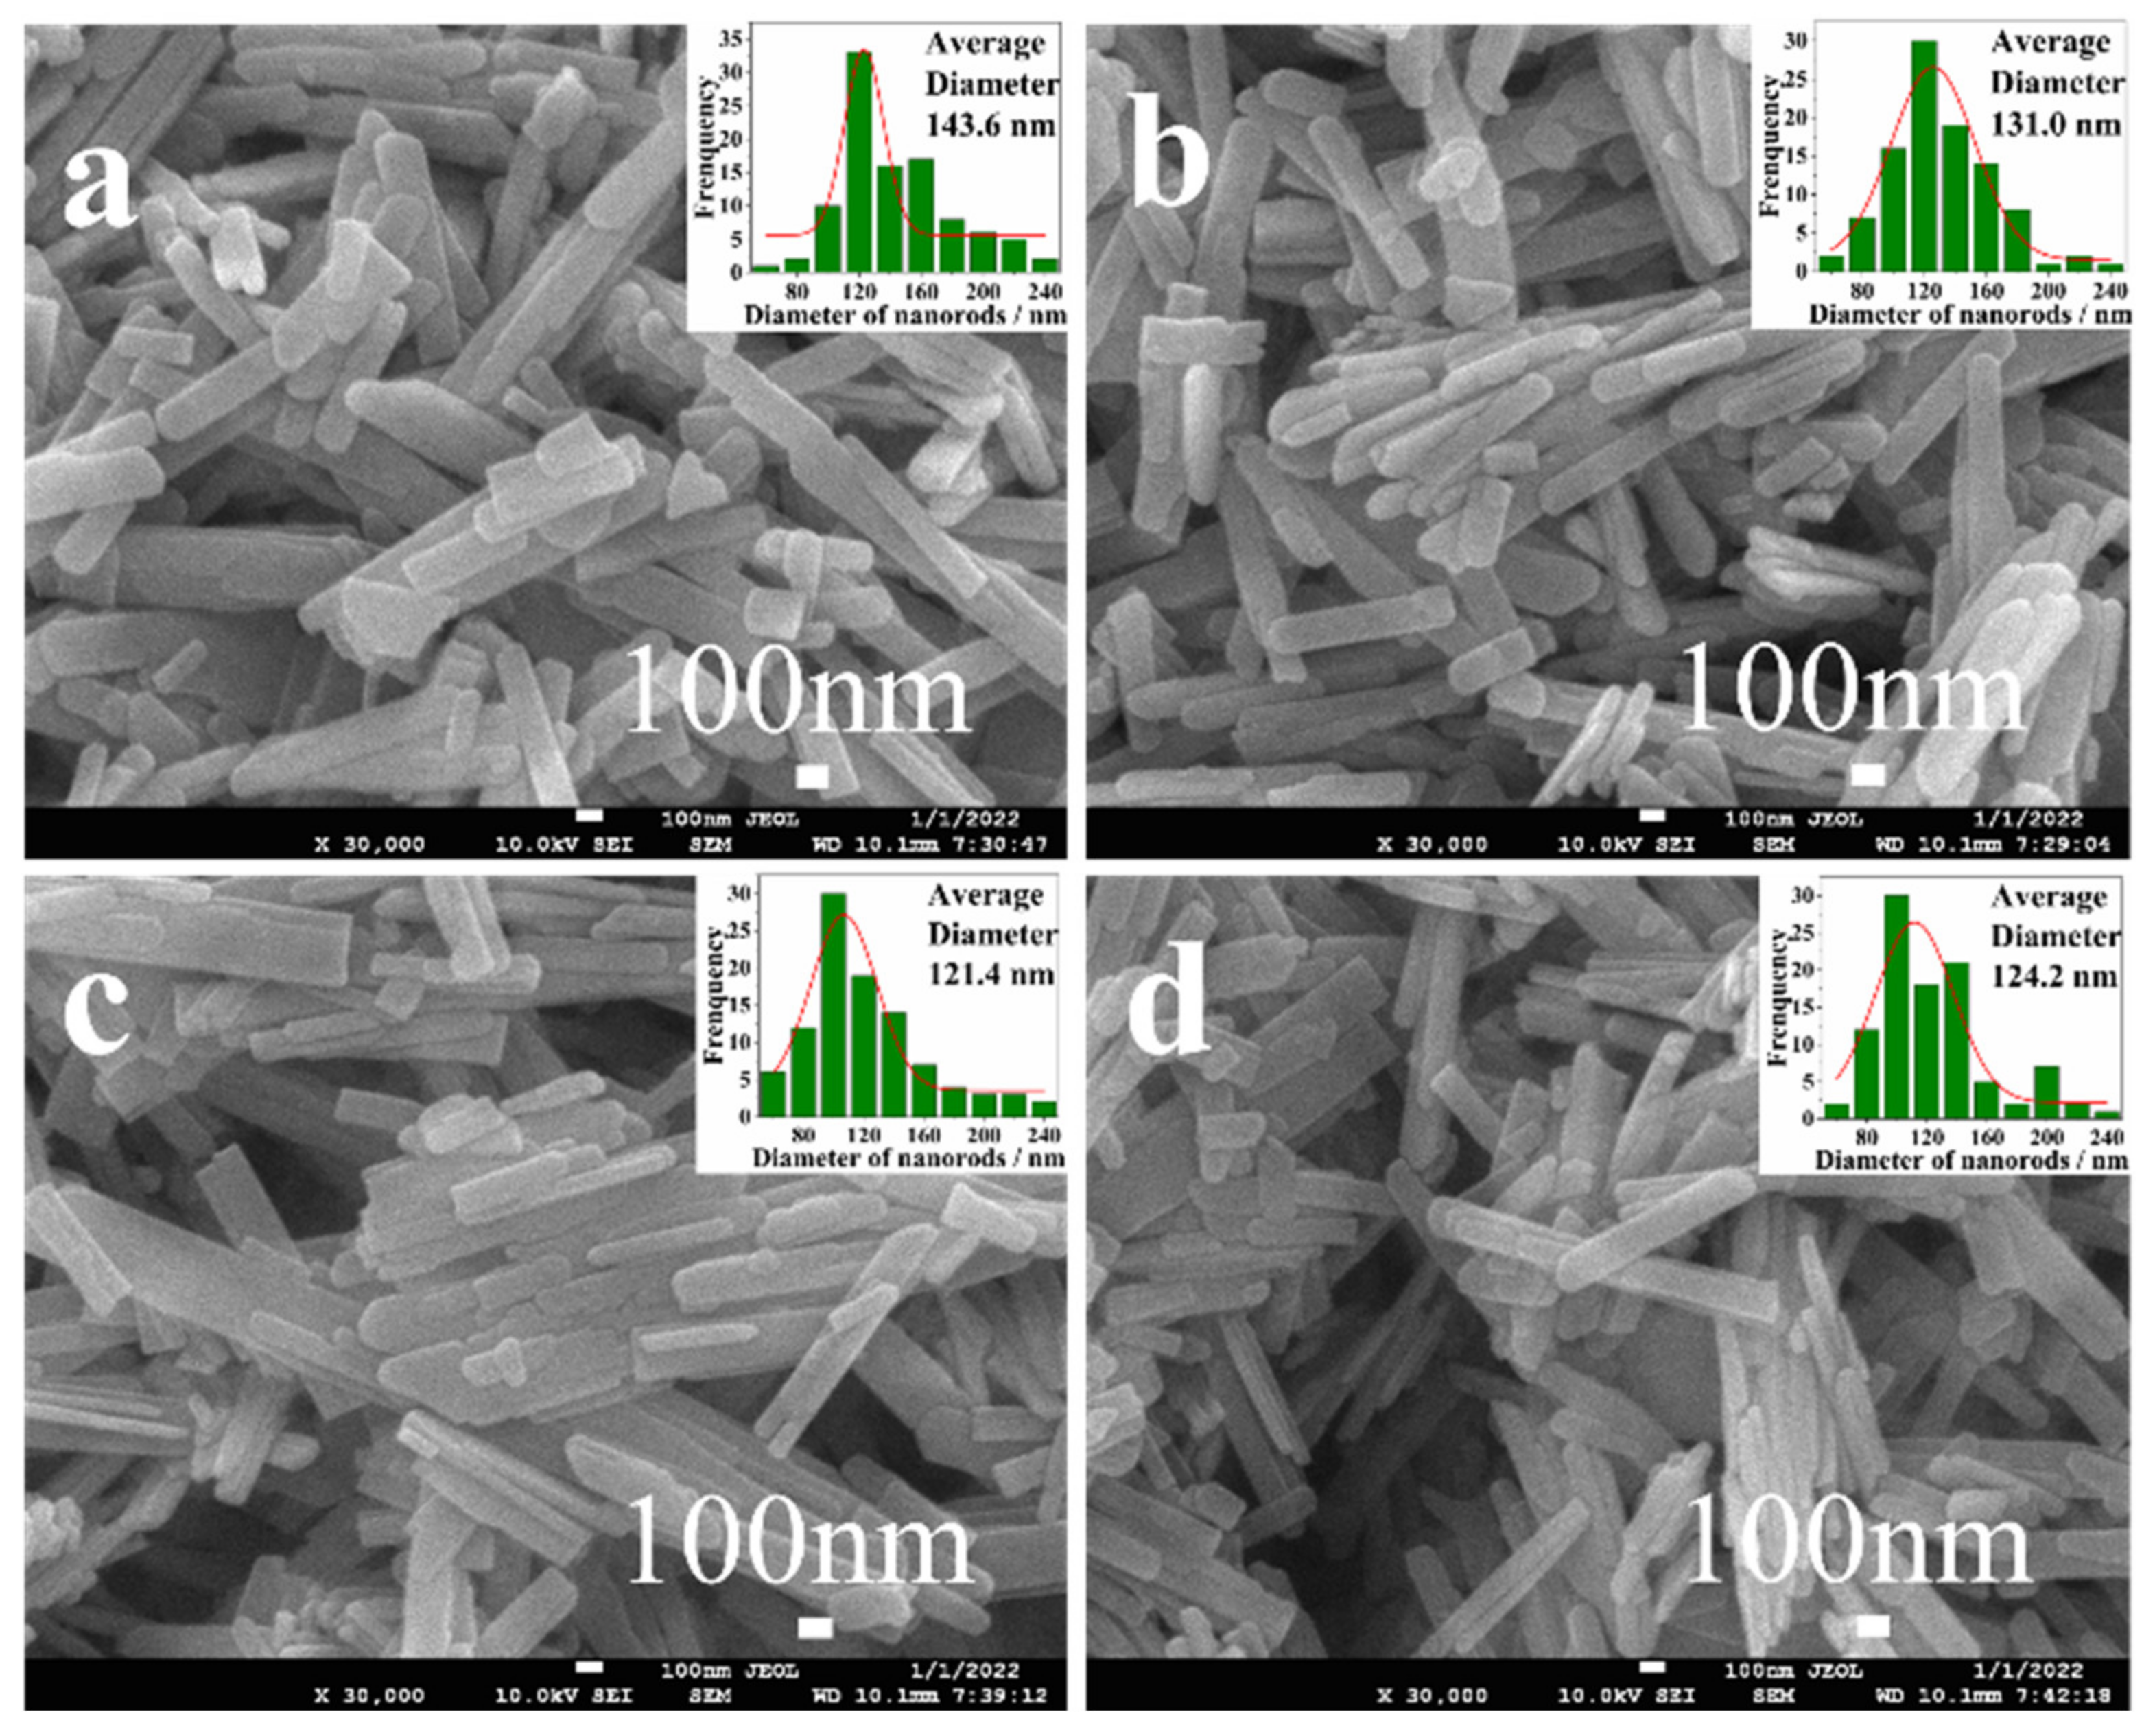
As shown in Figure 4, the microscopic morphologies of all Zn-VO2(B) samples were nanorods. The average width of Zn-VO2(B) nanorods was in the range of 120–145 nm. It was noteworthy that the average width of Zn-doped VO2(B) nanorods had some changes with the increasing of Zn contents. The average width of Zn-VO2(B) nanorods firstly decreased (x < 1.5%) and then increased (x > 1.5%), and the smallest average width size was 121.4 nm at x = 1.5%. The above analysis indicated that Zn doping could regulate the average width of Zn-VO2(B) nanorods. Moreover, an appropriate amount of Zn doping may introduce defects in the VO2(B) lattice, resulting in the inhibition of grain growth of VO2(B) crystals [24].

3.4. Positron Annihilation Analysis

Positron annihilation lifetime spectroscopy was performed to characterize the defects in the Zn-VO2(B) samples. The positron annihilation lifetime spectra were decomposed into three lifetime components (τ1, τ2, τ3) with corresponding intensities (I1, I2, I3). The longest lifetime τ3 with lowest intensity I3 (less than 1.4%) was over 1140 ps, which was ascribed to the annihilation of positrons at the surface of the Zn-VO2(B) samples. The discussion of τ3 and I3 could be ignored due to the extremely low proportion, and I1 and I2 were normalized again. The short lifetime τ1 distributed between 220 and 256 ps was related to the annihilation of the positrons in the perfect lattice and shallow capture region of the experimental samples. The long lifetime τ2 distributed between 355–434 ps was associated with the positron annihilation in the defect area and represented the size of the vacancy-type defects in the system. The intensity I2 reflected the concentration of vacancy defects in the experimental samples. For positron experiment, the positron bulk lifetime (τb) reflected the nature of the crystal lattice. According to the trapping model, the bulk lifetime τb was given by the following formula [25].
τ b = 1 I 1 τ 1 + I 2 τ 2
The positron lifetime parameters τ1, τ2, τ3, τb and I1, I2, I3 of Zn-VO2(B) samples were displayed in Figure 5 and Table 2.
The values of τb had a slight change, which was mainly attributed to the structural distortion caused by Zn doping and the inhomogeneous stress distribution inside the lattice. The value of τ2 decreased significantly with an increasing Zn doping amount until x = 1.5%, whereas it had a moderate increase as x > 1.5%. The minimum positron lifetime of x = 1.5% sample was 356.7 ps. The nonlinear variation of τ2 value with doping concentration could be explained by the competition between the effects of large radius and low valence of Zn ion doping. For VO2(B) samples, the substitution of Zn2+ with a larger radius would generate lattice distortion and increase vacancy defects, whereas the replacement of Zn2+ with a low valence would modify the electron distribution state and decrease the vacancy defects. Under the combined actions of these two factors, when x ≤ 1.5%, the valence state effect played a major role resulted in the τ2 decreasing. When x > 1.5%, the radius effect took the lead role, which contributed to the increase of τ2. The value of τ2/τb ratio could be used to judge the defect type [26]. The ratio in the ranges of 1.1–1.3, 1.3–1.4, and >1.5 corresponded to a single vacancy, double vacancy and vacancy cluster, respectively. The calculated τ2/τb values were 1.39, 1.26, 1.13 and 1.11 for the x = 0.0%, 0.5%, 1.5% and 3.0% samples, which corresponded to double vacancy, single vacancy, single vacancy and single vacancy, respectively. The variation of τ2/τb values provided more direct evidence for the double vacancy decomposition caused by Zn doping. As shown in Figure 5, I2 increased continuously when Zn concentration x increased from 0.0 % to 3.0%. However, the rate of increase dropped significantly when x > 1.5%. This demonstrated that a moderate amount of Zn doping could increase the defect concentration in the Zn-VO2(B) samples, which was due to the structural distortion caused by the substitution of V4+ for Zn2+ with larger ionic radius. In summary, the defect size and concentration in the Zn-VO2(B) samples were greatly affected by Zn doping at the V site.

3.5. Electrochemical Performance Analysis

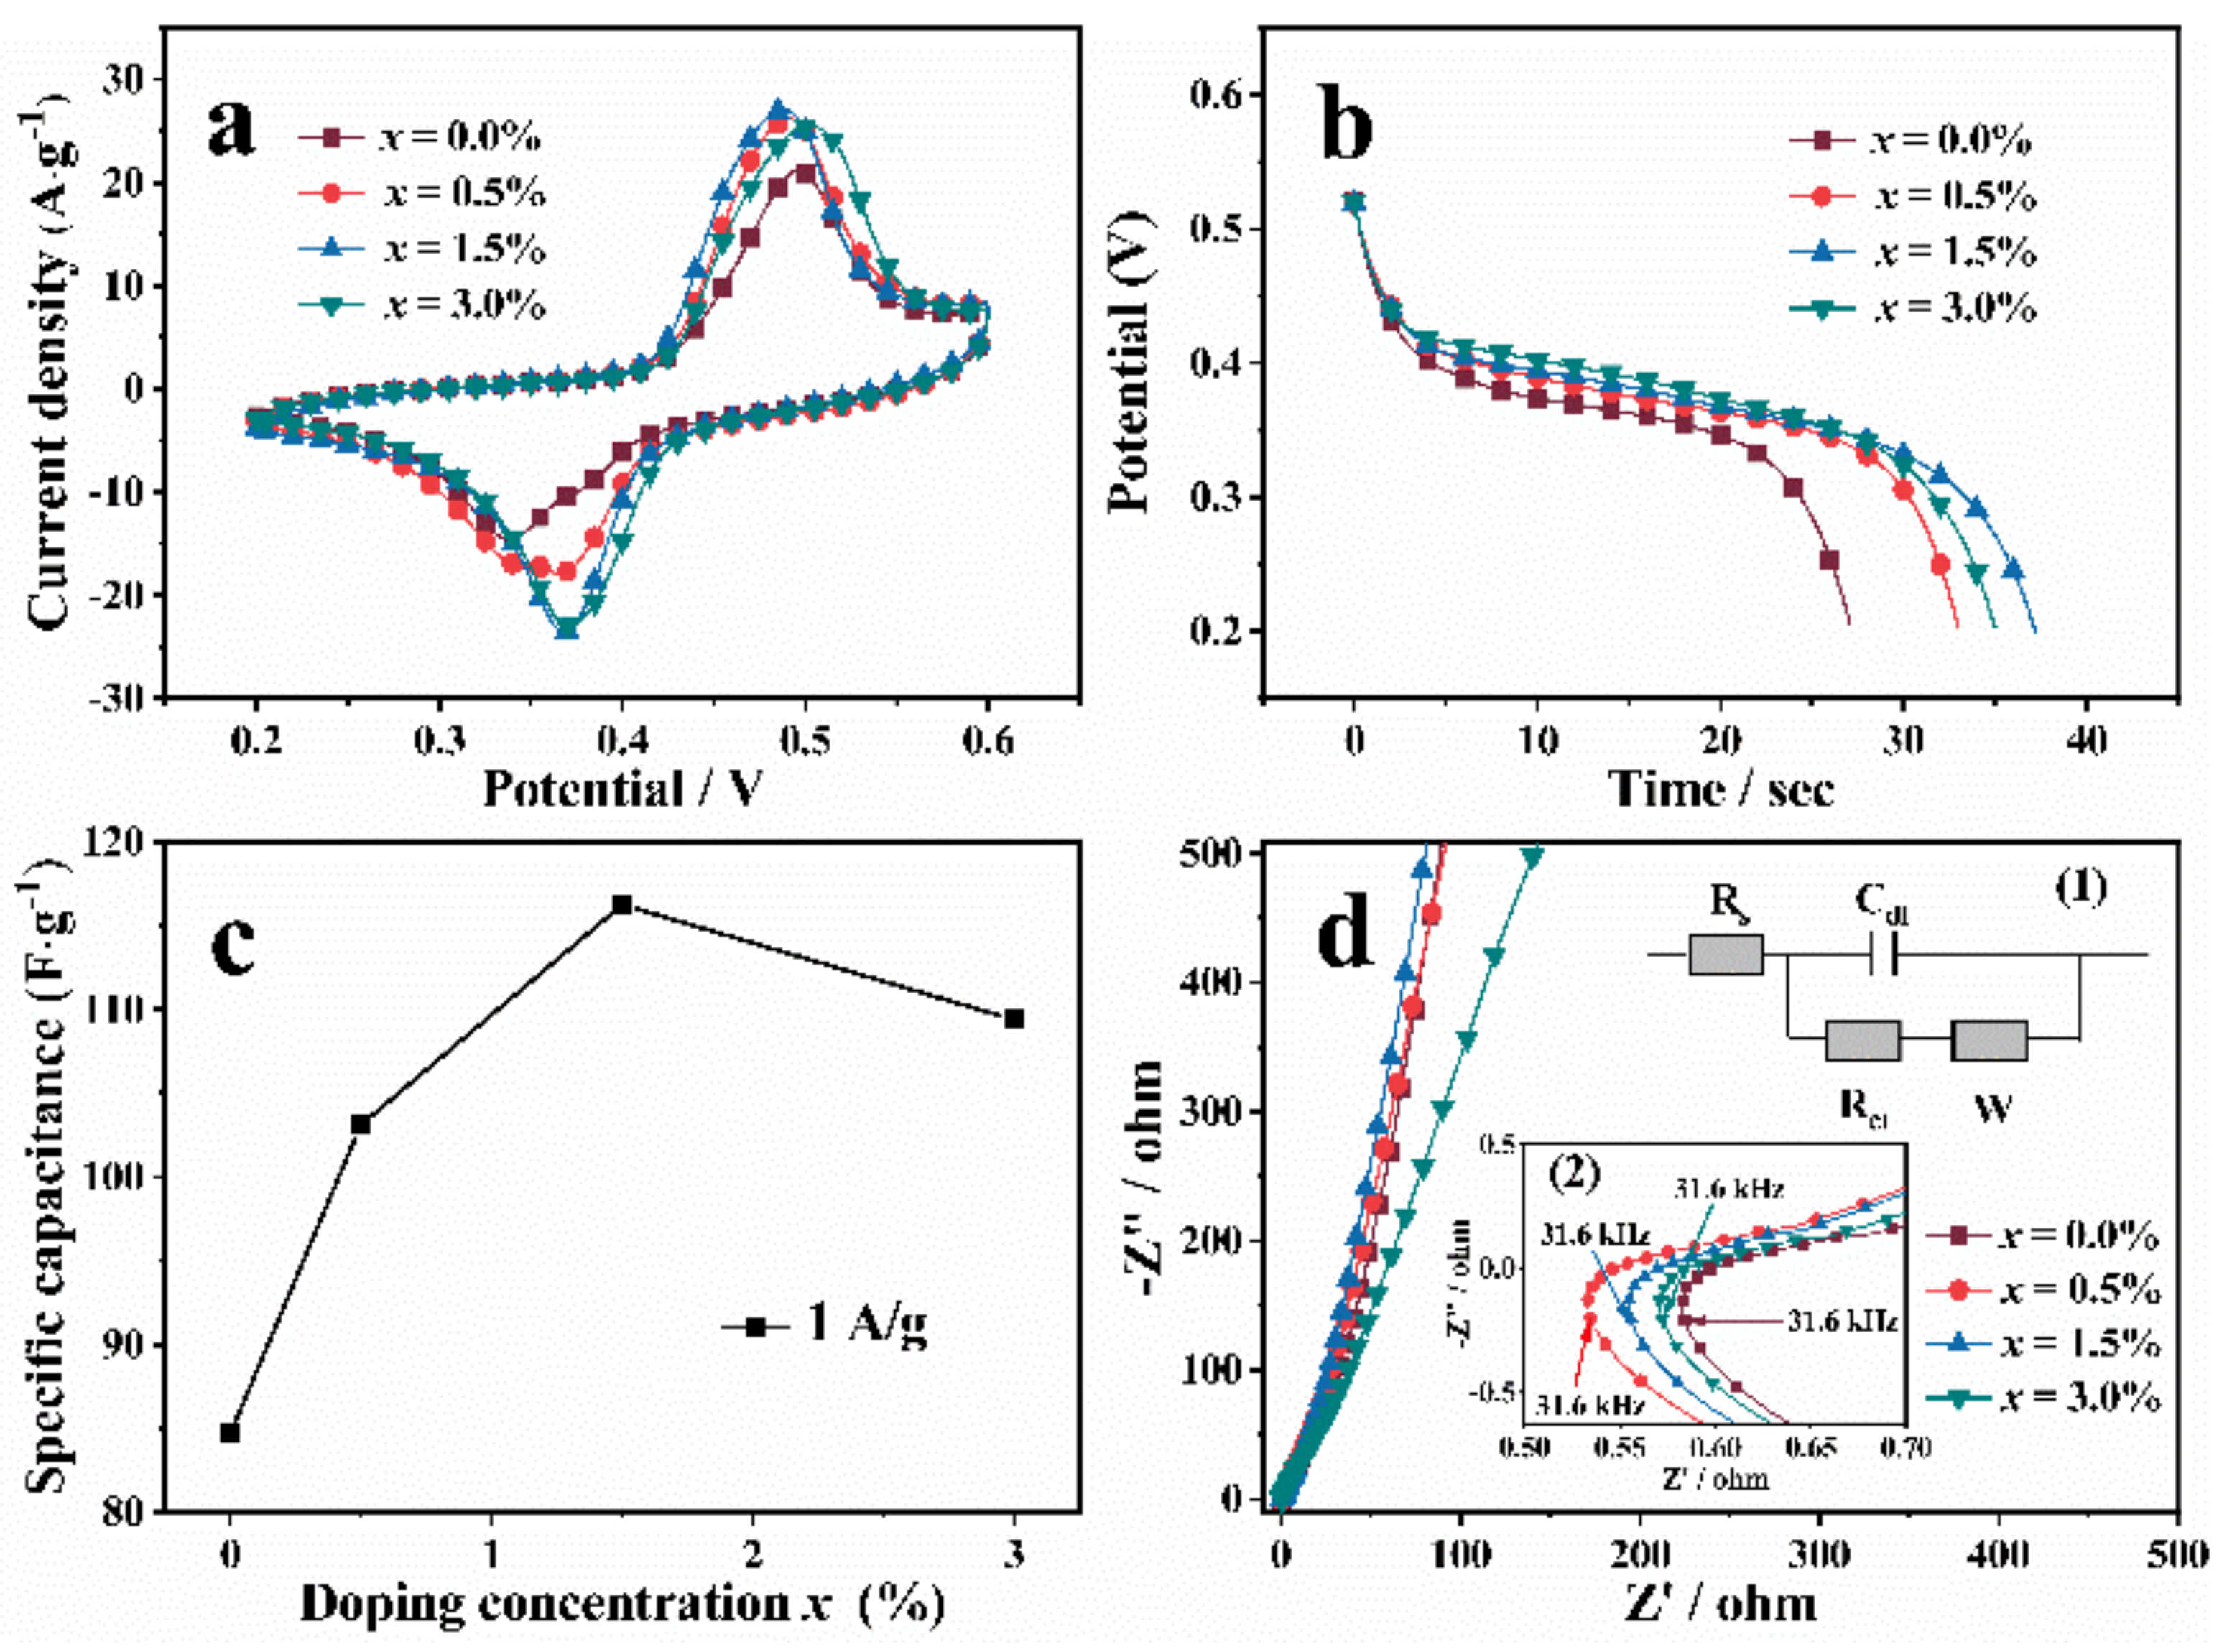
To investigate the electrochemical performances of the synthesized Zn-VO2(B) electrodes, cyclic voltammetry (CV), galvanostatic charge-discharge (GCD) and electrochemical impedance spectroscopy (EIS) were carried out by a three-electrode cell. Figure 6a displayed the CV curves of Zn-VO2(B) electrodes with different doping concentration x at 100 mV/s from 0.2 V to 0.6 V. The current peaks of oxidation-reduction reactions appeared in the CV curve of all the samples. The symmetry of peak shape indicated the superior reversibility and stability of the Zn-VO2(B) electrode, which was conducive to the stable insertion and release of K ion [17]. As shown in Figure 6b, the galvanostatic discharge measurement of the Zn-VO2(B) cathode had been taken at 1 A·g−1. Compared with the undoped VO2(B) cathode, the Zn-VO2(B) cathodes had longer discharge time and discharge voltage platform, as depicted in Figure 6b. The above results indicated that Zn doping was conducive to promoting the K+ insertion process into vanadium oxide. According to the discharge curves of Zn-VO2(B) with different x, the sample with x = 1.5% had longest discharge time and discharge voltage platform. This phenomenon was consistent with SEM results. The sample with x = 0.015 showed the smallest grain size (as shown in Figure 4), which induced the shorter diffusion distance than other samples. The shorter electron transport distance was beneficial to the redox reaction.
The discharge curve can be used to calculate the specific capacitance through the formula [27]
C = 2 i m V d t V 2 V 1 V 2
In the above formula, C stands for the specific capacitance, i m is the current density. V d t is the current integral area, V is the potential, V1 is the initial potential and V2 is the final potential value. The calculated specific capacitances of Zn-VO2(B) with different x were displayed in Figure 6c. With increasing Zn content, the specific capacitances increased continuously up to x = 1.5%, and decreased rapidly at x > 1.5%. The maximum specific capacitance of the x = 1.5% sample was 116.56 F·g−1. Based on the analysis results of CV, GCD and calculated specific capacitance, it could be found that appropriate amount of Zn doping could effectively improve the electrochemical properties of Zn-VO2(B) system. The sample with x = 1.5% had the best electrochemical performances compared with other samples. The enhanced mechanism of electrochemical performance could be explained by the defect evolution. Under the combined action of large radius effect and low valence effect, the vacancy defects inside the sample with x = 1.5% had the smallest volume and the higher concentration. These small volume vacancy defects were equivalent to many small active sites, which promoted the insertion of alkali metal ions (Li+, Na+, K+) into the electrode material and improvement of the discharge capacity of Zn-VO2(B) nanorods.
The EIS was used to study the conductivity and resistance characteristics in the frequency range of 0.01–105 Hz, as shown in Figure 6d. The illustration (1) in Figure 6d showed the simulated equivalent circuit. The W stands for the Warburg impedance; Cdl represents the double layer capacitor on the surface of the electrode; Rct is the charge transfer resistance between the electrode and the electrolyte; Rs delegates the electrolyte resistance. In the low frequency region, the higher slope of the straight line means smaller ion diffusion resistance [28,29,30]. The x = 1.5% sample had a smaller diffusion resistance than other samples. The illustration (2) in Figure 6d showed the amplifying impedance curve in the high-frequency region. The intersection of the impedance curve and the real axis represents the ohmic resistance of the electrolyte and the surface of the electrode, corresponding to Rs in the equivalent circuit. Compared with undoped sample, the resistance of Zn-doped VO2(B) samples decreased.
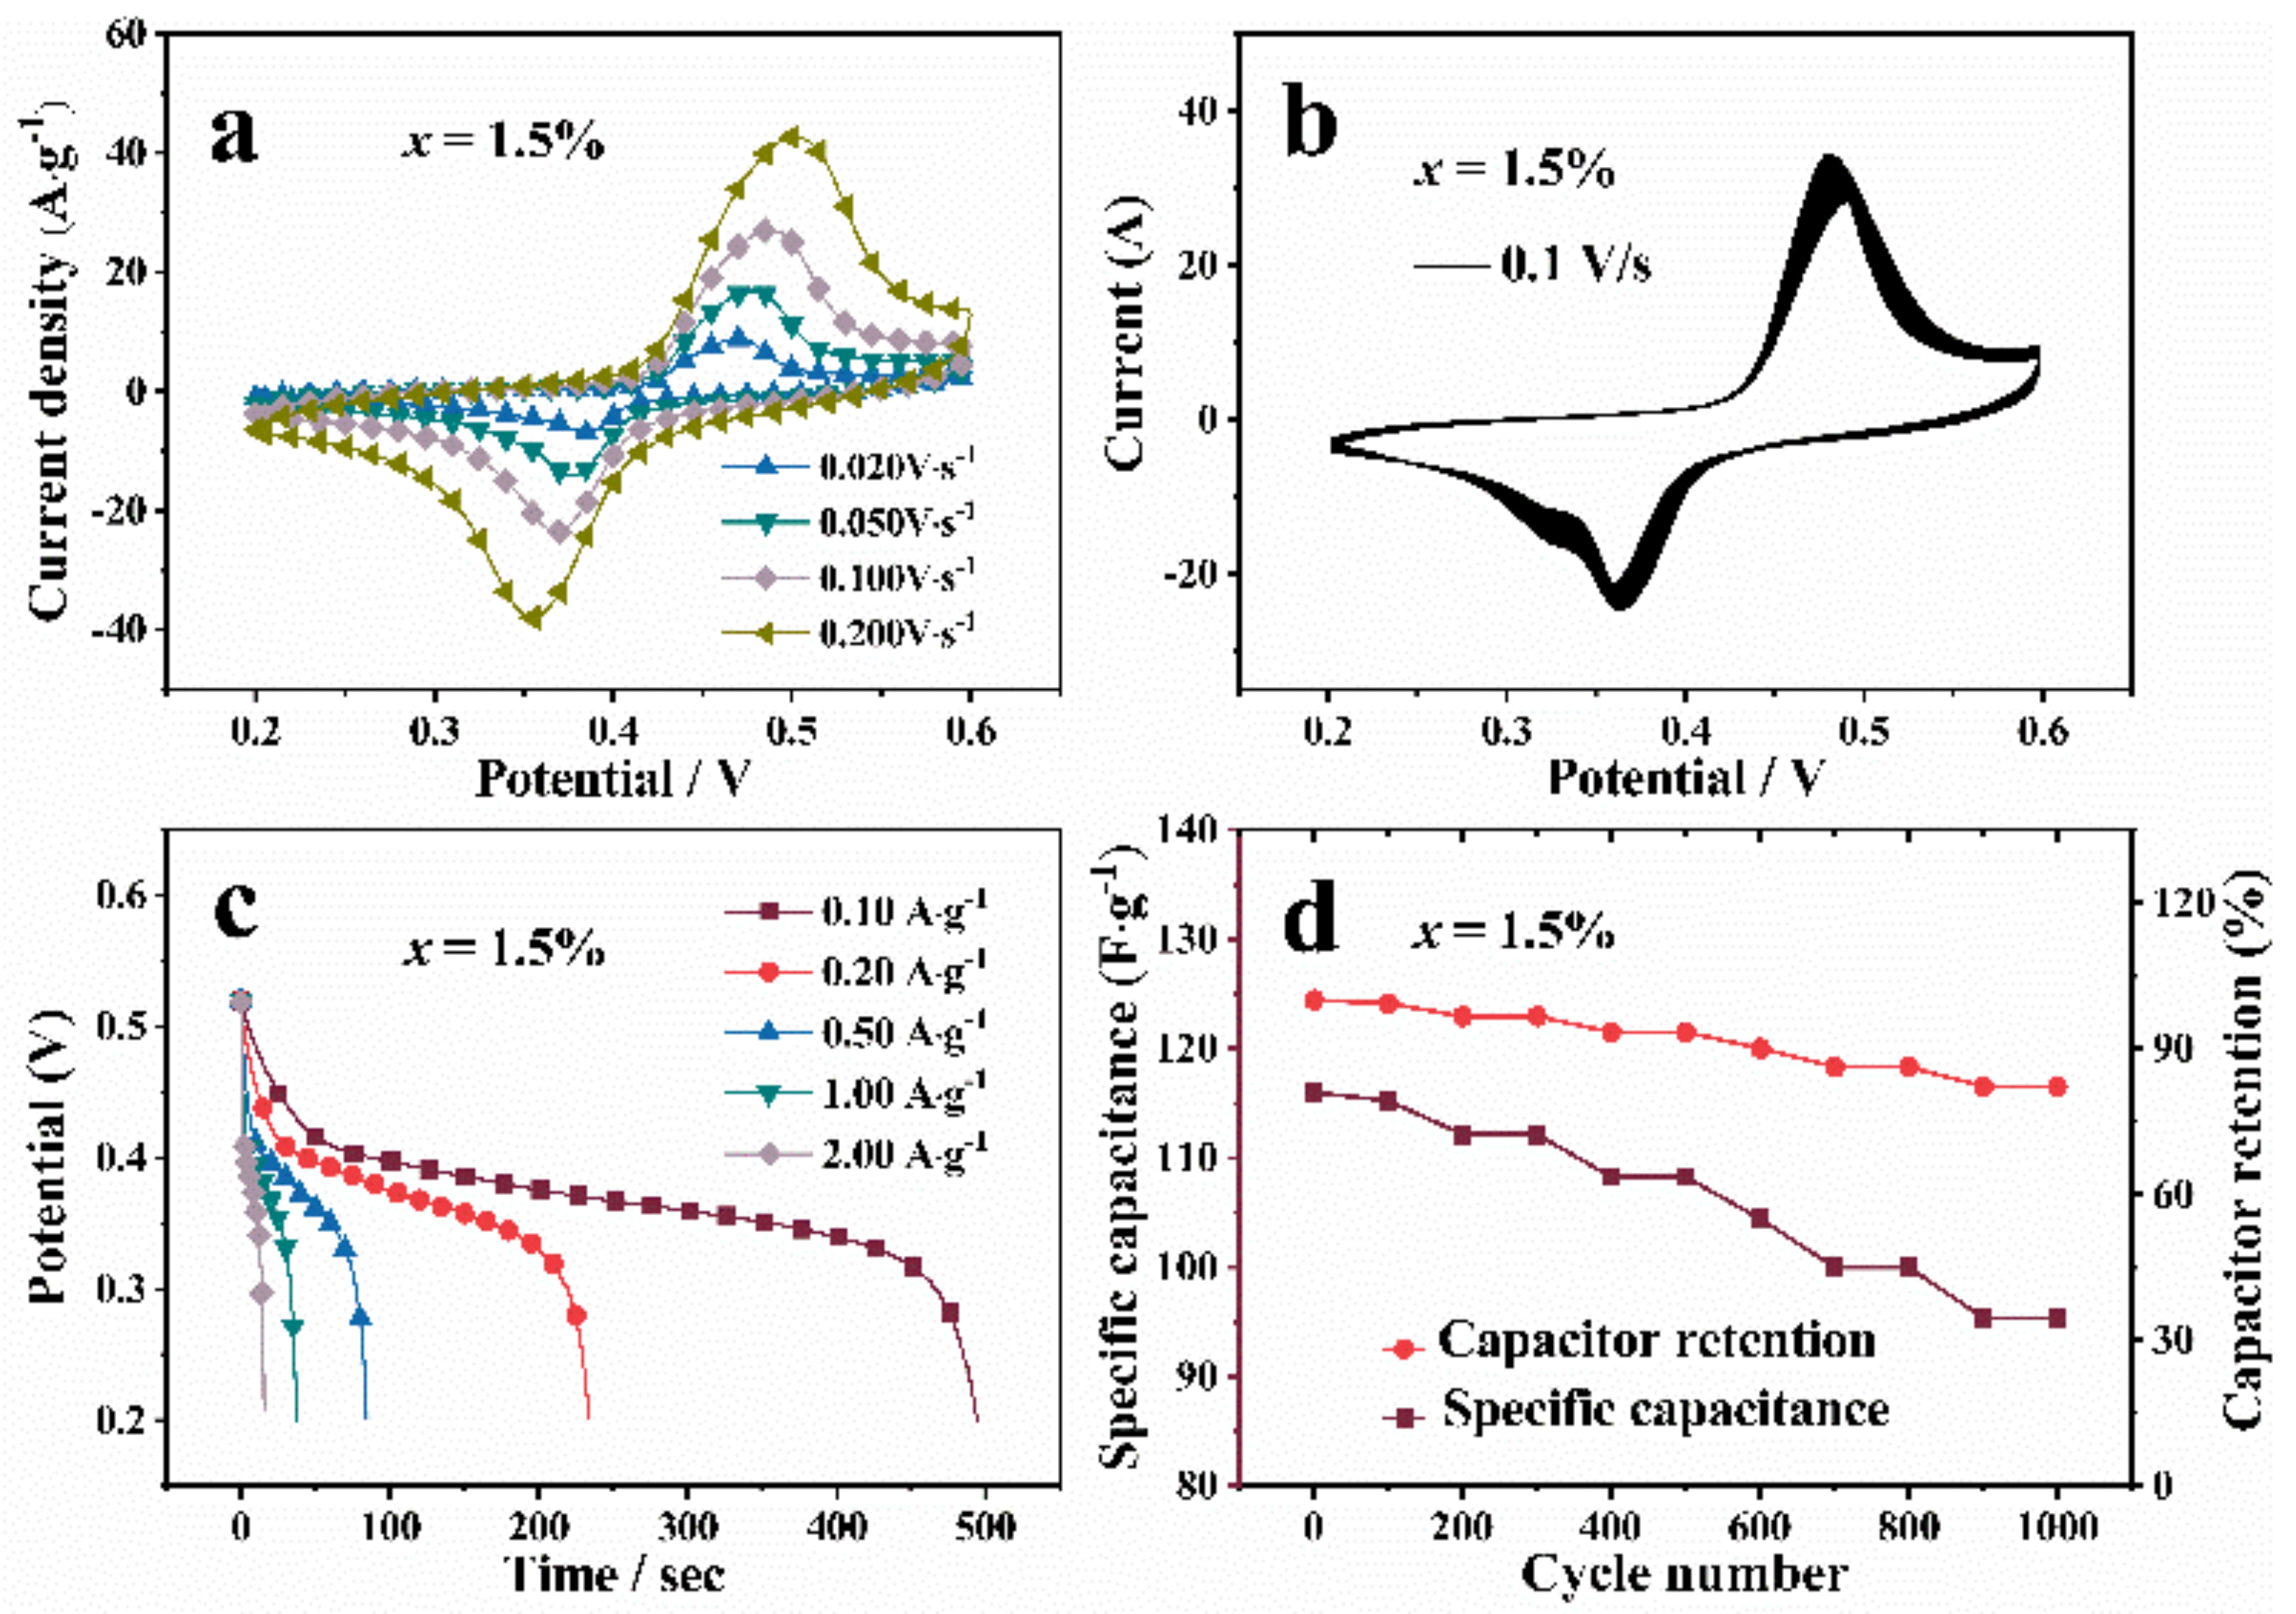
The x = 1.5% sample had the optimum electrochemical performance, and further researchs on x = 1.5% sample was carried out, as shown in Figure 7. Figure 7a showed the CV curves of x = 1.5% sample at 20 mV/s, 50 mV/s, 100 mV/s and 200 mV/s scanning rate. With the increase of scanning rate, the potentials of the oxidation peak and reduction peak also increased significantly, which was attributed to the increase of overpotential. The peak shape did not change obviously with the increase of scanning rate, which proved that the cathode material had good rate performance. As shown in Figure 7b, the CV curves overlapped well after 1000 cycles at 100 mV/s scanning rate, indicating the good reversibility and cyclic stability of Zn-VO2(B) electrodes. Figure 7c showed the galvanostatic discharge curves of Zn-VO2(B) with x = 1.5% sample at the current density of 0.1 A/g, 0.2 A/g, 0.5 A/g, 1.00 A/g, 2.00 A/g. The discharge time and the specific capacitance of electrodes decreased continuously with the gradual increase of current density. The reduced specific capacitance was attributed to the increase of the ionic resistance coefficient caused by the high current discharge process. The cycle performances could be observed in charge/discharge curves, as shown in Figure 7d. The capacitance retention rate of Zn-VO2(B) decreased slightly, but still maintained 88% capacitance retention rate after 1000 cycles, which was superior to pure VO2(B) and other cathode materials. Accordingly, Zn doping can efficiently improve the cyclic stability of the Zn-VO2(B) electrodes and enable the fast kinetics of K ion. The results showed that the synthesized Zn-VO2(B) electrode material had good cycle stability, which was of great significance for the practical application in storage batteries.

4. Conclusions

In summary, the Zn-VO2(B) samples had been synthesized by the method of solvothermal and further heat treatment. The prepared Zn-VO2(B) samples exhibited nanorods structure, offering fast transport paths for K ion together with superior structural stability. The introduction of Zn2+ with larger ion radius and low valence could effectively regulate the defect volume and concentration, leading to the improvement of specific capacitance and long cycle performance of nano-VO2(B) cathode materials. This work suggested that Zn-doped VO2(B) was an efficient and feasible strategy for fabrication of high-performance cathodes and provided experimental support for the potential application of VO2(B) in electrode materials of storage batteries.

Author Contributions

Conceptualization, D.L. and X.Z.; methodology, Q.Z., X.C. and P.Z.; investigation, F.Y., X.W., H.D. and J.C.; writing—original draft preparation, D.L.; writing—review and editing, G.G., C.S., L.X. and X.Z. All authors have read and agreed to the published version of the manuscript.

Funding

This research was supported by the National Natural Science Foundation of China (Nos. 12005194, 11804311, 11775192, 11405148), the Key Research & Development and promotion projects in Henan Province (Nos. 212102210132, 212102210135, 212300410092, 222102230101) and the postgraduate education reform and quality improvement projects in Henan Province (No. HNYJS2021AL027, 21B140012).

Data Availability Statement

The data presented in this study are available on request from the corresponding author.

Conflicts of Interest

The authors declare no conflict of interest.

References

  1. Lopez, J.; Mackanic, D.G.; Cui, Y.; Bao, Z. Designing polymers for advanced battery chemistries. Nat. Rev. Mater. 2019, 4, 312–330. [Google Scholar] [CrossRef]
  2. Hou, H.; Qiu, X.; Wei, W.; Zhang, Y.; Ji, X. Carbon anode materials for advanced sodium-ion batteries. Adv. Energy Mater. 2017, 7, 1602898. [Google Scholar] [CrossRef]
  3. Goodenough, J.B.; Kim, Y. Challenges for rechargeable li batteries. Chem. Mater. 2010, 22, 587. [Google Scholar] [CrossRef]
  4. Cakan, R.D.; Palacin, M.R.; Croguennec, L. Rechargeable aqueous electrolyte batteries, from univalent to multivalent cation chemistry. J. Mater. Chem. A 2019, 7, 20519–20539. [Google Scholar] [CrossRef]
  5. Rashad, M.; Asif, M.; Ahmed, I.; He, Z.; Yin, L.; Wei, Z.X.; Wang, Y. Quest for carbon and vanadium oxide based rechargeable magnesium ion batteries. J. Magnes. Alloy 2020, 8, 364–373. [Google Scholar] [CrossRef]
  6. Zhuang, H.; Yang, F. Vanadium metal-organic framework derived 2D hierarchical VO2 nanosheets grown on carbon cloth for advanced flexible energy storage devices. Surf. Interfaces 2021, 25, 101232. [Google Scholar] [CrossRef]
  7. Wang, L.; Huang, K.W.; Chen, J.; Zheng, J. Ultralong cycle stability of aqueous zinc-ion batteries with zinc vanadium oxide cathodes. Sci. Adv. 2019, 5, 4279. [Google Scholar] [CrossRef]
  8. Luo, H.; Wang, B.; Wang, C.; Wu, F.; Jin, F.; Cong, B.; Dou, S. Synergistic deficiency and heterojunction engineering boosted VO2 redox kinetics for aqueous zinc–ion batteries with superior comprehensive performance. Energy Storage Mater. 2020, 33, 390–398. [Google Scholar] [CrossRef]
  9. Cen, Y.; Li, S.; Zhou, Y.; Cai, X.; Wang, X.; Xiang, Q.; Hu, B.; Yu, D.; Liu, Y.; Chen, C. Ultrathin VO2(B) nanosheets as cathode material for high-performance hybrid magnesium-lithium ion batteries. J. Electrochem. Soc. 2019, 166, A1660. [Google Scholar] [CrossRef]
  10. Liu, Y.Y.; Lv, T.T.; Wang, H.; Guo, X.T.; Liu, C.S.; Pang, H. Nsutite-type VO2 microcrystals as highly durable cathode materials for aqueous zinc-ion batteries. Chem. Eng. J. 2021, 417, 128408. [Google Scholar] [CrossRef]
  11. Khan, Z.; Singh, P.; Ansari, S.A.; Manippady, S.R.; Jaiswal, A.; Saxena, M. VO2 nanostructures for batteries and supercapacitors: A review. Small 2021, 17, 2006651. [Google Scholar] [CrossRef] [PubMed]
  12. Qi, J.; Yan, Y.; Cai, Y.; Cao, J.; Feng, J. Nanoarchitectured design of vertical-standing arrays for supercapacitors: Progress, challenges, and perspectives. Adv. Funct. Mater. 2021, 31, 2006030. [Google Scholar] [CrossRef]
  13. Yan, Y.; Lin, J.; Xu, T.; Liu, B.; Huang, K.; Qiao, L.; Qi, J. Atomic-level platinum filling into Ni-vacancies of dual-deficient NiO for boosting electrocatalytic hydrogen evolution. Adv. Funct. Mater. 2022, 13, 2200434. [Google Scholar] [CrossRef]
  14. Li, M.; Mou, J.; Zhong, L.; Liu, T.; Xu, Y.; Pan, W.; Liu, M. Porous ultrathin W-doped VO2 nanosheets enable boosted Zn2+ (De) intercalation kinetics in VO2 for high-performance aqueous Zn-ion batteries. ACS Sustain. Chem. Eng. 2021, 9, 14193–14201. [Google Scholar] [CrossRef]
  15. Liu, Y.; Zou, Y.; Guo, M.; Hui, Z.; Zhao, L. Boosting the active sites and kinetics of VO2 by Mn pre-intercalated and PVP modified nanostructure to improve the cycle stability for aqueous zinc batteries. Chem. Eng. J. 2022, 433, 133528. [Google Scholar] [CrossRef]
  16. Lv, T.T.; Luo, X.; Yuan, G.Q.; Yang, S.Y.; Pang, H. Layered VO2 @ N–doped carbon composites for high-performance rechargeable aqueous zinc–ion batteries. Chem. Eng. J. 2022, 428, 131211. [Google Scholar] [CrossRef]
  17. Kang, M.S.; Park, S.K.; Nakhanivej, P.; Shin, K.H.; Yeon, J.S.; Park, H.S. Mesoporous VO2(B) nanorods deposited onto graphene architectures for enhanced rate capability and cycle life of Li ion battery cathodes. J. Alloys Compd. 2021, 855, 157361. [Google Scholar] [CrossRef]
  18. Li, Z.; Ren, Y.; Mo, L.; Liu, C.; Hsu, K.; Ding, Y.; Cao, G. Impacts of oxygen vacancies on zinc ion intercalation in VO2. ACS Nano 2020, 14, 5581–5589. [Google Scholar] [CrossRef]
  19. Zhang, W.; Xiao, Y.; Zuo, C.; Tang, W.; Liu, G.; Wang, S.; Luo, P. Adjusting the valence state of vanadium in VO2(B) by extracting oxygen anions for high–performance aqueous zinc–ion batteries. ChemSusChem 2021, 14, 971–978. [Google Scholar] [CrossRef]
  20. Zhang, Z.; Xi, B.; Wang, X.; Ma, X.; Chen, W.; Feng, J.; Xiong, S. Oxygen defects engineering of VO2·xH2O nanosheets via in situ polypyrrole polymerization for efficient aqueous zinc ion storage. Adv. Funct. Mater. 2021, 31, 2103070. [Google Scholar] [CrossRef]
  21. Liu, D.W.; Zhang, Q.J.; Ding, S.P.; Yan, F.F.; Dai, H.Y.; Li, T.; Xue, R.Z.; Chen, J.; Gong, G.S.; Shang, C.; et al. Microdefects evolution and electrochemical performance modulation of Mn doped VO2(B) nanorods. J. Alloys Compd. 2022, 911, 164975. [Google Scholar] [CrossRef]
  22. Liu, D.W.; Yang, P.; Dai, H.Y.; Li, T.; Xue, R.Z.; Chen, J.; Chen, Z.P. Effects of oxalic acid concentration on the microstructures and properties of nano–VO2(B). J. Solid State Electrochem. 2019, 23, 2951–2959. [Google Scholar] [CrossRef]
  23. Kang, J.; Liu, J.; Shi, F.; Dong, Y.; Jiang, S. The thermochromic characteristics of Zn-doped VO2 that were prepared by the hydrothermal and post-annealing process and their polyurethane composite films. Ceram. Int. 2021, 47, 15631–15638. [Google Scholar] [CrossRef]
  24. Zhai, X.Z.; Deng, H.M.; Zhou, W.L.; Yang, P.X.; Chu, J.H. Strain-induced structural phase transition, ferromagnetic and optical properties of Bi1−xTbxFeO3 thin films. J. Phys. D. 2015, 48, 385002. [Google Scholar] [CrossRef]
  25. Puska, M.; Nieminen, R. Theory of positrons in solids and on solid surfaces. Rev. Mod. Phys. 1994, 66, 841. [Google Scholar] [CrossRef]
  26. Wang, M.; Dai, H.; Li, T.; Chen, J.; Yan, F.; Xue, R.; Xing, X.; Chen, D.; Ping, T.; He, J. The evolution of structure and properties in GdMn(1-x)TixO3 ceramics. J. Mater. Sci. Mater. Electron. 2021, 32, 27348–27361. [Google Scholar] [CrossRef]
  27. Li, Z.; Qin, Z.; Zhang, W.; Li, Z. Controlled synthesis of Ni(OH)2/MoS2 nanohybrids for high-performance supercapacitors. Mater. Chem. Phys. 2018, 209, 291–297. [Google Scholar] [CrossRef]
  28. Encinas-Sánchez, V.; de Miguel, M.; Lasanta, M.; García-Martín, G.; Pérez, F. Electrochemical impedance spectroscopy (EIS): An efficient technique for monitoring corrosion processes in molten salt environments in CSP applications. Sol. Energy Mater. Sol. Cells 2019, 191, 157–163. [Google Scholar] [CrossRef]
  29. Brug, G.J.; van den Eeden, A.L.; Sluyters-Rehbach, M.; Sluyters, J.H. The analysis of electrode impedances complicated by the presence of a constant phase element. J. Electroanal. Chem. 1984, 176, 275–295. [Google Scholar] [CrossRef]
  30. Yan, Y.T.; Lin, J.H.; Liu, T.; Liu, B.S.; Wang, B.; Qiao, L.; Tu, J.C.; Cao, J.; Qi, J.L. Corrosion behavior of stainless steel-tungsten carbide joints brazed with AgCuX (X = In, Ti) alloys. Corros. Sci. 2022, 200, 110231. [Google Scholar] [CrossRef]
Figure 1. The schematic diagram of the preparation process of the Zn-VO2(B).
Nanomaterials 12 03196 g001
Figure 2. (a) XRD patterns of Zn-VO2(B) samples with different x values; (b) magnified patterns around 2θ = 25°.
Nanomaterials 12 03196 g002
Figure 3. (a) X-ray photoelectron full-scan spectrum of Zn-VO2(B) samples, illustrations is X-ray photoelectron spectra of Zn 2p3/2 and Zn 2p1/2; (b) X-ray photoelectron spectra of V 2p3/2 and V 2p1/2.
Nanomaterials 12 03196 g003
Figure 4. The SEM images of Zn-VO2(B) samples: (a) x = 0.0%; (b) x = 0.5%; (c) x = 1.5%; (d) x = 3.0%.
Nanomaterials 12 03196 g004
Figure 5. The positron lifetime spectra τ1, τ2, τ3 and I1, I2, I3 of Zn-VO2(B) with different x values.
Nanomaterials 12 03196 g005
Figure 6. The Electrochemical performance of Zn-VO2(B) electrodes with different x values: (a) CV curves at the scan rate of 100 mV·s−1; (b) Potential vs. time for discharge profiles at the current density of 1 A·g−1; (c) Specific capacitance of samples at 1 A·g−1; (d) Nyquist plots curves; illustration (1) is equivalent circuit diagram; illustration (2) is amplifying high frequency zone.
Nanomaterials 12 03196 g006
Figure 7. The Electrochemical measurements of Zn-VO2(B) sample with x = 1.5%: (a) CV curves at different scan rates; (b) CV curves of 1000 cycles at 100 mV/s scanning rate; (c) galvanostatic discharge profiles at different current density; (d) cycling performances at 0.1 A·g−1.
Nanomaterials 12 03196 g007
Table 1. The calculated lattice constants (a, b, c, β) and unit cell volumes (V) of the Zn-VO2(B) samples.
Doping
Concentration
Lattice Parametersβ
xa(Å)b(Å)c(Å)V(Å3)
0.0%12.0850763.6924866.435457274.704106.948
0.5%12.1075833.6996086.451428276.424106.952
1.5%12.1038913.6970086.451905276.200106.929
3.0%12.1098813.6990876.456372276.705106.936
Table 2. The positron lifetime parameters τ1, τ2, τ3, I1, I2, I3 and τb of Zn-doped VO2(B) with different doping concentration x.
SamplePositron Lifetime/psIntensity/%Bulk Lifetime/ps
xτ1τ2τ3I1I2I3τb
0.0%256.0433.11149.358.754539.87291.3726310.9707
0.5%248.9388.71315.748.492451.19530.3123306.2451
1.5%222.2356.71277.823.277775.96080.7615314.7481
3.0%228.3361.71479.520.413979.02560.5605324.7799
Publisher’s Note: MDPI stays neutral with regard to jurisdictional claims in published maps and institutional affiliations.