Abstract
This paper aims at studying a sensor concept for possible integration in magnetic field-based lab-on-chip devices that exploit ferromagnetic resonance (FMR) phenomena in magnonic crystals. The focus is on 2D magnetic antidot arrays, i.e., magnetic thin films with periodic non-magnetic inclusions (holes), recently proposed as magnetic field sensor elements operating in the gigahertz (GHz) range. The sensing mechanism is here demonstrated for magnetic nano/microbeads adsorbed on the surface of permalloy (Ni80Fe20) antidot arrays with a rhomboid lattice structure and variable hole size. Through extensive micromagnetic modelling analysis, it is shown that the antidot arrays can be used as both bead traps and high-sensitivity detectors, with performance that can be tuned as a function of bead size and magnetic moment. A key parameter for the detection mechanism is the antidot array hole size, which affects the FMR frequency shifts associated with the interaction between the magnetization configuration in the nanostructured film and the bead stray field. Possible applications of the proposed device concept include magnetic immunoassays, using magnetic nano/microbeads as probes for biomarker detection, and biomaterial manipulation.
1. Introduction
In the last two decades, advances in nanostructure fabrication have driven the development of miniaturized magnetic sensors for innovative applications in the industrial, automotive, aerospace, ICT, metrology and calibration, green technology, and medical fields [1,2,3,4,5,6,7,8,9,10,11]. In biomedicine, they can be employed in the detection of functionalized magnetic labels—e.g., magnetic nanoparticles or nano/microbeads—for molecular sensing and targeting, drug delivery, sample purification, and cell manipulation [5,6,7,8,9,10,11]. In the panorama of magnetic biosensors, magnetoresistance- and Hall-effect-based devices have optimal properties, offering very high sensitivity and magnetic field resolution, as well as easy miniaturization and lab-on-chip integration [5,6,7,8,9,10,11,12,13,14,15].
Another way to measure low magnetic fields, such as those produced by magnetic nanoparticles or nano/microbeads, is to exploit the ferromagnetic resonance (FMR) modes of spintronic devices [16,17], magnonic crystals [18,19,20,21], magnetic disks [22], nanoparticles [23,24], or thin films [25]. This technology has the advantage of reducing the impact of low-frequency 1/f noise [16]. Recently, it was shown that magnonic crystals based on magnetic nanostructured films can be employed as high-sensitivity magnetic field detectors, exploiting their dynamic behavior in the gigahertz (GHz) range [19,20,21]. The sensing mechanism was demonstrated for the case of magnetic nano/microparticles trapped on the surface of 2D permalloy (Ni80Fe20) antidot arrays, i.e., magnetic thin films nanostructured with periodic closely packed non-magnetic inclusions (holes) [26]. In particular, the magnetic stray field generated by the particles interacts with the magnetization state of the antidot array, producing a measurable shift in its FMR frequencies or FMR fields [19,20,21]. The geometric properties of the nanostructured film lattice can be tuned to maximize the generated signal, considering that both the static and dynamic behaviors of magnetic antidot arrays are strongly influenced by the lattice geometry and by the hole size, density, and shape [26,27,28,29,30,31,32].
In this study, we investigated with micromagnetic modelling the dynamic response of 2D permalloy antidot arrays with a rhomboid lattice structure and circular holes, under the influence of the stray field generated by magnetic beads dispersed on the nanostructured film. The simulations were performed by assuming the beads to be immobilized on the film surface in correspondence of the holes, where the magnetic interaction should be stronger. This hypothesis was corroborated by a preliminary evaluation of the magnetic force (attractive or repulsive) exerted by the antidot array on the magnetic beads, for different values of the applied bias field.
We performed an extensive parametric analysis, varying the bead size and saturation magnetic moment as well as the diameter of the antidot array holes. The final objective was to find the optimal geometrical configuration of the nanostructured film in terms of magnetic particle trapping and magnetic field sensitivity, as a function of the properties of the magnetic beads to be manipulated and detected. Our attention was focused on the shifts in the FMR frequencies of the antidot array, caused by the presence of the beads. The evaluation of the FMR behavior was performed by means of a parallelized micromagnetic code, which was engineered to run on graphics processing units (GPUs) to efficiently solve the Landau–Lifshitz–Gilbert (LLG) equation in large magnetic objects [33].
2. Materials and Methods
2.1. Micromagnetic Simulations
The micromagnetic simulations were performed by means of an in-house numerical code, which was implemented to solve the LLG equation by exploiting parallel computing on GPUs [33]. The input geometry was a grid of macrocells, representing the spatial period of the magnetic antidot array, and discretized into T hexahedral elements with size in the range of the permalloy exchange length (~5 nm) [34]. The magnetization vector M, assumed to be uniform in each hexahedron (centered on r0), was updated by time-integrating the LLG equation:
where MS is the saturation magnetization, γ = 2.21 · 105 m A−1 s−1 is the absolute value of the gyromagnetic ratio, and α is the damping coefficient. In Equation (1), the effective field Heff is the sum of the applied field Ha (spatially uniform for the studied cases), the magnetostatic field Hm, the exchange field Hex, and the magnetocrystalline anisotropy field Han (negligible for permalloy). Heff can also include the stray field produced by magnetic beads, namely, Hbeads.
The exchange field Hex was calculated with a non-standard finite difference technique able to handle non-structured meshes, as detailed in [35].
The demagnetizing field Hm was computed with a fast multipole technique, after being decomposed into a short- and a long-range term [36,37]. The short-range term (HmSR) includes the dipole–dipole interactions between the hexahedron of calculus (centered on r0) and the hexahedra belonging to Nnear macrocells, which comprise the one containing r0 and the adjacent ones. In particular, HmSR was calculated by integrating and summing the Green’s function gradients over the boundary (∂Ωi) of each hexahedron (with the unit normal vector ni) within the Nnear macrocells:
where Nnear = (2λ+1)2, and λ is the number of layers of the adjacent macrocells considered in the approximation.
The long-range term (HmLR) includes the dipole–dipole interactions with the remaining Nfar macrocells and was calculated via the multipole expansion technique with order p:
where the time-dependent function incorporates the contributions to the macrocell of calculus (centered on O0) of all the multipole moments associated with the Nfar macrocells. The term depends on the spatial discretization only, and was evaluated at the beginning of the simulation.
Hm was calculated with the lowest multipole expansion order (p = 2) and λ = 1; this choice of parameters enables us to strongly reduce the number of stored terms and the computational complexity, while also maintaining a good level of accuracy [34].
The LLG equation was time-integrated by means of a norm-conserving scheme based on the Cayley transform and the Heun algorithm [38,39]. As discussed in [40], this approach guarantees an efficient determination of equilibrium points, such as the ground states for the dynamic response.
2.2. Calculation of Bead Stray Field and Magnetic Force
In Equation (1), the stray field produced by the magnetic beads was calculated as follows:
where Nbeads is the number of beads, mbead,n is the magnetic moment of the n-th bead, and rn is the vector position of its barycenter [41]. The bead magnetic moment was approximated by means of the Langevin function:
where mS and H0 are the bead saturation magnetic moment and characteristic field, respectively, assumed to be the same for all the beads. These two parameters were derived by fitting the experimental magnetization curve of the beads. Hfilm is the stray field produced by the nanostructured magnetic film (i.e., the antidot array) in correspondence of the bead barycenter rn, calculated once known the magnetization vector in all the Q hexahedra discretizing the entire film. Hfilm was determined as follows:
The magnetic force that the magnetic antidot array exerts on the n-th bead is expressed as follows:
where μfluid is the magnetic permeability of the fluid in which the beads are immersed, here assumed to be equal to the vacuum permeability μ0 [41,42].
2.3. Micromagnetic Simulation Parameters
The micromagnetic simulations were performed by considering magnetic parameters typical of permalloy, i.e., the magnetization saturation was set to 860 kA/m, the exchange constant was set to 13 pJ/m, and the magnetocrystalline anisotropy was neglected. Regarding the choice of the damping coefficient α for the modelling of the static and dynamic regimes, we adopted the approach proposed in [43]. In particular, the FMR behavior was determined by fixing α to a realistic value for non-doped (pure) permalloy, i.e., α = 0.01 [44]; the corresponding time evolution simulations were carried out with a time step of 250 fs. The ground states for the dynamic response were computed with α = 0.1; the increase in α was motivated by the need to reduce the computational time in the determination of the magnetization equilibrium configurations, as described in [40]. With such a value of the damping coefficient, the convergence to equilibrium can be indeed accelerated and, with the Cayley-transform-based time-integration scheme, time steps in the order of 2.5 ps can be used without causing numerical instability [38].
3. Results and Discussion
Our analysis was focused on permalloy antidot arrays with a rhomboid lattice structure [26] and circular holes with diameter dhole (variable from 250 nm to 400 nm) and center-to-center hole distance c fixed to 500 nm. The considered nanostructured film, schematized in Figure 1a together with the configuration of the FMR excitation, has a thickness of 10 nm and a side length of 4.5 µm. The lattice with the unit cell depicted in Figure 1b is characterized by easy and hard axes whose directions depend on the geometric parameters dhole and c. As described in [27], for dhole = 250 nm the easy axes are aligned along the directions where the non-magnetic inclusions are closest to one another. These correspond to the x-axis and the geometrically equivalent directions, shifted in multiples of 60°, while the hard axes are parallel to the directions where the non-magnetic inclusions are farthest, such as the y-axis. A different anisotropy behavior was found when dhole = 400 nm, as detailed in [27].
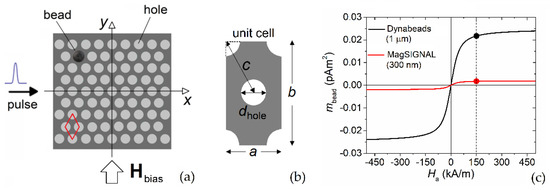
Figure 1.
(a) Schematic of the permalloy nanostructured film (antidot array with rhomboid lattice structure). The schematic includes the configuration of the bias field and of the FMR excitation with a Gaussian pulse waveform. (b) Schematic of the unit cell of the antidot array, with relevant geometric parameters. (c) Magnetization curves of MagSIGNAL-STA and Dynabeads MyOne beads, fitted to the experimental data from the manufacturers. The dots indicate the magnetic moment values when a bias field of 150 kA/m is applied.
Two types of commercial magnetic particles were considered for the detection, namely, MagSIGNAL-STA beads from MagnaMedics GmbH (Aachen, Germany), and Dynabeads MyOne beads from Thermo Fisher Scientific (Carlsbad, CA, USA), developed for use as detection labels in magnetic immunoassays [45]. The former have a diameter dbead of 300 nm and a saturation magnetic moment around 0.002 pAm2, while the latter have a diameter of 1 µm and a saturation magnetic moment around 0.0245 pAm2; the fitting magnetization curves, determined using Equation (5), are reported in Figure 1c. To prove that the beads could be trapped at the antidot array holes, we first calculated the spatial distribution of the magnetic force exerted on the beads by the nanostructured film. Then, we simulated the FMR behavior of the film, comparing the FMR spectra obtained with and without beads immobilized on the film surface.
3.1. Analysis of Bead Trapping
The mechanism of bead trapping was investigated by calculating the magnetic force Fmag due to the stray field of the permalloy antidot array Hfilm, as a function of bead height h, i.e., the vertical distance between the bead barycenter and the film top surface (Figure 2a). The hole diameter was fixed to 330 nm. First, we assumed that the film was quasi-saturated along the y-axis with an applied bias field with amplitude equal to 150 kA/m. Figure 2b shows the map of the vertical component of Fmag estimated for the MagSIGNAL-STA beads on a plane orthogonal to the film and parallel to the longer side of the unit cell (yz-plane). The force becomes negligible when h is greater than 0.5 µm; in proximity to the film surface, the periodic spatial distribution of the force vertical component is well evident, with negative peaks over the holes (attractive action) and positive peaks over the striped regions along the x-axis not containing holes (repulsive action). The alternation of positive and negative forces is well evident in Figure 2c, which depicts the spatial distribution of the vertical component of Fmag estimated for the MagSIGNAL-STA beads on a plane parallel to the film (xy-plane), when the beads are in contact with the film surface (h = dbead/2). The maximum attractive force is 72 pN, while the maximum repulsive force is 83 pN; lower attractive forces (around 45 pN) can be found between the holes. The magnetostatic coupling is weaker for the 1 µm beads (Dynabeads MyOne), with peaks of the attractive force in the order of 2 pN at the lowest bead–film distance (Figure 2d).
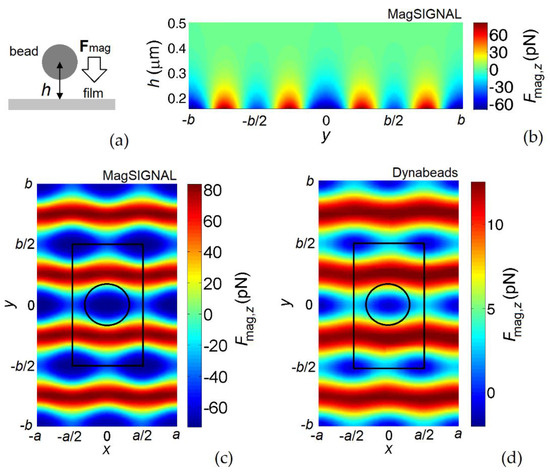
Figure 2.
(a) Schematic of bead trapping. (b) Map of the vertical component of the magnetic force for MagSIGNAL-STA beads, calculated on a plane orthogonal to the permalloy nanostructured film (with dhole = 330 nm) and parallel to the longer side of the unit cell. Maps of the vertical component of the magnetic force calculated on a plane parallel to the film for (c) MagSIGNAL-STA and (d) Dynabeads MyOne beads. The beads are assumed to be in contact with the film surface. For all maps, the applied bias field is equal to 150 kA/m.
The decrease in the applied bias field leads to a gradual reduction in Fmag and to a strong modification of its spatial distribution, as demonstrated by Figure 3, which presents the results obtained for the MagSIGNAL-STA beads when Hbias is equal to 50 kA/m (Figure 3a) and 25 kA/m (Figure 3b). Because of the change in the film demagnetizing field pattern driven by the reduction in magnetostatic energy, the stray field lines are strongly modified, and for the lowest bias field value the peaks of the attractive force no longer appear over the holes, but over the regions between the holes. In correspondence of the hole centers, for the MagSIGNAL-STA beads the vertical component of Fmag varies from −44 pN to −23 pN when reducing Hbias from 50 kA/m to 25 kA/m, with an overall decrease of 68% from Hbias = 150 kA/m. Over the regions between the holes the variation ranges from −40 pN to −28 pN, with an overall decrease of 38% from Hbias = 150 kA/m.
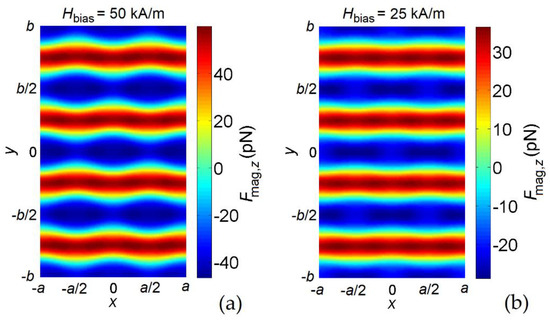
Figure 3.
Maps of the vertical component of the magnetic force calculated on a plane parallel to the permalloy nanostructured film for MagSIGNAL-STA beads, applying a bias field of (a) 50 kA/m and (b) 25 kA/m. The beads are assumed to be in contact with the film surface.
The obtained results prove that magnetic antidot arrays can be used as traps for magnetic beads, with a local variation of the magnetic force depending on the lattice geometry and the applied magnetic field amplitude, as well as on the bead properties (i.e., size and magnetic moment). It can be observed that the holes act as preferential adsorption sites for magnetic beads when strong external fields are applied. In this case, the film is quasi-saturated, leading to strong stray fields able to strongly interact with the beads when they are in proximity to the film surface after gravimetric deposition. This interaction is greater for the smaller beads, due to the possibility of closely approaching the nanostructured film surface, where large stray field gradients are present.
3.2. Analysis of FMR-Based Bead Detection
The mechanism of magnetic bead detection was investigated under the assumption that the beads were immobilized on the film surface in correspondence of the holes, where the magnetic interaction is expected to be stronger for sufficiently large bias fields (see Section 3.1). The operation of the magnetic antidot array as an FMR-based sensor was studied by applying a quasi-saturating direct current (DC) bias field of 150 kA/m along the y-axis and an excitation field along the x-axis with the following Gaussian pulse waveform:
with an amplitude a of 1 kA/m and an RMS width τ of 5 ps. Both the DC and excitation fields are spatially uniform.
Due to the large bias field, the bead–bead magnetostatic interactions can be disregarded. Indeed, they are practically negligible, leading to a maximum variation in the bead magnetic moment of 2% for the cases when the interaction is stronger (i.e., in the presence of bead stratification over the film surface). This variation was previously estimated using the iterative approach described in [14].
3.2.1. Influence of Bead Type
Figure 4a reports the FFT power spectra (in arbitrary units) of the spatially averaged magnetization component along the excitation field direction (x-axis); the corresponding frequency derivatives are shown in Figure 4b. The calculations were performed assuming the film surface to be fully covered by beads (trapped at the holes). This means that for the MagSIGNAL-STA beads, all the antidot array holes are filled by beads, while for the Dynabeads MyOne beads only 30% of the holes are filled. The results were obtained by fixing the hole diameter to 330 nm. The graph compares the curves calculated with both MagSIGNAL-STA and Dynabeads MyOne beads to the result obtained in the absence of beads (reference case). The reference FFT spectrum displays four well-defined peaks around 11.7 GHz, 14.4 GHz, 15.4 GHz, and 17.3 GHz. The localization of the resonant modes in the antidot array can be inferred by analyzing the spatial distributions of the corresponding spin precession amplitudes, as shown in Figure 4c for a magnified area of the sample. The FMR modes are distinguished following the well-known classification in edge, extended, and localized modes [46], considering that the FMR frequencies depend on the effective field in the sample, which is practically the sum of the bias and demagnetizing fields for the considered case [47,48]. The exchange field is indeed negligible, with the film being magnetically saturated.
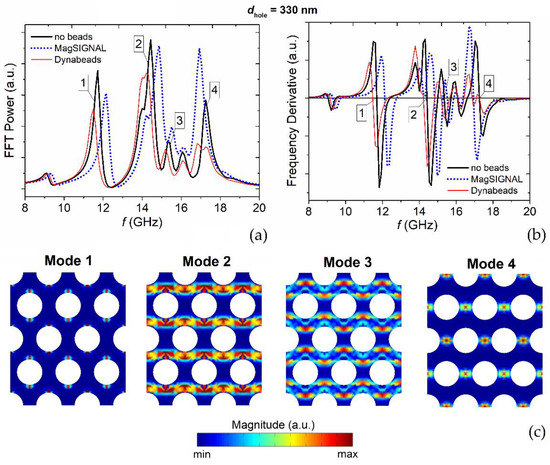
Figure 4.
(a) FFT power spectra of the average magnetization component along the excitation field direction (x-axis), for a bias field of 150 kA/m parallel to the y-axis. The graph shows the FMR responses of the permalloy nanostructured film with 330 nm holes to the stray fields generated by the MagSIGNAL-STA and Dynabeads MyOne beads trapped at the holes, assuming that the film surface is fully covered by beads. The case without beads is also reported for comparison. (b) Corresponding frequency derivatives of the FFT power spectra. (c) Surface plots of Fourier coefficient magnitude for the FMR modes indicated in (a) and (b), calculated in a magnified area of the film for the case without beads.
As demonstrated by the relative spin-wave profile, the lowest-frequency mode is an edge mode (mode #1). Indeed, the highest spin precession amplitude associated with this mode is found at the hole edges crossed by the y-axis, where the demagnetizing field reaches peak values opposite to the bias field [49,50,51,52] (see the spatial distribution of the demagnetizing field calculated within the antidot array unit cell, reported in Figure 5a). The modes at intermediate frequencies are extended or quasi-uniform modes distributed throughout the whole lattice along stripes orthogonal to the bias field, where the demagnetizing field decreases from ∼25 kA/m (mode #2) down to zero (mode #3). The final mode is a localized one (mode #4), with the highest spin precession amplitude localized between neighboring holes, where the demagnetizing field changes sign.
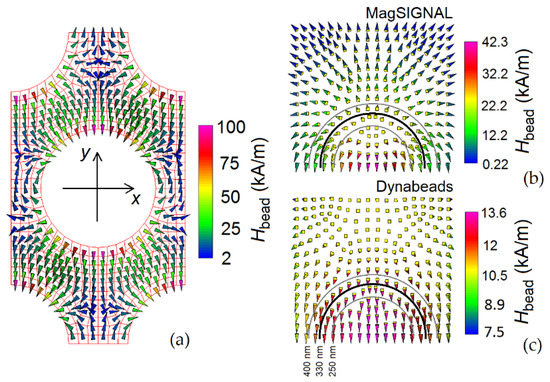
Figure 5.
(a) Spatial distribution of the demagnetizing field in the unit cell of the permalloy nanostructured film with 330 nm holes. Spatial distribution of the stray field produced on the film surface by (b) MagSIGNAL-STA and (c) Dynabeads MyOne beads, centered with the film holes and in contact with the film surface.
As shown in Figure 4a and Table 1, the presence of MagSIGNAL-STA beads produces a clear shift in the FMR frequencies of all the modes, equal to 0.43 GHz, 0.40 GHz, 0.17 GHz, and −0.31 GHz for the edge, first extended, second extended, and localized modes, respectively. Conversely, the Dynabeads MyOne beads are responsible for a shift of −0.22 GHz, −0.19 GHz, −0.16 GHz, and −0.38 GHz for the edge, first extended, second extended, and localized modes, respectively.

Table 1.
Shifts in the FMR frequencies associated with the edge (#1), first extended (#2), second extended (#3), and localized (#4) modes, as a function of the diameter of the antidot array holes and the types of beads to be detected.
The sign of the frequency shifts in the FMR modes depends on the bead type. This can be understood by analyzing the spatial distribution of the antidot array demagnetizing field (Figure 5a) and of the stray field generated by a hole-centered magnetic bead at the film surface. It is important to consider that the FMR frequency increases if the stray field of the bead, when interacting with the magnetization spatial distribution in the antidot array, leads to an increase in the effective field in the antidot array itself. For a bias field of 150 kA/m, the effective field is indeed dominated by the applied field contribution, directed along the positive y-axis. For the MagSIGNAL-STA bead (Figure 5b), having a size comparable to that of the holes, the bead stray field opposes the film demagnetizing field at the hole edges crossed by the y-axis, leading to an increase in the FMR frequency of the edge mode. This also occurs for the regions in which the first extended mode is prevalent. In the areas dominated by the second extended mode, the bead produces a non-negligible stray field with the same sign as the bias field, leading to a positive shift in the associated FMR frequency. Finally, in the regions between neighboring holes, where the localized mode appears, the bead stray field opposes both the bias and demagnetizing fields, with a consequent reduction in the corresponding FMR frequency. For the Dynabeads MyOne bead (Figure 5c), the stray field opposes the bias field for all modes, leading to a decrease in the FMR frequencies for all modes.
3.2.2. Influence of Hole Size
The influence of the antidot array hole size on magnetic bead detection was investigated by calculating the FMR spectra for dhole equal to 250 nm (Figure 6a) and 400 nm (Figure 6b), in the presence of both MagSIGNAL-STA and Dynabeads MyOne beads fully covering the surface of the permalloy nanostructured film. The shifts in the FMR frequencies of the main modes, caused by the bead stray field, are reported in Table 1. For a better understanding of the influence of dhole on the FMR frequency shifts, the spatial distributions of the demagnetizing field calculated within the antidot array unit cell are reported in Figure 6c,d for dhole equal to 250 nm and 400 nm, respectively.
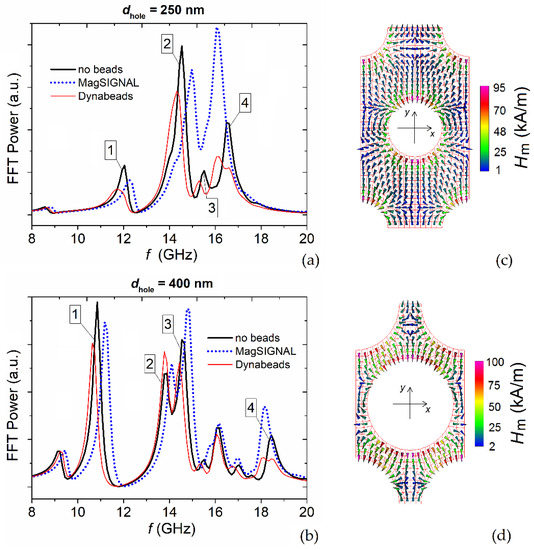
Figure 6.
FFT power spectra of the average magnetization component along the excitation field direction (x-axis) for a bias field of 150 kA/m parallel to the y-axis. The graph shows the FMR responses of the permalloy nanostructured film with (a) 250 nm and (b) 400 nm holes to the stray fields generated by MagSIGNAL-STA and Dynabeads MyOne beads trapped in the holes, assuming that the film surface is fully covered by beads. The case without beads is also reported for comparison. The numbers refer to the main modes in the spectra. Spatial distributions of the demagnetizing field in the unit cell of the permalloy nanostructured film with (c) 250 nm and (d) 400 nm holes.
When dhole = 250 nm, the FMR spectra are characterized by a reduced range [31] and by only three modes, i.e., the edge (mode #1), the first extended (mode #2), and the localized mode (mode #4), tending towards the FMR spectrum of the non-structured (continuous) film, which presents one mode. When dhole = 400 nm, the FMR spectra are more extended, with the appearance of additional modes. Focusing on the edge mode (mode #1), the increase in dhole leads to a larger positive shift in the relative frequency for the MagSIGNAL-STA beads, because of a more pronounced anti-parallelism of the bead stray field (Figure 5b) and the demagnetizing field (Figure 6d) at the hole edges crossed by the y-axis. For the Dynabeads MyOne beads, the amplitude of the negative shift decreases due to a reduction in the component of the bead stray field (Figure 5c) parallel to the demagnetizing field (Figure 6d). For the extended modes (modes #2 and #3, if present), the amplitudes of the FMR frequency shifts decrease with dhole for both bead types. This is associated with shrinkage in the nanostructured film areas where these modes appear. Finally, the increase in dhole leads to a limited decrease in the FMR frequency of the localized mode (mode #4) for both beads, due to a reduction in the amplitude of the bead stray field (opposite to the demagnetizing field) in the areas of interest.
In summary, for the MagSIGNAL-STA beads, the increase in dhole from 250 nm to 400 nm enhances the detection mechanism that exploits variations in the edge mode frequency. Conversely, for the other modes, it is convenient to reduce dhole to obtain larger shifts in the FMR frequencies. The best performance is achieved with dhole = 400 nm for the edge mode, leading to a frequency variation around 1 GHz (Table 1). Variations of 0.45 GHz are obtained for the first extended and localized modes when dhole = 250 nm. Worse performance is found in the case of Dynabeads MyOne bead detection, for which the best sensitivity is obtained with dhole = 250 nm when exploiting the localized mode. This is a consequence of the reduced fraction of antidot array holes filled by 1 μm beads, and of a weaker coupling between their stray field and the magnetization within the film, for the range of dhole variation considered here.
3.2.3. Influence of Film Coverage
Finally, we investigated the influence of bead concentration on the FMR spectra of the permalloy nanostructured film, by varying the percentage of film coverage from 30% to 330%. We focused on MagSIGNAL-STA beads, for which a coverage of 100% means that each hole of the antidot array is filled by one bead, while coverages of 230% and 330% are associated with a two- and three-layer stratification over the film surface, respectively. Figure 7a shows the FMR spectra for a film with dhole = 330 nm, calculated again for a bias field of 150 kA/m parallel to the y-axis and an excitation field applied along the x-axis. Figure 7b reports the relative FMR frequency variations associated with the main modes.
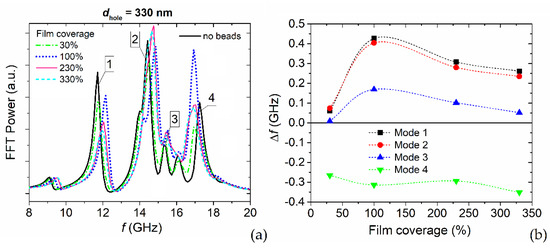
Figure 7.
(a) FFT power spectra of the average magnetization component along the excitation field direction (x-axis) for a bias field of 150 kA/m parallel to the y-axis. The graph shows the FMR responses of the permalloy nanostructured film with 330 nm holes to the stray field generated by MagSIGNAL-STa beads, as a function of film coverage. (b) Corresponding FMR frequency shifts for the edge (#1), first extended (#2), second extended (#3), and localized (#4) modes, versus film coverage percentage.
It is worth noting that for the first three modes there is a strong increase in the frequency variations up to 100% film coverage. In the presence of bead stratification, there is a reduction in the signal, caused by a limited anti-parallelism of the demagnetizing field and the bead stray fields in the areas interested by such modes. For larger bead distances with respect to the film surface, the vertical component of the stray field becomes dominant, with a strong decrease in the component along the y-axis. For the fourth mode, a less significant change is found, with Δf within the range −0.35–−0.25 GHz, due to a reduced variation of the stray field orientation with the distance.
In summary, the edge and first extended modes are associated with the most significant frequency shifts when the film coverage is 100%, and can be used for preliminary bead quantification in sensor devices.
4. Conclusions
The micromagnetic modelling analysis carried out in this study demonstrates that permalloy antidot arrays can be used for trapping, manipulating, and detecting magnetic nano/microbeads, paving the way for their integration into lab-on-chip devices for biomedical applications. In addition to magnetic immunoassays for biomarker quantification, these nanostructured films could be also employed for developing biomaterial manipulators and magnetic scaffolds for tissue engineering, exploiting magnetic bead trapping.
The trapping mechanism was found to be enhanced in the presence of large bias fields, which quasi-saturated the permalloy nanostructured film, guaranteeing high gradients of the film stray field and, thus, large attractive forces, in correspondence of the holes. The interaction was greater for the smaller beads, due to their ability to more closely approach the film surface.
The detection mechanism, which exploits the dynamic behavior in the GHz range and the shifts in the FMR frequencies caused by the interaction between the bead stray field and the antidot array magnetization state, can be maximized by a proper choice of hole size and FMR mode to be monitored. This optimization must be addressed by the properties of the beads to be detected (i.e., size and magnetic moment). For example, FMR frequency variations up to 1 GHz were observed when considering 400 nm holes and exploiting the edge mode for detecting 300 nm beads with a magnetic moment around 0.002 pAm2.
It is worth noting that multilayered stratification of beads over the nanostructured film surface generally leads to a reduction in the detected signal, negatively impacting on accurate bead quantification in a wide range of concentrations. The edge and first extended modes are associated with the greatest frequency shifts when the film coverage is 100%, and can be used for preliminary bead quantification in sensor devices in the presence of moderate bead concentrations that do not lead to multilayered stratification.
Author Contributions
Conceptualization, A.M.; methodology, A.M., R.F. and M.V.; software, A.M.; formal analysis, A.M., R.F. and M.V.; investigation, A.M., R.F. and M.V.; data curation, A.M.; writing—original draft preparation, A.M.; writing—review and editing, A.M., R.F. and M.V.; visualization, A.M., R.F. and M.V.; supervision, A.M.; funding acquisition, A.M. All authors have read and agreed to the published version of the manuscript.
Funding
This research was funded by the Italian Ministry of University and Research with Project PRIN 2020LWPKH7 IT-SPIN “The Italian factory of micromagnetic modeling and spintronics”.
Informed Consent Statement
Not applicable.
Data Availability Statement
The data presented in this study are available on request from the corresponding author.
Conflicts of Interest
The authors declare no conflict of interest.
References
- Khan, M.A.; Sun, J.; Li, B.; Przybysz, A.; Kosel, J. Magnetic sensors—A review and recent technologies. Eng. Res. Express 2021, 3, 022005. [Google Scholar] [CrossRef]
- Zheng, C.; Zhu, K.; Cardoso de Freitas, S.; Chang, J.-Y.; Davies, J.E.; Eames, P.; Freitas, P.P.; Kazakova, O.; Kim, C.; Leung, C.-W.; et al. Magnetoresistive Sensor Development Roadmap (Non-Recording Applications). IEEE Trans. Magn. 2019, 55, 0800130. [Google Scholar] [CrossRef]
- Panchal, V.; Corte-León, H.; Gribkov, B.; Rodriguez, L.A.; Snoeck, E.; Manzin, A.; Simonetto, E.; Vock, S.; Neu, V.; Kazakova, O. Calibration of multi-layered probes with low/high magnetic moments. Sci. Rep. 2017, 7, 7224. [Google Scholar] [CrossRef] [PubMed]
- Corte-León, H.; Neu, V.; Manzin, A.; Barton, C.; Tang, Y.; Gerken, M.; Klapetek, P.; Schumacher, H.W.; Kazakova, O. Comparison and Validation of Different Magnetic Force Microscopy Calibration Schemes. Small 2020, 16, 1906144. [Google Scholar] [CrossRef] [PubMed]
- Murzin, D.; Mapps, D.J.; Levada, K.; Belyaev, V.; Omelyanchik, A.; Panina, L.; Rodionova, V. Ultrasensitive Magnetic Field Sensors for Biomedical Applications. Sensors 2020, 20, 1569. [Google Scholar] [CrossRef]
- Freitas, P.P.; Cardoso, F.A.; Martins, V.C.; Martins, S.A.M.; Loureiro, J.; Amaral, J.; Chaves, R.C.; Cardoso, S.; Fonseca, L.P.; Sebastião, A.M.; et al. Spintronic platforms for biomedical applications. Lab Chip 2012, 12, 546–557. [Google Scholar] [CrossRef]
- Cardoso, S.; Leitao, D.C.; Dias, T.M.; Valadeiro, J.; Silva, M.D.; Chicharo, A.; Silverio, V.; Gaspar, J.; Freitas, P.P. Challenges and trends in magnetic sensor integration with microfluidics for biomedical applications. J. Phys. D Appl. Phys. 2017, 50, 213001. [Google Scholar] [CrossRef]
- Lin, G.; Makarov, D.; Schmidt, O.G. Magnetic sensing platform technologies for biomedical applications. Lab Chip 2017, 17, 1884–1912. [Google Scholar] [CrossRef]
- Wu, K.; Saha, R.; Su, D.; Krishna, V.D.; Liu, J.; Cheeran, M.C.-J.; Wang, J.-P. Magnetic-nanosensor-based virus and pathogen detection strategies before and during COVID-19. ACS Appl. Nano Mater. 2020, 3, 9560–9580. [Google Scholar] [CrossRef]
- Giouroudi, I.; Kokkinis, G. Recent Advances in Magnetic Microfluidic Biosensors. Nanomaterials 2017, 7, 171. [Google Scholar] [CrossRef]
- Monticelli, M.; Torti, A.; Cantoni, M.; Petti, D.; Albisetti, E.; Manzin, A.; Guerriero, E.; Sordan, R.; Gervasoni, G.; Carminati, M.; et al. On-Chip Magnetic Platform for Single-Particle Manipulation with Integrated Electrical Feedback. Small 2015, 12, 921–929. [Google Scholar] [CrossRef] [PubMed]
- Manzin, A.; Nabaei, V.; Kazakova, O. Modelling and optimization of submicron Hall sensors for the detection of superparamagnetic beads. J. Appl. Phys. 2012, 111, 07E513. [Google Scholar] [CrossRef]
- Manzin, A.; Simonetto, E.; Amato, G.; Panchal, V.; Kazakova, O. Modeling of graphene Hall effect sensors for microbead detection. J. Appl. Phys. 2015, 117, 17B732. [Google Scholar] [CrossRef]
- Manzin, A.; Nabaei, V.; Ferrero, R. Quantification of Magnetic Nanobeads with Micrometer Hall Sensors. IEEE Sens. J. 2018, 18, 10058–10065. [Google Scholar] [CrossRef]
- Corte-León, H.; Krzysteczko, P.; Schumacher, H.W.; Manzin, A.; Cox, D.; Antonov, V.; Kazakova, O. Magnetic bead detection using domain wall-based nanosensor. J. Appl. Phys. 2015, 117, 17E313. [Google Scholar] [CrossRef]
- Braganca, P.M.; Gurney, B.A.; Wilson, B.A.; Katine, J.A.; Maat, S.; Childress, J.R. Nanoscale magnetic field detection using a spin torque oscillator. Nanotechnology 2010, 21, 235202. [Google Scholar] [CrossRef]
- Saha, R.; Wu, K.; Su, D.; Wang, J.-P. Spin current nano-oscillator (SCNO) as a potential frequency-based, ultra-sensitive magnetic biosensor: A simulation study. Nanotechnology 2020, 31, 375501. [Google Scholar] [CrossRef]
- Inoue, M.; Baryshev, A.; Takagi, H.; Lim, P.B.; Hatafuku, K.; Noda, J.; Togo, K. Investigating the use of magnonic crystals as extremely sensitive magnetic field sensors at room temperature. Appl. Phys. Lett. 2011, 98, 132511. [Google Scholar] [CrossRef]
- Metaxas, P.J.; Sushruth, M.; Begley, R.A.; Ding, J.; Woodward, R.C.; Maksymov, I.S.; Albert, M.; Wang, W.; Fangohr, H.; Adeyeye, A.O.; et al. Sensing magnetic nanoparticles using nano-confined ferromagnetic resonances in a magnonic crystal. Appl. Phys. Lett. 2015, 106, 232406. [Google Scholar] [CrossRef]
- Sushruth, M.; Ding, J.; Duczynski, J.; Woodward, R.C.; Begley, R.A.; Fangohr, H.; Fuller, R.O.; Adeyeye, A.O.; Kostylev, M.; Metaxas, P.J. Resonance-based detection of magnetic nanoparticles and microbeads using nanopatterned ferromagnets. Phys. Rev. Appl. 2016, 6, 044005. [Google Scholar] [CrossRef]
- Manzin, A.; Barrera, G.; Celegato, F.; Coïsson, M.; Tiberto, P. Influence of lattice defects on the ferromagnetic resonance behaviour of 2D magnonic crystals. Sci. Rep. 2016, 6, 22004. [Google Scholar] [CrossRef] [PubMed]
- Albert, M.; Beg, M.; Chernyshenko, D.; Bisotti, M.-A.; Carey, R.L.; Fangohr, H.; Metaxas, P.J. Frequency-based nanoparticle sensing over large field ranges using the ferromagnetic resonances of a magnetic nanodisc. Nanotechnology 2016, 27, 455502. [Google Scholar] [CrossRef] [PubMed]
- Matatagui, D.; Kolokoltseva, O.V.; Qureshi, N.; Mejía-Uriartea, E.V.; Ordonez-Romero, C.L.; Vázquez-Olmos, A.; Saniger, J.M. Magnonic sensor array based on magnetic nanoparticles to detect, discriminate and classify toxic gases. Sens. Actuators B Chem. 2017, 240, 497–502. [Google Scholar] [CrossRef]
- Tian, B.; Liao, X.; Svedlindh, P.; Strömberg, M.; Wetterskog, E. Ferromagnetic Resonance Biosensor for Homogeneous and Volumetric Detection of DNA. ACS Sens. 2018, 3, 1093–1101. [Google Scholar] [CrossRef]
- Lee, I.; Obukhov, Y.; Xiang, G.; Hauser, A.; Yang, F.; Banerjee, P.; Pelekhov, D.V.; Hammel, P.C. Nanoscale scanning probe ferromagnetic resonance imaging using localized modes. Nature 2010, 466, 845–848. [Google Scholar] [CrossRef]
- Wang, C.C.; Adeyeye, A.O.; Singh, N. Magnetic antidot nanostructures: Effect of lattice geometry. Nanotechnology 2006, 17, 1629–1636. [Google Scholar] [CrossRef] [PubMed]
- Manzin, A.; Bottauscio, O. Micromagnetic modelling of the anisotropy properties of permalloy antidot arrays with hexagonal symmetry. J. Phys. D Appl. Phys. 2012, 45, 095001. [Google Scholar] [CrossRef]
- Van de Wiele, B.; Manzin, A.; Vansteenkiste, A.; Bottauscio, O.; Dupré, L.; De Zutter, D. A micromagnetic study of the reversal mechanism in permalloy antidot arrays. J. Appl. Phys. 2012, 111, 053915. [Google Scholar] [CrossRef]
- Tacchi, S.; Gruszecki, P.; Madami, M.; Carlotti, G.; Kłos, J.W.; Krawczyk, M.; Adeyeye, A.; Gubbiotti, G. Universal dependence of the spin wave band structure on the geometrical characteristics of two-dimensional magnonic crystals. Sci. Rep. 2015, 5, 10367. [Google Scholar] [CrossRef]
- Mandal, R.; Laha, P.; Das, K.; Saha, S.; Barman, S.; Raychaudhuri, A.K.; Mandal, A.B. Effects of antidot shape on the spin wave spectra of two-dimensional Ni80Fe20 antidot lattices. Appl. Phys. Lett. 2013, 103, 262410. [Google Scholar] [CrossRef]
- Ding, J.; Tripathy, D.; Adeyeye, A.O. Effect of antidot diameter on the dynamic response of nanoscale antidot arrays. J. Appl. Phys. 2011, 109, 07D304. [Google Scholar] [CrossRef]
- Saavedra, E.; Corona, R.M.; Vidal-Silva, N.; Palma, J.L.; Altbir, D.; Escrig, J. Dynamic and static properties of stadium-shaped antidot arrays. Sci. Rep. 2020, 10, 20024. [Google Scholar] [CrossRef] [PubMed]
- Bottauscio, O.; Manzin, A. Parallelized micromagnetic solver for the efficient simulation of large patterned magnetic nanostructures. J. Appl. Phys. 2014, 115, 17D122. [Google Scholar] [CrossRef]
- Manzin, A.; Bottauscio, O. A micromagnetic solver for large-scale patterned media based on non-structured meshing. IEEE Trans. Magn. 2012, 48, 2789–2792. [Google Scholar] [CrossRef]
- Bottauscio, O.; Manzin, A. Spatial reconstruction of exchange field interactions with a finite difference scheme based on unstructured meshes. IEEE Trans. Magn. 2012, 48, 3250–3253. [Google Scholar] [CrossRef]
- Long, H.H.; Ong, E.T.; Liu, Z.J.; Li, E.P. Fast Fourier transform on multipoles for rapid calculation of magnetostatic fields. IEEE Trans. Magn. 2006, 42, 295–300. [Google Scholar] [CrossRef]
- Manzin, A.; Bottauscio, O. Multipole expansion technique for the magnetostatic field computation in patterned magnetic films. J. Appl. Phys. 2012, 111, 07D125. [Google Scholar] [CrossRef]
- Bottauscio, O.; Manzin, A. Efficiency of the geometric integration of Landau–Lifshitz–Gilbert equation based on Cayley transform. IEEE Trans. Magn. 2011, 47, 1154–1157. [Google Scholar] [CrossRef]
- Lewis, D.; Nigam, N. Geometric integration on spheres and some interesting applications. J. Comput. Appl. Math. 2003, 151, 141–170. [Google Scholar] [CrossRef]
- Manzin, A.; Bottauscio, O. Connections between numerical behavior and physical parameters in the micromagnetic computation of static hysteresis loops. J. Appl. Phys. 2010, 108, 093917. [Google Scholar] [CrossRef]
- Vicentini, M.; Ferrero, R.; Manzin, A. Modelling of magnetic bead transport in a microvascular network. J. Magn. Magn. Mater. 2020, 513, 167234. [Google Scholar] [CrossRef]
- Khashan, S.A.; Alazzam, A.; Furlani, E.P. Computational Analysis of Enhanced Magnetic Bioseparation in Microfluidic Systems with Flow-Invasive Magnetic Elements. Sci. Rep. 2014, 4, 5299. [Google Scholar] [CrossRef]
- Baker, A.; Beg, M.; Ashton, G.; Albert, M.; Chernyshenko, D.; Wang, W.; Zhang, S.; Bisotti, M.-A.; Franchin, M.; Hu, C.L.; et al. Proposal of a micromagnetic standard problem for ferromagnetic resonance simulations. J. Magn. Magn. Mater. 2017, 421, 428–439. [Google Scholar] [CrossRef]
- Yin, Y.; Pan, F.; Ahlberg, M.; Ranjbar, M.; Dürrenfeld, P.; Houshang, A.; Haidar, M.; Bergqvist, L.; Zhai, Y.; Dumas, R.K.; et al. Tunable permalloy-based films for magnonic devices. Phys. Rev. B 2015, 92, 024427. [Google Scholar] [CrossRef]
- Achtsnicht, S.; Pourshahidi, A.M.; Offenhäusser, A.; Krause, H.-J. Multiplex Detection of Different Magnetic Beads Using Frequency Scanning in Magnetic Frequency Mixing Technique. Sensors 2019, 19, 2599. [Google Scholar] [CrossRef] [PubMed]
- Tacchi, S.; Madami, M.; Gubbiotti, G.; Carlotti, G.; Adeyeye, A.O.; Neusser, S.; Botters, B.; Grundler, D. Angular Dependence of Magnetic Normal Modes in NiFe Antidot Lattices with Different Lattice Symmetry. IEEE Trans. Magn. 2010, 46, 1440–1443. [Google Scholar] [CrossRef]
- Silva, A.S.; Hierro-Rodriguez, A.; Bunyaev, S.A.; Kakazei, G.N.; Dobrovolskiy, O.V.; Redondo, C.; Morales, R.; Crespo, H.; Navas, D. Magnetic properties of permalloy antidot array fabricated by interference lithography. AIP Adv. 2019, 9, 035136. [Google Scholar] [CrossRef]
- Neudecker, I.; Woltersdorf, G.; Heinrich, B.; Okuno, T.; Gubbiotti, G.; Back, C.H. Comparison of frequency, field, and time domain ferromagnetic resonance methods. J. Magn. Magn. Mater. 2006, 307, 148–156. [Google Scholar] [CrossRef]
- Sklenar, J.; Bhat, V.S.; DeLong, L.E.; Heinonen, O.; Ketterson, J.B. Strongly localized magnetization modes in permalloy antidot lattices. Appl. Phys. Lett. 2013, 102, 152412. [Google Scholar] [CrossRef]
- Hu, C.-L.; Magaraggia, R.; Yuan, H.-Y.; Chang, C.S.; Kostylev, M.; Tripathy, D.; Adeyeye, A.O.; Stamps, R.L. Field tunable localization of spin waves in antidot arrays. Appl. Phys. Lett. 2011, 98, 262508. [Google Scholar] [CrossRef]
- Tacchi, S.; Madami, M.; Gubbiotti, G.; Carlotti, G.; Adeyeye, A.O.; Neusser, S.; Botters, B.; Grundler, D. Magnetic normal modes in squared antidot array with circular holes: A combined Brillouin light scattering and broadband ferromagnetic resonance study. IEEE Trans. Magn. 2010, 46, 172–178. [Google Scholar] [CrossRef]
- Tse, D.H.Y.; Steinmuller, S.J.; Trypiniotis, T.; Anderson, D.; Jones, G.A.C.; Bland, J.A.C.; Barnes, C.H.W. Static and dynamic magnetic properties of Ni80Fe20 square antidot arrays. Phys. Rev. B 2009, 79, 054426. [Google Scholar] [CrossRef]


Publisher’s Note: MDPI stays neutral with regard to jurisdictional claims in published maps and institutional affiliations. |
© 2022 by the authors. Licensee MDPI, Basel, Switzerland. This article is an open access article distributed under the terms and conditions of the Creative Commons Attribution (CC BY) license (https://creativecommons.org/licenses/by/4.0/).