Article

A Flexible and Robust Structural Color Film Obtained by Assembly of Surface-Modified Melanin Particles

Department of Applied Chemistry and Biotechnology, Graduate School of Engineering, Chiba University, 1-33 Yayoi-cho, Inage-ku, Chiba 263-8522, Japan
*
Author to whom correspondence should be addressed.
Nanomaterials 2022, 12(19), 3338; https://doi.org/10.3390/nano12193338
Submission received: 10 August 2022 / Revised: 14 September 2022 / Accepted: 21 September 2022 / Published: 25 September 2022

Abstract

:
In this study, core–shell-hairy-type melanin particles surface modified with a polydopamine shell layer and a polymer brush hairy layer were fabricated and assembled to readily obtain bright structural color films. The hot pressing of freeze-dried samples of melanin particles decorated with a hydrophilic, low glass transition temperature polymer brush results in films that exhibit an angle-dependent structural color due to a highly periodic microstructure, with increased regularity in the arrangement of the particle array due to the fluidity of the particles. Flexible, self-supporting, and easy-to-cut and process structural color films are obtained, and their flexibility and robustness are demonstrated using compression tests. This method of obtaining highly visible structural color films using melanin particles as a single component will have a significant impact on practical materials and applications.

1. Introduction

The construction of periodically structured assemblies consisting of particles of uniform size has attracted much attention for its potential applications in various fields, such as electronics, photonics, and plasmonics [1,2,3]. Among them, many studies have reported on the progress for structural color materials obtained by the assembly of uniformly sized colloidal particles because of their high level of expandability and ease of handling [4,5,6]. Structural color films composed of colloidal particles, however, generally have low mechanical strength and require proper curing before they can be used as a material. The immobilization of microstructures using gelation [7,8], sol–gel processes [9,10], and UV curing techniques [11,12], as well as the use of inverse opals with porous structures [13,14], have been reported to be effective in developing materials for practical applications. Furthermore, the use of colloidal particles with polymers grafted onto their surfaces is also useful [15,16]. Ohno et al. [17] reported that structural color films can be easily obtained by hot pressing a mixture of silica and carbon black particles decorated with a polymethyl methacrylate (PMMA) brush at a temperature higher than the glass transition temperature (Tg) of the PMMA brushes [17]. However, in a binary assembly of colloidal particles, differences in the specific gravity and sphericity of the particles often result in uneven coloration [18]. Thus, developing a method to obtain vivid structural color films in the unary assembly of colloidal particles is an important issue.
In general, the whitish structural color obtained via the assembly of colloidal particles is due to multiple scattering. Therefore, improvement of the visibility of the structural color has been investigated by adding light-absorbing reagents such as carbon black [19,20] and graphene [21,22] to the system to appropriately suppress the scattered light. In organisms such as peacocks and Morpho butterflies, natural melanin, a biopolymer with excellent light absorption capacity, is used as a component of microstructures to achieve vivid structural coloration [23,24]. Polydopamine (PDA), obtained by the self-oxidative polymerization of dopamine (DA), is known as artificial melanin because its components closely resemble natural melanin [25]. While PDA-based synthetic melanin particles have been used as antioxidants [26] and metal recovery agents [27], we have serendipitously discovered that forming periodic microstructures with uniformly sized melanin particles yields a new type of biomimetic structural color material with excellent visibility [28]. Artificially synthesized melanin particles effectively suppress multiple scattering, resulting in bright structural coloration from periodic structures created by monodisperse melanin particles as a single building block [29]. We have conducted a series of fundamental studies, including the influence of the shape, composition, and assembly conditions of melanin particles on structural coloration [30,31,32,33,34,35] and the visualization of structural color using melanin precursors [36,37].
In this study, we demonstrated the preparation of flexible and robust structural color films using surface-modified melanin particles with poly hydroxyethyl acrylate (PHEA), which has a low Tg. First, melanin particles with an initiator for atom transfer radical polymerization (ATRP) on their surface were artificially synthesized by copolymerizing dopamine (DA) and ATRP-initiator-modified DA in the presence of cerium oxide (CeO2) core particles. The resulting samples were designated CeO2@PDA core–shell particles. Next, a hydrophilic PHEA brush layer was formed on the CeO2@PDA particles by surface-initiated (SI) ATRP of the HEA monomer. The synthesized samples were designated CeO2@PDA@PHEA(X) core–shell-hairy particles (X: the thickness of the PHEA hairy layer (nm)) (Figure 1a). Aqueous dispersions of the obtained particles were dried to prepare solid pellet samples, and the effect of the PHEA hairy thickness on the structural coloration of the pellets was investigated. Finally, freeze-dried samples of CeO2@PDA@PHEA particles were hot-pressed and cured to prepare structural color films, and their coloration and physical properties were investigated in detail (Figure 1b).

2. Materials and Methods

2.1. Materials

Dopamine hydrochloride (DA) was obtained from Sigma-Aldrich Japan Co., LLC. (Tokyo, Japan). Tris(hydroxymethyl)aminomethane (Tris) was obtained from Kanto Chemical Co., Inc. (Tokyo, Japan). Copper(II) bromide (CuBr2), L(+)-ascorbic acid sodium salt (NaAsc), N,N-dimethylformamide (DMF), and triethylamine (TEA) were obtained from FUJIFILM Wako Pure Chemical Industries Ltd. (Osaka, Japan). 2-Bromoisobutyryl bromide (BiBB), hydroxyethyl acrylate (HEA), and tris [2-(dimethylamino)ethyl]amine (Me6TREN) were obtained from Tokyo Chemical Industry (Tokyo, Japan). Deionized water with a resistance of 18.2 MΩ·cm was obtained using a Millipore Simplicity UV system. The CeO2 particles coated with polyvinylpyrrolidone (PVP) were provided by Hokko Chemical Industry Co., Ltd. (Tokyo, Japan).

2.2. Measurements

Scanning electron microscopy (SEM) micrographs of the samples were obtained using a scanning electron microscope (JSM-6510A; JEOL, Tokyo, Japan). Transmission electron microscopy (TEM) micrographs were obtained using a transmission electron microscope (H-7650; Hitachi, Tokyo, Japan). Reflection spectroscopy was performed using a microscopic spectrophotometer (MSV-370; JASCO, Tokyo, Japan). Angle-changing reflection spectroscopy was obtained using a reflection spectrophotometer (V-650; JASCO, Tokyo, Japan) equipped with a reflection spectroscopy unit (ARSV-732; JASCO, Tokyo, Japan). Photographs of the samples were taken with a digital camera (OM-D E-M10; Olympus, Tokyo, Japan). Infrared absorption spectra were obtained using an attenuated total reflection Fourier transform infrared (ATR–FTIR) spectrometer (FT/IR 4700; JASCO, Tokyo, Japan). The hydrodynamic diameter of the particles in water was measured by dynamic light scattering (DLS) (Zetasizer Nano ZS; Malvern Panalytical, Tokyo, Japan). The thermophysical properties of the polymers were examined using a thermogravimetric analysis (TGA) system (NEXTA-STA; Hitachi, Tokyo, Japan) and a differential scanning calorimetry (DSC) system (DSC7020; Hitachi, Tokyo, Japan). X-ray photoelectron spectroscopy (XPS) measurements were performed using a photoelectron spectrometer (JPS-9030; JEOL, Tokyo, Japan). Freeze drying of samples was conducted using a lyophilizer (FDS-1000; EYELA, Tokyo, Japan). Hot pressing of the samples was performed using a hot-press machine (H300-15; ASONE, Osaka, Japan). Compression tests were performed using a mechanical testing machine (EZ-SX; Shimadzu, Kyoto, Japan). The origin of the compression strain was defined as the point at which the compression stress reaches 0.05 N. Young’s modulus was defined as the slope of the initial linear of the stress–strain curve in the first 5–15% strain range [38].

2.3. Preparation of the CeO2@PDA Core–Shell Particles

The CeO2@PDA core–shell particles were prepared by modifying the method of our previous paper [18,39]. Briefly, a mixture of DA (0.10 g, 0.53 mmol), BiBB (0.10 mL, 0.81 mmol), and TEA (0.11 mL, 0.79 mmol) in DMF (20 mL) was stirred at room temperature for 3 h under nitrogen (N2) gas. CeO2 core particles (198 nm, 0.20 g), Tris (2.4 g, 20 mmol), and deionized water (180 mL) were added, and the mixture was stirred at r.t. for another 20 h. The resulting samples were separated and purified repeatedly by centrifugation (12,000 rpm for 10 min) and redispersion to obtain CeO2@PDA core–shell particles. The diameter of the particles was determined by analysis of the TEM images of 50 particles. The PDA shell layer thickness of the core–shell particles was calculated according to the following formula:
shell layer thickness = [(diameter of core-shell particles) − (diameter of core particles)]/2

2.4. Preparation of the CeO2@PDA@PHEA(X) Core-Shell-Hairy Particles

HEA (0.31–2.2 mL, 3–21 mmol), CuBr2 (20 mg, 0.090 mmol), Me6TREN (49 μL, 0.18 mmol) and the CeO2@PDA particles (30 mg) dispersed in deionized water (30 mL) were placed in a three-necked flask. The mixture was deoxygenated by purging with N2 gas for 15 min. A N2-purged aqueous solution of NaAsc (36 mg, 0.18 mmol) was then added to the mixture and stirred at r.t. After 5 h, the polymerization was stopped by purging with oxygen, and the resulting particles were separated and purified repeatedly by centrifugation (12,000 rpm for 10 min) and redispersion, forming CeO2@PDA@PHEA(X) core–shell-hairy particles. The diameter of the particles and the hairy layer thickness of the core–shell-hairy particles were determined by the same methods shown above.

2.5. Preparation of the Pellet Samples

The pellet samples were obtained by drop casting an aqueous suspension of particles (solid concentration: 10 wt %) onto a silicone rubber plate and drying at room temperature overnight. The average center-to-center distances between the nearest particles (d) were determined by 100 pairs of particles obtained from SEM images.

2.6. Preparation of Structural Color Films

Solid samples of the CeO2@PDA@PHEA(X) particles were prepared by freeze-drying. These samples were sandwiched between two Teflon plates along with a silicone sheet as a spacer and hot-pressed at 50 °C for 15 min to obtain structural color films.

3. Results and Discussion

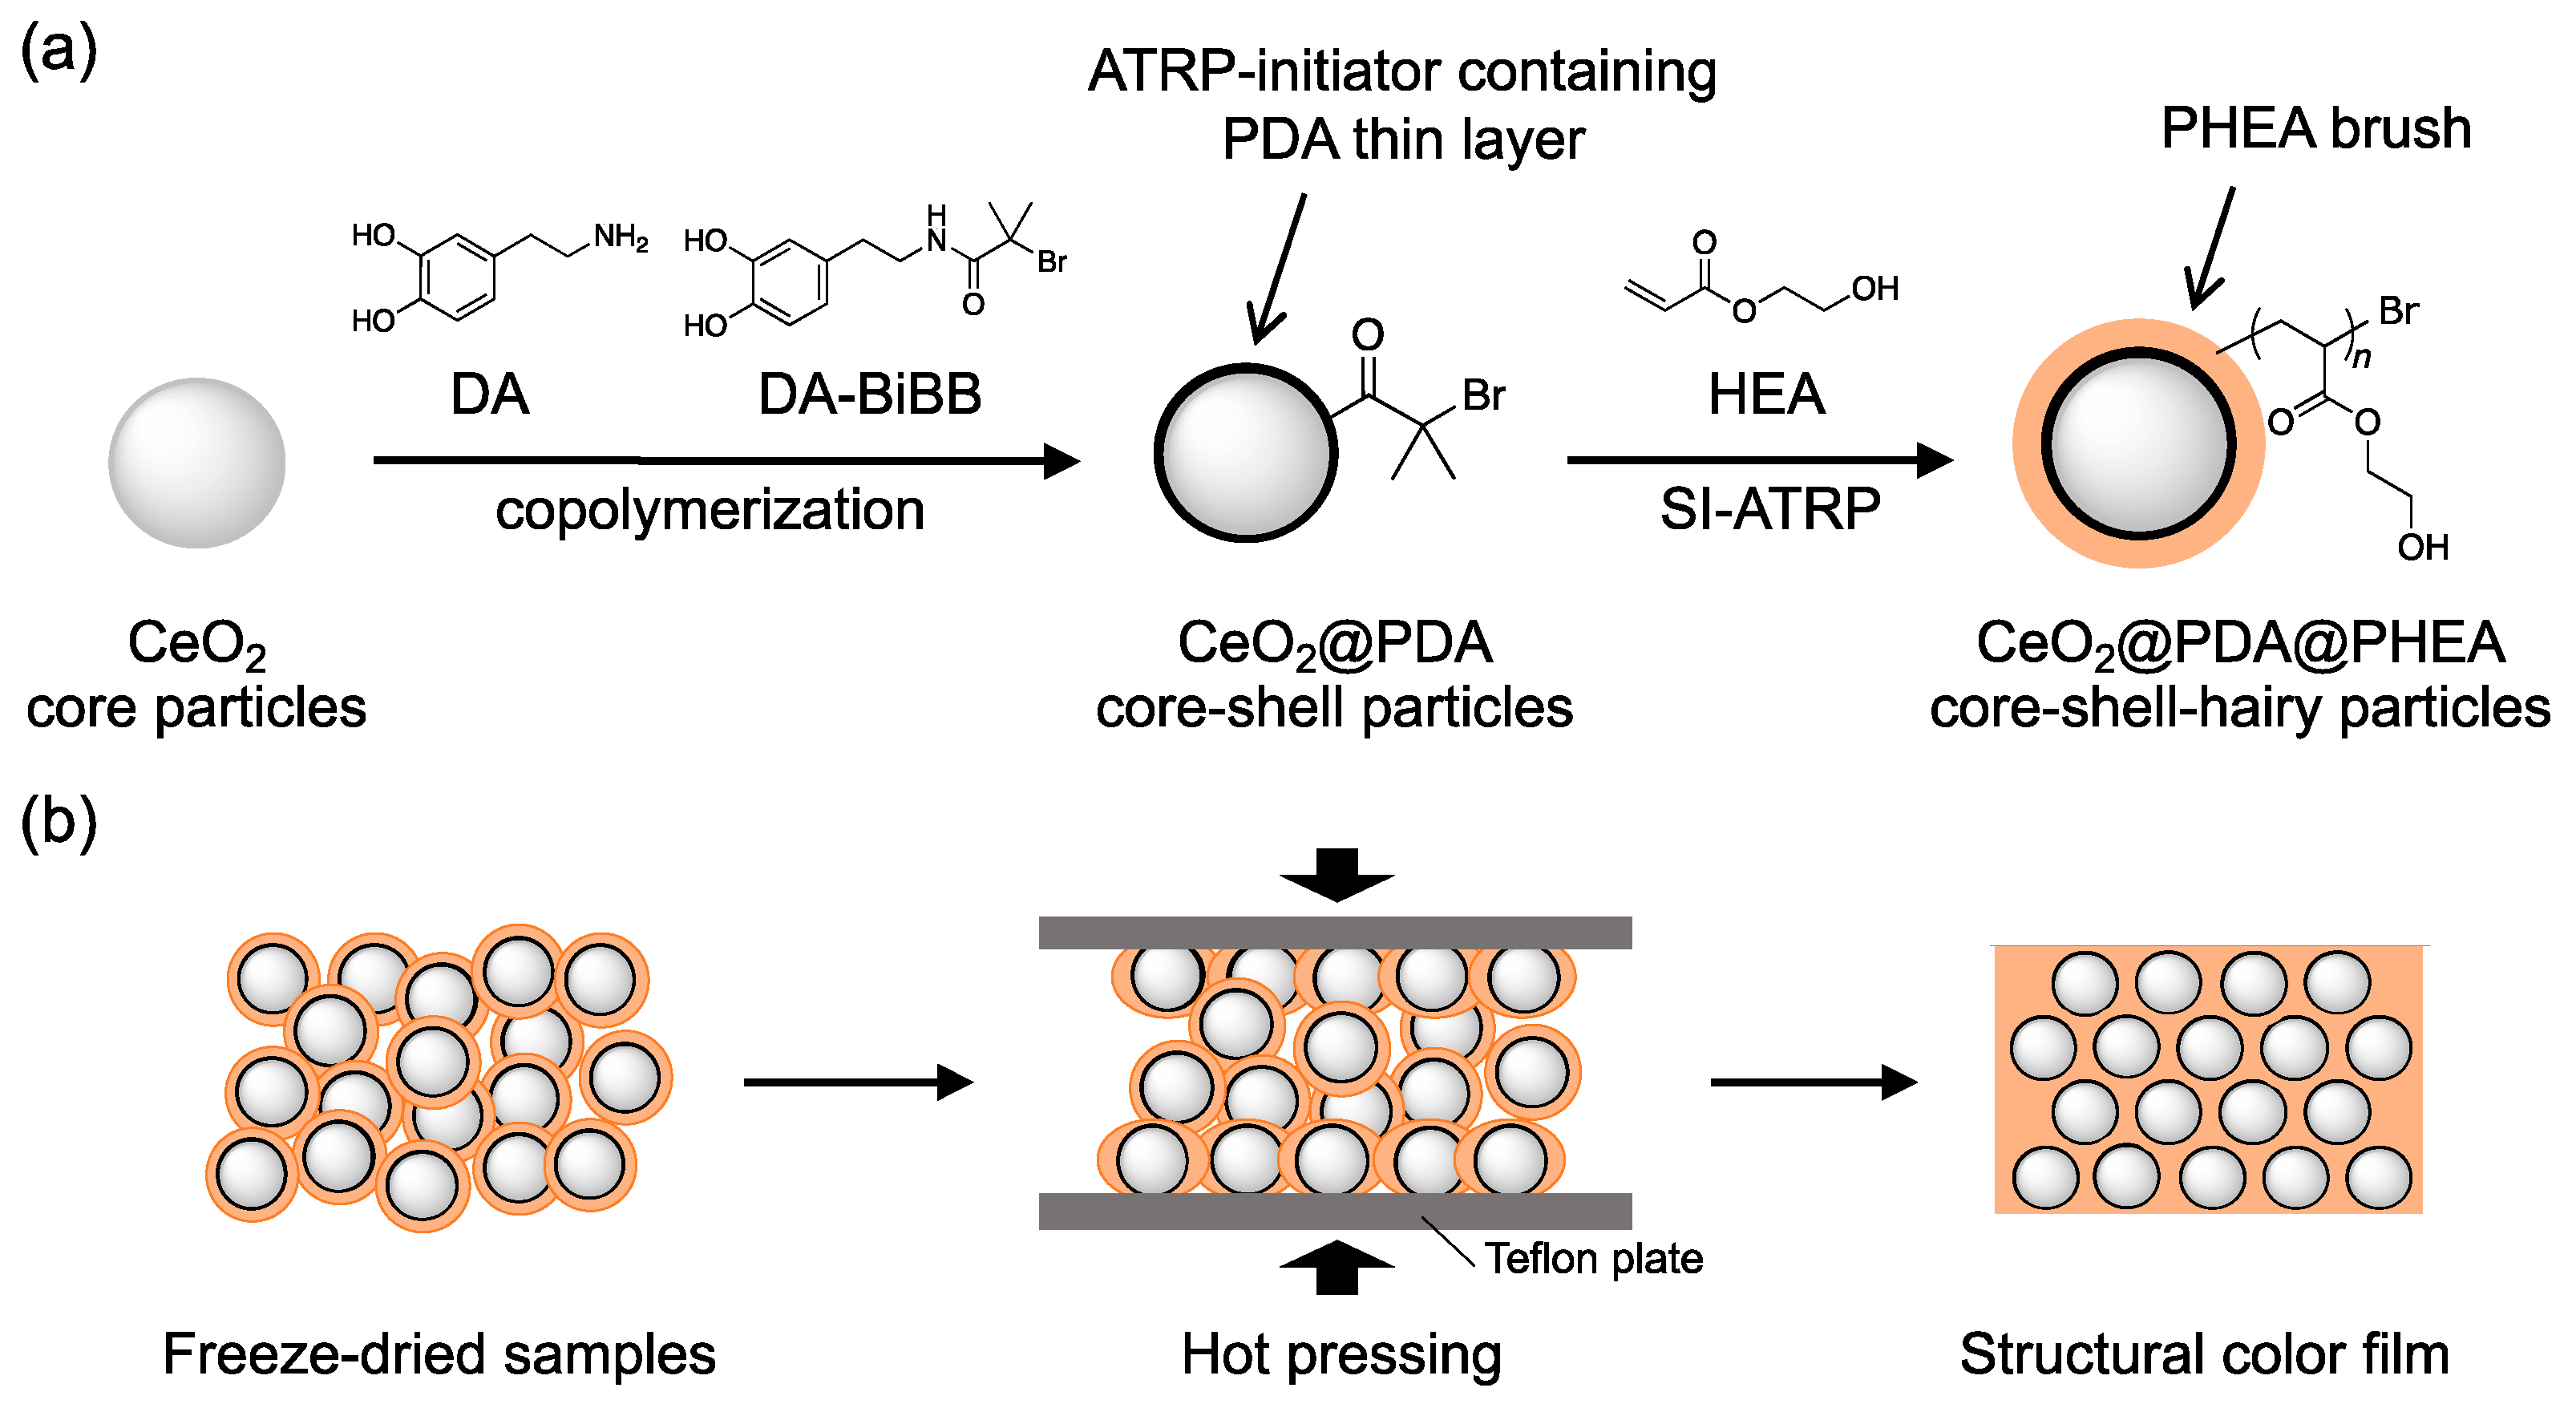
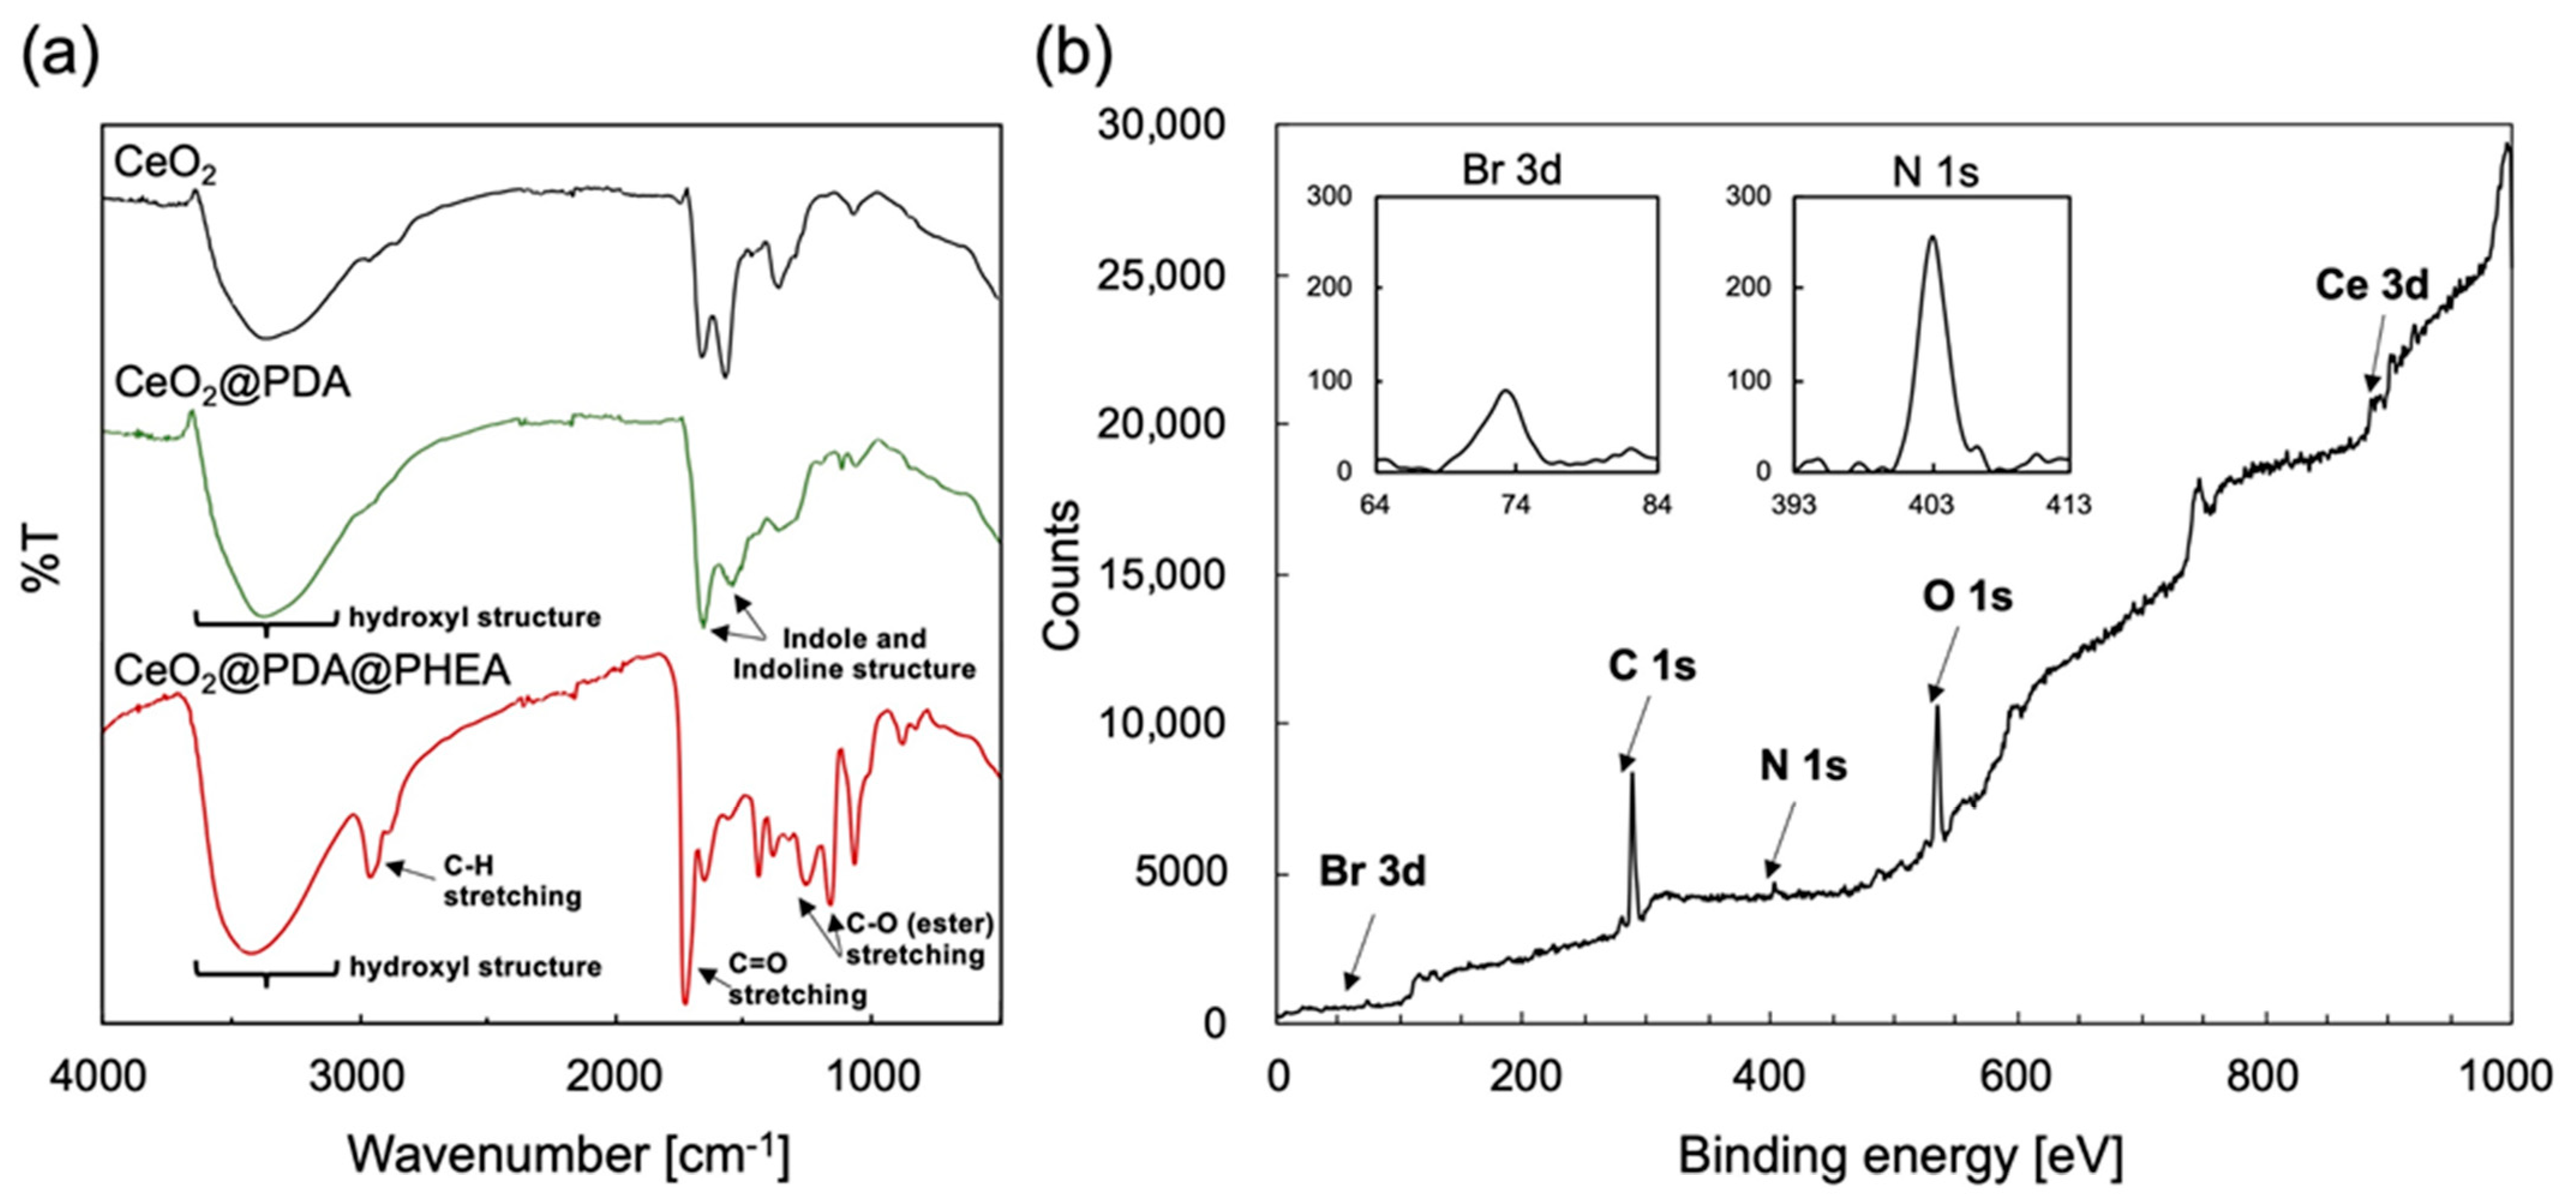
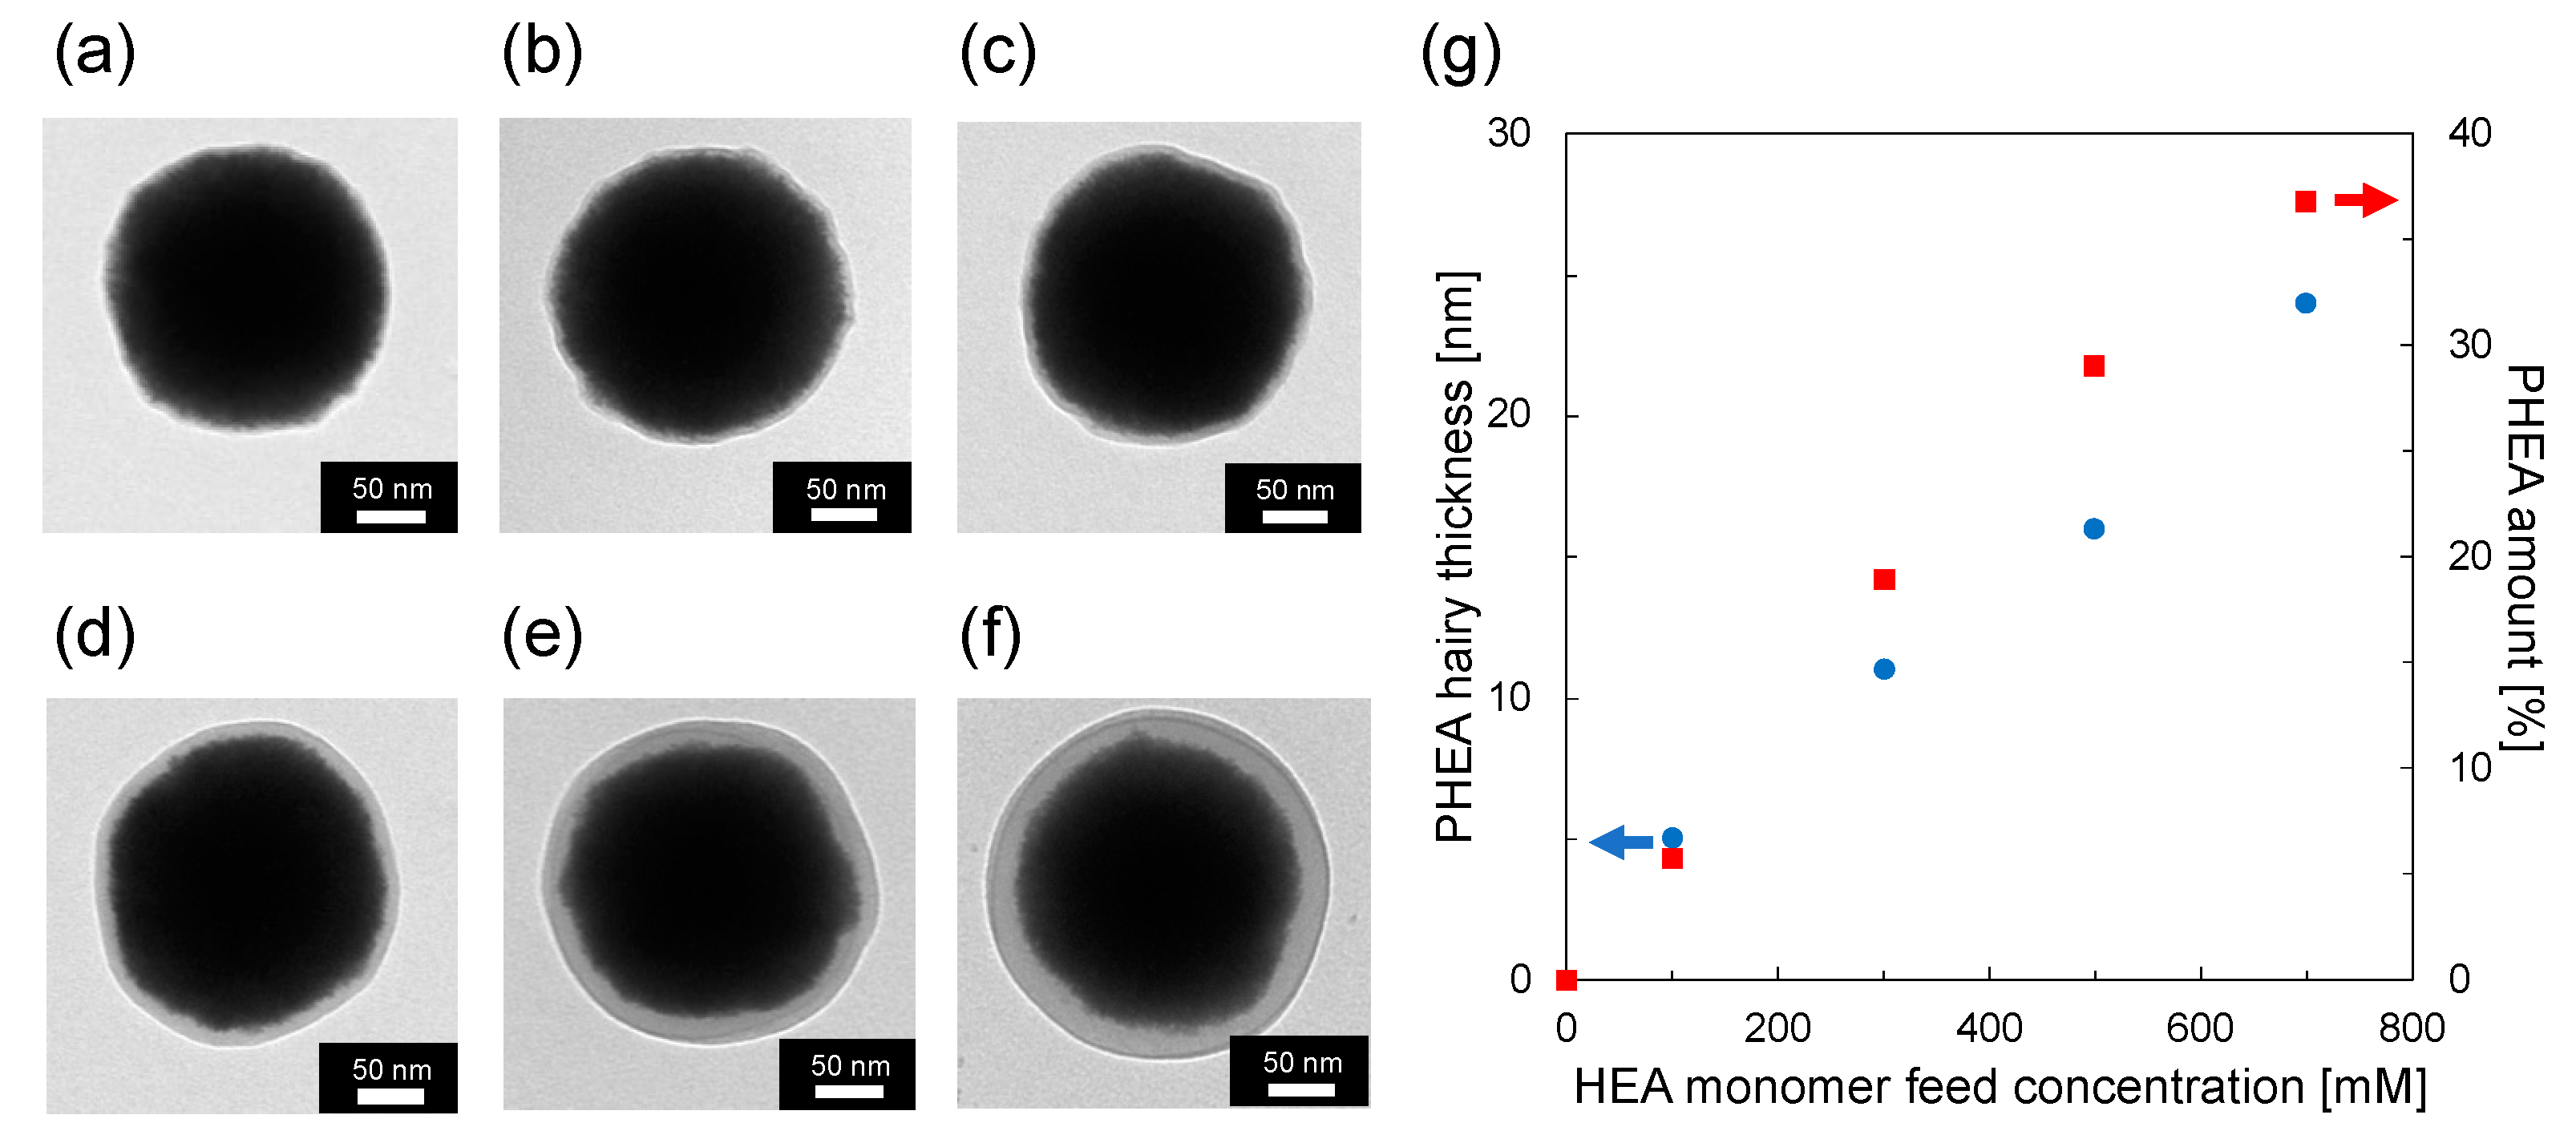
3.1. Preparation of CeO2@PDA@PHEA Core–Shell-Hairy Particles

The CeO2@PDA core–shell particles were prepared by the copolymerization of DA and ATRP initiator-bearing DA, i.e., DA-BiBB, in the presence of CeO2 core particles. IR measurements of the prepared CeO2@PDA particles revealed a broad peak at 3200–3500 cm1 due to hydroxyl group structures such as catechol groups, and the characteristic signals were observed at approximately 1500 and 1600 cm1 due to indoline and indole structures [40], suggesting the construction of PDA layers on the particle surface (Figure 2a). To evaluate the introduction of BiBB moieties into the PDA shell layer, the XPS spectrum of the CeO2@PDA particles was measured. As shown in Figure 2b, in addition to strong C1s, O1s, and N1s signals originating from PDA, weak Br3d signals indicating the presence of BiBB moieties were observed. The Br/N value can be regarded as the BiBB/DA ratio in the PDA shell layer [41], which was determined from the peak areas for the XPS narrow scan spectra for N1s and Br3d to be 0.24 (Figure 2b insets). The volume fraction of the PDA layer within the particles was determined from TGA measurements to be approximately 0.7 wt %. The density of the ATRP initiators on the particle surface, determined by Equation (1) below, was approximately 0.87 molecules nm2.
Density   [ molecule   nm 2 ] = α organics χ × N A S all
where αorganics is the weight of organics estimated from TGA and XPS measurements, χ is the molecular weight of the organics, NA is the Avogadro constant, and Sall is the total surface area of the core particles.
The CeO2@PDA@PHEA core–shell-hairy particles were then prepared by SI-ATRP of HEA in the presence of CeO2@PDA particles. The IR spectrum for the CeO2@PDA@PHEA particles shows characteristic peaks at 2900 and 1730 cm1 due to C-H and C=O stretching vibrations of the PHEA moiety, indicating that the PHEA layers are formed on the particle surface (Figure 2a). Figure 3a–f show TEM images of CeO2, CeO2@PDA, and CeO2@PDA@PHEA(X) particles. The CeO2@PDA particles contain a slight shell layer, which is not observed for the CeO2 particles. The PDA shell thickness was calculated from the TEM image to be approximately 2 nm. As the HEA monomer feed concentration is increased, a PHEA hairy layer is clearly observed. As shown in the left axis of Figure 3g, the thickness of the PHEA layer, calculated from the TEM image, is controlled from 5 to 24 nm. TEM images of CeO2@PDA@PHEA(24) particles measured at low magnification show that all particle surfaces are covered with PHEA hairy layers, demonstrating the usefulness of the present process (Figure S1). Partial coalescence and agglomeration of particles is observed in the TEM images, which may have occurred during the drying of the samples on the TEM grid. To evaluate the presence of aggregation in the obtained particles, the hydrodynamic diameter (Dh) of CeO2@PDA@PHEA(X) particles dispersed in water was measured by DLS. As shown in Figure S2, a monodisperse peak with a relatively low polydispersity index (PDI) was observed for all particles, which increases in size without aggregation. Note that the Dh determined by DLS and the diameter determined by TEM measurements were different because the hydrophilic PHEA hairy chains swelled in water. TGA measurements show that the PHEA amount on the surface of the CeO2@PDA@PHEA(X) particles ranges from 5.7 to 36.8 wt %, also indicating controlled PHEA layer building (Figure 3g right axis). DSC measurements for the CeO2@PDA@PHEA(24) particles showed a peak at approximately 15 °C, corresponding to the Tg of PHEA (Figure S3).

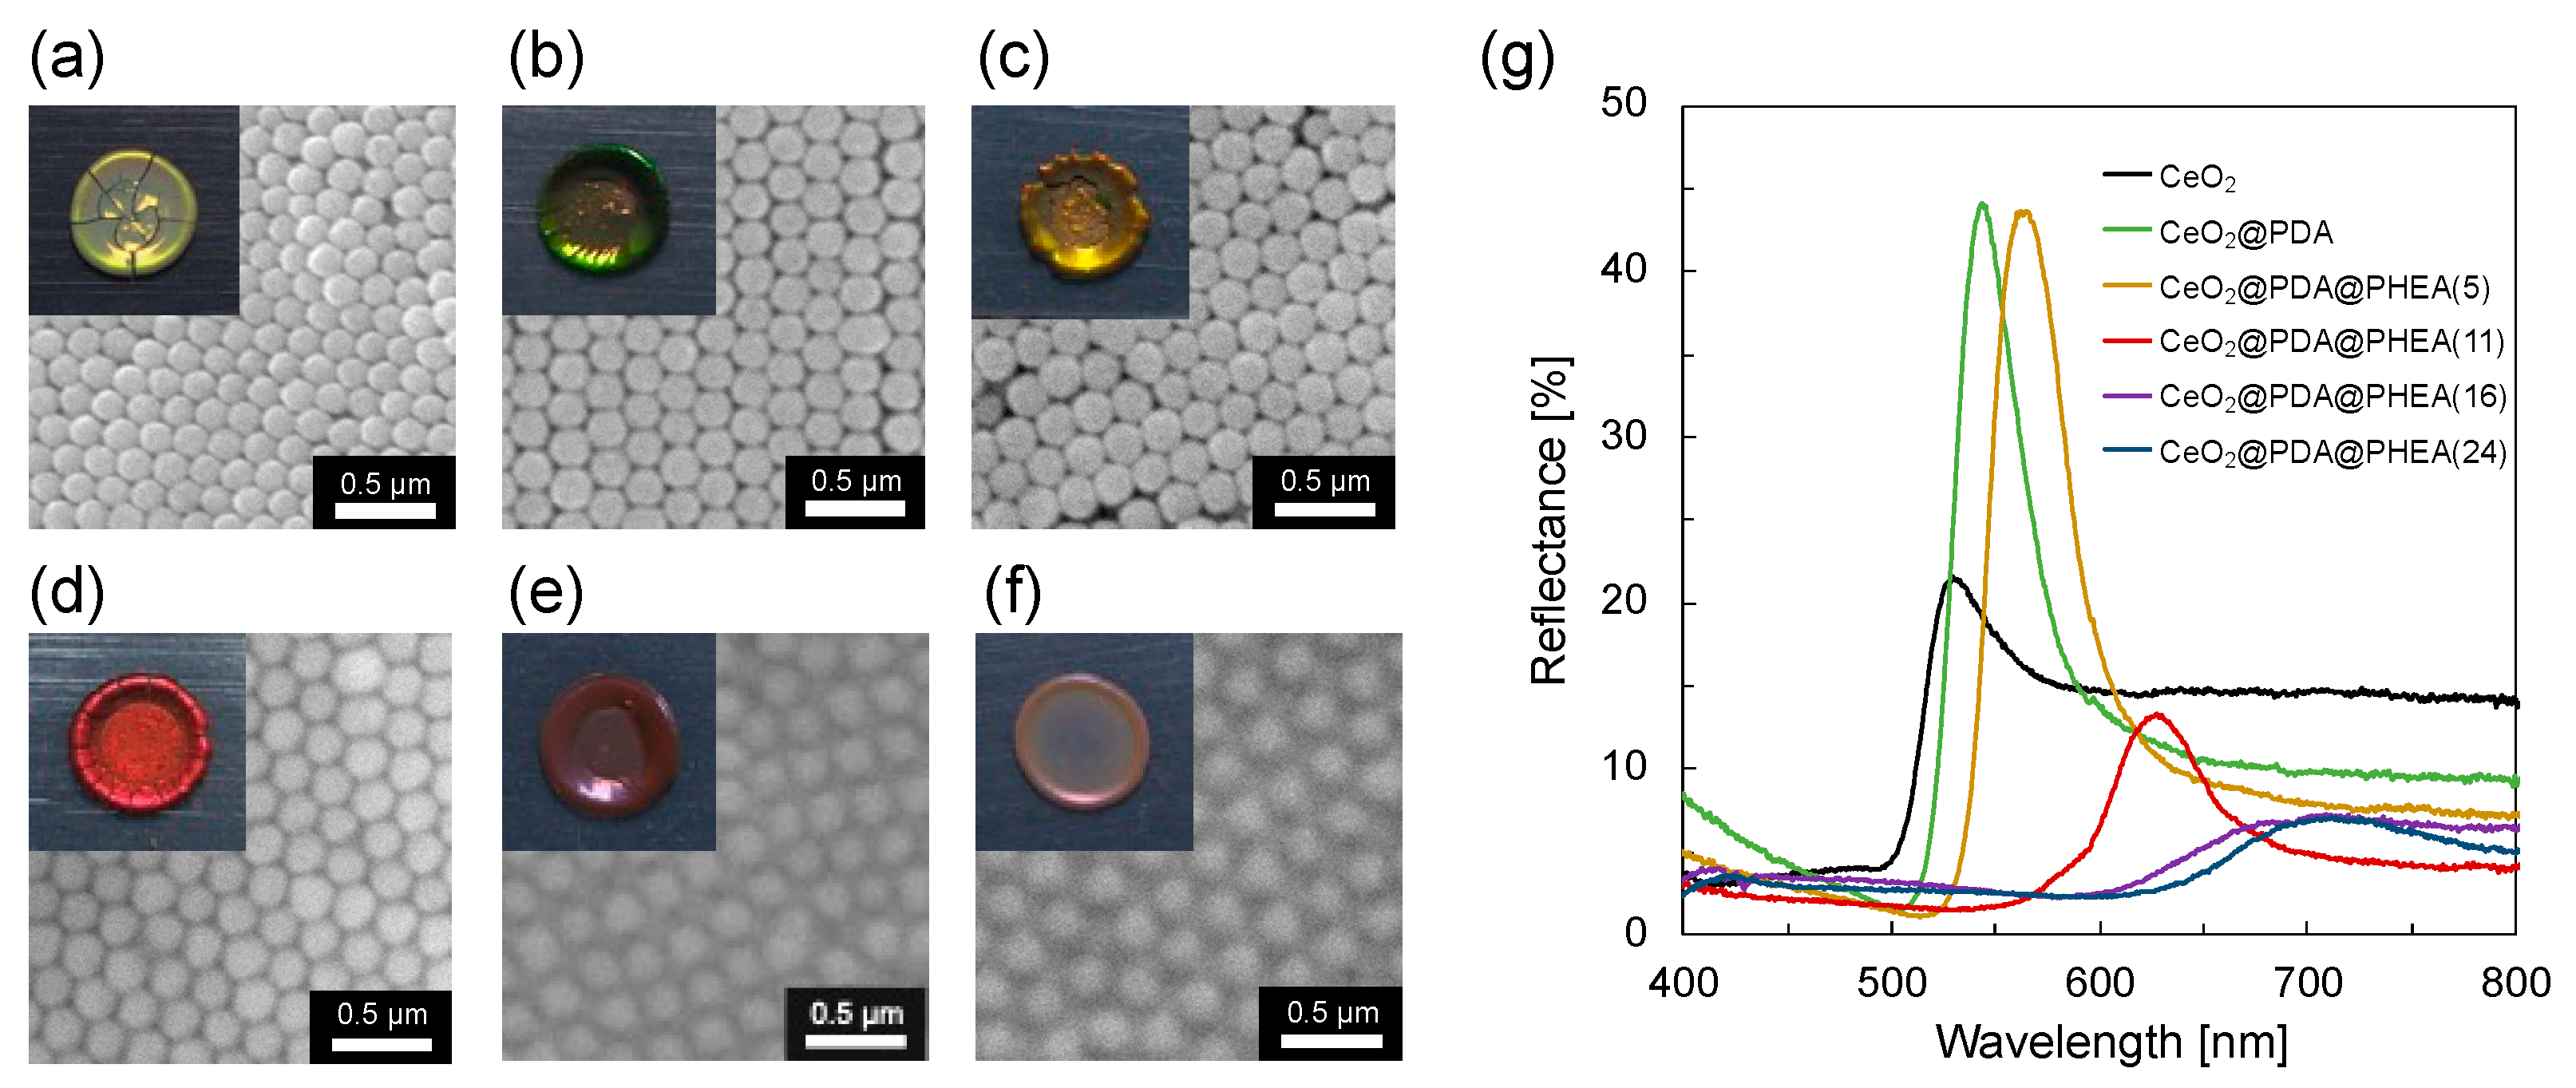
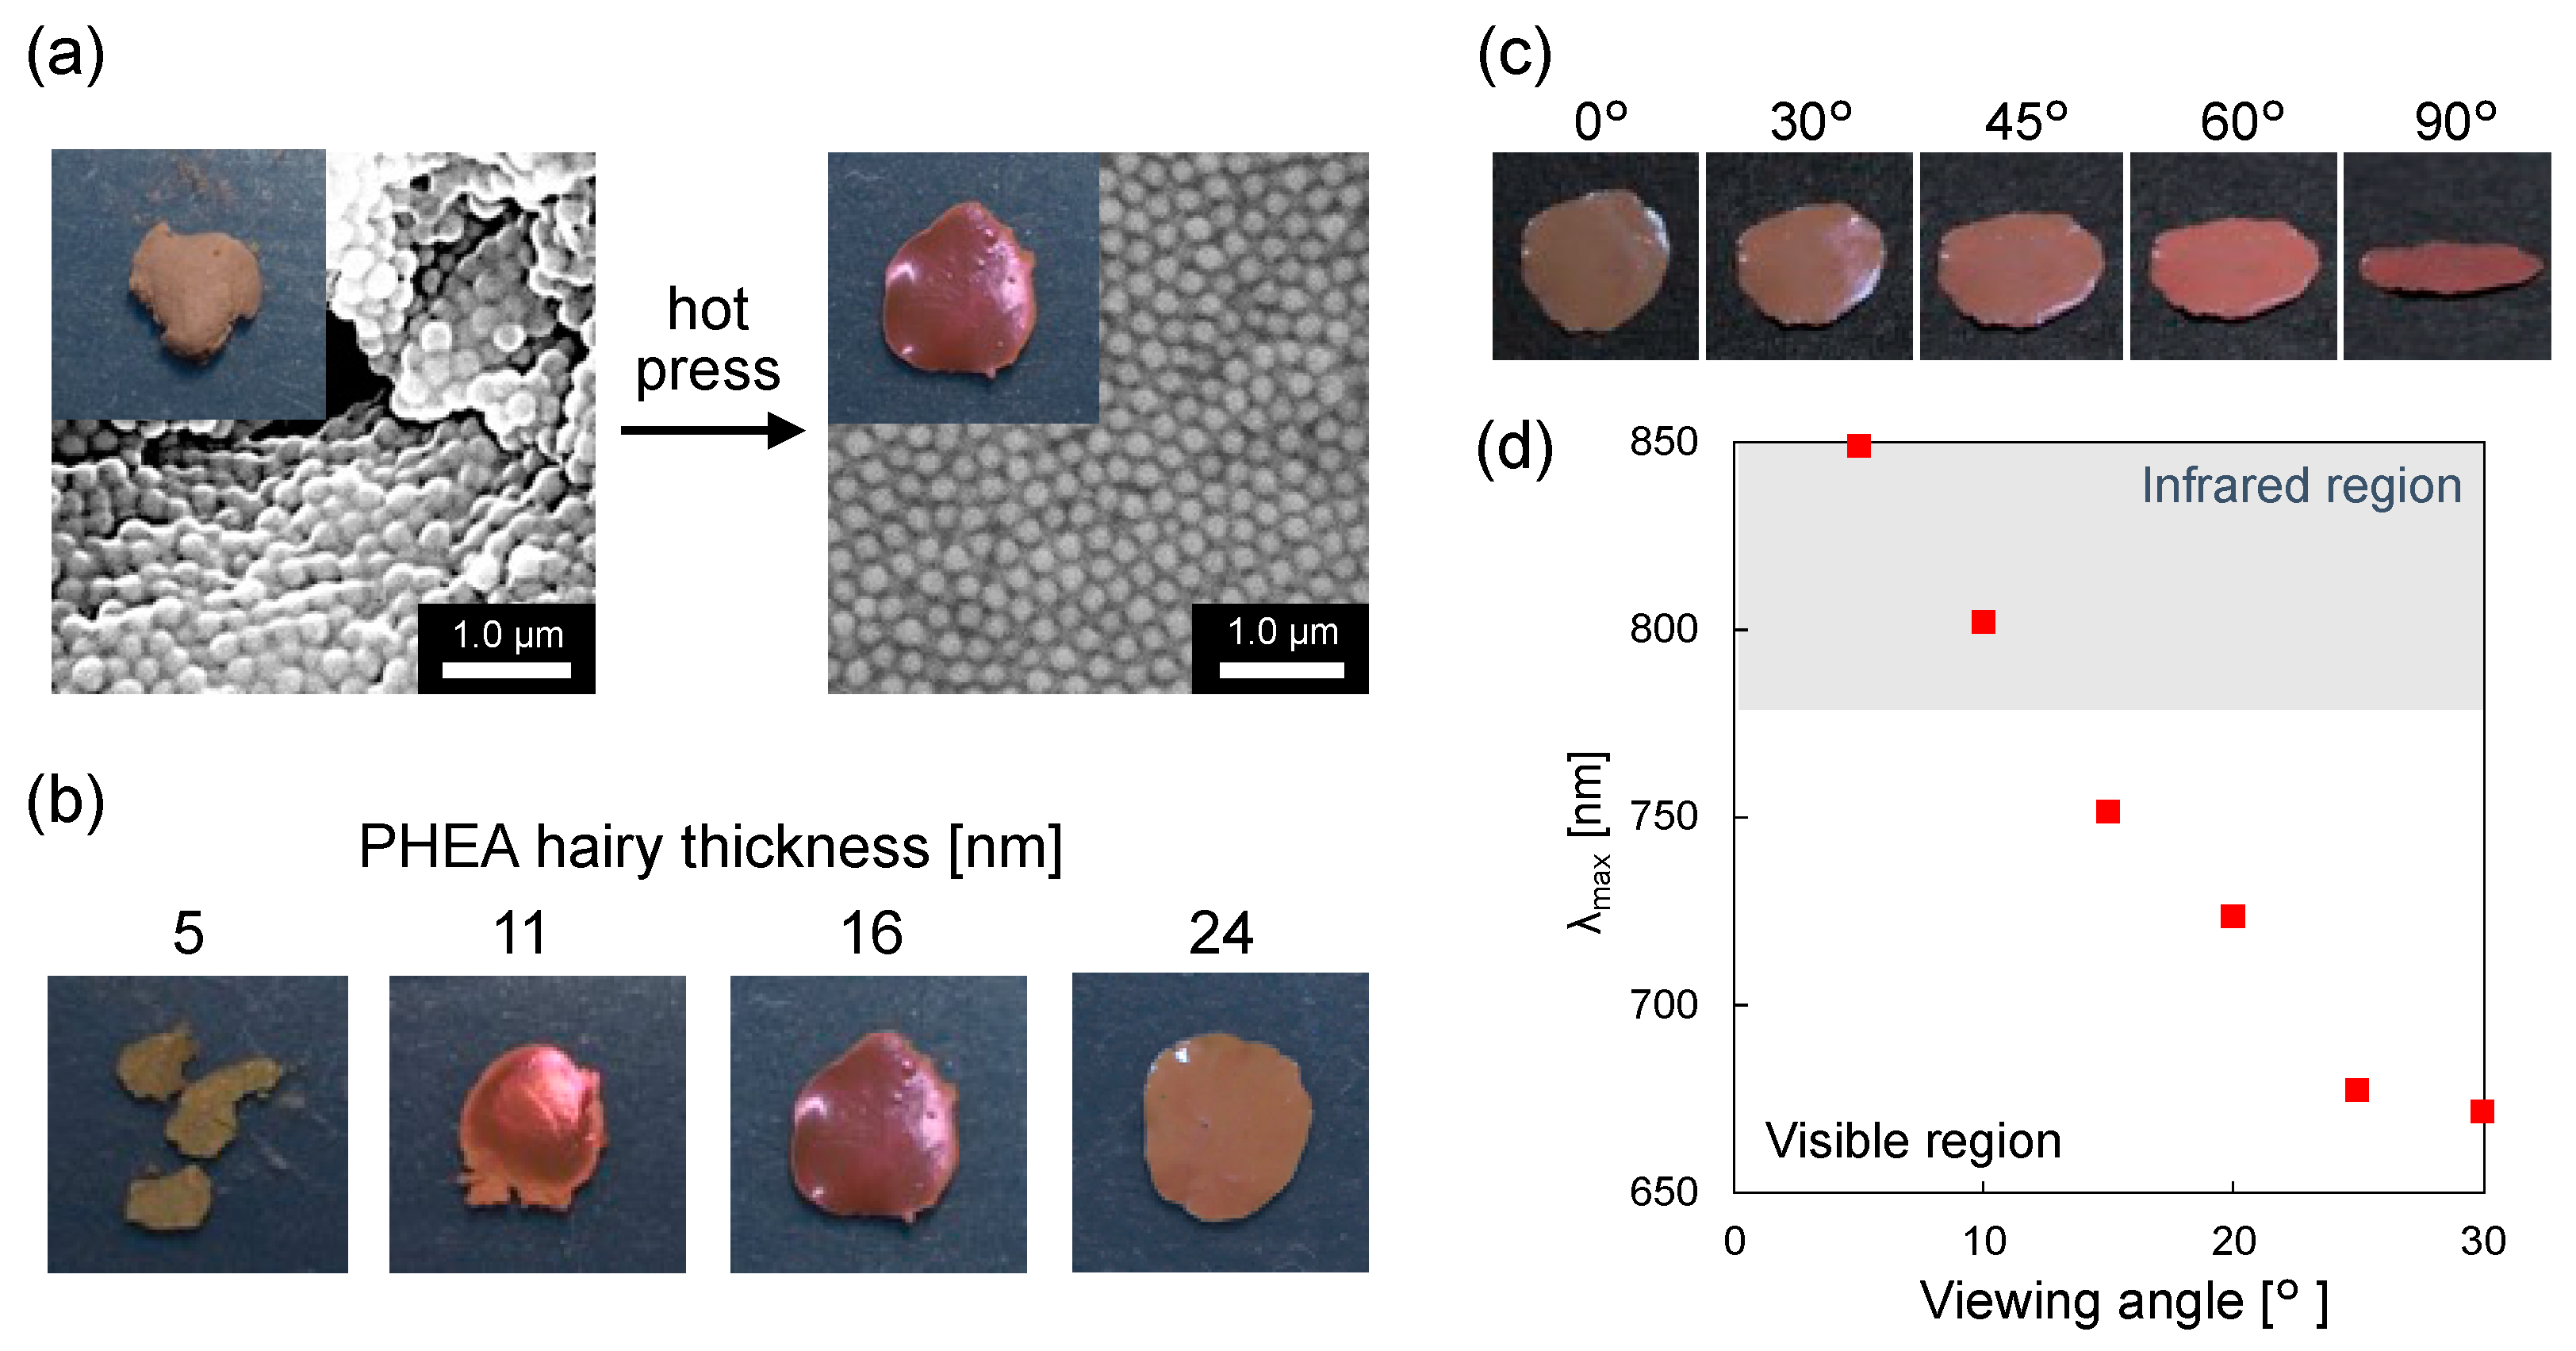
3.2. Effect of PHEA Hairy Layer Thickness on the Coloration of Pellet Samples

The aqueous dispersion of CeO2 particles was milky white, while that of CeO2@PDA and CeO2@PDA@PHEA(X) particles were both light brown due to the absorption of melanin (Figure S4). Pellet samples were prepared from these aqueous dispersions by drop casting. The green structural color was observed in both pellets prepared from CeO2 and CeO2@PDA particles (Figure 4a,b, insets). Comparing the reflection spectra for the pellets of CeO2 and CeO2@PDA particles (Figure 4g), the maximum reflection wavelength of the reflectance spectrum (λmax) is slightly redshifted due to the increase in particle size due to the PDA shell layer construction. A bright green color is observed for the CeO2@PDA pellets, whereas the CeO2 pellets are whitish green. The difference in the brightness of the structural color is probably due to absorption by the PDA shell in the CeO2@PDA pellet, which suppresses reflections due to multiple scattering in the visible region and emphasizes peaks derived from the structural color [29]. In addition, an increase in the reflection peak intensity is observed. This is probably due to the improved periodicity of the arrangement of the CeO2@PDA particles compared to the CeO2 particles, as observed from the SEM images shown in Figure 4a,b. The PDA coating fills the surface gaps of the distorted CeO2 core particles, resulting in a smooth spherical shape and improving the periodicity of the particle array [18]. When CeO2@PDA@PHEA(X) particles are used as components, the color of the pellets shifts from green to red as the interparticle distance affecting the structural color is increased with increasing PHEA hairy layer thickness (Figure 4c–f, insets). As shown in Figure 4g, the λmax for the pellet samples is redshifted due to the construction of the PHEA hairy layer. Under practical conditions, Bragg’s law, as expressed by Equation (2), can be applied by considering the effective refractive index (RI) of the system [42]:
m λ = 8 3 d 2 ( n eff 2 s i n 2 θ )
where m is the order of diffraction, λ is the wavelength of light, neff is the effective RI of the system, d is the center-to-center distance between the nearest particles, and θ is the angle between the incident light and the sample normal. The SEM images shown in Figure 4c–f indicate that the particles in the pellet samples formed a face-centered cubic (FCC) structure to which Equation (2) can be adapted. The value of neff can be calculated as a weighted sum of the RI of the particles and the gap portion using Equation (3) below [42].
n eff 2 = i n i 2 Φ i
where ni and Φi are the RI and volume fraction of their i portion, respectively. For an FCC structure, for the colloidal particles, Φ is 0.74. The RIs for the CeO2, CeO2@PDA, and CeO2@PDA@PHEA(X) particles were calculated using the following Equation (4) [43]:
n particle = n hairy [ 1 ( b c ) 3 ] + n shell   [ ( b c ) 3 ( a c ) 3 ] + n core   ( a c ) 3
where nparticle is the RI of the particles, nhairy is the RI of the PHEA hairy layer (1.50 [44]), nshell is the RI of the PDA shell layer (1.74 [45]), ncore is the RI of the CeO2 particles coated with PVP, and a, b, and c symbolize the radii of the core, core–shell, and core–shell-hairy particles, respectively. The reflection spectra shown in Figure 4g show that the reflectance for the pellet samples decreases as the thickness of the PHEA hairy layer is increased. In general, the reflectance of light passing from medium 1 to medium 2 is determined by following Fresnel’s equation (Equation (5)) [46]:
R = ( n 1 n 2 n 1 + n 2 ) 2
where R is the reflectance of light and n1 and n2 are the RIs for medium 1 and medium 2, respectively. Considering the phenomenon that light passing in the air is reflected at the surface of the pellet samples, n1 can be regarded as the RI of air (1.00) and n2 can be regarded as the RI of the particles (nparticle). The nparticle values calculated using Equation (4), the d values, the diameter of the particles, and the λmax values calculated using Equations (2) and (3) (θ = 5°) are summarized in Table 1. The nparticle is decreased with increasing thickness of the PHEA hairy layer due to the RI of PHEA (1.50). As shown by Equation (5), R is a function of the RI of the air and that of the particles. Thus, the reduction in nparticles may be one of the reasons for the lower reflectance of the pellet samples. The value of d, the center-to-center distance between the nearest particles, is smaller than the particle diameter for the CeO2 core particles and larger than that for the CeO2@PDA@PHEA(24) core–shell-hairy particles, whereas it is nearly equal to the particle diameter for the other particles. It has been reported that the Tg of PVP decreases below room temperature with increasing water content [47]. Therefore, due to the low Tg of PVP on the surface of CeO2 particles in the aqueous dispersion creating the sample, the CeO2 particles can be more densely assembled. For the CeO2@PDA@PHEA(24) particles, a large amount of the PHEA hairy layer can result in an expansion of the distance between the particles. Experimental values for λmax were compared with calculated values for the component filling the gaps in the particle array: air (RI = 1.00) and PHEA (RI = 1.50) (Table 1). When the CeO2, CeO2@PDA, and CeO2@PDA@PHEA(5) particles are used as components, the experimental values for λmax were relatively consistent with the calculated values with air as the gap component. On the other hand, the experimental values of λmax for the CeO2@PDA@PHEA(11), CeO2@PDA@PHEA(16), and CeO2@PDA@PHEA(24) particles agree relatively well with the calculated values when PHEA is the gap component, suggesting that the gap component is almost completely filled by the PHEA hairy layer.

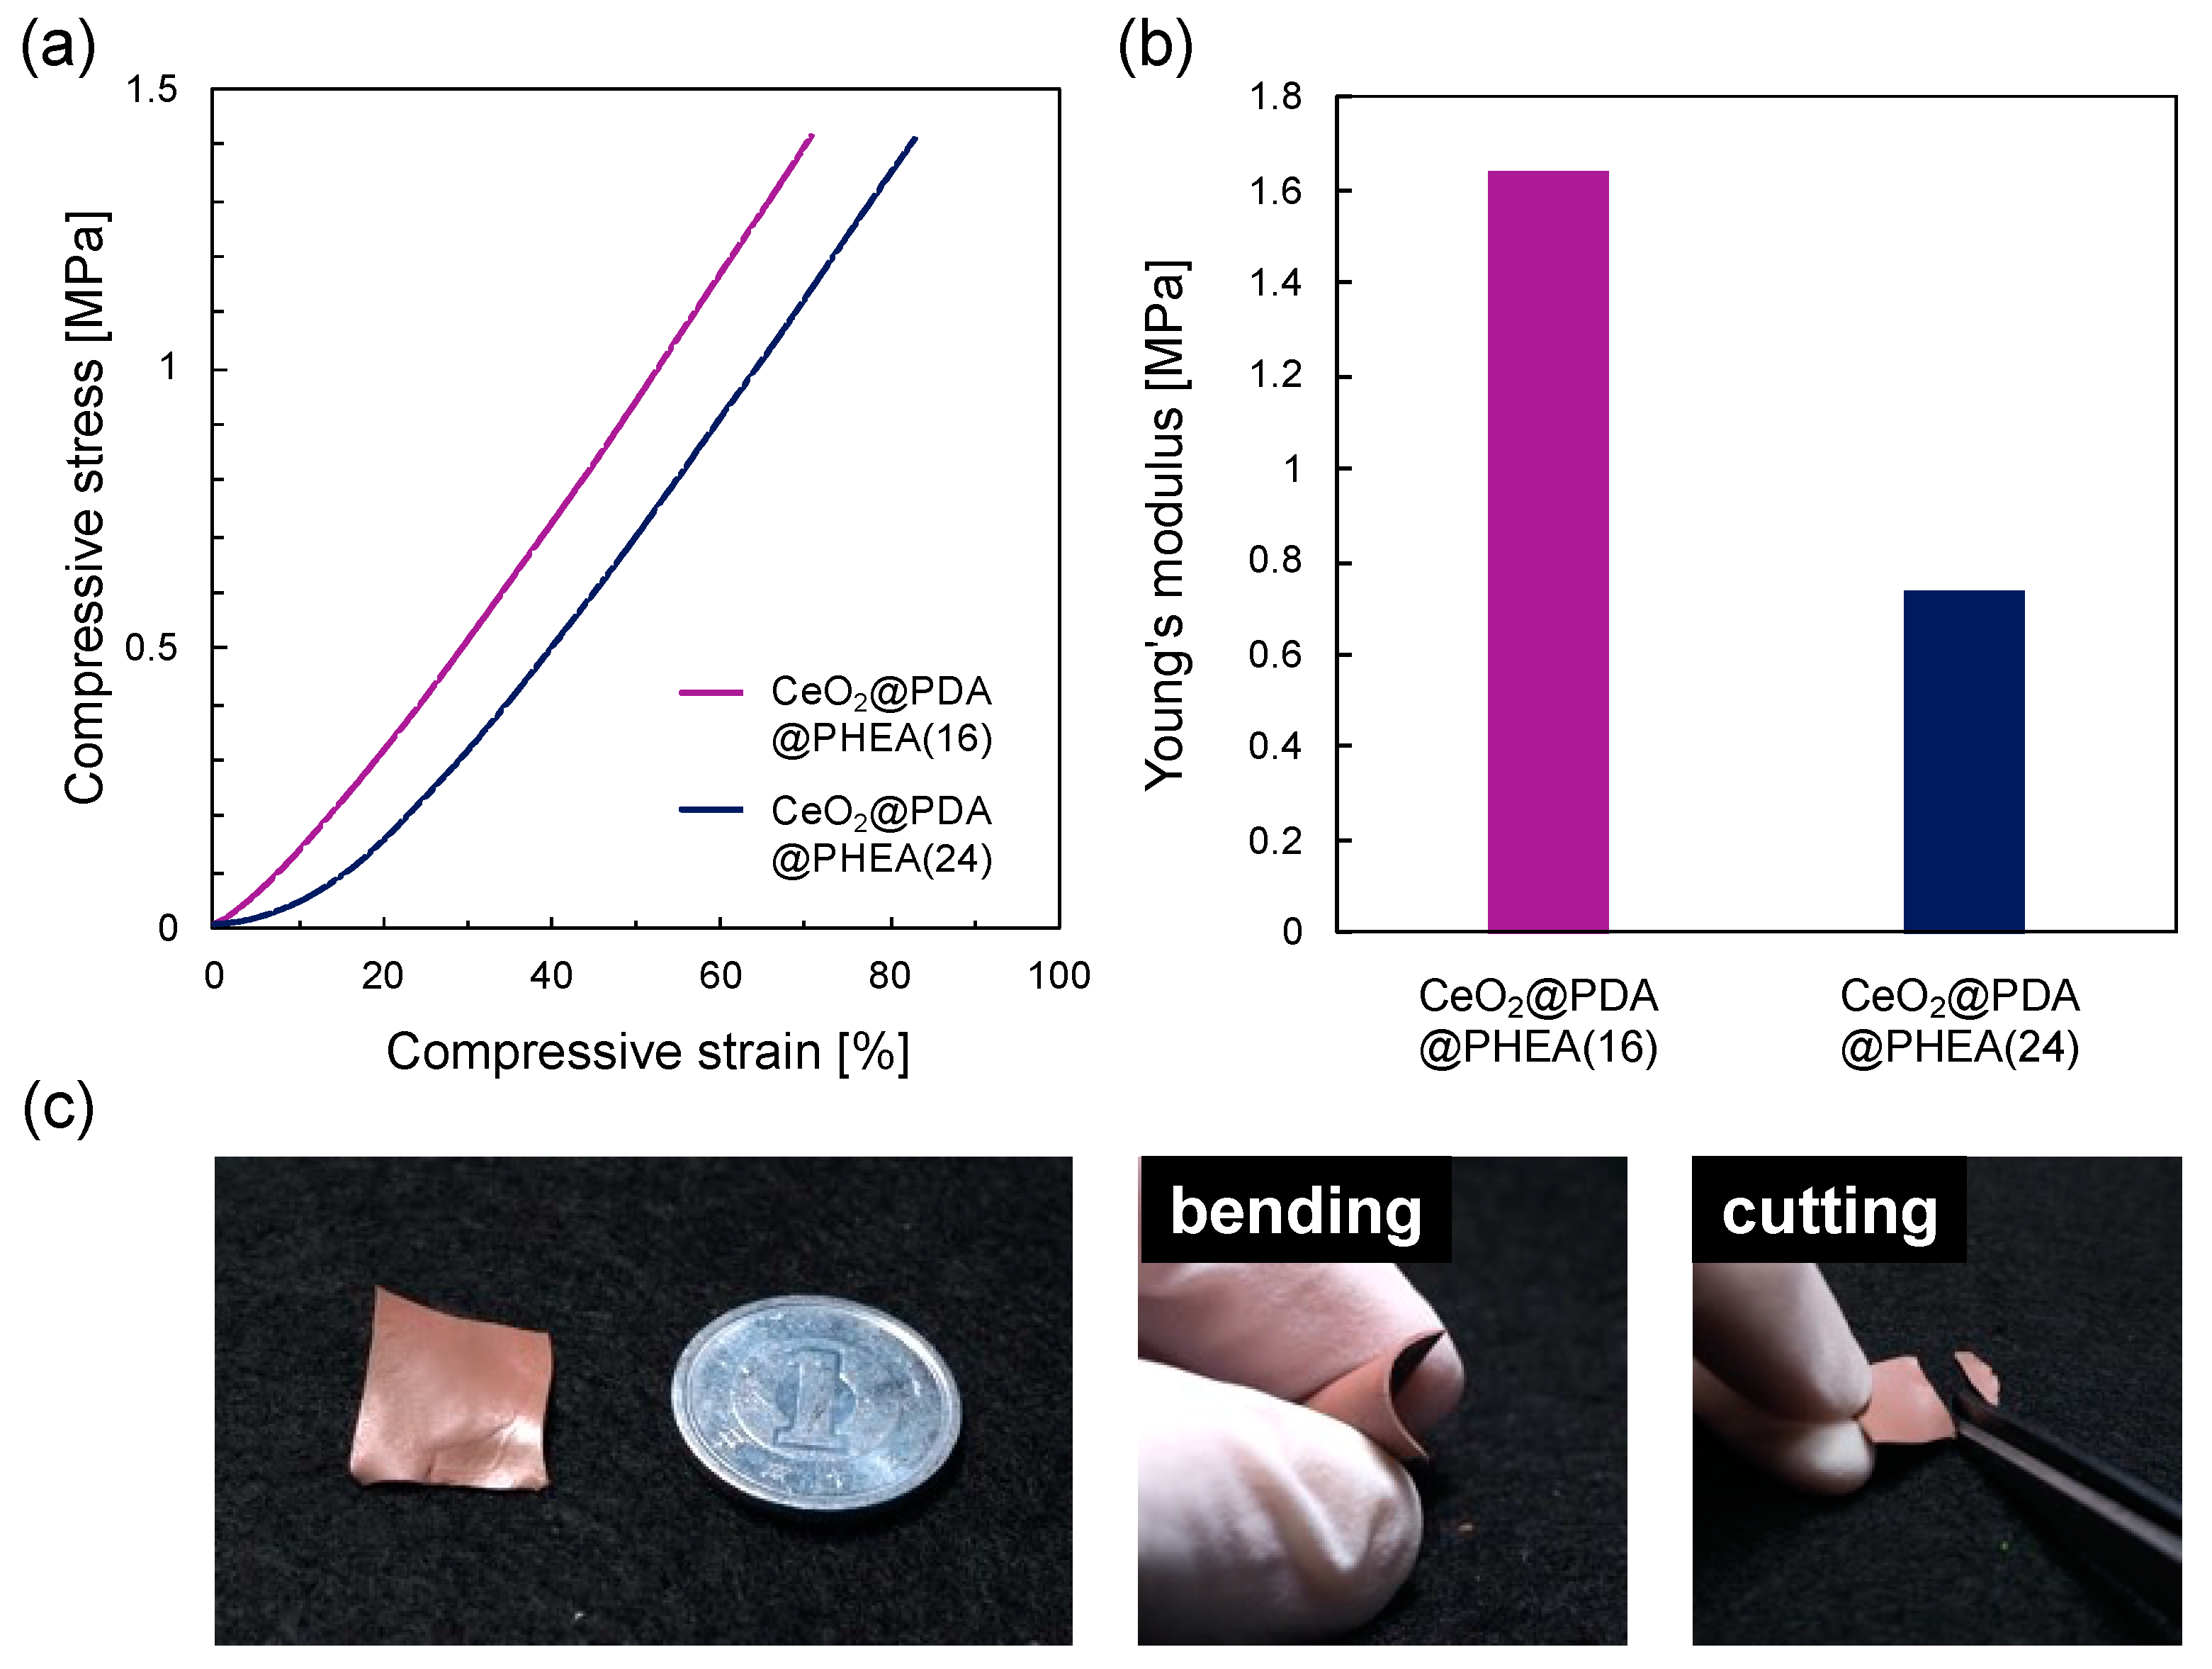
3.3. Preparation and Characterization of Structural Color Films

Structural color films were prepared by hot pressing the freeze-dried CeO2@PDA@PHEA(16) particles. Before hot pressing, the freeze-dried sample shows a brown color due to the light absorption by melanin particles. In contrast, the film obtained after hot pressing at 50 °C shows a bright red color (Figure 5a inset). While no clear reflection spectrum is observed for the sample before hot pressing, the reflection spectrum for the film obtained after hot pressing shows a peak at approximately 750 nm due to the red structural color (Figure S5). This is because the periodicity of the particle array is dramatically improved after hot pressing, as observed from the SEM image shown in Figure 5a. Three films were prepared using CeO2@PDA@PHEA(16) particles, and reflection spectra were measured for each film. As shown in Figure S6, the spectral shape and reflectance are almost constant, indicating the reproducibility of the sample preparation using the present method. To investigate the effect of the thickness of the PHEA hairy layer on the formation of the films, structural color films were prepared using CeO2@PDA@PHEA(X) particles (Figure 5b). When particles with thin PHEA hairy layer thicknesses (X = 5) are used, no film is found to be formed. On the other hand, particles with thicker PHEA hairy layers (X = 11, 16, and 24) produce structural color films. While the CeO2@PDA@PHEA(11) film cracked when force was applied, the CeO2@PDA@PHEA(16) and CeO2@PDA@PHEA(24) films retained their structure even when bent and showed some flexibility (Figure S7). This indicated that it is desirable to fill the gaps between particles with PHEA hairy layers to form flexible films (vide supra). The angle dependence for the structural color of the film composed of CeO2@PDA@PHEA(24) particles was investigated (Figure 5c). While the resulting film viewed from directly above appears brown, which is derived from melanin absorption, the red structural color can be gradually observed as the viewing angle is changed. The reflection spectra for the CeO2@PDA@PHEA(24) film measured at different angles shows a decrease in the wavelength of the reflection peak from the infrared region to the visible region (Figure 5d). The film with CeO2@PDA@PHEA(24) particles shows an angle-dependent structural color, indicating the formation of a periodic structure for the particles by hot pressing. In the aforementioned structural color pellet fabrication, which is obtained by drop-casting melanin particles dispersed in a solvent, it takes time to obtain pellets because the particles self-assemble as the solvent evaporates. On the other hand, this method demonstrated the simplicity of material preparation, as structural color films were easily obtained in a short time by hot pressing the sample after removing the solvent by freeze-drying.
Compression tests were performed to evaluate the mechanical properties of films consisting of CeO2@PDA@PHEA(X) particles. Unfortunately, measurements could not be performed for the CeO2@PDA@PHEA(5) and CeO2@PDA@PHEA(11) films because the PHEA layer thickness was too thin to maintain the film shape. On the other hand, the CeO2@PDA@PHEA(16) and CeO2@PDA@PHEA(24) films showed similar stress–strain behavior under the present experimental conditions and did not fracture, regardless of the PHEA hairy layer thickness, suggesting the robustness of the films (Figure 6a). Increasing the PHEA hairy layer decreases Young’s modulus calculated in the 5–15% compressive strain region (Figure 6b), indicating that the film becomes more flexible with increasing the PHEA hairy layer thickness. The appearance of the CeO2@PDA@PHEA(16) and CeO2@PDA@PHEA(24) films changed little before and after the compression test (Figure S8 insets). Furthermore, their reflection spectra also showed similar shapes, indicating that the structural color of the films was maintained before and after the compression test and the arrangement structure of the particles was preserved (Figure S8). As shown in Figure 6c, the flexible and robust CeO2@PDA@PHEA(24) film can be bent and cut.

4. Conclusions

We succeeded in the easy preparation of films that show a bright structural color with the surface-modified melanin particles as the single component. Melanin particles with hydrophilic, low Tg PHEA brushes coated onto a surface can be simply hot-pressed to form structural color films. Hot-pressing freeze-dried CeO2@PDA@PHEA particles results in films that exhibit an angle-dependent structural color due to the highly periodic microstructure, with the regularity of the arrangement enhanced by the fluidity of the particles. The resulting structural color film is flexible, self-supporting, and easy to process by cutting. The results from compression tests also confirm the film’s flexibility and robustness. Typical mechanisms for periodic microstructure-based structural color include interference, diffraction gratings, scattering, and photonic crystals [50]. The structural color obtained by the assembly of colloidal particles used in this system can be varied by changing the particle size, refractive index, blackness, and assembly method to achieve various colors [29]. Structural color films have been used in a wide range of applications such as smart displays [51] and strain sensors [52,53] due to their unique coloring properties. The present method can impart an arbitrary polymer layer on the surface of melanin particles, and the resulting particles would be applicable to the fabrication of structural color films with functions such as temperature response [54], mechanochromic [55], and fluorescent properties [56]. Most of these reported materials are prepared by multi-component systems in which light-absorbing materials such as carbon black are added to improve the visibility of the structural color. The method proposed here to obtain highly visible structural color films with melanin particles as a single component will enable simpler material fabrication and expand the possibilities of structural color materials.

Supplementary Materials

The following supporting information can be downloaded at: https://www.mdpi.com/article/10.3390/nano12193338/s1, Figure S1: TEM images of CeO2@PDA@PHEA(24) particles measured at low magnification; Figure S2: Hydrodynamic diameter (Dh) of CeO2@PDA@PHEA(X) particles dispersed in water as measured by DLS; Figure S3: DSC curve of CeO2@PDA@PHEA(24) particles in N2 at a 10 °C min−1 heating rate. The red arrow indicates the Tg of the sample; Figure S4: Photographs of aqueous dispersions of CeO2, CeO2@PDA, and CeO2@PHEA(X); Figure S5: Reflection spectra of CeO2@PDA@PHEA(16) films before and after hot pressing; Figure S6: Reflection spectra of three separately prepared CeO2@PDA@PHEA(16) films; Figure S7: Photographs of CeO2@PDA@PHEA(X) films during the bending; Figure S8: Reflectance spectra of CeO2@PDA@PHEA(16) and CeO2@PDA@PHEA(24) films before and after compression test. The inset shows photographs of the samples before and after the compression test. The center of the films was compressed and the reflectance spectra were measured at the compressed point particles (particle concentration: 1 wt %).

Author Contributions

Conceptualization, D.Y. and M.K.; Methodology, D.Y. and M.K.; Validation, D.Y. and M.K.; Formal Analysis, D.Y.; Investigation, D.Y. and M.K.; Data Curation, D.Y.; Writing-Original Draft Preparation, D.Y.; Writing-Review and Editing, M.K.; Visualization, D.Y. and M.K.; Supervision, K.K. and M.K.; Project Administration, M.K.; Funding Acquisition, M.K. All authors have read and agreed to the published version of the manuscript.

Funding

This work was partially supported by the Japan Society for the Promotion of Science KAKENHI (grant number JP20H02793) and KOSÉ Cosmetology Research Foundation.

Institutional Review Board Statement

Not applicable.

Informed Consent Statement

Not applicable.

Data Availability Statement

Not applicable.

Acknowledgments

The authors gratefully acknowledge Hokko Chemical Industry Co., Ltd. for providing the CeO2 particles. The XPS measurements were performed at the Center for Analytical Instrumentation and the Chiba Iodine Resource Innovation Center (CIRIC), Chiba University.

Conflicts of Interest

The authors declare no conflict of interest.

References

  1. Mba, J.C.; Mitomo, H.; Yonamine, Y.; Wang, G.; Matsuo, Y.; Ijiro, K. Hysteresis in the thermo-responsive assembly of hexa (ethylene glycol) derivative-modified gold nanodiscs as an effect of shape. Nanomaterials 2022, 12, 1421. [Google Scholar] [CrossRef] [PubMed]
  2. Ali, A.; Mitra, A.; Aïssa, B. Metamaterials and metasurfaces: A review from the perspectives of materials, mechanisms and advanced metadevices. Nanomaterials 2022, 12, 1027. [Google Scholar] [CrossRef] [PubMed]
  3. Alamer, F.A.; Beyari, R.F. Overview of the influence of silver, gold, and titanium nanoparticles on the physical properties of PEDOT: PSS-coated cotton fabrics. Nanomaterials 2022, 12, 1609. [Google Scholar] [CrossRef] [PubMed]
  4. Komatsu, K.; Hayakawa, T.; Fudouzi, H. Introduction of planar defect into colloidal photonic-crystal films and their optical properties. Adv. Powder. Technol. 2022, 33, 103594. [Google Scholar] [CrossRef]
  5. Yu, J.; Lee, C.H.; Kan, C.W.; Jin, S. Fabrication of structural-coloured carbon fabrics by thermal assisted gravity sedimentation method. Nanomaterials 2020, 10, 1133. [Google Scholar] [CrossRef]
  6. Neterebskaia, V.O.; Goncharenko, A.O.; Morozova, S.M.; Kolchanov, D.S.; Vinogradov, A.V. Inkjet printing humidity sensing pattern based on self-organizing polystyrene spheres. Nanomaterials 2020, 10, 1358. [Google Scholar] [CrossRef] [PubMed]
  7. Hong, R.; Shi, Y.; Wang, X.Q.; Peng, L.; Wu, X.; Cheng, H.; Chen, S. Highly sensitive mechanochromic photonic gel towards fast- responsive fingerprinting. RSC Adv. 2017, 7, 33258. [Google Scholar] [CrossRef]
  8. Dong, Y.; Bazrafshan, A.; Pokutta, A.; Sulejmani, F.; Sun, W.; Combs, J.D.; Clarke, K.C.; Salaita, K. Chameleon-inspired strain-accommodating smart skin. ACS Nano 2019, 13, 9918. [Google Scholar] [CrossRef]
  9. Hatton, B.; Michchenko, L.; Davis, S.; Sandhage, K.H.; Aizenberg, J. Assembly of large-area, highly ordered, crack-free inverse opal films. Proc. Natl. Acad. Sci. USA 2010, 107, 10354. [Google Scholar] [CrossRef]
  10. Chiappini, A.; Chiasera, A.; Berneschi, S.; Aremellini, C.; Carpentiero, A.; Mazzola, M.; Moser, E.; Varas, S.; Righini, G.C.; Ferrari, M. Sol–gel-derived photonic structures: Fabrication, assessment, and application. J. Sol Gel Sci. Technol. 2011, 60, 408. [Google Scholar] [CrossRef]
  11. Ding, H.; Liu, C.; Gu, H.; Zhao, Y.; Wang, B.; Gu, Z. Responsive colloidal crystal for spectrometer grating. ACS Photonics 2014, 1, 121. [Google Scholar] [CrossRef]
  12. Lee, G.H.; Han, S.H.; Kim, J.H.; Lee, J.M.; Kim, S.H. Colloidal photonic inks for mechanochromic films and patterns with structural colors of high saturation. Chem. Mater. 2019, 31, 8154. [Google Scholar] [CrossRef]
  13. Schroden, R.C.; Daous, M.A.; Blanford, C.F.; Stein, A. Optical properties of inverse opal photonic crystals. Chem. Mater. 2002, 14, 3305. [Google Scholar] [CrossRef]
  14. Armstrong, E.; O’Dwyer, C. Artificial opal photonic crystals and inverse opal structures-fundamentals and applications from optics to energy storage. J. Mater. Chem. C 2015, 3, 6109. [Google Scholar] [CrossRef]
  15. Shimamoto, H.; Cheng, C.H.; Kamitani, K.; Kojio, K.; Higaki, Y.; Takahara, A. Nanocomposite elastomers composed of silica nanoparticles grafted with a comb-shaped copolymer brush. Macromolecules 2019, 52, 5963. [Google Scholar] [CrossRef]
  16. Cheng, C.H.; Masuda, S.; Nozaki, S.; Nagano, C.; Hirai, T.; Kojio, K.; Takahara, A. Fabrication and deformation of mechanochromic nanocomposite elastomers based on rubbery and glassy block copolymer-grafted silica nanoparticles. Macromolecules 2020, 53, 4541. [Google Scholar] [CrossRef]
  17. Ohno, K.; Mizuta, Y. Structural color materials using polymer-brush-decorated hybrid particles. ACS Appl. Polym. Mater. 2020, 2, 368. [Google Scholar] [CrossRef]
  18. Iwasaki, T.; Harada, S.; Okoshi, T.; Moriya, M.; Kojima, T.; Kishikawa, K.; Kohri, M. Effect of the polydopamine composite method on structural coloration: Comparison of binary and unary assembly of colloidal particles. Langmuir 2020, 36, 11880. [Google Scholar] [CrossRef] [PubMed]
  19. Forster, J.D.; Noh, H.; Liew, S.F.; Saranathan, V.; Schreck, C.F.; Yang, L.; Park, J.G.; Prum, R.O.; Mochrie, S.G.J.; O’Hern, C.S.; et al. Biomimetic isotropic nanostructures for structural coloration. Adv. Mater. 2010, 22, 2939. [Google Scholar] [CrossRef]
  20. Takeoka, Y.; Yoshioka, S.; Takano, A.; Arai, S.; Nueangnoraj, K.; Nishihara, H.; Teshima, M.; Ohtsuka, Y.; Seki, T. Production of colored pigments with amorphous arrays of black and white colloidal particles. Angew. Chem. Int. Ed. 2013, 52, 7261. [Google Scholar] [CrossRef] [PubMed]
  21. Zhang, Y.; Han, P.; Zhou, H.; Wu, N.; Wei, Y.; Yao, X.; Zhou, J.; Song, Y. Highly brilliant noniridescent structural colors enabled by graphene nanosheets containing graphene quantum dots. Adv. Funct. Mater. 2018, 28, 1802585. [Google Scholar] [CrossRef]
  22. Fu, F.; Chen, Z.; Wang, H.; Liu, C.; Liu, Y.; Zhao, Y. Graphene hybrid colloidal crystal arrays with photo-controllable structural colors. Nanoscale 2019, 11, 10846. [Google Scholar] [CrossRef] [PubMed]
  23. Yoshioka, S.; Kinoshita, S. Effect of macroscopic structure in iridescent color of the peacock feathers. Forma 2002, 17, 169. [Google Scholar]
  24. Kinoshita, S.; Yoshioka, S.; Fujii, Y.; Okamoto, N. Photophysics of structural color in the Morpho butterflies. Forma 2002, 17, 103. [Google Scholar]
  25. d’Ischia, M.; Napolitano, A.; Ball, V.; Chen, C.T.; Buehler, M.J. Polydopamine and eumelanin: From structure-property relationships to a unified tailoring strategy. Acc. Chem. Res. 2014, 47, 3541. [Google Scholar] [CrossRef]
  26. Bao, X.; Zhao, J.; Sun, J.; Hu, M.; Yang, X. Polydopamine nanoparticles as efficient scavengers for reactive oxygen species in periodontal disease. ACS Nano 2018, 12, 8882. [Google Scholar] [CrossRef] [PubMed]
  27. Farnad, N.; Farhadi, K.; Voelcker, N.H. Polydopamine nanoparticles as a new and highly selective biosorbent for the removal of copper (II) ions from aqueous solutions. Water Air Soil Pollut. 2012, 223, 3535. [Google Scholar] [CrossRef]
  28. Kohri, M.; Nannichi, Y.; Taniguchi, T.; Kishikawa, K. Biomimetic non-iridescent structural color materials from polydopamine black particles that mimic melanin granules. J. Mater. Chem. C 2015, 3, 720. [Google Scholar] [CrossRef]
  29. Kawamura, A.; Kohri, M.; Morimoto, G.; Nannichi, Y.; Taniguchi, T.; Kishikawa, K. Full-color biomimetic photonic materials with iridescent and non-iridescent structural colors. Sci. Rep. 2016, 6, 33984. [Google Scholar] [CrossRef] [PubMed]
  30. Iwasaki, T.; Tamai, Y.; Yamamoto, M.; Taniguchi, T.; Kishikawa, K.; Kohri, M. Melanin precursor influence on structural colors from artificial melanin particles: PolyDOPA, polydopamine, and polynorepinephrine. Langmuir 2018, 34, 11814. [Google Scholar] [CrossRef] [PubMed]
  31. Kohri, M.; Tamai, Y.; Kawamura, A.; Jido, K.; Yamamoto, M.; Taniguchi, T.; Kishikawa, K.; Fujii, S.; Teramoto, N.; Ishii, H.; et al. Ellipsoidal artificial melanin particles as building blocks for biomimetic structural coloration. Langmuir 2019, 35, 5574. [Google Scholar] [CrossRef] [PubMed]
  32. Kohri, M. Artificial melanin particles: New building blocks for biomimetic structural coloration. Polym. J. 2019, 51, 1127. [Google Scholar] [CrossRef]
  33. Kohri, M. Progress in polydopamine-based melanin mimetic materials for structural color generation. Sci. Technol. Adv. Mater. 2020, 21, 833. [Google Scholar] [CrossRef] [PubMed]
  34. Kohri, M.; Yanagimoto, K.; Kawamura, A.; Hamada, K.; Imai, Y.; Watanabe, T.; Ono, T.; Taniguchi, T.; Kishikawa, K. Polydopamine-based 3D colloidal photonic materials: Structural color balls and fibers from melanin-like particles with polydopamine shell layers. ACS Appl. Mater. Interfaces 2018, 10, 7640. [Google Scholar] [CrossRef] [PubMed]
  35. Kohri, M.; Kobayashi, A.; Okoshi, T.; Shirasaka, H.; Hirai, K.; Ujiie, K.; Kojima, T.; Kishikawa, K. Bright solvent sensor using an inverse opal structure containing melanin-mimicking polydopamine. Chem. Lett. 2021, 50, 106. [Google Scholar] [CrossRef]
  36. Okoshi, T.; Iwasaki, T.; Takahashi, S.; Iwasaki, Y.; Kishikawa, K.; Kohri, M. Control of structural coloration by natural sunlight irradiation on a melanin precursor polymer inspired by skin tanning. Biomacromolecules 2021, 22, 1730. [Google Scholar] [CrossRef]
  37. Takahashi, S.; Kishikawa, K.; Kohri, M. External stimulus control of structural color visibility using colloidal particles covered with a catecholic polymer shell layer. Polym. J. 2022, 54, 1039. [Google Scholar] [CrossRef]
  38. Yamanlar, S.; Sant, S.; Boudou, T.; Picart, C.; Khademhosseini, A. Surface functionalization of hyaluronic acid hydrogels by polyelectrolyte multilayer films. Biomaterials 2011, 32, 5590. [Google Scholar] [CrossRef]
  39. Kohri, M.; Kohma, H.; Shinoda, Y.; Yamauchi, M.; Yagai, S.; Kojima, T.; Taniguchi, T.; Kishikawa, K. A colorless functional polydopamine thin layer as a basis for polymer capsules. Polym. Chem. 2013, 4, 2696. [Google Scholar] [CrossRef]
  40. Nishizawa, N.; Kawamura, A.; Kohri, M.; Nakamura, Y.; Fujii, S. Polydopamine particle as a particulate emulsifier. Polymers 2016, 8, 62. [Google Scholar] [CrossRef]
  41. Zhu, B.; Edmondson, S. Polydopamine-melanin initiators for surface-initiated ATRP. Polymer 2011, 52, 2141. [Google Scholar] [CrossRef]
  42. Ge, J.; Yin, Y. Responsive photonic crystals. Angew. Chem. Int. Ed. 2011, 50, 1492. [Google Scholar] [CrossRef]
  43. Yi, B.; Shen, H. Liquid-immune structural colors with angle-independence inspired from hollow melanosomes. Chem. Commun. 2017, 53, 9234. [Google Scholar] [CrossRef]
  44. Hernández, J.C.R.; Pradas, M.M.; Ribelles, J.L.G. Properties of poly(2-hydroxyethyl acrylate)-silica nanocomposites obtained by the sol-gel process. J. Non. Cryst. Solids 2008, 354, 1900. [Google Scholar] [CrossRef]
  45. Xiao, M.; Li, Y.; Allen, M.; Deheyn, D.; Yue, X.; Zhao, J.; Gianneschi, N.; Shawkey, M.; Dhinojwala, A. Bio-inspired structural colors produced via self-assembly of synthetic melanin nanoparticles. ACS Nano. 2015, 9, 5454. [Google Scholar] [CrossRef] [PubMed]
  46. Kinoshita, S.; Yoshioka, S.; Miyazaki, J. Physics of structural colors. Rep. Prog. Phys. 2008, 71, 076401. [Google Scholar] [CrossRef]
  47. Fitzpatrick, S.; McCabe, J.F.; Petts, C.R.; Booth, S.W. Effect of moisture on polyvinylpyrrolidone in accelerated stability testing. Int. J. Pharm. 2002, 246, 143. [Google Scholar] [CrossRef]
  48. Chaudhuri, T.K.; Patel, M.G. High refractive index films of ZnS/PVP nanocomposite by in situ thermolysis. J. Exp. Nanosci. 2015, 10, 135. [Google Scholar] [CrossRef]
  49. Krishna, M.G.; Hartridge, A.; Bhattacharya, A.K. Temperature and ionic size dependence of the properties of ceria based optionic thin films. Mater. Sci. Eng. C 1998, B55, 14. [Google Scholar] [CrossRef]
  50. Zhao, Y.; Xie, Z.; Gu, H.; Zhu, C.; Gu, Z. Bio-inspired variable structural color materials. Chem. Soc. Rev. 2012, 41, 3297. [Google Scholar] [CrossRef]
  51. Fan, W.; Zeng, J.; Gan, Q.; Ji, D.; Song, H.; Liu, W.; Wu, L. Iridescence-controlled and flexibly tunable retroreflective structural color film for smart displays. Sci. Adv. 2019, 5, 8775. [Google Scholar] [CrossRef] [PubMed]
  52. Yang, Z.; Koyama, M.; Fudouzi, H.; Hojo, T.; Akiyama, E. Availability of opal photonic crystal films for visualizing heterogeneous strain evolution in steels: Example of lüders deformation. ISIJ Int. 2020, 60, 2604. [Google Scholar] [CrossRef]
  53. Fudouzi, H.; Sawada, T. Photonic rubber sheets with tunable color by elastic deformation. Langmuir 2006, 22, 1365. [Google Scholar] [CrossRef]
  54. Schäfer, C.G.; Winter, T.; Heidt, S.; Dietz, C.; Ding, T.; Baumberg, J.J.; Gallei, M. Smart polymer inverse-opal photonic crystal films by melt-shear organization for hybrid core–shell architectures. J. Mater. Chem. C 2015, 3, 2204. [Google Scholar] [CrossRef]
  55. Wang, X.; Li, Y.; Zheng, J.; Li, X.; Liu, G.; Zhou, L.; Zhou, W.; Shao, J. Polystyrene@poly(methyl methacrylate-butyl acrylate) core-shell nanoparticles for fabricating multifunctional photonic crystal films as mechanochromic and solvatochromic sensors. ACS Appl. Nano Mater. 2022, 5, 729. [Google Scholar] [CrossRef]
  56. Schäfer, C.G.; Gallei, M.; Zahn, J.T.; Engelhardt, J.; Hellmann, G.P.; Rehahn, M. Reversible light-, thermo-, and mechano-responsive elastomeric polymer opal films. Chem. Mater. 2013, 25, 2309. [Google Scholar] [CrossRef]
Figure 1. (a) Preparation of CeO2@PDA core–shell and CeO2@PDA@PHEA core–shell-hairy particles. (b) Schematic diagram of the preparation of the structural color film by the hot-press method.
Nanomaterials 12 03338 g001
Figure 2. (a) IR spectra for the CeO2, CeO2@PDA, and CeO2@PDA@PHEA particles. (b) XPS spectrum for the CeO2@PDA particles. Insets show the XPS narrow-scan spectra for Br3d (left) and N1s (right).
Nanomaterials 12 03338 g002
Figure 3. TEM images of (a) CeO2, (b) CeO2@PDA, (c) CeO2@PDA@PHEA(5), (d) CeO2@PDA@PHEA(11), (e) CeO2@PDA@PHEA(16), and (f) CeO2@PDA@PHEA(24) particles. (g) Effect of HEA monomer feed concentration on PHEA hairy thickness and PHEA amount in CeO2@PDA@PHEA particles.
Nanomaterials 12 03338 g003
Figure 4. SEM images of pellet samples composed of (a) CeO2, (b) CeO2@PDA, (c) CeO2@PDA@PHEA(5), (d) CeO2@PDA@PHEA(11), (e) CeO2@PDA@PHEA(16), and (f) CeO2@PDA@PHEA(24) particles. The insets show photographs of the obtained pellets. (g) Reflection spectra for the pellet samples.
Nanomaterials 12 03338 g004
Figure 5. (a) SEM images of the freeze-dried samples of CeO2@PDA@PHEA(16) before and after hot-pressing. The insets show photographs of the samples. (b) Photographs of the structural color films composed of CeO2@PDA@PHEA particles with different PHEA hairy thicknesses. (c) Photographs and (d) λmax for the reflection peaks for the structural color film composed of CeO2@PDA@PHEA(24) particles viewed from different viewing angles.
Nanomaterials 12 03338 g005
Figure 6. (a) Compressive stress as a function of the compressive strain. (b) Young’s modulus of the samples obtained from the linear region of the graph shown in (a). (c) Photographs of the films prepared with the CeO2@PDA@PHEA(24) particles when bent or cut.
Nanomaterials 12 03338 g006
Table 1. Characterization of pellet samples obtained from the prepared particles.
CeO2CeO2@PDACeO2@PDA@PHEA(X)
X = 5X = 11X = 16X = 24
nparticle1.93 *1.921.871.811.771.72
Center-to-center distance (d) (nm)190 ± 6204 ± 4208 ± 4219 ± 5236 ± 8258 ± 17
Diameter of the particles (nm)198 ± 5202 ± 7211 ± 8223 ± 9233 ± 7249 ± 9
λmax [nm]Experimental values529544565628709714
Calculated values_gap: air538575572586619660
Calculated values_gap: PHEA--604620657702
* The RI of the CeO2 particles coated with PVP was calculated to be 1.93 according to Equation (4) above since the thickness of the PVP coating is approximately 10 nm, and the RIs for PVP and CeO2 are 1.48 [48] and 2.10 [49], respectively.
Publisher’s Note: MDPI stays neutral with regard to jurisdictional claims in published maps and institutional affiliations.

