Abstract
La-doped α-Fe2O3 nanoparticles were synthesized by a hydrothermal method. The effects of pH value on the morphology, structure, and electrochemical stability of the La-doped α-Fe2O3 nanoparticles were investigated by X-ray diffraction, transmission electron microscopy, Fourier-transform infrared spectrum, and electrochemical methods. The results show that the La-doped α-Fe2O3 nanoparticles exhibit a uniform spherical morphology at pH = 6, and are agglomerated with a poor dispersion at pH = 4 and 8. The iron oxide lattice is distorted by the La-doping, which increases the Fe–O bond strength. The decreased Fe–O bond length and the increased Fe–O bond energy at pH = 6 improve the electrochemical stability of α-Fe2O3. The waterborne coating modified with La-doped α-Fe2O3 nanoparticles exhibits a steady corrosion resistance.
1. Introduction
Metal corrosion affects economic development and production safety [1]. Coating is an effective strategy to protect metals from corrosion, which has been widely used in the metal protection field [2,3]. Iron oxide is regarded as an environmentally friendly inorganic coating material due to its chemical stability, covering, and coloring properties [4,5,6,7,8,9]. However, restricted by its corrosion-prone behavior, the application of iron oxide as a coating is limited [10]. Nanotechnology can modulate the structure and properties of iron oxide, which plays an important role in improving the corrosion resistance [11,12]. However, relevant research is still limited.
Rare earth La has a special electronic layer, which can be used to inhibit corrosion. Qin et al. [13] found that La and Ce elements with a special 4f electronic structure could easily release the trapped electrons and form shallow traps, thereby prolonging the lifetime of photogenerated electron–hole pairs and improving the photocatalytic activity of TiO2. Ning et al. [14] synthesized Ce-doped α-Fe2O3 nanoparticles using a hydrothermal method. It was found that Ce-doping leads to the lattice distortion of α-Fe2O3, which not only enhances the Fe–O bond energy, but also increases the chemical stability of α-Fe2O3. Currently, research mainly focuses on the dielectric properties [15,16], magnetic properties [17,18,19,20,21], adsorption properties [22], and magnetothermal properties [23] of La-doped ferrite or other composites. However, La-doped iron oxide is not widely reported. Shan et al. [24] synthesized La-doped α-Fe2O3 nanotubes by electrospinning. The sensing performance of acetone is higher on La-doped α-Fe2O3 nanotubes than that on α-Fe2O3 nanotubes. Aghazadeh et al. [25] investigated the electrochemical performance of undoped and La-doped magnetite nanoparticles by cyclic voltammetry and galvanostatic charge–discharge test. The results showed that La doping improved the capacitance of iron oxide. Melo et al. [26] synthesized La-doped Fe2O3 pigment from a polymer precursor using the Pechini method. Ravinder et al. [27] adopted the sol–gel method to synthesize nano α-Fe2O3. It was found that the crystal size decreases with an increase in the La content, and the average magnetization intensity decreases when the Fe3+ is replaced by La3+. Raj [28] found that La3+ completely replaced Fe3+ by substitution in La-doped Fe2O3 particles, which influenced the shape, the size, the distribution, and the band gap of the crystals. Zan et al. [29,30,31] found that the prepared super-foldable C-web/FeOOH-nanocone and super-foldable composite electrode can enhance the functional requirements of flexible electronic materials and also expand the application prospects of iron-based materials, providing a new research direction for the application of La-doped α-Fe2O3. To our best knowledge, the corrosion resistance properties of La-doped iron oxide have not been reported.
In this work, La-doped α-Fe2O3 nanoparticles were synthesized by a hydrothermal method. The effects of pH value on the structure and morphology of α-Fe2O3 were studied. The structure of the La-doped α-Fe2O3 lattice was simulated by Materials Studio (MS) software, and the electrochemical stability of La-doped α-Fe2O3 nanoparticles was investigated. In addition, the La-doped α-Fe2O3 nanoparticles were applied to the waterborne coatings, and the corrosion resistance of the coatings was studied. This research was helpful to explore the structure and electrochemical properties of La-doped α-Fe2O3, and provided technical support for the development of corrosion-resistant waterborne coatings.
2. Experimental Section
2.1. Materials
La2(SO4)3 (AR, >99%), Fe2(SO4)3 (AR, >99%), NaCl (AR, >99%), NaOH (AR, >96%), and H2SO4 (AR, >98%) were purchased from Sino-Pharm (Chemical Reagent Co., Ltd., Shanghai, China). All chemicals were directly used without purification.
2.2. Preparation of La-Doped α-Fe2O3 Nanoparticles
The La-doped α-Fe2O3 nanoparticles were synthesized using a hydrothermal method. In a typical synthesis process, 1.7 g La2(SO4)3 and 120.0 g Fe2(SO4)3 were dissolved in 600 mL deionized water in a flask. The solution pH values were adjusted to 4, 6, and 8, respectively, with NaOH. The mixture was placed in a titanium alloy autoclave and treated at 160 °C for 1 h with a stirring speed of 200 rpm. Then, the autoclave was naturally cooled to room temperature. The products were washed with deionized water and ethanol several times. After drying at 120 °C for 6 h, La-doped α-Fe2O3 nanoparticles were obtained. The preparation of undoped α-Fe2O3 nanoparticles was similar to that of La-doped α-Fe2O3 nanoparticles, except that no La2(SO4)3 was added, which was presented as α-Fe2O3(u). The La-doped α-Fe2O3 nanoparticles synthesized at various pH values were presented as La-doped α-Fe2O3(x), where x denotes the pH value.
2.3. Preparation of La-Doped α-Fe2O3 Modified Waterborne Coatings
The synthesis parameters of the La-doped α-Fe2O3-modified waterborne coatings are shown in Table 1. Firstly, the H2O, dispersing agent, defoamer, coalescent, ethylene glycol, acrylic resin, and thickening agent were mixed, and stirred at 300 rpm for 10 min. Then, the solution pH value was adjusted to 8–9 with ammonia. Subsequently, the La-doped α-Fe2O3 nanoparticles were added to the solution. The pH value was maintained at 8–9 with ammonia. The mixture was stirred at 300 rpm for another 20 min. The viscosity range of the mixture was adjusted to 0.2–0.35 Pa·s by a viscometer (RTW−16, NEU Shenyang, China). The α-Fe2O3-modified waterborne coatings were presented as coating(u). The La-doped α-Fe2O3-modified waterborne coatings were presented as coating(x), where x denotes the pH values.

Table 1.
Synthesis parameters of the La-doped α-Fe2O3-modified waterborne coatings.
To test the electrochemical properties of the coatings, the polished 1 cm × 1 cm × 1 cm Q235 steel block was connected with a copper wire, which was encapsulated in a PVC ferrule with epoxy resin. Then, the steel block was coated with the prepared slurry by a high-pressure spray gun (w-71, ANEST IWATA Company, Shanghai, China) at room temperature, and dried in an oven at 50 °C for 1 h. The coating thickness was controlled at 50 ± 5 μm with a digital laser thickness gauge (QNIX4200, Rosengarten, Germany).
2.4. Characterization
- (1)
- X-ray diffraction (XRD)
XRD patterns were collected on an X-ray diffractometer (D8 Advance, Bruker AXS GmbH, Karlsruhe, Germany) with Cu Kα (λ = 1.5418 Å) to identify the phase structures. All XRD spectra were measured in the range 2θ = 20–70° at a scanning speed of 2°/min. The average crystal size was calculated by the Scherrer equation.
- (2)
- Transmission electron microscope (TEM) and energy dispersive spectroscopy (EDS)
The morphology, the element distribution, and the crystal structure were observed by a TEM (FEI Tecnai G2 F20, FEI Company, Portland, OR, USA) equipped with EDS at 200 kV.
- (3)
- Fourier-transform infrared spectrometer (FT-IR)
The bond structure was measured by FTIR (Thermo Scientific Nicolet iS20, Waltham, MA, USA) in the range of 4000–400 cm−1 using a KBr pellet.
- (4)
- Electrochemical properties
Electrochemical property detections were performed on an electrochemical workstation (Metrohm, Autolab, Utrecht, Switzerland) at room temperature. A platinum sheet (Pt) was used as the counter electrode, a saturated calomel electrode (SCE) was used as the reference electrode, and 3.5 wt.% NaCl aqueous solution was used as the electrolyte.
The polarization curve of α-Fe2O3 nanoparticles was detected as follows. The nanoparticles, liquid paraffin, and carbon powder were uniformly mixed with a ratio of 1:4:5 and worked as the working electrode. The measurements were performed at a scanning speed of 1 mV·s−1 within the range of −0.5 V–+2 V.
The polarization curve and electrochemical impedance (EIS) of the α-Fe2O3-modified waterborne coating are tested as follows. The coated steel block was selected as the working electrode, and the polarization curve was obtained in the range of −0.5 V–+1 V. The electrochemical impedance spectrum was scanned with 10mVRMS in the range of 0.01 Hz~100,000 Hz, which was further analyzed using NOVA 2.0 software (Metrohm, Beijing, China) to obtain the charge transfer resistance.
- (5)
- Molecular dynamics simulation
Materials Studio (MS) software was used for the molecular dynamics’ simulation. The Visualizer module was used for crystal modeling. The universal force field was selected in the Forcite module to optimize the iron oxide lattice. The resulting energy-minimized lattice was dynamically simulated under the conditions of constant temperature (T), constant pressure (P), and the number of atoms (N) (NPT) ensemble with the temperature of 433 K, pressure of 1.20 MPa, and simulation time of 500 Ps.
3. Results and Discussion
3.1. La-Doped α-Fe2O3 Nanoparticle Characterization
3.1.1. XRD
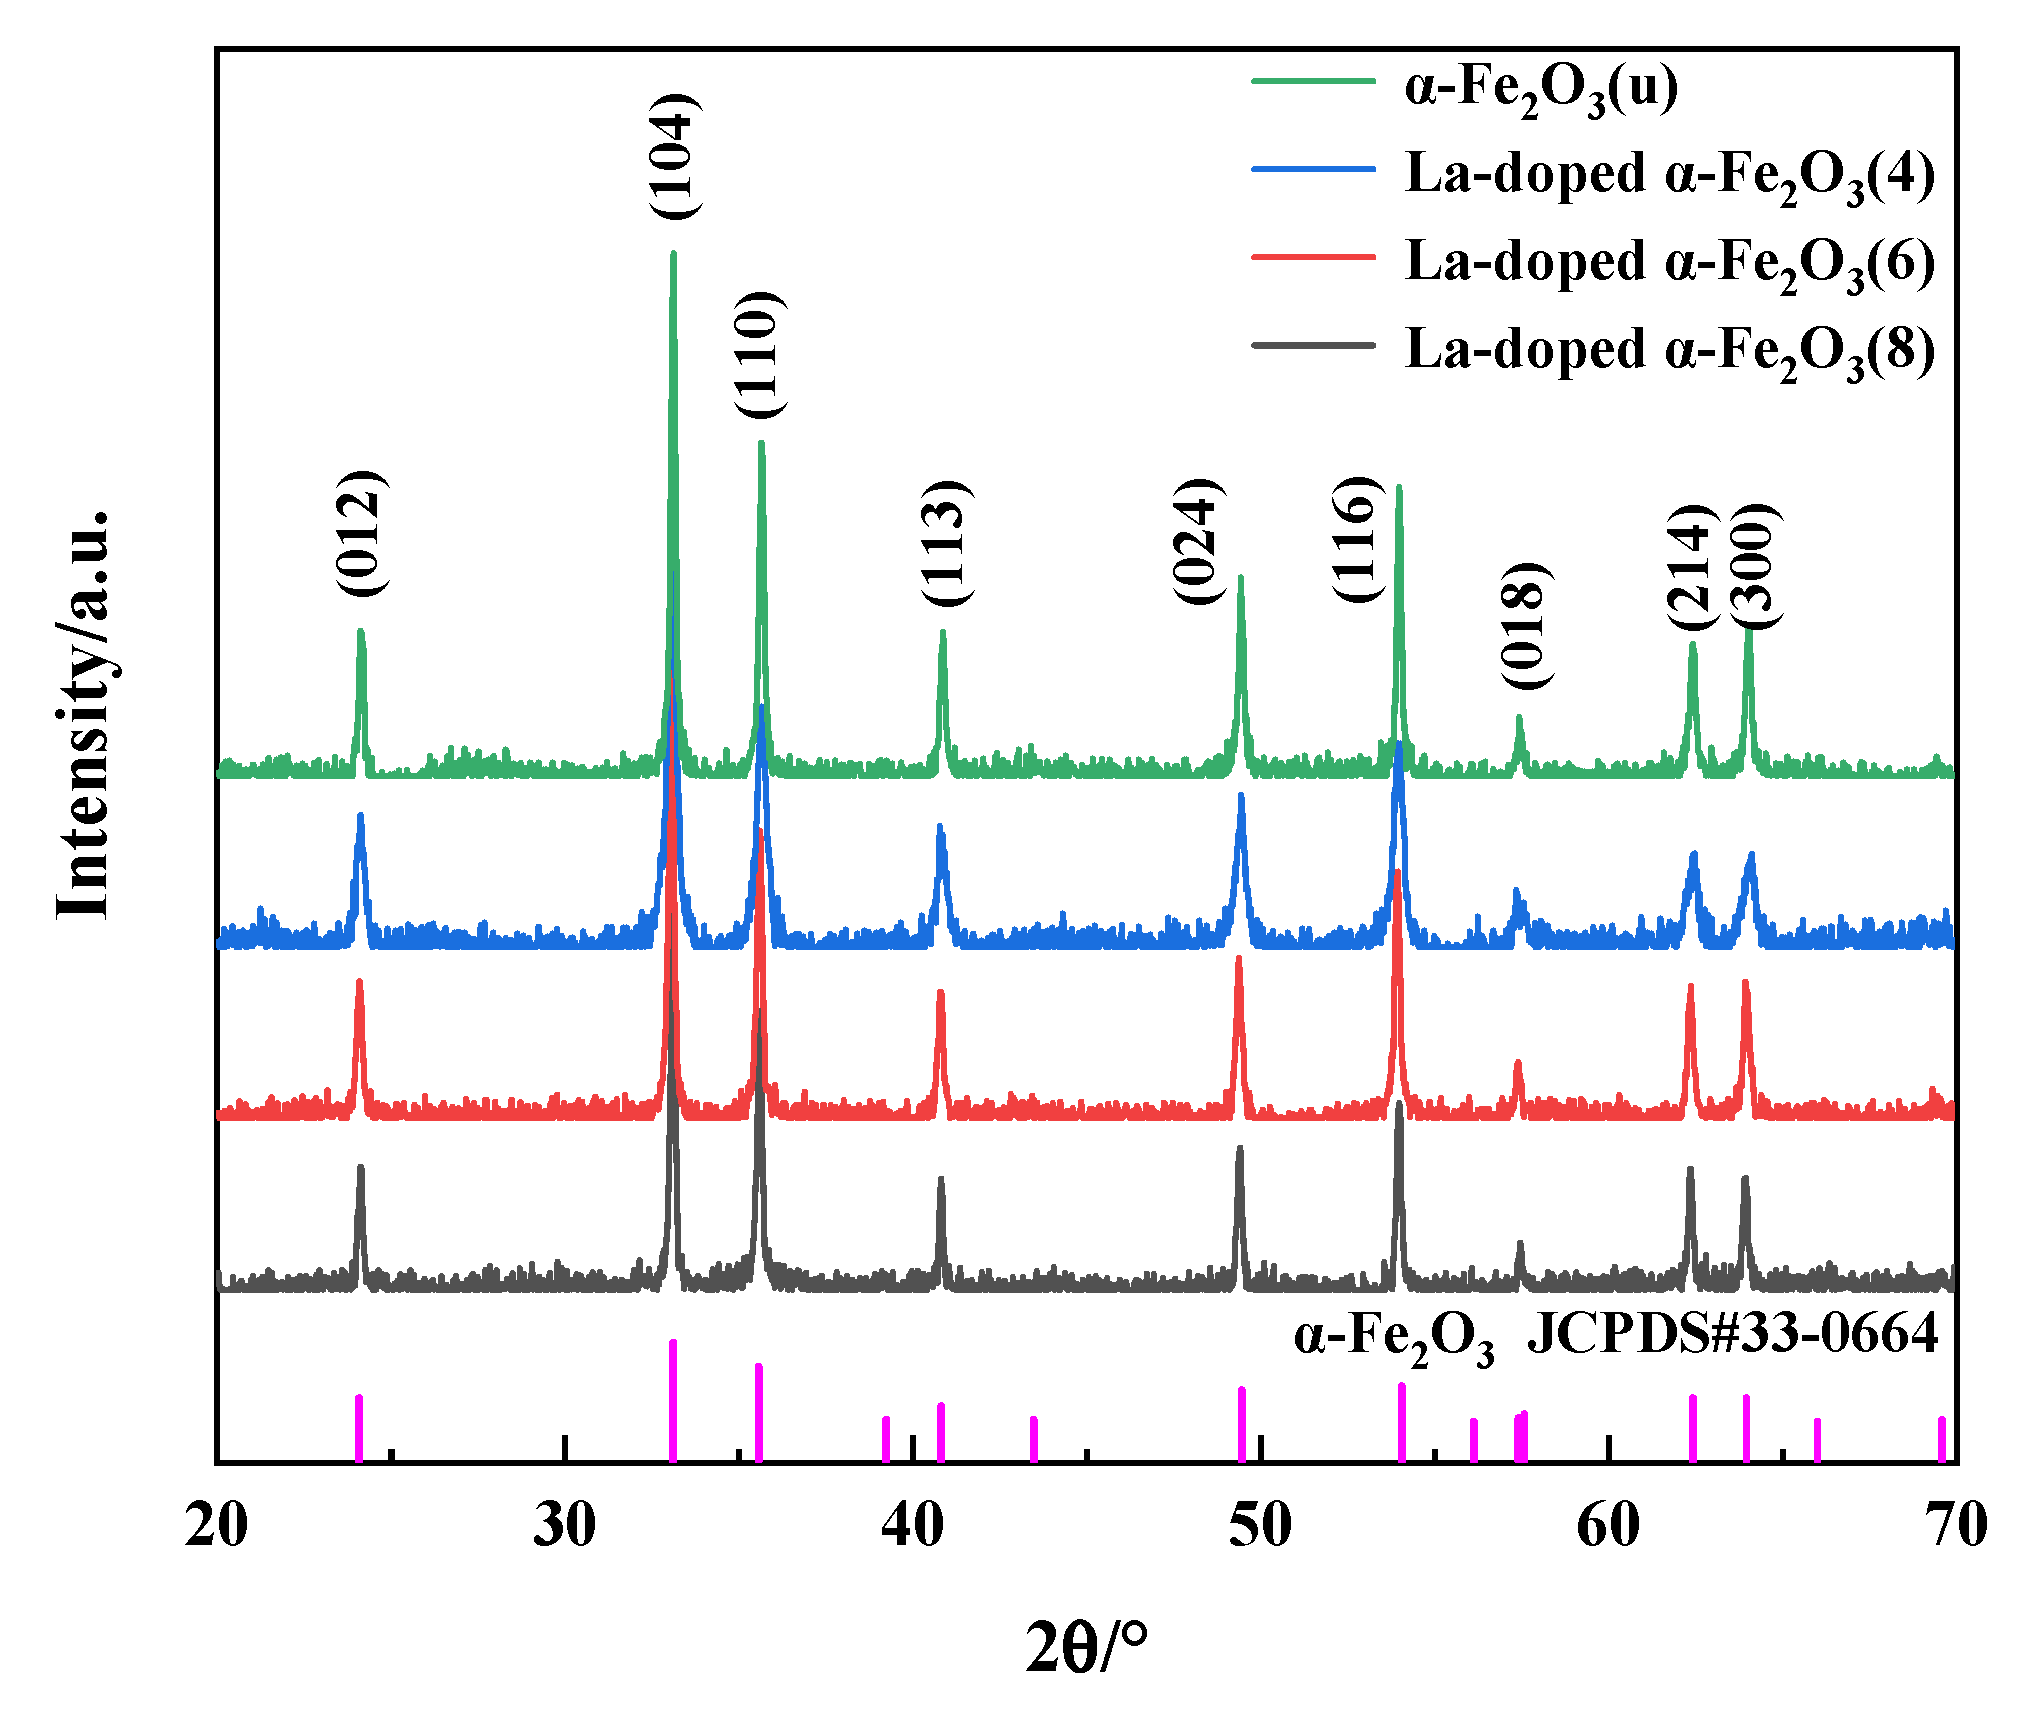
Figure 1 shows the XRD patterns of α-Fe2O3(u) and La-doped α-Fe2O3(x) (x = 4, 6, 8). Only α-Fe2O3 (JCPDS33-0664) is detected in all samples. The diffraction peaks attributed to LaOx are not observed. For La-doped α-Fe2O3(4), La-doped α-Fe2O3(6), and La-doped α-Fe2O3(8), the diffraction peaks at 2q = 33.152° are shifted 0.024°, 0.044°, and 0.003° lower relative to JCPDS33-0664, respectively. In addition, the diffraction peaks of La-doped α-Fe2O3(4) are widened. These results illustrate that the large La3+ (radius = 0.106 nm) [32] is doped into the α-Fe2O3 lattice (Fe3+ radius = 0.064 nm) [33].
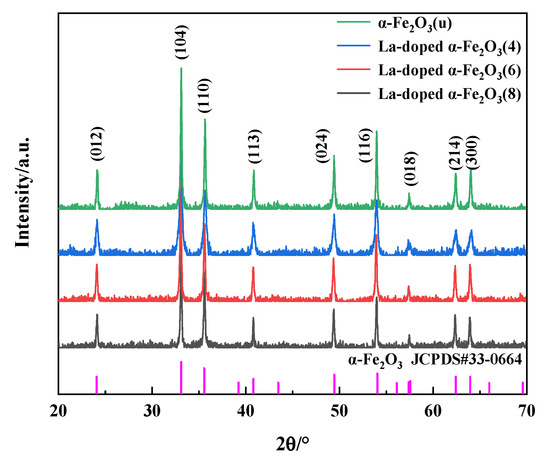
Figure 1.
XRD patterns of α-Fe2O3(u) and La-doped α-Fe2O3(x) (x = 4, 6, 8).
The average crystal size and the lattice constant of α-Fe2O3(u) and La-doped α-Fe2O3(x) (x = 4, 6, 8) are calculated by the Scherrer formula, as presented in Table 2. Obviously, with La doping at different pH values, the crystal size of α-Fe2O3 decreases and the lattice constant increases, of which La-doped α-Fe2O3(6) has the largest lattice constant and the largest lattice distortion.
Table 2.
Average crystal size and lattice constant of nanoparticles.
3.1.2. TEM, SAED, and TEM-EDS
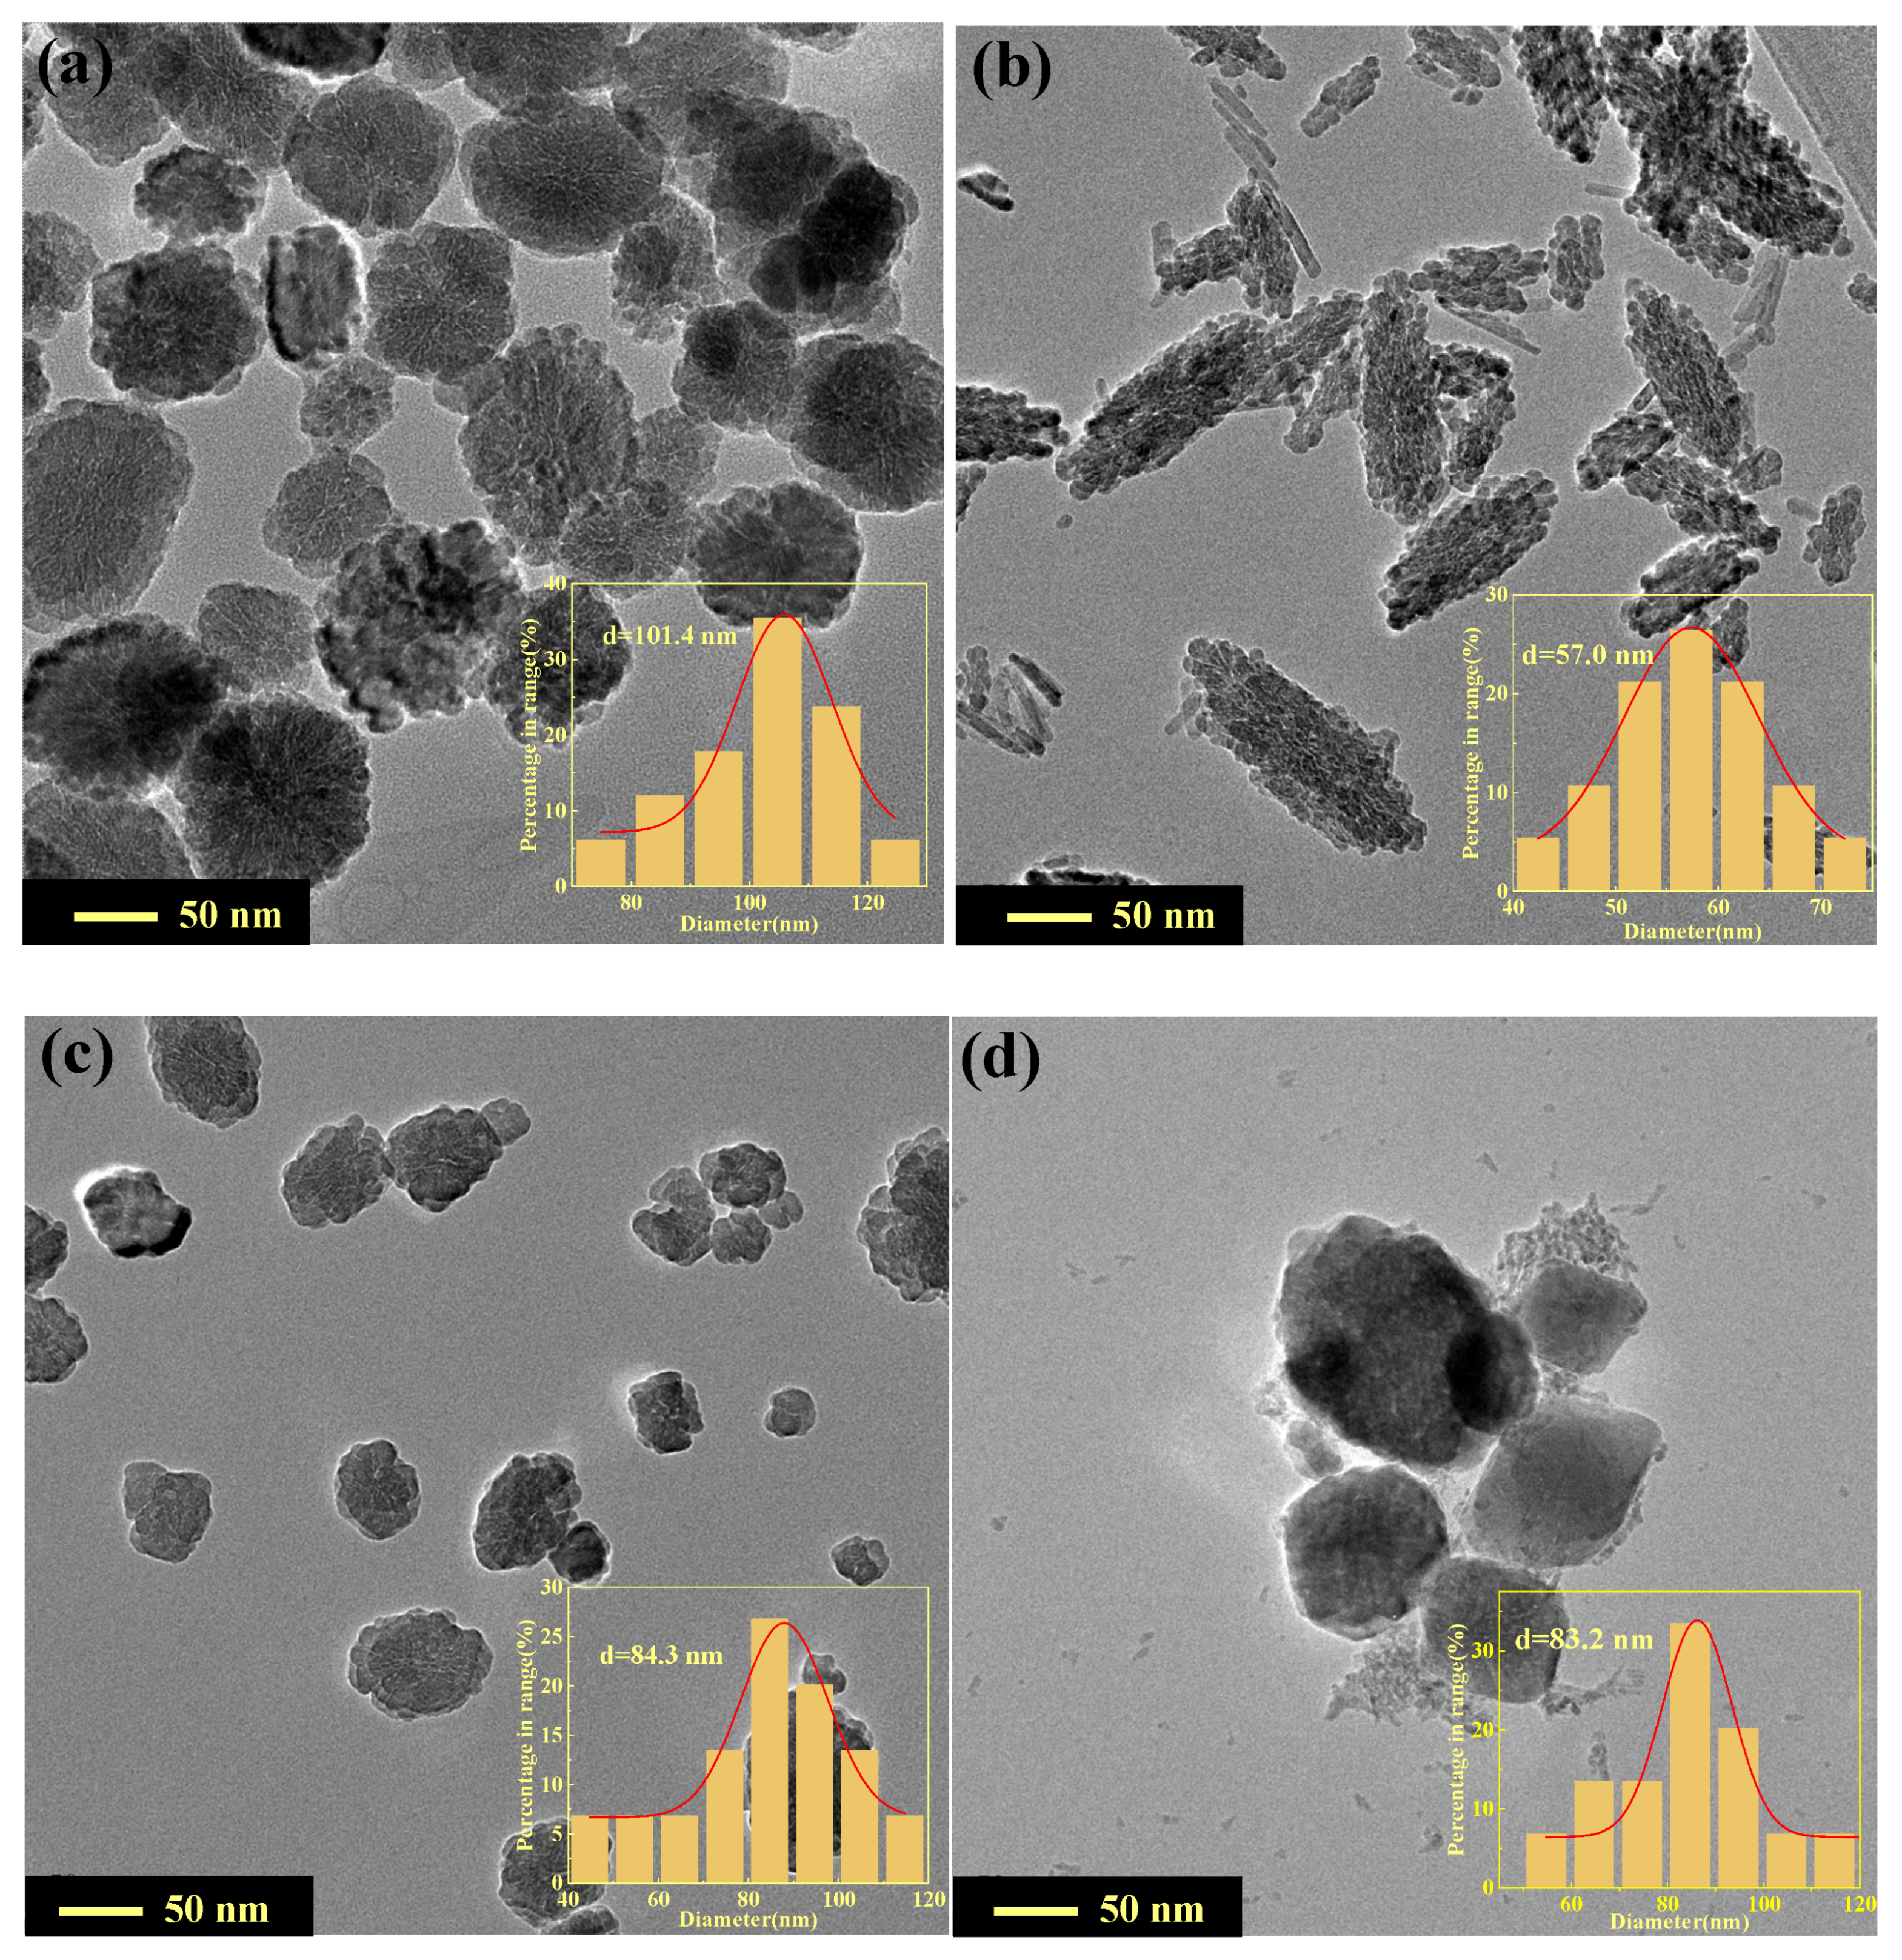
Figure 2 shows the TEM images of α-Fe2O3(u) and La-doped α-Fe2O3(x) (x = 4, 6, 8). The α-Fe2O3(u) shows irregular nanospheres with weak agglomeration and an average particle size of 101.4 nm (Figure 2a). La-doped α-Fe2O3(4) shows irregular and weakly-agglomerated nanorods with a rough surface and an average particle length of 57.0 nm (Figure 2b). La-doped α-Fe2O3(6) shows irregular nanospheres with a smooth surface, which are 84.3 nm in diameter (Figure 2c). La-doped α-Fe2O3(8) shows agglomerated polygon morphology, which is not uniform, and the average size is 83.2 nm (Figure 2d). Clearly, with an increase in pH value, the average particle size first increases and then decreases, consistent with the change rule of the XRD results (Table 2). Compared to each other, La-doped α-Fe2O3(6) has the weakest agglomeration and better dispersion.
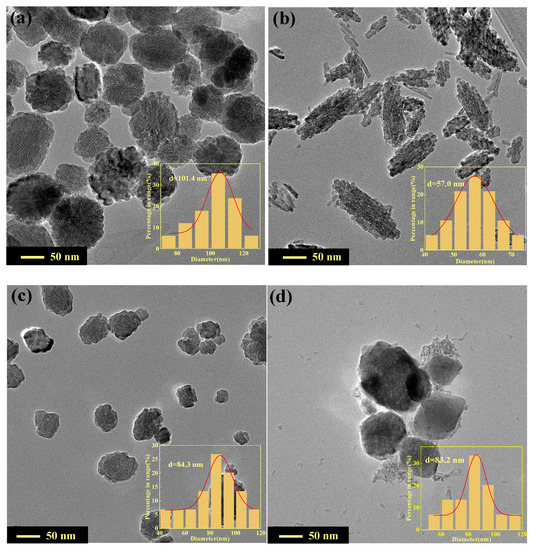
Figure 2.
TEM images of α-Fe2O3(u) and La-doped α-Fe2O3(x) (x = 4, 6, 8). a α-Fe2O3(u); (b) La-doped α-Fe2O3(4); (c) La-doped α-Fe2O3(6); (d) La-doped α-Fe2O3(8).
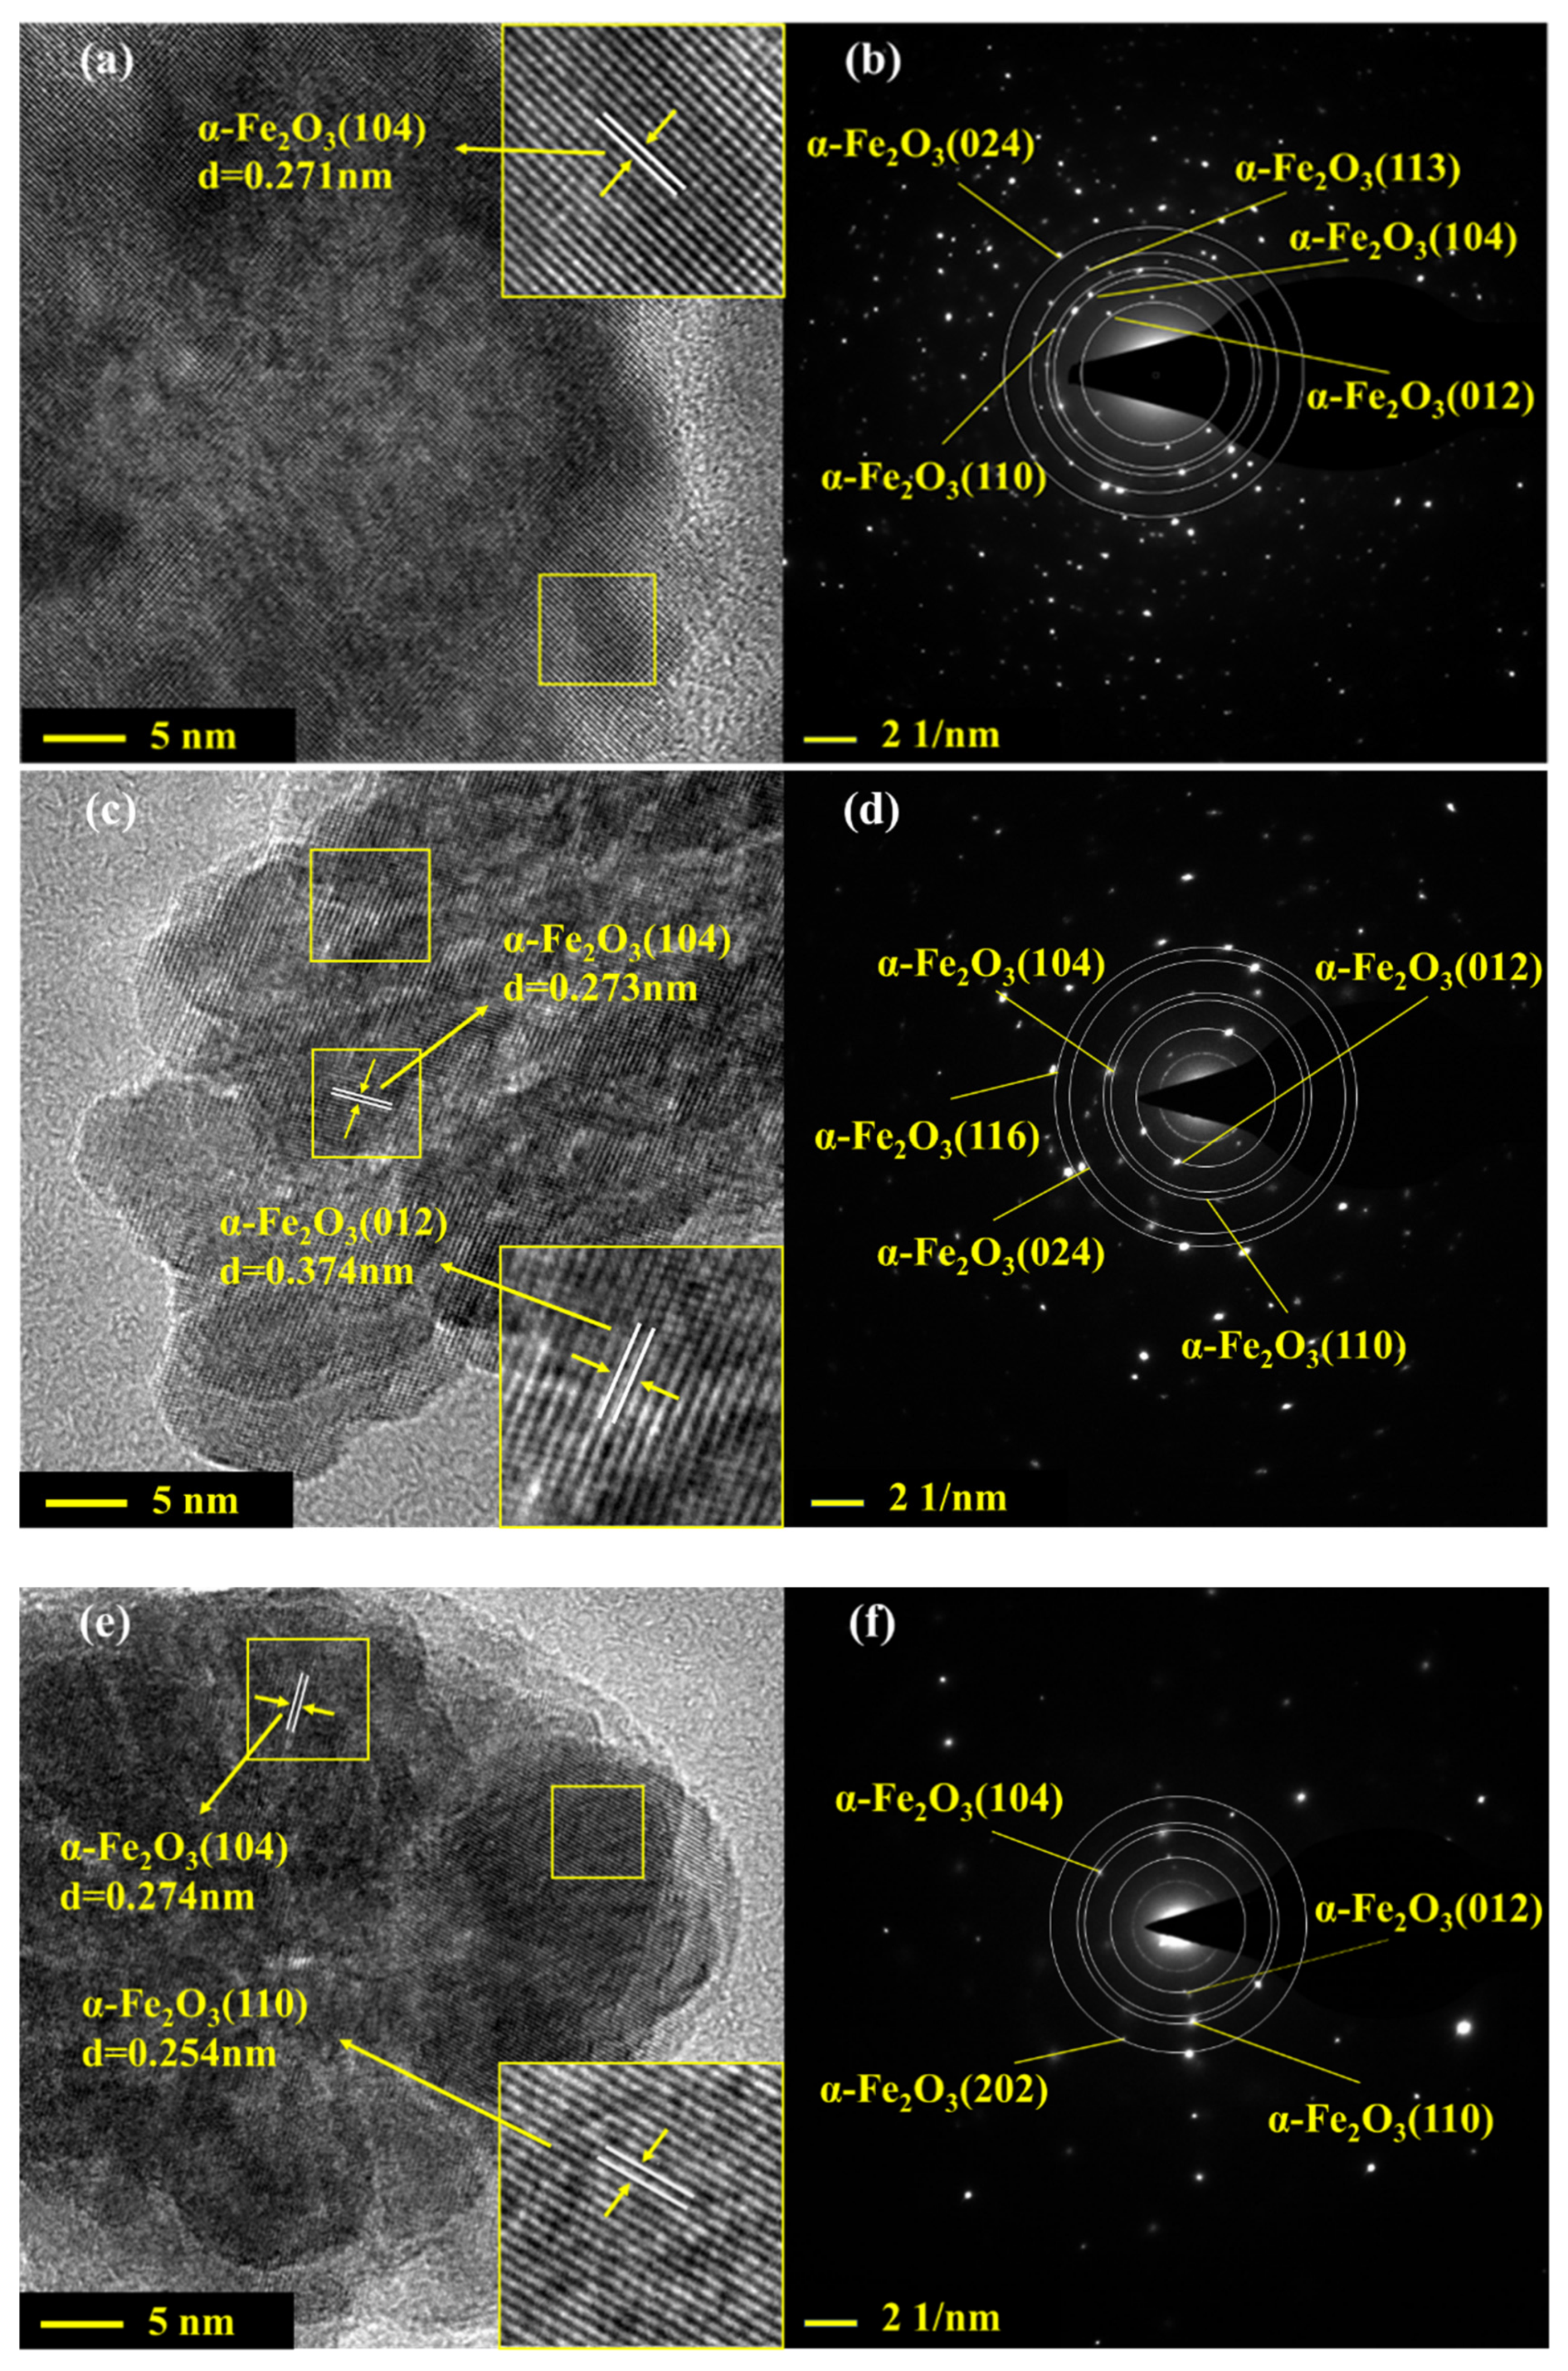
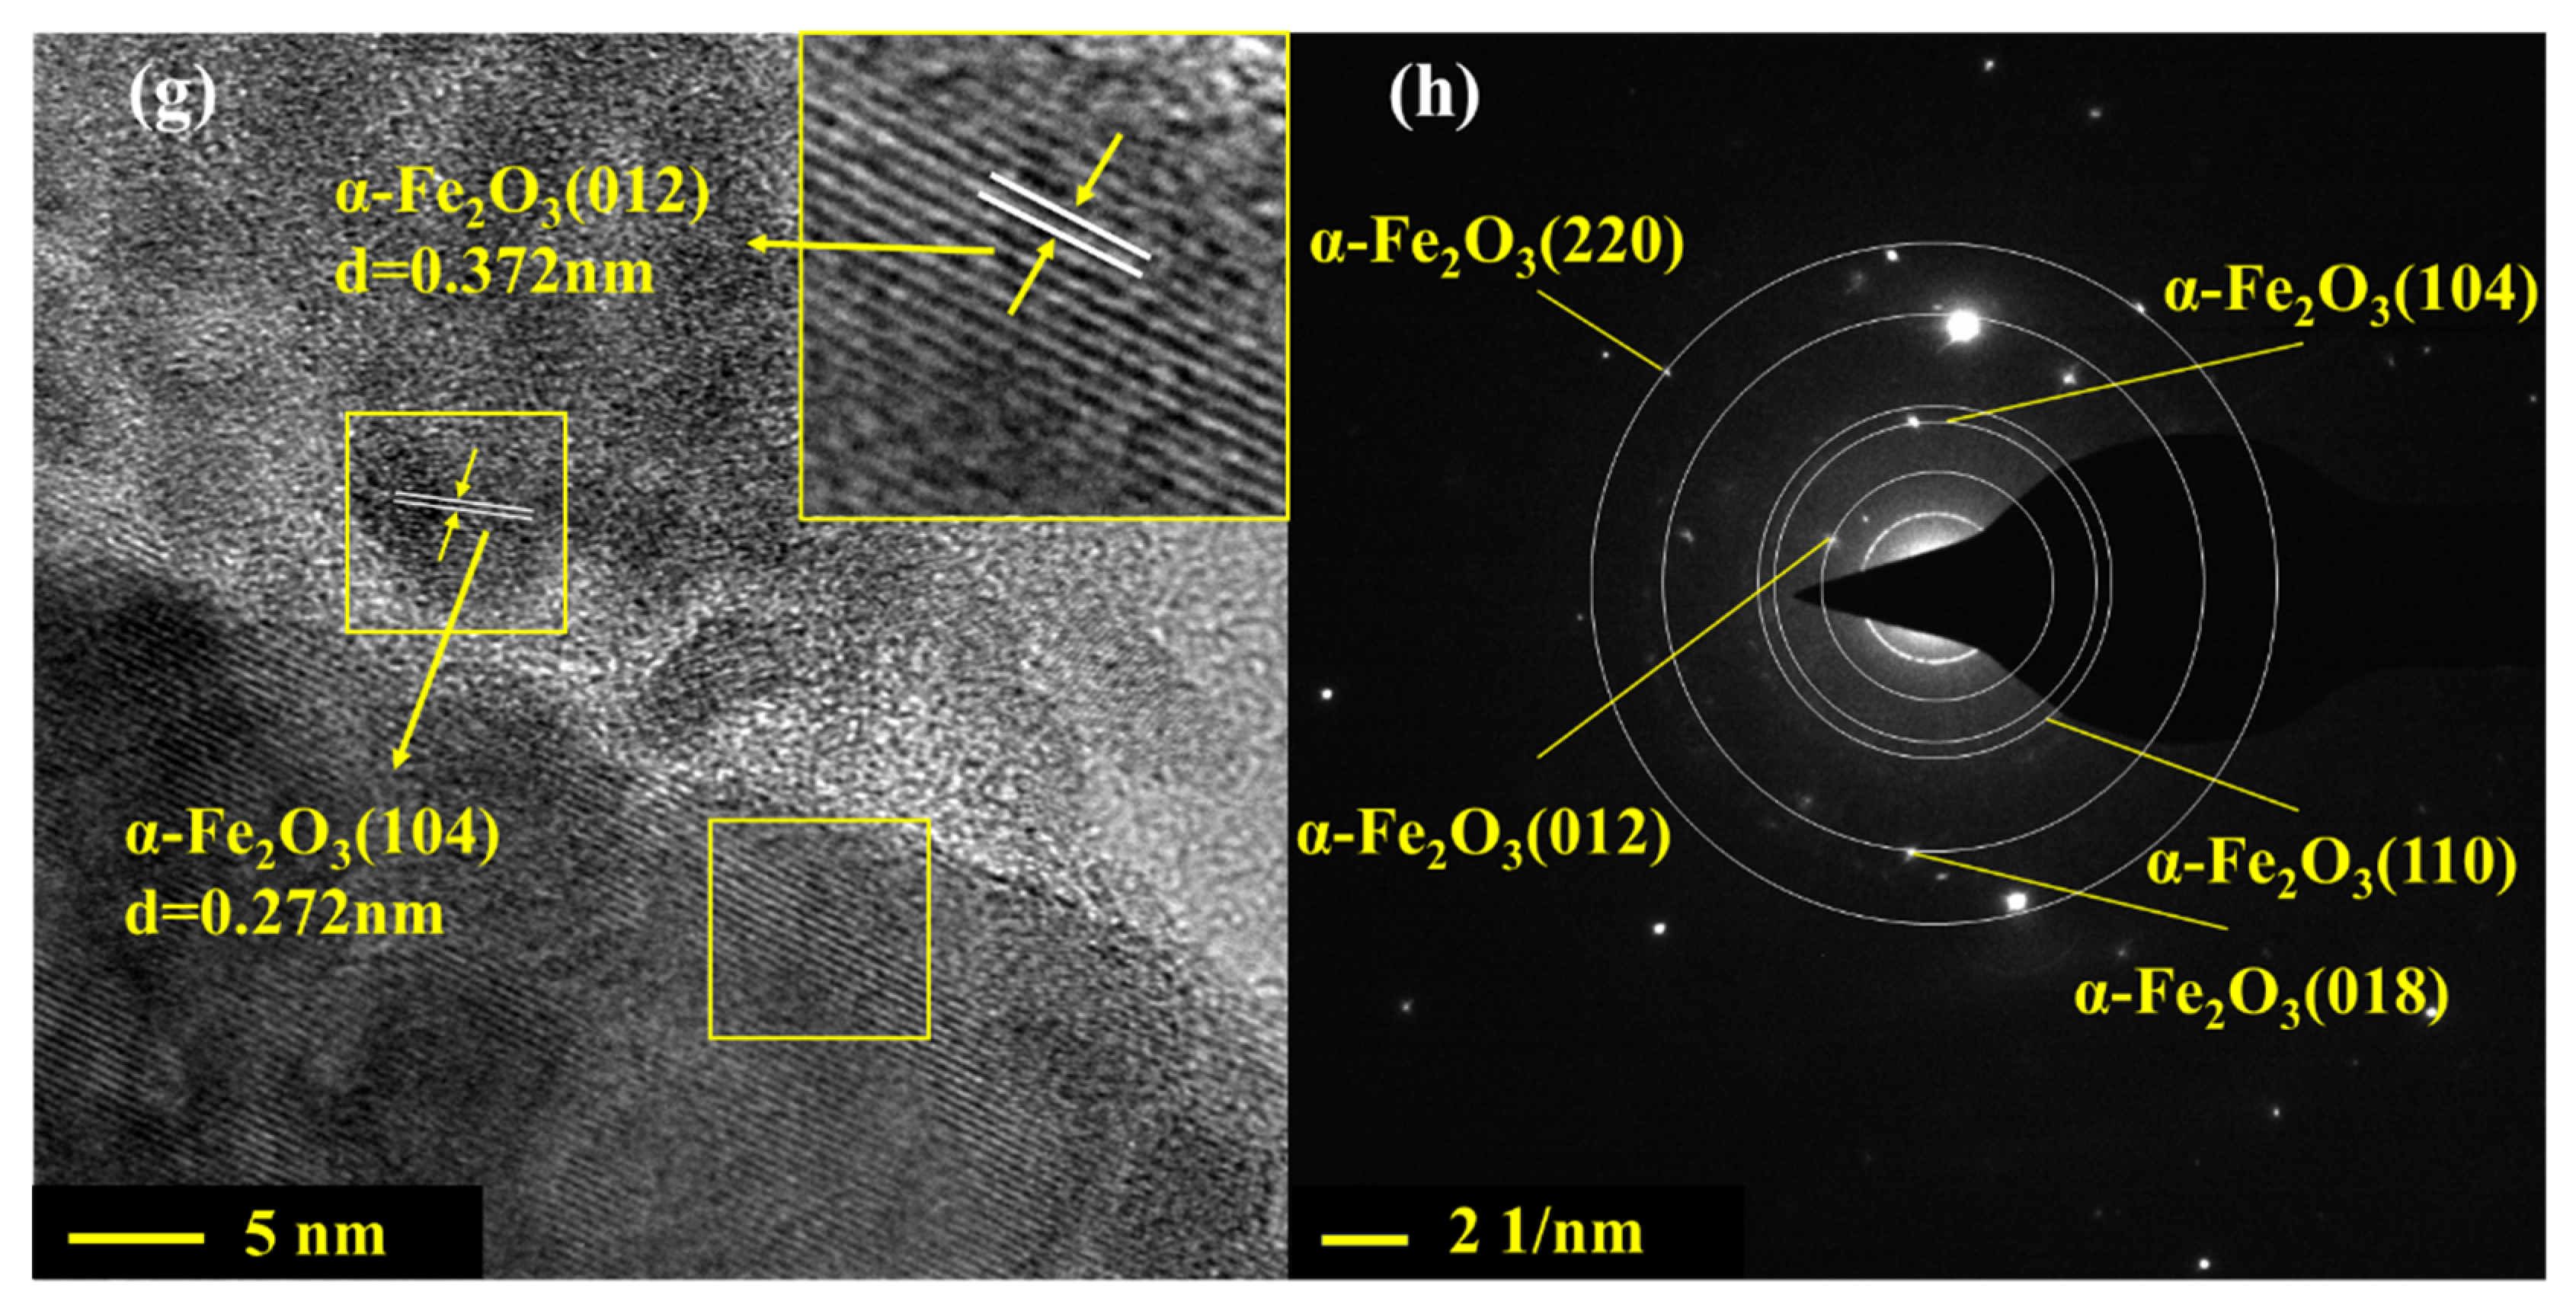
Figure 3 shows the high-resolution TEM images and selected area electron diffraction patterns of α-Fe2O3(u) and La-doped α-Fe2O3(x) (x = 4, 6, 8). For α-Fe2O3(u), the d-spacing value of 0.271 nm is assigned to the (104) crystal plane of α-Fe2O3 (Figure 3a). For La-doped α-Fe2O3(4), the d-spacing values of 0.374 nm and 0.273 nm are assigned to the (012) and (104) crystal plane of the α-Fe2O3, which are 0.006 nm and 0.003 nm larger than JCPDS33–0664, respectively (Figure 3c). For La-doped α-Fe2O3(6), the d-spacing values of 0.254 nm and 0.275 nm are assigned to the (012) and (104) crystal plane of the α-Fe2O3, which are 0.002 nm and 0.005 nm larger than JCPDS33–0664, respectively (Figure 3e). For La-doped α-Fe2O3(8), the d-spacing values of 0.372 nm and 0.272 nm are assigned to the (012) and (104) crystal plane of the α-Fe2O3, which are 0.004 nm and 0.002 nm larger than JCPDS33–0664, respectively (Figure 3g). These results further prove that the La element is doped into the α-Fe2O3 lattice, resulting in the α-Fe2O3 lattice expansion. In addition, compared with La-doped α-Fe2O3(x)(x = 4, 8), the increase in (104) crystal plane spacing is more obvious in La-doped α-Fe2O3(6), indicating La doped α-Fe2O3 (6) has the largest lattice distortion.
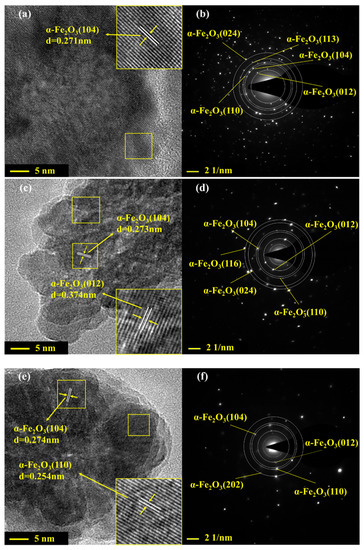
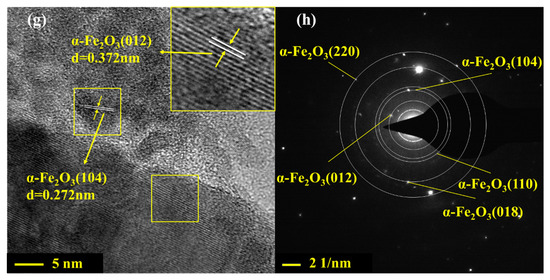
Figure 3.
HRTEM and SAED images of α-Fe2O3(u) and La-doped α-Fe2O3(x) (x = 4, 6, 8). (a,b) α-Fe2O3(u); (c,d) La-doped α-Fe2O3(4); (e,f) La-doped α-Fe2O3(6); (g,h) La-doped α-Fe2O3(8).
Moreover, as shown in Figure 3b,d,f,h, the α-Fe2O3(u) and La-doped α-Fe2O3(x) (x = 4,6,8) all have a polycrystalline structure, and the crystal planes of La2O3 are not observed, indicating that the La element is substituted in the α-Fe2O3 lattice.
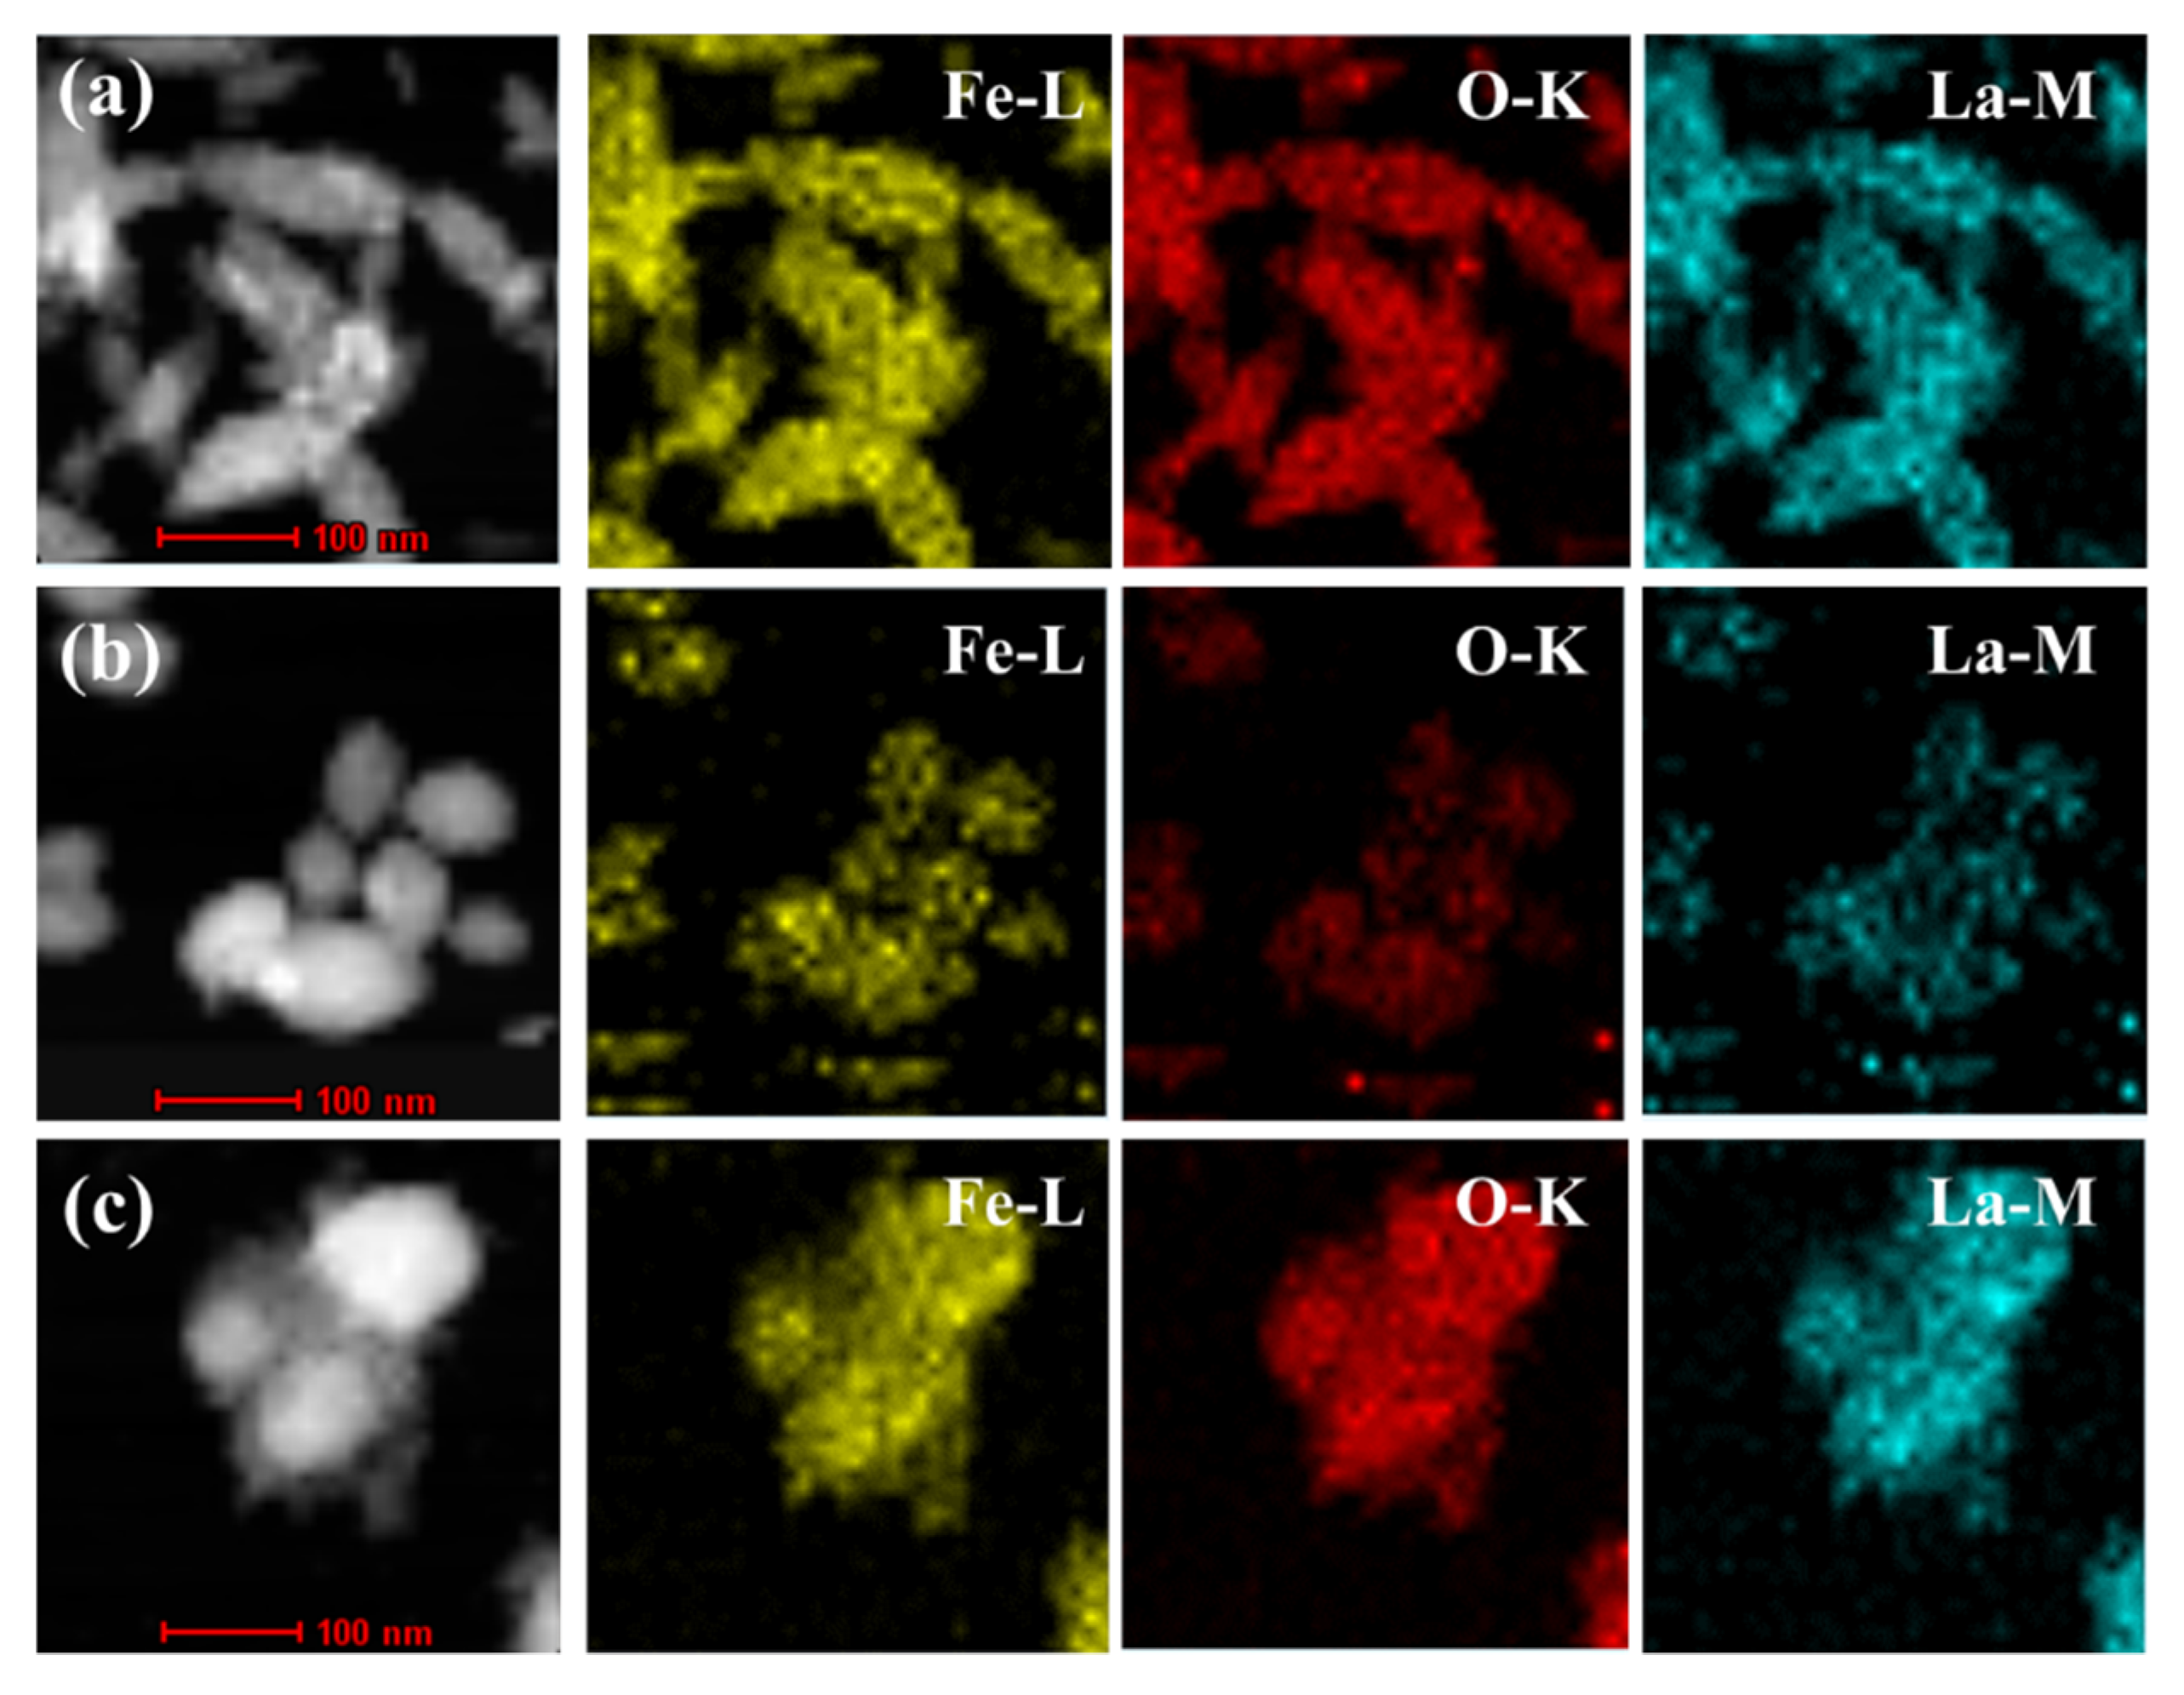
Figure 4a–c shows the EDS mapping images of La-doped α-Fe2O3(x) (x = 4, 6, 8). Fe, O, and La elements appear in the same area, ascribed to the formation of a La-Fe-O solid solution where La is uniformly doped in the α-Fe2O3 lattice.
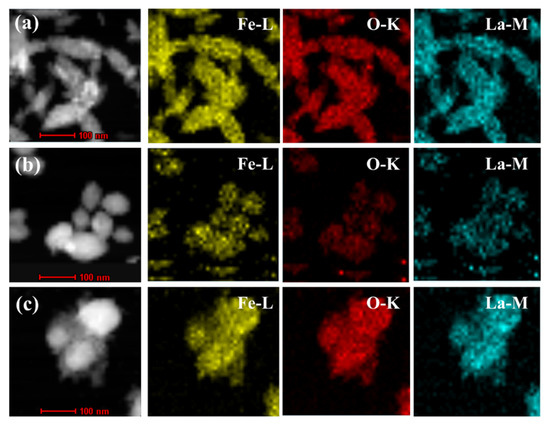
Figure 4.
TEM-EDS mapping images of La-doped α-Fe2O3(x) (x = 4, 6, 8). (a) La-doped α-Fe2O3(4); (b) La-doped α-Fe2O3(6); (c) La-doped α-Fe2O3(8).
3.1.3. Molecular Dynamics Simulation
Figure 5 shows the simulated crystal lattice of α-Fe2O3(u) and La-doped α-Fe2O3. Table 3 shows the simulated lattice constants, Fe-O bond length, and energy in α-Fe2O3(u) and La-doped α-Fe2O3. When the La element is doped in the α-Fe2O3 lattice, the lattice constant is increased by 0.170 Å, the average Fe-O bond length is decreased by 0.044 Å, and the Fe-O bond energy is increased by 185.699 kcal/mol. A La atom replaces the steric Fe sites and bonds to O, reducing the Fe-O bond length and enlarging the Fe-O bond energy, which improves the crystal stability [14,34].
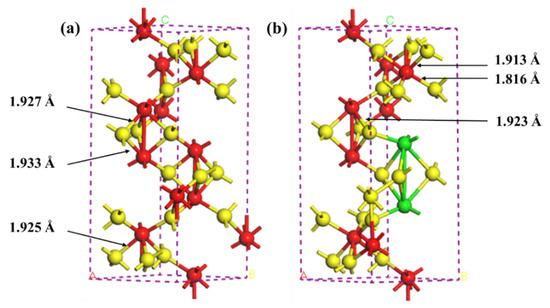
Figure 5.
Crystal lattice of α-Fe2O3(u) or La-doped α-Fe2O3 (Yellow ball is O; red ball is Fe; green ball is La). (a) α-Fe2O3(u); (b) La-doped α-Fe2O3.
Table 3.
Simulated lattice parameters.
3.1.4. FT-IR
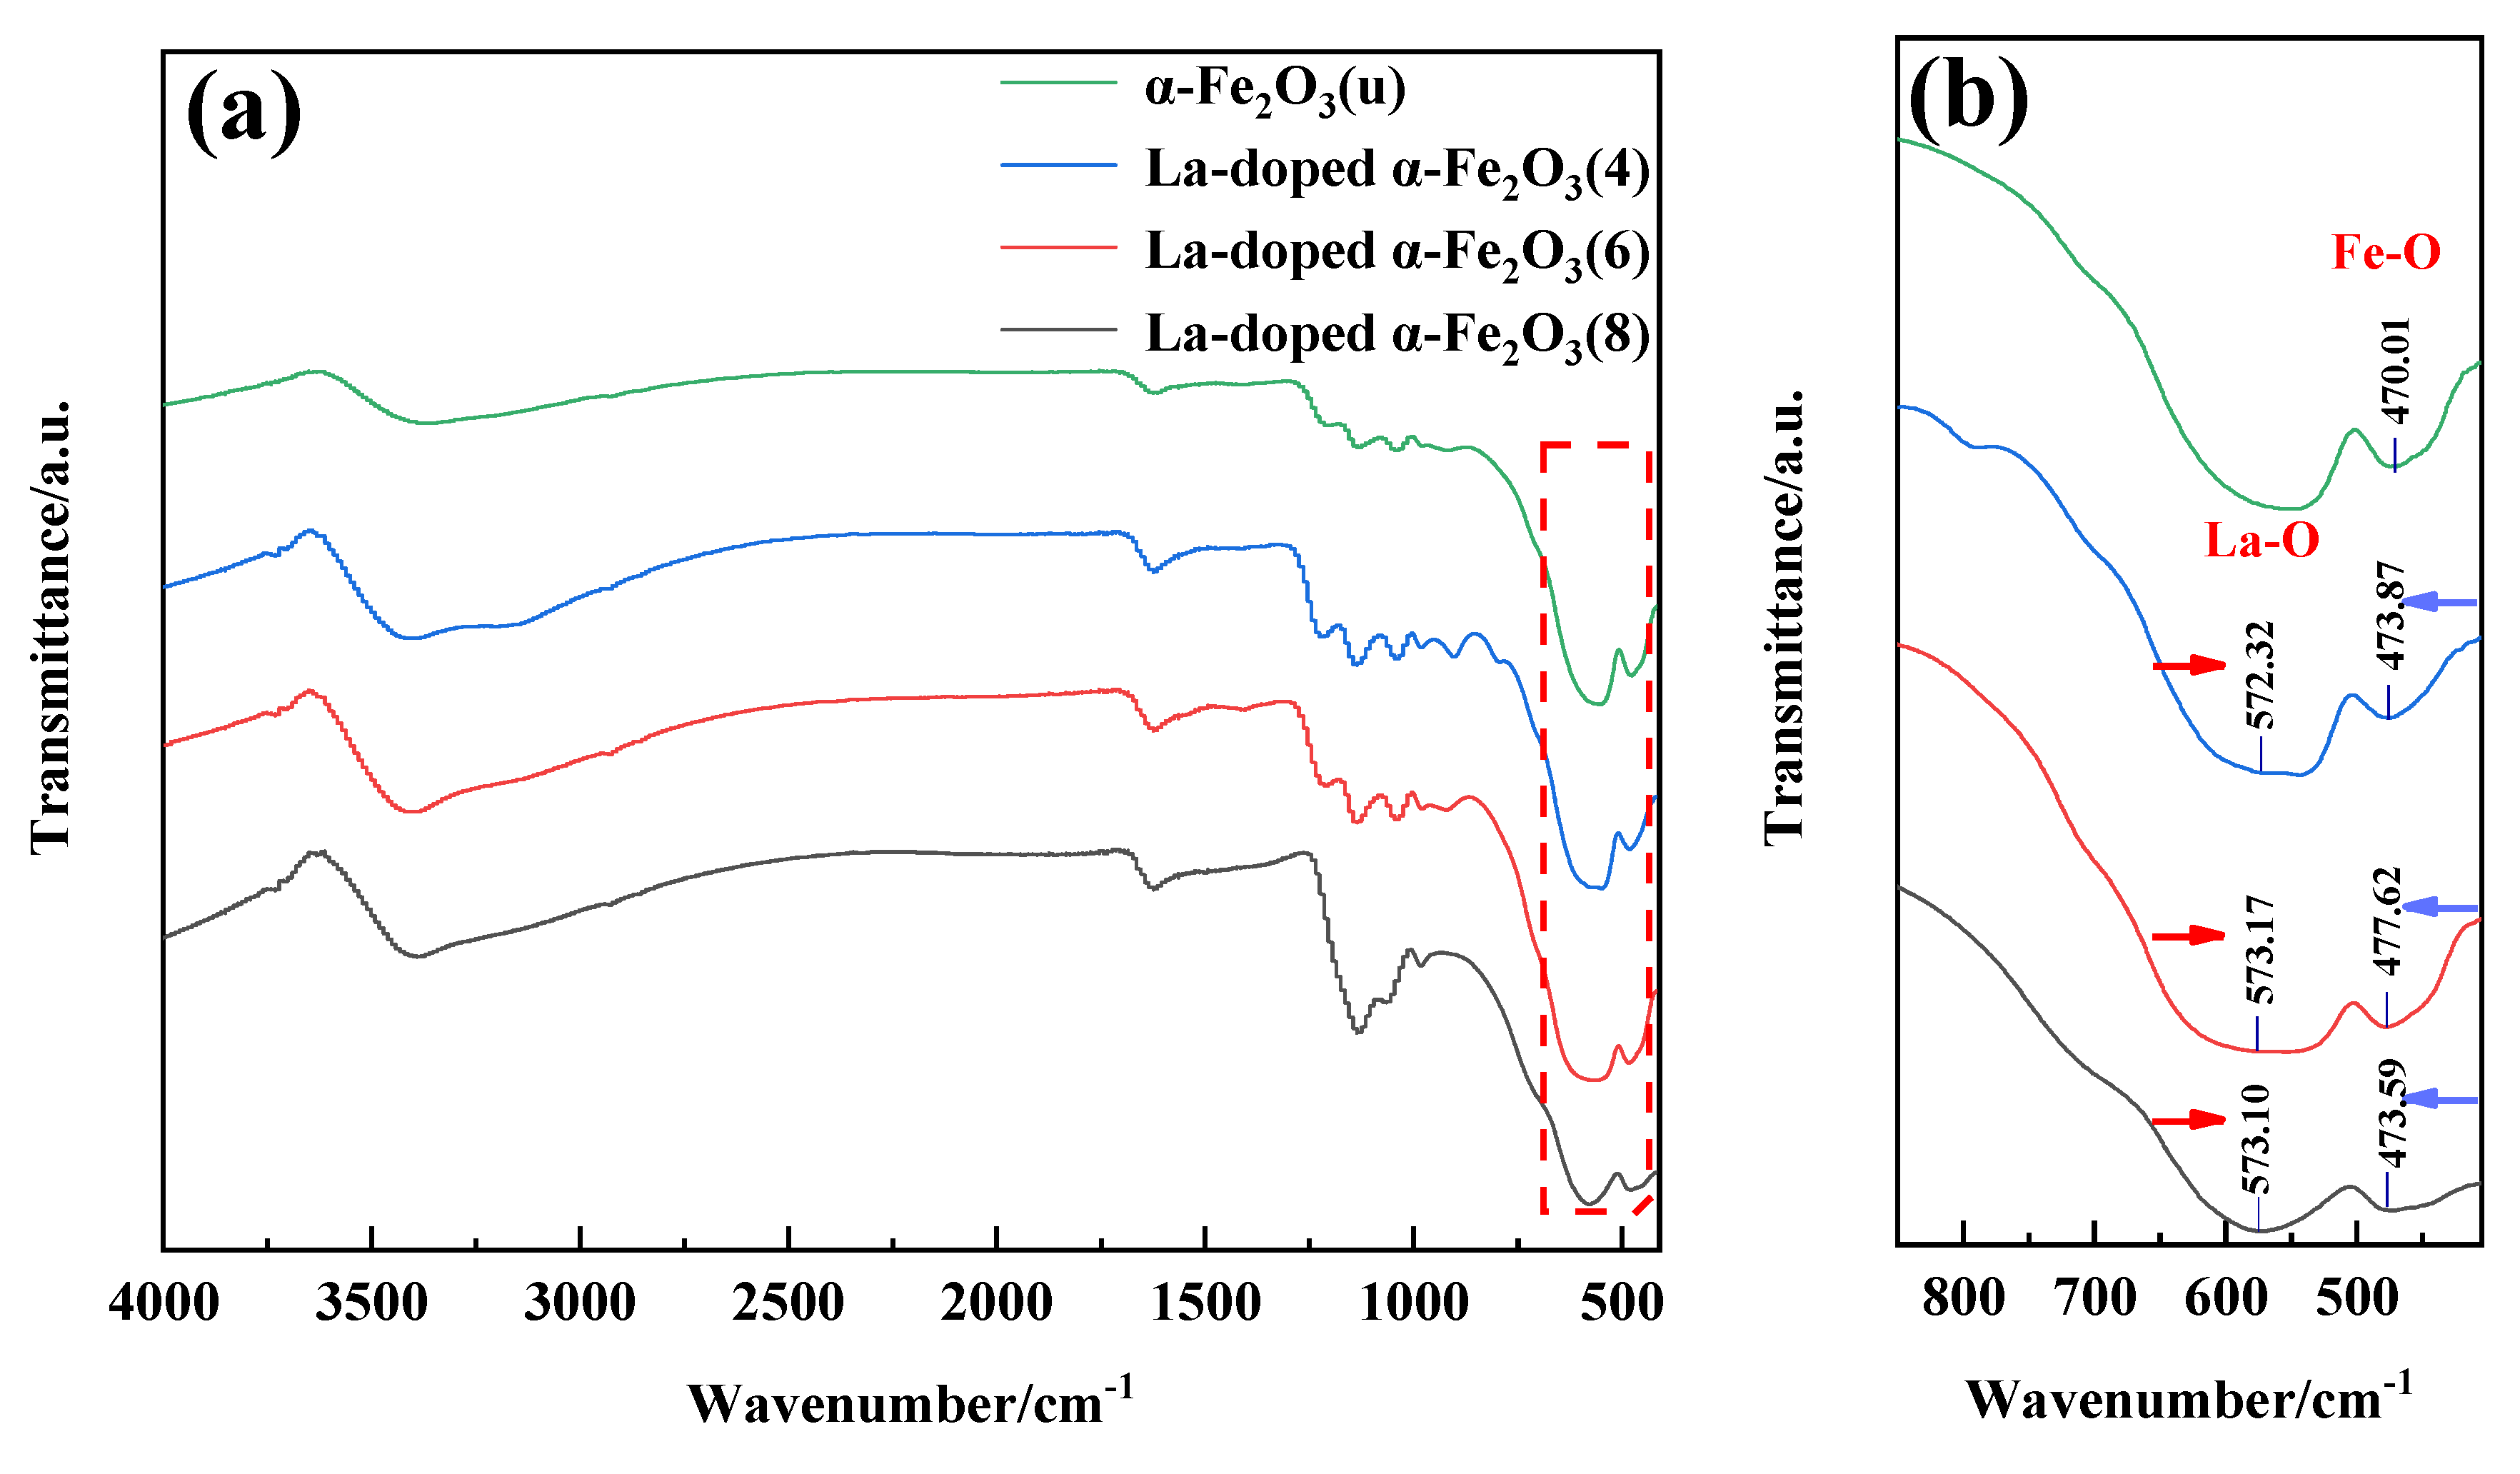
Figure 6 shows the FT-IR spectrum of α-Fe2O3(u) and La-doped α-Fe2O3(x) (x = 4, 6, 8). As presented in Figure 6a, the band at 3400 cm−1 is assigned to the stretching vibration of the hydroxyl group absorbed on the iron oxide surface [35]. Figure 6b shows the magnified view of the FTIR spectrum. As reported by Miah [36], the characteristic absorption peak of La2O3 appears at 574 cm−1. For La-doped α-Fe2O3(x) (x = 4, 6, 8), the bands at ~574 cm−1 have a redshift of 1.68 cm−1, 0.83 cm−1, and 0.90 cm−1, respectively. As reported by Wu [37], the characteristic absorption peak of Fe2O3 is around 464 cm−1. For α-Fe2O3(u), the curve shows only the Fe–O stretching vibration band at 470.01 cm−1. For La-doped α-Fe2O3(x) (x = 4, 6, 8), the bands at 470.01 cm−1 have a blueshift of 3.86 cm−1, 7.61 cm−1, and 3.58 cm−1, respectively. The lattice distortion caused by the La doping leads to a decrease in Fe–O bond length, i.e., an increase in the force constant. Therefore, the absorption peak of the Fe-O bond shifts to a higher wavenumber [38,39]. In addition, the blueshift in the FT-IR spectra of La-doped α-Fe2O3(6) is more obvious, indicating that the Fe-O bond is more distorted as the degree of lattice distortion increases.
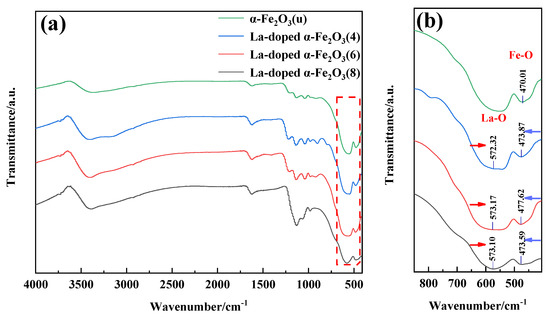
Figure 6.
FT-IR spectra of α-Fe2O3(u) and La-doped α-Fe2O3(x) (x = 4, 6, 8), (a) 410~4000 cm−1; (b) 410~750 cm−1.
3.2. Electrochemical Properties of La-Doped α-Fe2O3 Nanoparticles
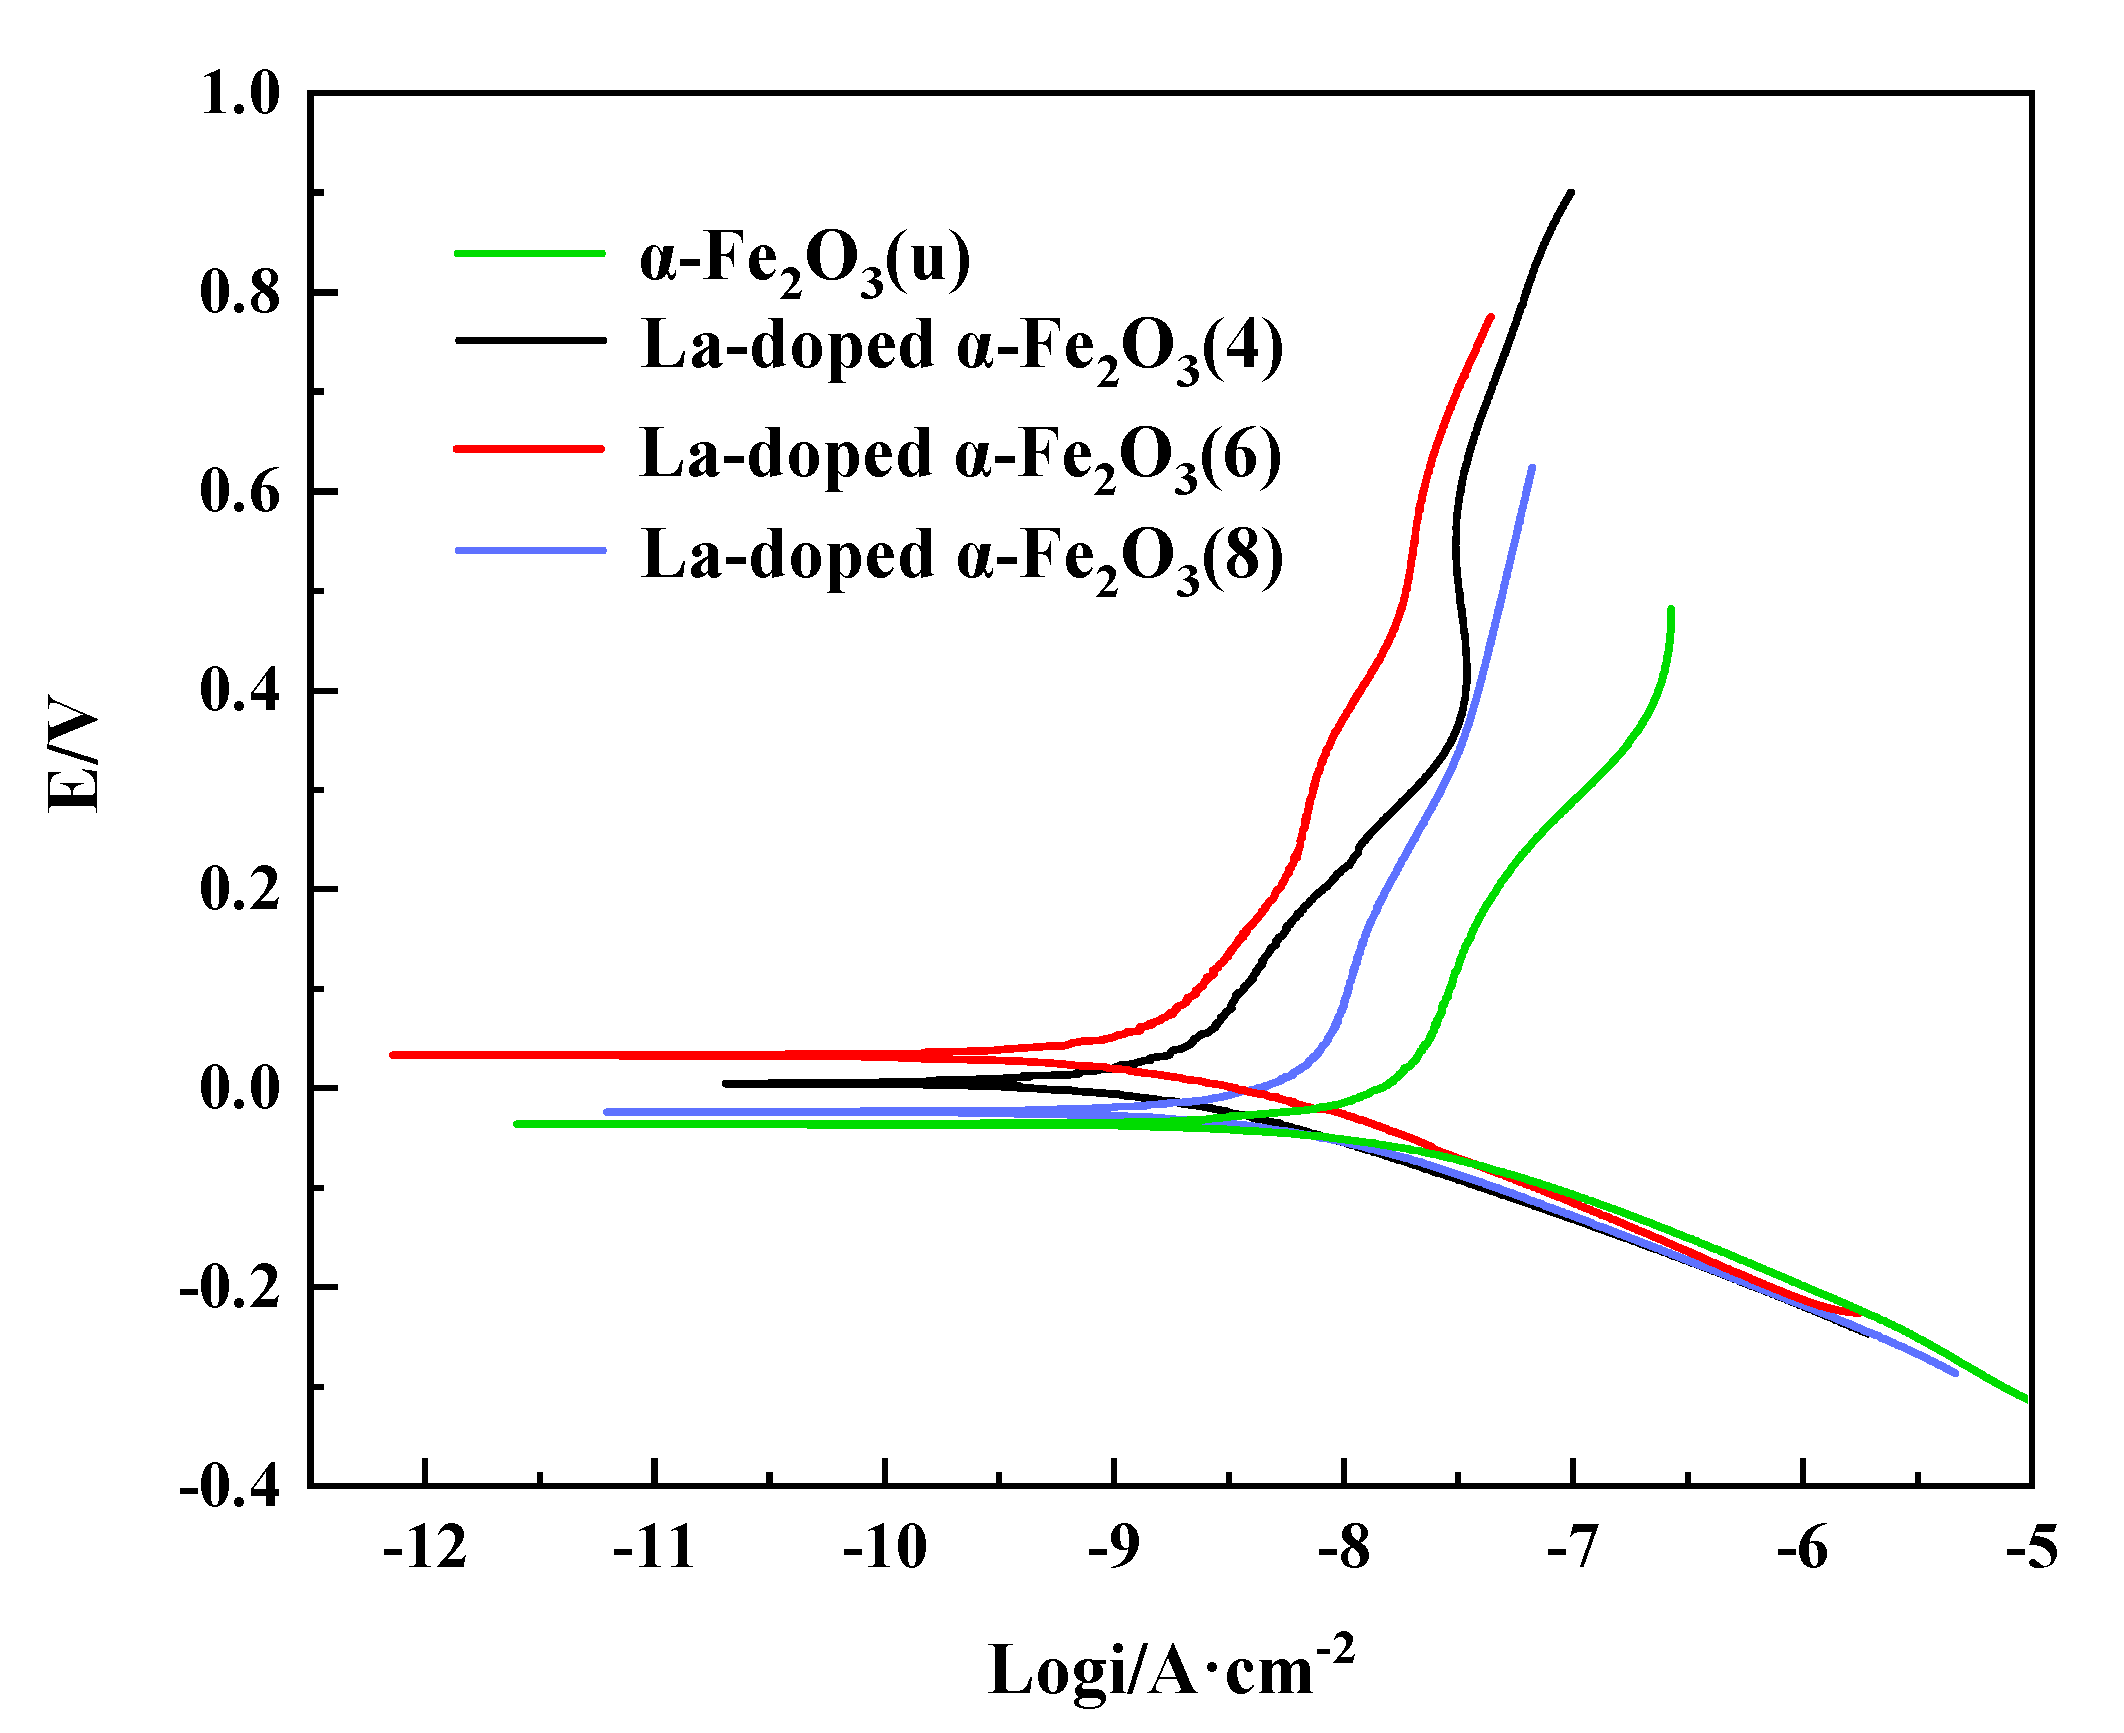
Figure 7 shows the potentiodynamic polarization curves of α-Fe2O3(u) and La-doped α-Fe2O3(x) (x = 4, 6, 8). Corrosion potentials (Ecorr) and corrosion currents density (Icorr) are applied to evaluate the corrosion resistance. The corrosion potentials of α-Fe2O3(u), La-doped α-Fe2O3(4), La-doped α-Fe2O3(6), and La-doped α-Fe2O3(8) are −41.10 mV, 2.45 mV, 28.52 mV, and −26.38 mV, respectively. The corrosion current densities of α-Fe2O3(u), La-doped α-Fe2O3(4), La-doped α-Fe2O3(6), and La-doped α-Fe2O3(8) are 0.013 μA/cm−2, 0.0024 μA/cm−2, 0.0013 μA/cm−2, and 0.0076 μA/cm−2, respectively. La-doped α-Fe2O3(6) has a relatively positive corrosion potential and a lower corrosion current density, indicating the higher corrosion resistance. The more difficult the bond destruction, the stronger the corrosion resistance [40]. Therefore, the higher Fe-O bond energy in La-doped α-Fe2O3(6) leads to its better corrosion resistance.
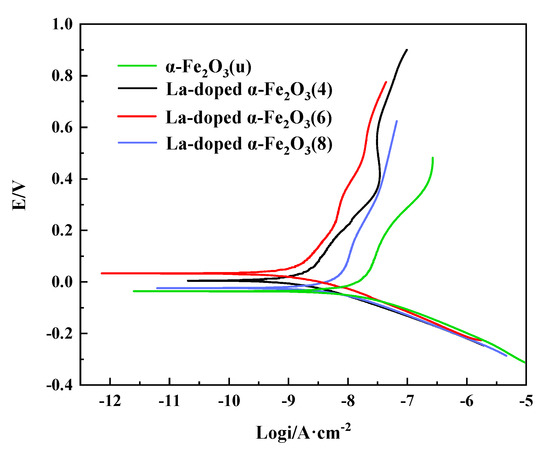
Figure 7.
Polarization curves of α-Fe2O3(u) and La-doped α-Fe2O3(x) (x = 4, 6, 8).
3.3. La-Doped α-Fe2O3 Modified Waterborne Coating
Figure 8 shows the potentiodynamic polarization curve of α-Fe2O3 and La-doped α-Fe2O3-modified waterborne coatings. The corrosion potentials of the coating(u), coating(4), coating(6), and coating(8) are −693.46 mV, −686.10 mV, −482.14 mV, and −706.65 mV, respectively. The corrosion current densities of the coating(u), coating(4), coating(6), and coating(8) are 0.28 μA/cm−2, 0.06 μA/cm−2, 0.028 μA/cm−2, and 1.26 μA/cm−2, respectively. Coating(6) has a relatively positive corrosion potential and a lower corrosion current density. Therefore, coating(6) has higher corrosion resistance.
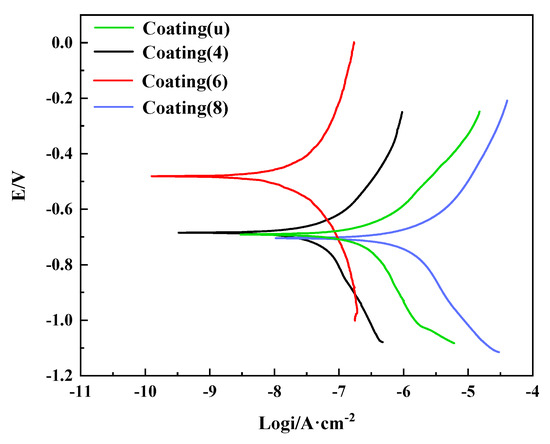
Figure 8.
Potentiodynamic polarization curve of coating(u) and coating(x) (x = 4, 6, 8).
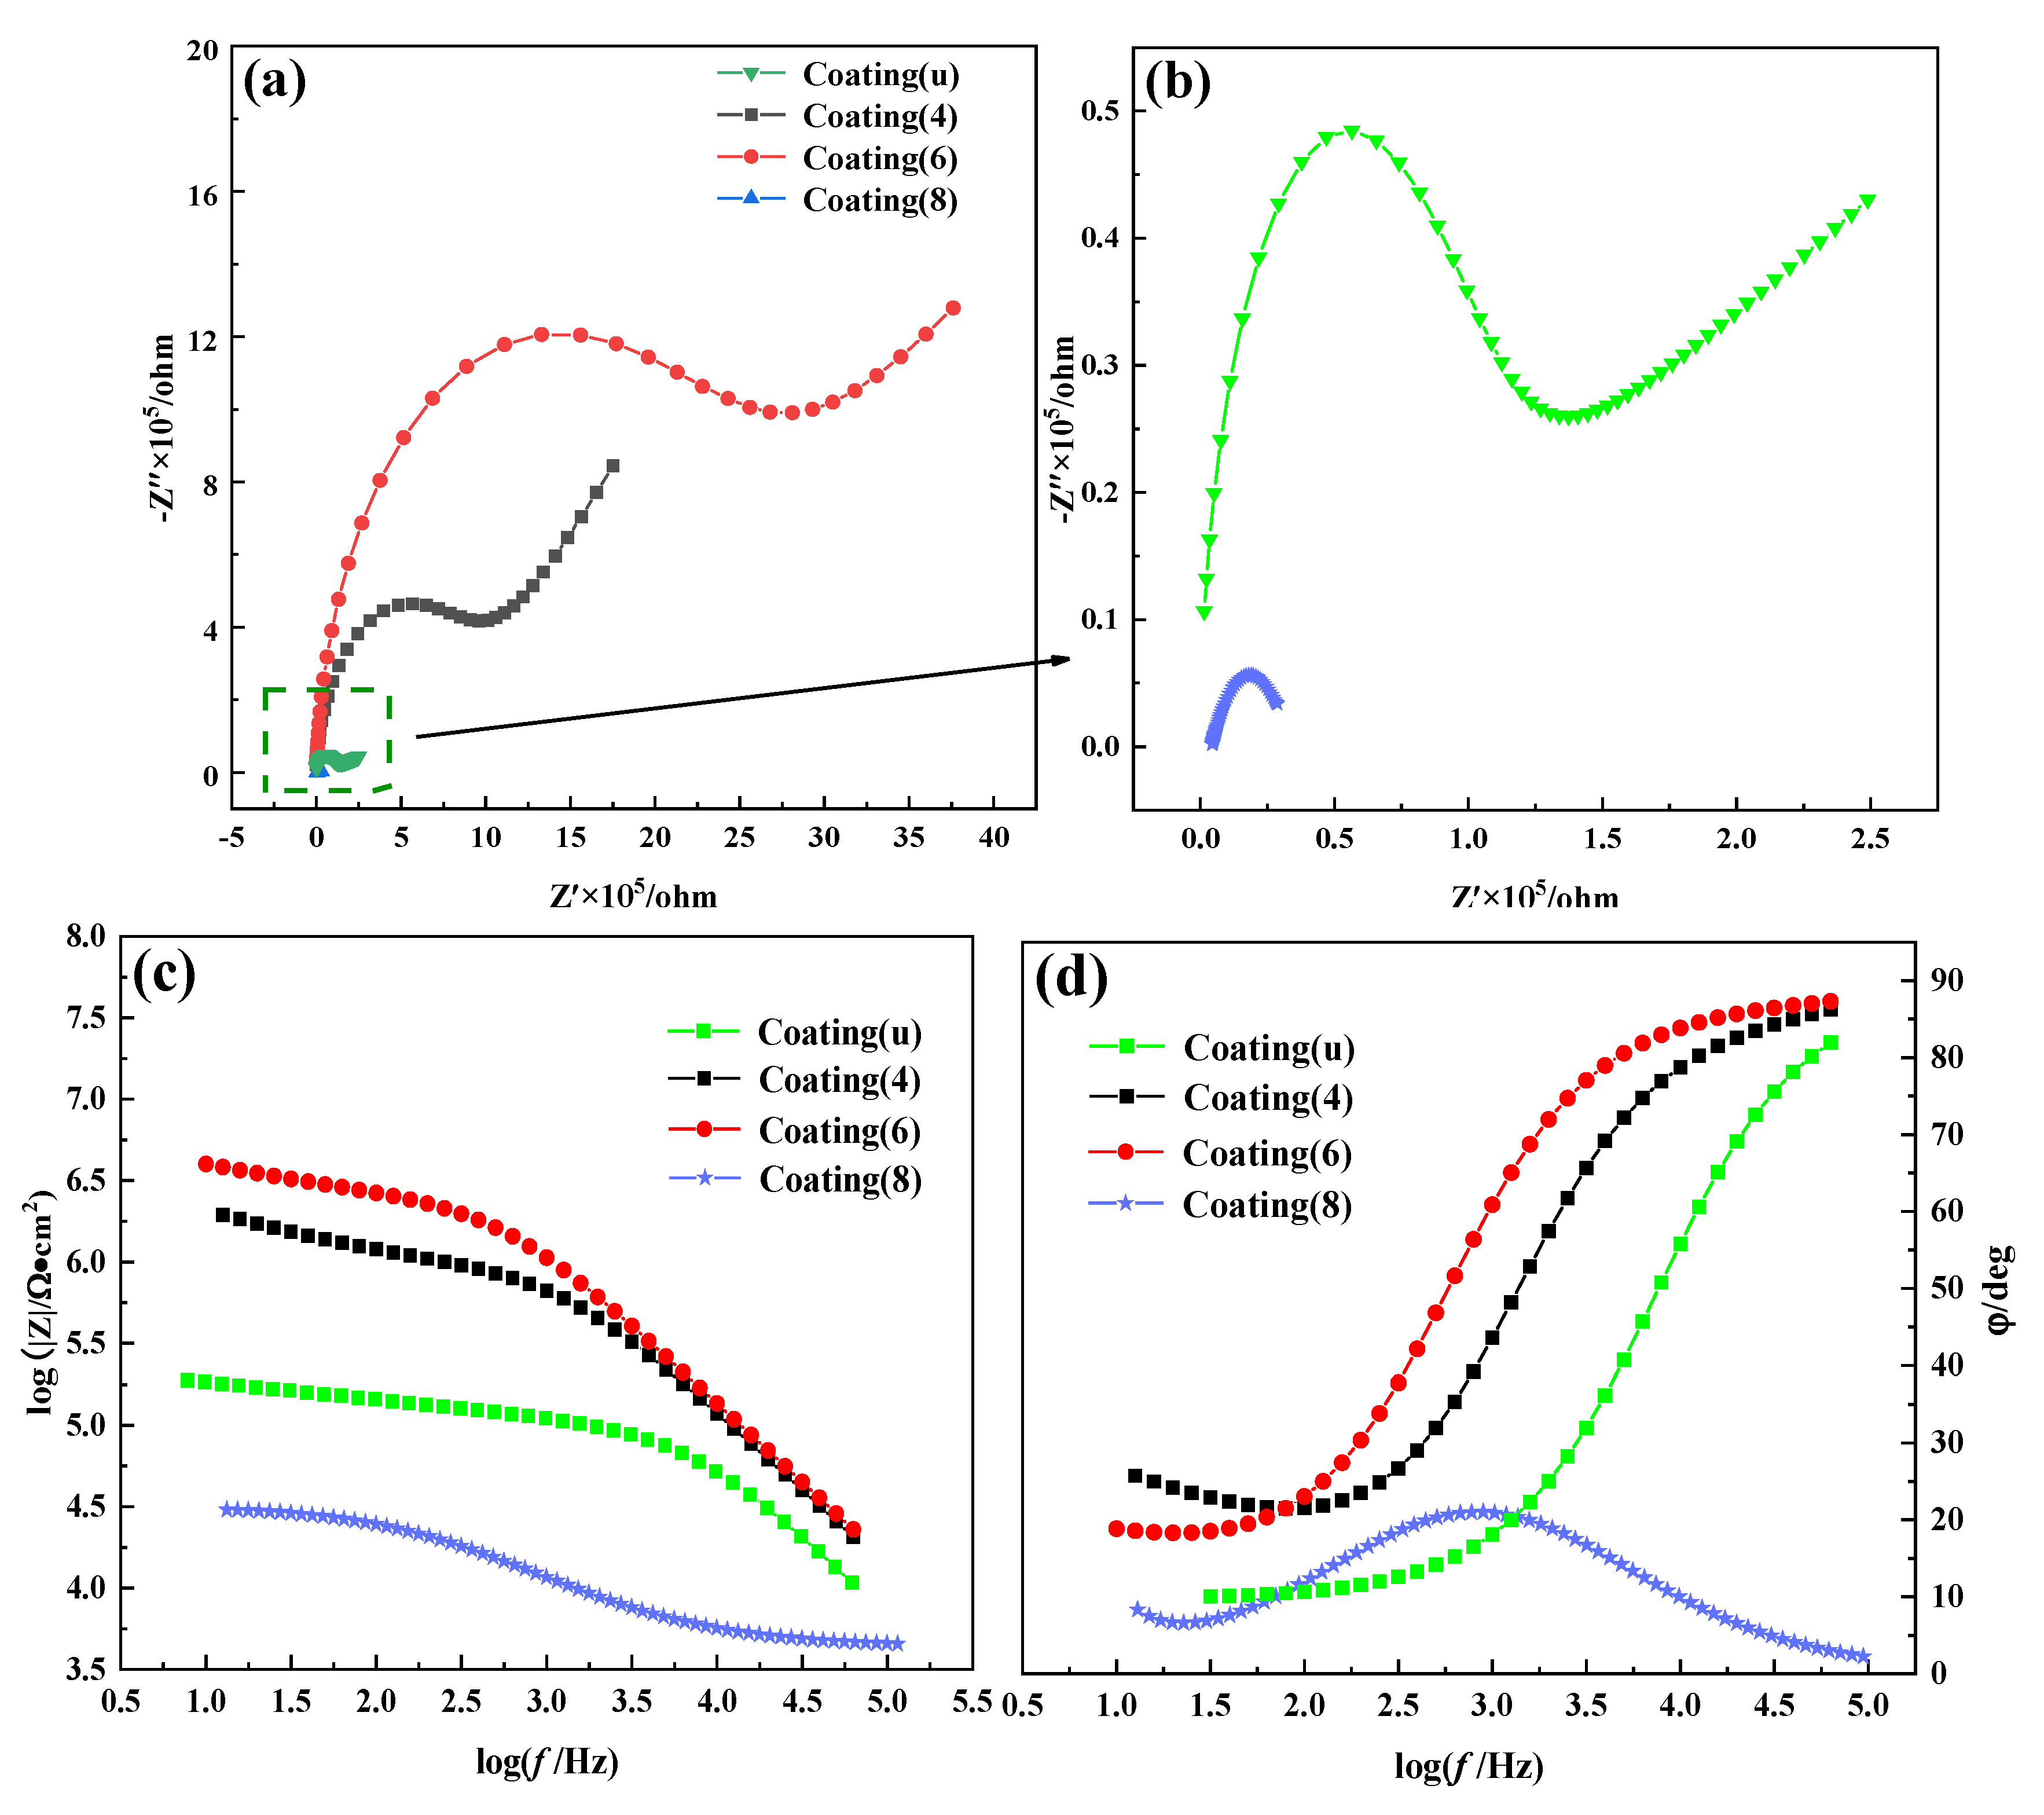
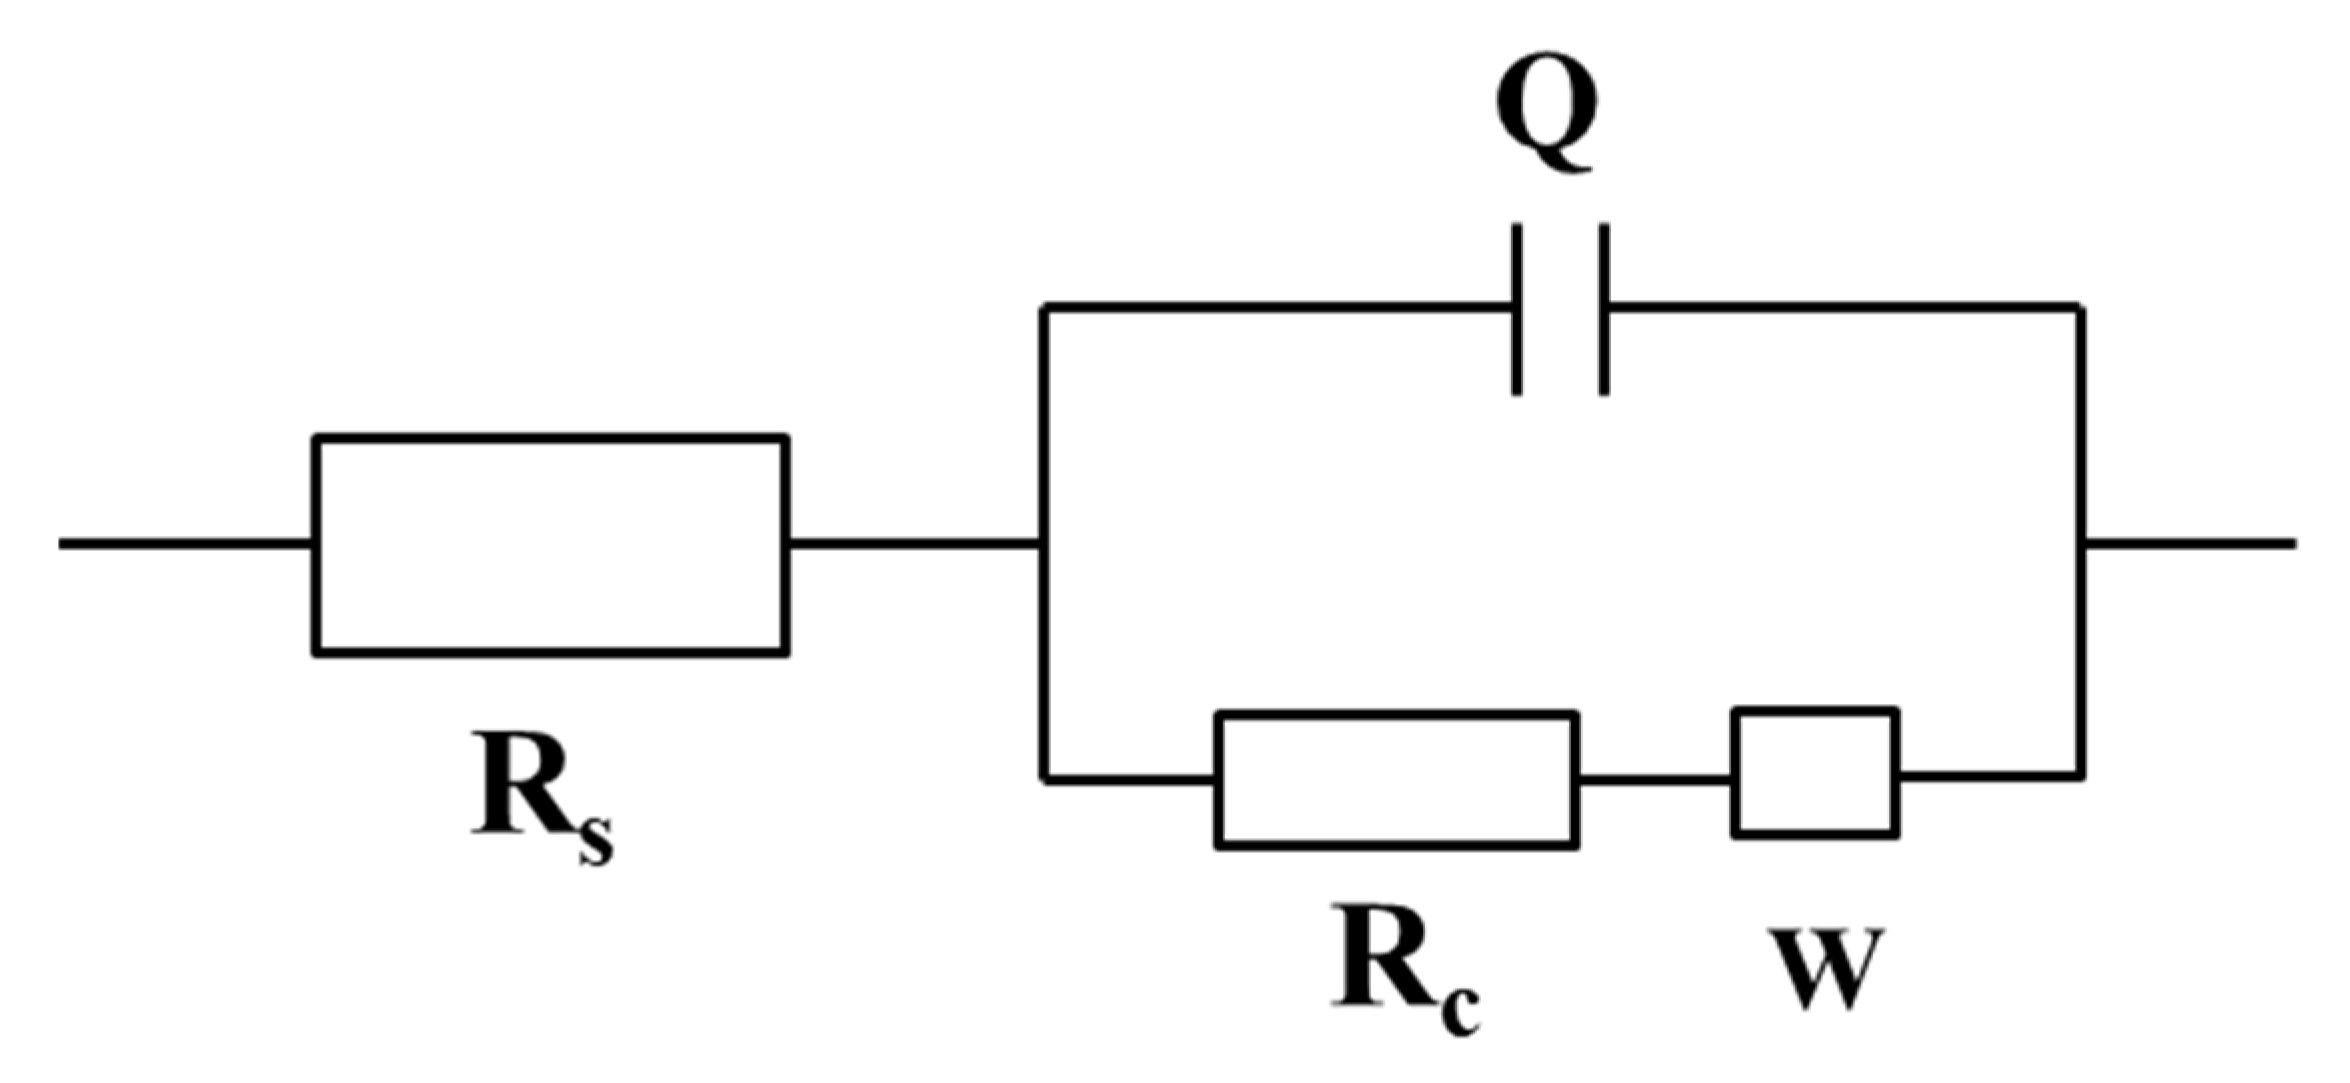
Figure 9a shows the Nyquist plots of coating(u) and coating(x) (x = 4, 6, 8). Clearly, the capacitive arc radius of coating(6) is the largest. Based on the Nyquist plots, the corresponding impedance frequency diagram (Figure 9c) and phase frequency diagram (Figure 9d) are obtained. According to the literature [41], the impedance increases with an increase in the capacitive arc radius or the modulus; when the phase angle is close to 90°, the capacitive reactance is similar to the perfect capacitance, leading to a smaller capacitance and a larger impedance. Therefore, coating(6) has better corrosion resistance. Moreover, the equivalent circuit and Rc values are obtained by fitting the Nyquist plots, as shown in Figure 10. Rs, Rc, Q, and W represent the electrolyte resistance, the coating charge transfer resistance, the coating double-layer capacitance, and the Warburg impedance, respectively. Rc reflects the corrosion resistance. Coating(6) gives the largest Rc value (1951.6 kΩ·cm2), followed by coating(4) (818.9 kΩ·cm2), coating(u) (69.8 kΩ·cm2), and coating(8) (28.4 kΩ·cm2), also indicating that the corrosion resistance of coating(6) is better.
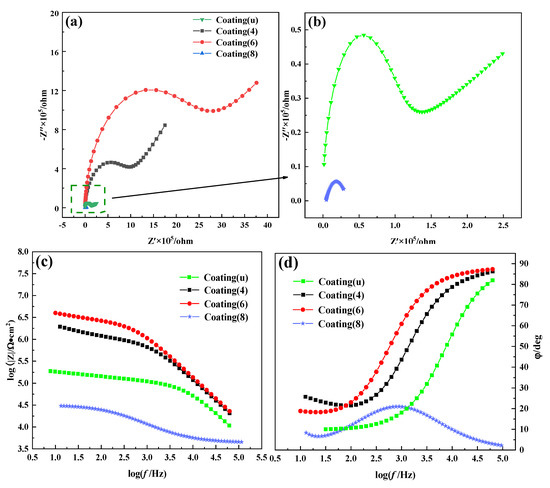
Figure 9.
(a) Nyquist plots of coating(u) and coating(x) (x = 4, 6, 8); (b) magnified view of coating(u) and coating(8); (c) impedance frequency diagram of coating(u) and coating(x) (x = 4, 6, 8); (d) phase frequency diagram of coating(u) and coating(x) (x = 4, 6, 8).
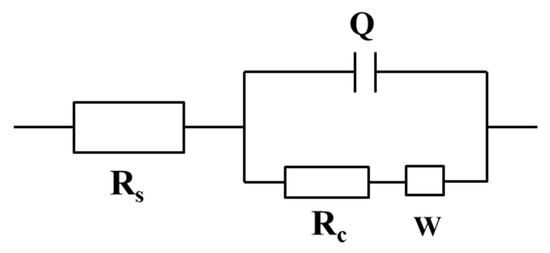
Figure 10.
Equivalent circuit of the α-Fe2O3(u) coating and coating(x) (x = 4, 6, 8).
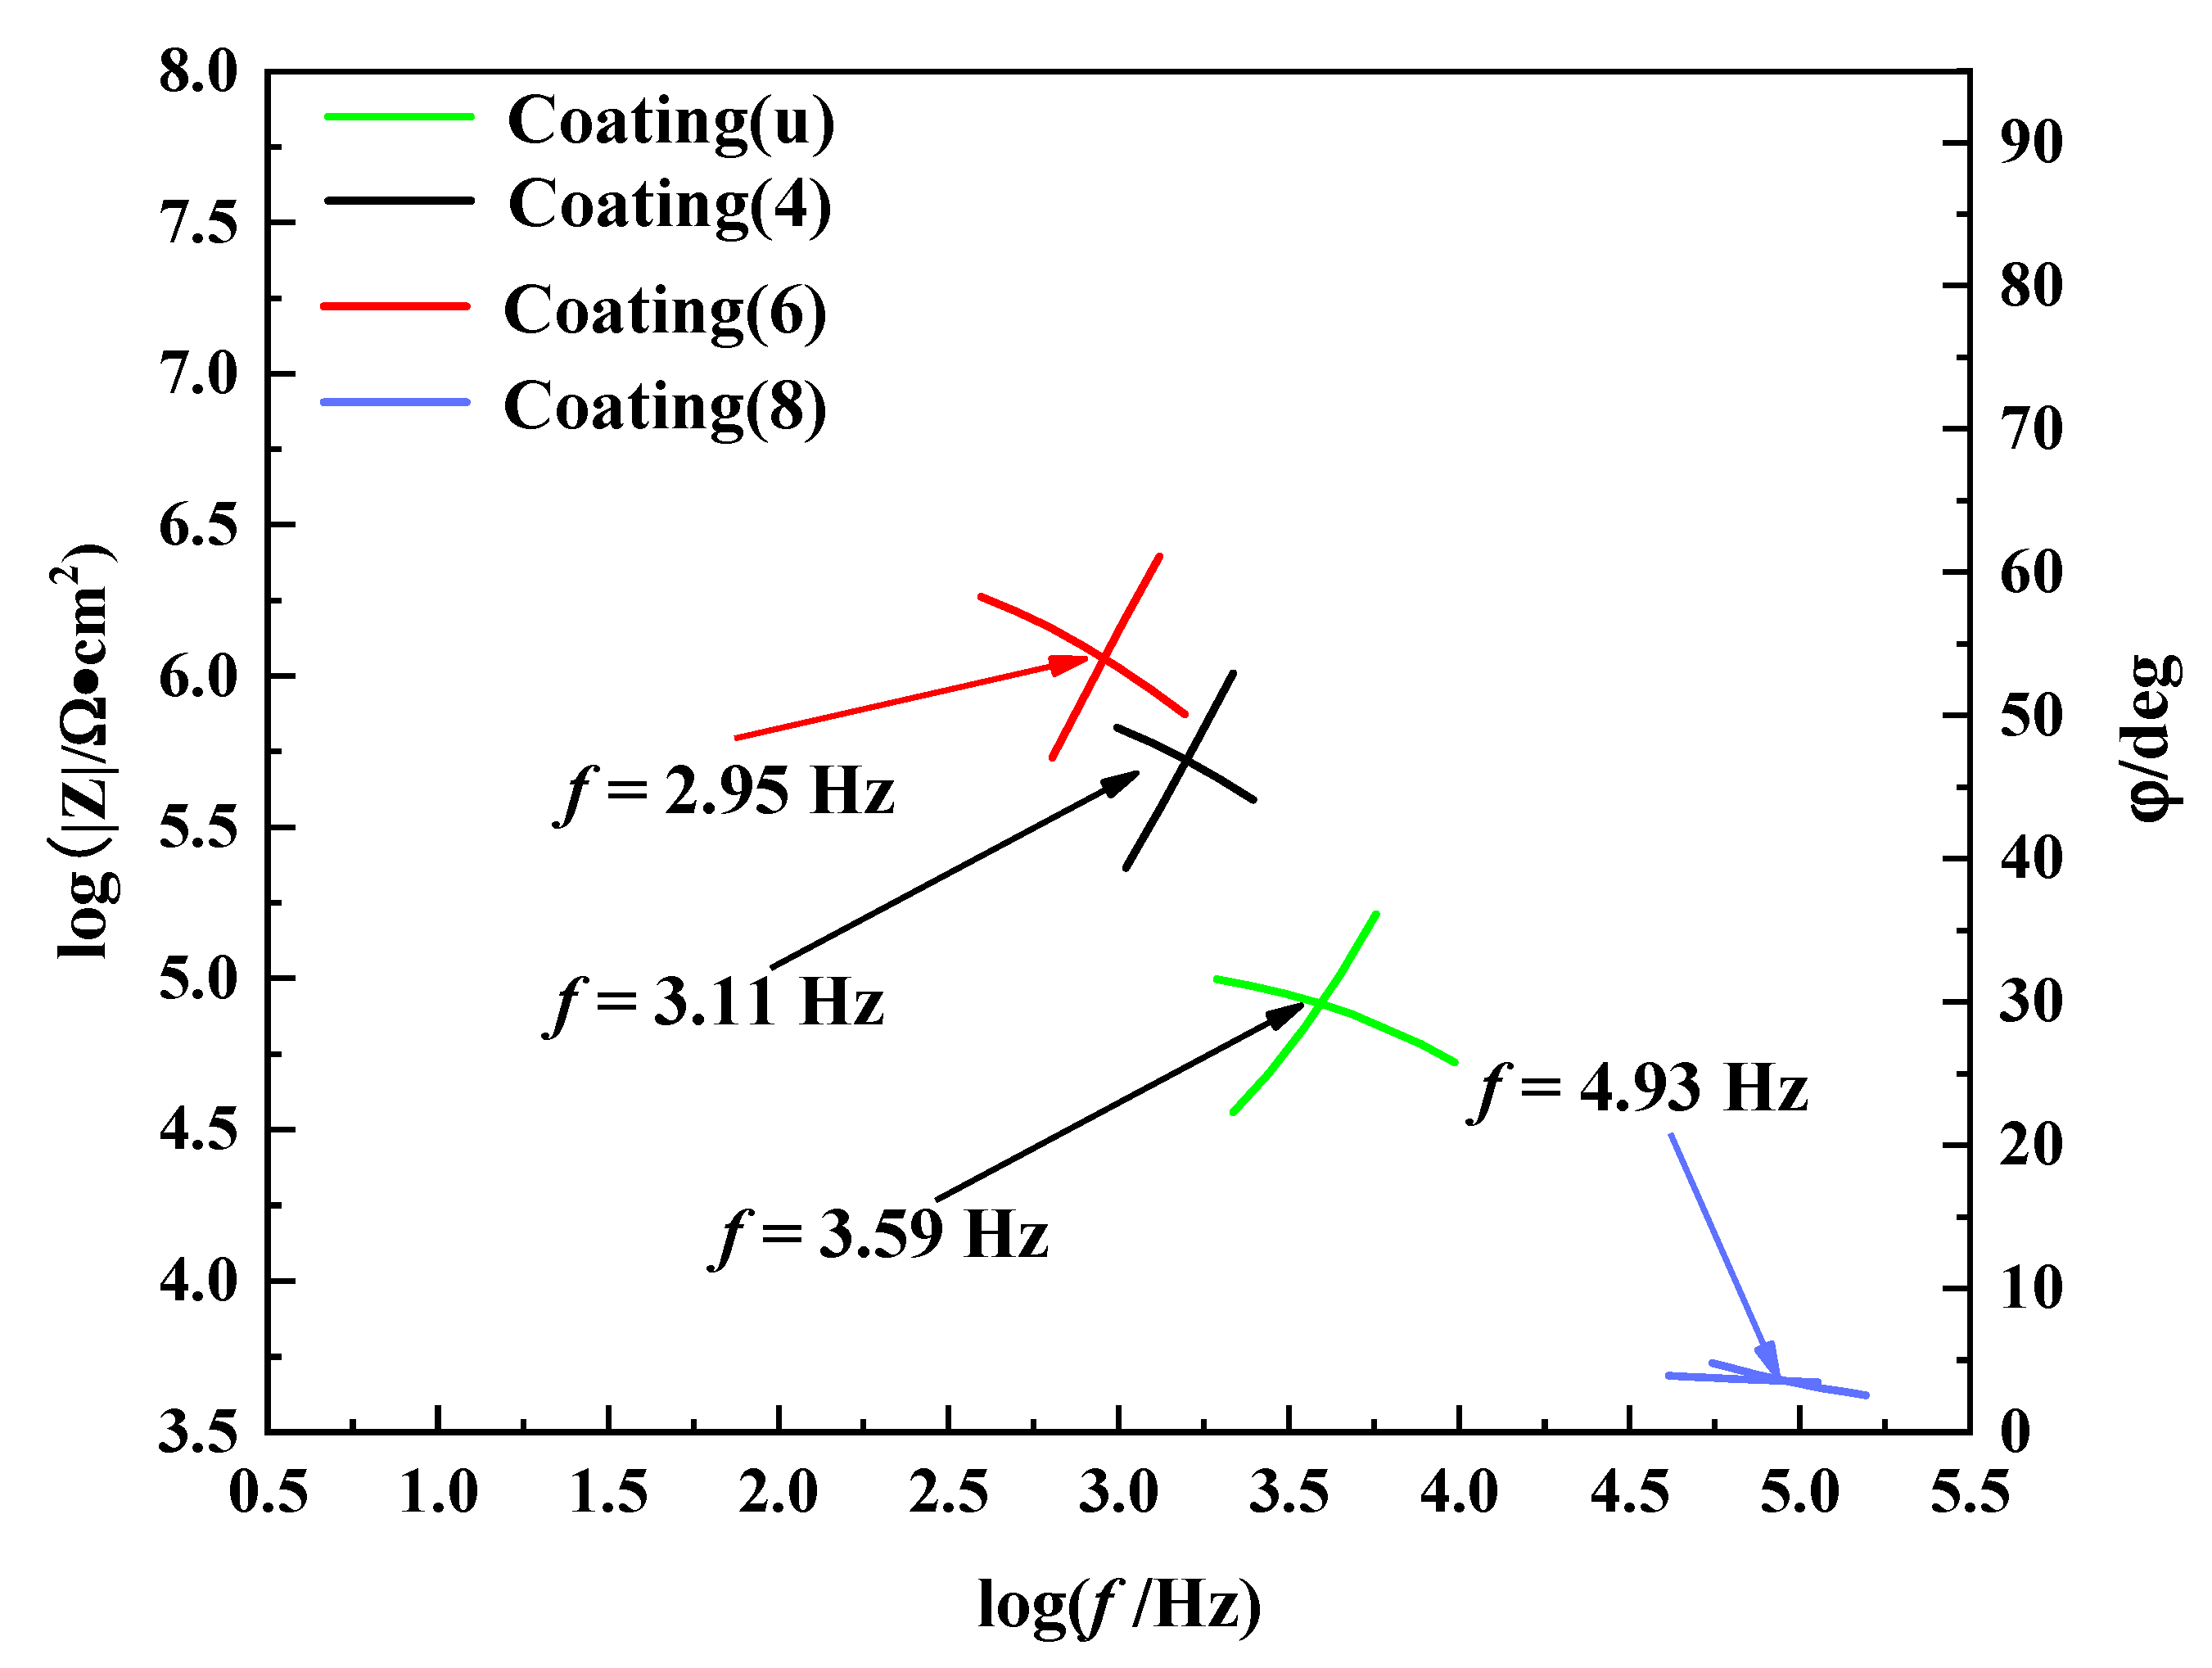
Figure 11 shows the intersection Bode diagram (IBP) of coating(u) and coating(x) (x = 4, 6, 8). When the Bode phase plot and Bode impedance plot tend to be intersected at the upper left corner, the corrosion resistance is better. The corresponding phase angle and impedance of IBP show a similar increasing tendency, and the corresponding frequency shows a decreasing tendency [42]. Compared with these of coating(u) and coating(x) (x = 4, 8), the IBP value of coating(6) is the highest, indicating better corrosion resistance.

Figure 11.
IBP of the coating(u) and coating(x) (x = 4, 6, 8).
4. Conclusions
α-Fe2O3 and La-doped α-Fe2O3 were prepared using a hydrothermal process. The synthetic pH value affects the morphology and structure of La-doped α-Fe2O3. At pH = 4 and 8, the La-doped α-Fe2O3 nanoparticles show irregular morphology with agglomeration. At pH = 6, the La-doped α-Fe2O3 nanoparticles are well dispersed and show smooth nanospheres.
The α-Fe2O3 lattice is distorted by the La-doping. When the synthetic pH value is 6, the La doping leads to a larger lattice distortion, which strengthens the Fe–O bond in α-Fe2O3. The increase in binding energy improves the electrochemical stability of α-Fe2O3. As a result, the waterborne coating modified with La-doped α-Fe2O3 nanoparticles synthesized at pH = 6 has better corrosion resistance.
Author Contributions
Conceptualization, P.S. and J.N.; methodology, H.W. and J.N.; resources, P.S.; data curation, H.W.; writing—original draft preparation, H.W.; writing—review and editing, P.S. and J.N.; visualization, H.W.; All authors have read and agreed to the published version of the manuscript.
Funding
This work was supported financially by the National Natural Science Foundation of China (51874082), and the National Key R&D Program of China (2017YFC0805100).
Institutional Review Board Statement
Not applicable.
Informed Consent Statement
Not applicable.
Data Availability Statement
The study did not report any data.
Acknowledgments
The open project was supported by the Key Laboratory for Ecological Metallurgy of Multimetallic Ores (Ministry of Education), China (NEMM2019002).
Conflicts of Interest
The authors declare no conflict of interest.
References
- Zheng, W.; Liu, Y.F.; Ye, F.; Zhan, W.X. Analysis on corrosion and protection of metal materials of smelting and chemical equipment. J. Metall. Mater. 2021, 41, 2. [Google Scholar] [CrossRef]
- Rathish, R.J.; Dorothy, R.; Joany, R.M.; Pandiarajan, M.; Rajendran, S. Corrosion resistance of nanoparticle-incorporated nano coatings. J. Eur. Chem. Bull. 2013, 2, 965–970. [Google Scholar]
- Abdeen, D.H.; Hachach, M.E.; Koc, M.; Muammer; Atieh, M.A. A review on the corrosion behaviour of nanocoatings on metallic substrates. J. Mater. 2019, 12, 210. [Google Scholar] [CrossRef] [PubMed]
- Nguyen, T.A.; Nguyen, T.H.; Nguyen, T.V.; Thai, H.; Shi, X. Effect of nanoparticles on the anticorrosion and mechanical properties of epoxy coating. J. Surf. Coat. Technol. 2009, 204, 237–245. [Google Scholar] [CrossRef]
- Liu, X.; Shao, Y.; Zhang, Y.; Meng, G.; Zhang, T.; Wang, F. Using high-temperature mechanochemistry treatment to modify iron oxide and improve the corrosion performance of epoxy coating-II. Effect of grinding temperature. J. Corros. Sci. 2015, 90, 463–471. [Google Scholar] [CrossRef]
- Hu, J.M.; Zhang, J.T.; Zhang, J.Q.; Cao, C.N. Corrosion electrochemical characteristics of red iron oxide pigmented epoxy coatings on aluminum alloys. J. Corros. Sci. 2005, 47, 2607–2618. [Google Scholar] [CrossRef]
- Singh, S.K.; Tambe, S.P.; Raja, V.S.; Kumar, D. Thermally sprayable polyethylene coatings for marine environment. J. Prog. Org. Coat. 2007, 60, 186–193. [Google Scholar] [CrossRef]
- Dhoke, S.K.; Khanna, A.S. Effect of nano-Fe2O3 particles on the corrosion behavior of alkyrd based waterborne coatings. J. Coat. Technol. Res. 2009, 51, 6–20. [Google Scholar] [CrossRef]
- Ali, A.; Zafar, H.; Zia, M.; ul Haq, I.; Phull, A.R.; Ali, J.S.; Hussain, A. Synthesis, characterization, applications, and challenges of iron oxide nanoparticles. J. Nanotechnol. Sci. Appl. 2016, 9, 49–67. [Google Scholar] [CrossRef]
- Liu, X.L. Effect of High Temperature Mechanochemical Modified Iron Oxide on Corrosion Resistance of Epoxy Coating. Ph.D. Thesis, Harbin Engineering University, Harbin, China, 2015. [Google Scholar]
- Shang, X.Y.; Zhu, Z.K.; Yin, J.; Li, Y. Study on the changes of SiO2 microphase structure in soluble PI/SiO2 nanocomposites. J. Polym. Mater. Sci. Eng. 2001, 17, 4. [Google Scholar]
- Jia, C.Y. Preparation and Properties of Rare Earth Elements (Y3+, Nd3+) Doped ZnO Films. Master’s thesis, Kunming University of Science and Technology, Kunming, China, 2012. [Google Scholar]
- Qin, D.Z. Preparation and Photocatalytic Properties of Lanthanum-Cerium Mixed Doped Nano-TiO2. Master’s thesis, Chongqing University, Chongqing, China, 2011. [Google Scholar]
- Ning, J.; Shi, P.; Jiang, M.; Liu, C.J.; Li, X. Effect of Ce doping on the structure and chemical stability of Nano-α-Fe2O3. J. Nanomater. 2019, 9, 1039. [Google Scholar] [CrossRef] [PubMed]
- Zhou, S.; Yang, Y.; Lei, R.Y.; Zhou, J.P. Effect of Rare Earth La doping on the electrical, magnetic and magnetic dielectric behavior of M-type strontium hexaferrite. J. Shaanxi Norm. University. Nat. Sci. Ed. 2021, 49, 116–124. [Google Scholar] [CrossRef]
- Yang, G.A.; Pu, Y.P.; Wang, J.F.; Zhuang, Y.Y.; Chen, X.L. Effect of La2O3 doping on the crystal structure and dielectric properties of BaTiO3-Nb2O5-Fe2O3 ceramics. J. Intraocular Lens 2009, 38, 5. [Google Scholar]
- Li, Y.Q.; Huang, Y.; Qi, S.H.; Niu, F.F.; Niu, L. Preparation, and magnetic and electromagnetic properties of La-doped strontium ferrite films. J. Magn. Magn. Mater. 2011, 323, 2224–2232. [Google Scholar] [CrossRef]
- Kumar, N.; Kaushal, A.; Bhardwaj, C.; Kaur, D. Effect of La doping on structural, optical and magnetic properties of BiFeO3 thin films deposited by pulsed laser deposition technique. J. Optoelectron. Adv. Mater.-Rapid Commun. 2010, 4, 1497–1502. [Google Scholar] [CrossRef]
- Xia, X.X.; Shi, L.J.; Jin, C.G.; Wang, K.; Xia, A.L. Effect of lanthanum ion doping on magnetic properties of cobalt ferrite. J. Anhui Univ. Technol. Nat. Sci. Ed. 2016, 33, 5. [Google Scholar] [CrossRef]
- Cheng, Z.X.; Li, A.H.; Wang, X.L.; Dou, S.X.; Ozawa, K.; Kimura, H.; Shrout, T.R. Structure, ferroelectric properties, and magnetic properties of the La-doped bismuth ferrite. J. Appl. Phys. 2008, 103, 123. [Google Scholar] [CrossRef]
- Zhang, X.K.; Wang, S.Y.; Zhang, J.; Zhang, P.; Zhang, M. Synthesis and microwave absorbing properties of La-doped barium ferrite nano powders via sol-gel auto-combustion method. J. Rare Met. 2015, 39, 5. [Google Scholar] [CrossRef]
- Zuo, L.L. Preparation and adsorption properties of lanthanum doped ferrite magnetic materials. J. Shandong Chem. Ind. 2018, 47, 3. [Google Scholar]
- Xu, B.Y.; Liu, C.Z.; Zhang, J.S.; Wang, J.C.; Yang, Y.C.; Zhao, H.T. Preparation and properties of lanthanum doped manganese zinc ferrite. J. Shenyang Univ. Technol. 2018, 37, 6. [Google Scholar]
- Shan, H.; Liu, C.; Liu, L.; Li, S.; Wang, L.; Zhang, X. Highly sensitive acetone sensors based on La-doped α-Fe2O3 nanotubes. J. Sens. Actuators B Chem. 2013, 184, 243–247. [Google Scholar] [CrossRef]
- Aghazadeh, M.; Karimzadeh, I.; Ganjali, M.R. Improvement of supercapacitive and superparamagnetic capabilities of iron oxide through electrochemically grown La3+ doped Fe3O4 nanoparticles. J. Mater. Sci. Mater. Electron. 2017, 28, 19061–19070. [Google Scholar] [CrossRef]
- Melo, D.M.D.A.; Melo, M.A.D.F.; Martinelli, A.E.; Silva, Z.R.; Cunha, J.D.D.; Lima, A.C. Synthesis and characterization of lanthanum-and yttrium-doped Fe2O3 pigments. Cerâmica 2007, 53, 79–82. [Google Scholar] [CrossRef]
- Ravinder, D.; Hashim, M.; Upadhyay, A.; Ismail, M.M.; Kumar, S.; Kumar, R.; Meena, S.S.; Khalilullah, A. Investigation of structural and magnetic properties of La doped Co-Mn ferrite nanoparticles in the presence of α-Fe2O3 phase. Solid. State. Commun. 2022, 342, 114629. [Google Scholar] [CrossRef]
- Raj, A.M.E. Influence of lanthanum doping on the structural and optical properties of hematite nanopowders. J. Appl. Sci. Eng. Methodol. 2016, 2, 272–277. [Google Scholar]
- Zan, G.; Wu, T.; Zhang, Z.; Li, J.; Zhou, J.; Zhu, F.; Chen, H.; Wen, M.; Yang, X.; Peng, X.; et al. Bioinspired Nanocomposites with Self-Adaptive Stress Dispersion for Super-Foldable Electrodes. Adv. Sci. 2022, 9, 2103714. [Google Scholar] [CrossRef]
- Zan, G.; Wu, T.; Zhu, F.; He, P.; Cheng, Y.; Chai, S.; Wang, Y.; Huang, X.; Zhang, W.; Wan, Y.; et al. A biomimetic conductive super-foldable material. Matter 2021, 4, 3232–3247. [Google Scholar] [CrossRef]
- Zan, G.; Wu, T.; Dong, W.; Zhou, J.; Tu, T.; Xu, R.; Chen, Y.; Wang, Y.; Wu, Q. Two-Level biomimetic designs enable intelligent stress dispersion for super-foldable C/NiS nanofiber free-standing electrode. Adv. Fiber Mater. 2022, 1–14. [Google Scholar] [CrossRef]
- Zhang, P.P.; Han, C.H.; Cheng, J.P.; Chen, X.G.; Ye, Y. Effect of lanthanum doping on the magnetic properties of ferrite prepared from oceanic manganese nodules. J. Inorg. Chem. 2008, 24, 4. [Google Scholar] [CrossRef]
- Huang, K.; Liu, G.H.; Tang, Z.; Sheng, S.Q.; Liu, X.S. Preparation and phase transition of lanthanum cobalt doped strontium ferrite. J. Anhui Univ. Nat. Sci. Ed. 2007, 31, 3. [Google Scholar] [CrossRef]
- Du, Y.; Cheng, Z.X.; Shahbazi, M.; Collings, E.W.; Dou, S.X.; Wang, X.L. Enhancement of ferromagnetic and dielectric properties in lanthanum doped BiFeO3 by hydrothermal synthesis. J. Alloys Compd. 2010, 490, 637–641. [Google Scholar] [CrossRef]
- Zhao, Q.; Pang, X.F.; Liu, L.W.; Deng, B.; Hu, W.C. Biological effects of nano iron oxide and its hydrate. J. Univ. Electron. Sci. Technol. 2007, 36, 4. [Google Scholar] [CrossRef]
- Miah, M.; Bhattacharya, S.; Dinda, D.; Saha, S.K. Temperature dependent supercapacitive performance in La2O3 nano sheet decorated reduce graphene oxide. J. Electrochim. Acta 2018, 260, 449–458. [Google Scholar] [CrossRef]
- Wu, Y.; Pang, A.M.; Hu, L.; He, G.S.; Zhang, Y.Y.; Zhang, L.X. Preparation and catalytic performance of nano-α-Fe2O3/(IPDI-HTPB) composite particles. J. Chem. 2020, 78, 7. [Google Scholar] [CrossRef]
- Zhou, L.Q.; Wang, C.W.; Yang, N.H.; Liang, Y.G.; Yuan, L.J.; Li, M.; Cheng, J.G.; Sun, J.T. Synthesis and properties of Cr2O3 nano powder. J. Wuhan Univ. Sci. Ed. 2005, 51, 4. [Google Scholar] [CrossRef]
- Chen, J.Y.; Jiang, G.M.; Teng, Y.; Chen, D.D.; Gan, G.Y. Research on Infrared Spectra of (Fe,N) Doped TiO2 by the Electronegativity Principle. Spectrosc. Spectr. Anal. 2017, 37, 2305–2310. [Google Scholar]
- Zhang, J.B.; Yang, C.; Zhang, C.S.; Gao, G.Q. Effect of gas nitriding on corrosion resistance of carbon steel and valence electron theoretical analysis of compound layer. Corros. Prot. 2018, 39, 207–212. [Google Scholar] [CrossRef]
- Yi, J.L.; Liu, M.H.; Chen, J.; Wu, S.L.; Zhao, L.L.; Song, Y.Z. Effect of Alodine 1200s chemical conversion treatment time on the corrosion resistance of a new 2198 Al-Li alloy. J. Corros. Prot. 2012, 33, 5. [Google Scholar]
- Xu, A.; Zhang, F.; Jin, F.; Zhang, R.; Luo, B.; Zhang, T. The evaluation of coating performance by analyzing the intersection of bode plots. Int. J. Electrochem. Sci. 2014, 9, 5116–5125. [Google Scholar]


Publisher’s Note: MDPI stays neutral with regard to jurisdictional claims in published maps and institutional affiliations. |
© 2022 by the authors. Licensee MDPI, Basel, Switzerland. This article is an open access article distributed under the terms and conditions of the Creative Commons Attribution (CC BY) license (https://creativecommons.org/licenses/by/4.0/).