
Analytical Model for Determination of Size-Distribution of Colloidal Silver Nanoparticles from Surface Plasmon Resonance Wavelength and Dielectric Functions


Abstract
:1. Introduction
2. Computational Methods
2.1. Case of and
2.2. Case of and
2.3. Derivation of Constant
3. Results and Discussion
4. Conclusions
Supplementary Materials
Author Contributions
Funding
Data Availability Statement
Acknowledgments
Conflicts of Interest
Abbreviations
| SPR | surface plasmon resonance |
| wavelength | |
| theoretical SPR wavelength | |
| experimental SPR wavelength | |
| difference between experimental and theoretical SPR wavelength | |
| absorbance | |
| general diameter of nanoparticles | |
| j-th diameter in range | |
| increment of diameter | |
| general dielectric functions | |
| extinction cross sections of nanoparticles with diameter | |
| real part of material dielectric function | |
| imaginary part of material dielectric function | |
| real part of medium dielectric function | |
| concentration of nanoparticles with diameter | |
| optical path length | |
| order of shift function (natural number) | |
| redshift constant of order | |
| shift function of order | |
| effective concentration of nanoparticles with diameter | |
| number of nanoparticles with diameter | |
| log-normal probability function | |
| volume of nanoparticle with diameter | |
| effective crater volume | |
| volume of liquid | |
| standard deviation of log-normal size distribution | |
| mode diameter of log-normal size distribution | |
| model diameter of log-normal size distribution | |
| median diameter of log-normal size distribution | |
| volume average diameter of log-normal size distribution | |
| absorption cross section | |
| scattering cross section | |
| extinction cross section | |
| difference between and | |
| geometric cross section | |
| absorption term of extinction cross section | |
| scattering term of extinction cross section | |
| extinction efficiency | |
| efficiency of difference between and | |
| minimal diameter value of function or | |
| global minimum of function | |
| maximal diameter value of function or | |
| global maximum of function | |
| global minimum of function | |
| global maximum of function | |
| average relative error |
References
- Piliarik, M.; Homola, J. Surface plasmon resonance (SPR) sensors: Approaching their limits? Opt. Express 2009, 17, 16505. [Google Scholar] [CrossRef]
- Havryliuk, O.O.; Evtukh, A.A.; Pylypova, O.V.; Semchuk, O.Y.; Ivanov, I.I.; Zabolotny, V.F. Plasmonic enhancement of light to improve the parameters of solar cells. Appl. Nanosci. 2020, 10, 4759–4766. [Google Scholar] [CrossRef]
- Chandraker, S.K.; Lal, M.; Dhruve, P.; Singh, R.P.; Shukla, R. Cytotoxic, Antimitotic, DNA Binding, Photocatalytic, H2O2 Sensing, and Antioxidant Properties of Biofabricated Silver Nanoparticles Using Leaf Extract of Bryophyllum pinnatum (Lam.) Oken. Front. Mol. Biosci. 2021, 465. [Google Scholar] [CrossRef] [PubMed]
- Jung, S.H.; Park, D.; Park, J.H.; Kim, Y.M.; Ha, K.S. Molecular imaging of membrane proteins and microfilaments using atomic force microscopy. Exp. Mol. Med. 2010, 42, 597–605. [Google Scholar] [CrossRef] [PubMed] [Green Version]
- Link, S.; El-Sayed, M.A. Shape and size dependence of radiative, non-radiative and photothermal properties of gold nanocrystals. Int. Rev. Phys. Chem. 2000, 19, 409–453. [Google Scholar] [CrossRef]
- Fontana, L.; Venditti, I.; Fratoddi, I.; Leahu, G.; Belardini, A.; Voti, R.L.; Sibilia, C.; Matassa, R.; Familiari, G. Gold and silver nanoparticles based networks as advanced materials for optoelectronic devices. In Proceedings of the 18th Italian National Conference on Photonic Technologies (Fotonica 2016), Rome, Italy, 6–8 June 2016; Volume 2016, No. CP704. pp. 2–6. [Google Scholar] [CrossRef]
- Payne, L.M.; Albrecht, W.; Langbein, W.; Borri, P. The optical nanosizer-quantitative size and shape analysis of individual nanoparticles by high-throughput widefield extinction microscopy. Nanoscale 2020, 12, 16215–16228. [Google Scholar] [CrossRef]
- Guo, D.; Xie, G.; Luo, J. Mechanical properties of nanoparticles: Basics and applications. J. Phys. D Appl. Phys. 2014, 47, 013001. [Google Scholar] [CrossRef] [Green Version]
- Jalal, S.K.; Mawlood, S.A. Size dependent thermodynamic properties of nanoparticles. Int. J. Thermodyn. 2020, 23, 245–250. [Google Scholar] [CrossRef]
- Descoteaux, M.; Sunnerberg, J.P.; Staii, C. Quantitative characterization of dielectric properties of nanoparticles using electrostatic force microscopy Quantitative characterization of dielectric properties of nanoparticles using electrostatic force microscopy. AIP Adv. 2020, 10, 115118. [Google Scholar] [CrossRef]
- Campione, S.; Guclu, C.; Ragan, R.; Capolino, F. Enhanced Magnetic and Electric Fields via Fano Resonances in Metasurfaces of Circular Clusters of Plasmonic Nanoparticles. ACS Photonics 2014, 1, 254–260. [Google Scholar] [CrossRef]
- Grigorchuk, N.I.; Tomchuk, P.M. Optical and transport properties of spheroidal metal nanoparticles with account for the surface effect. Phys. Rev. B-Condens. Matter Mater. Phys. 2011, 84, 085448. [Google Scholar] [CrossRef] [Green Version]
- Sharman, K. Chemical and Physical Analyses of Synthesized Silver Nanoparticles. Vanderbilt Undergrad. Res. J. 2013, 9, 1–9. [Google Scholar] [CrossRef] [Green Version]
- Skiba, M.I.; Vorobyova, V.I.; Kosogina, I.V. Preparation of silver nanoparticles in a plasma-liquid system in the presence of PVA: Antimicrobial, catalytic, and sensing properties. J. Chem. 2020, 2020, 5380950. [Google Scholar] [CrossRef]
- Haiss, W.; Thanh, N.T.K.; Aveyard, J.; Fernig, D.G. Determination of Size and Concentration of Gold Nanoparticles from UV- Vis Spectra. Anal. Chem. 2007, 79, 4215–4221. [Google Scholar] [CrossRef] [PubMed]
- Mansour, Y.; Battie, Y.; Naciri, A.E.; Chaoui, N. Determination of the size distribution of metallic colloids from extinction spectroscopy. Nanomaterials 2021, 11, 2872. [Google Scholar] [CrossRef] [PubMed]
- Pashkov, D.M.; Guda, A.A.; Kirichkov, M.V.; Guda, S.A.; Martini, A.; Soldatov, S.A.; Soldatov, A.V. Quantitative Analysis of the UV-Vis Spectra for Gold Nanoparticles Powered by Supervised Machine Learning. J. Phys. Chem. C 2021, 125, 8656–8666. [Google Scholar] [CrossRef]
- Martínez, J.C.; Chequer, N.A.; González, J.L.; Cordova, T. Alternative Metodology for Gold Nanoparticles Diameter Characterization Using PCA Technique and UV-VIS Spectrophotometry. Nanosci. Nanotechnol. 2013, 2, 184–189. [Google Scholar] [CrossRef] [Green Version]
- Car, J.; Blažeka, D.; Bajan, T.; Krce, L.; Aviani, I.; Krstulović, N. A quantitative analysis of colloidal solution of metal nanoparticles produced by laser ablation in liquids. Appl. Phys. A Mater. Sci. Process. 2021, 127, 838. [Google Scholar] [CrossRef]
- Blažeka, D.; Car, J.; Krstulović, N. Concentration Quantification of TiO2 Nanoparticles Synthesized by Laser Ablation of a Ti Target in Water. Materials 2022, 15, 3146. [Google Scholar] [CrossRef]
- Mourdikoudis, S.; Pallares, R.M.; Thanh, N.T.K. Characterization techniques for nanoparticles: Comparison and complementarity upon studying nanoparticle properties. Nanoscale 2018, 10, 12871–12934. [Google Scholar] [CrossRef] [Green Version]
- Paramelle, D.; Sadovoy, A.; Gorelik, S.; Free, P.; Hobley, J.; Fernig, D.G. A rapid method to estimate the concentration of citrate capped silver nanoparticles from UV-visible light spectra. Analyst 2014, 139, 4855–4861. [Google Scholar] [CrossRef] [PubMed]
- NanoXact Silver Nanospheres. Available online: https://nanocomposix.com/products/nanoxact-silver-nanospheres-bare-citrate (accessed on 15 July 2022).
- BioPure Silver Nanospheres. Available online: https://nanocomposix.com/collections/material-silver/products/biopure-silver-nanospheres-bare-citrate (accessed on 15 July 2022).
- Silver Nanoparticles NP7. Available online: https://nanocomposix.com/collections/material-silver/shape-spheres (accessed on 15 July 2022).
- Demtröder, W. Laser Spectroscopy, 3rd ed.; Springer: Berlin/Heidelberg, Germany, 2003. [Google Scholar] [CrossRef]
- Luk’yanchuk, B.S.; Tribelsky, M.I.; Ternovsky, V.; Wang, Z.B.; Hong, M.H.; Shi, L.P.; Chong, T.C. Peculiarities of light scattering by nanoparticles and nanowires near plasmon resonance frequencies in weakly dissipating materials. J. Opt. A Pure Appl. Opt. 2007, 9, S294. [Google Scholar] [CrossRef] [Green Version]
- Grigorchuk, N.I. Radiative damping of surface plasmon resonance in spheroidal metallic nanoparticle embedded in a dielectric medium. J. Opt. Soc. Am. B 2012, 29, 3404–3411. [Google Scholar] [CrossRef] [Green Version]
- Schebarchov, D.; Auguié, B.; Le Ru, E.C. Simple accurate approximations for the optical properties of metallic nanospheres and nanoshells. Phys. Chem. Chem. Phys. 2013, 15, 4233–4242. [Google Scholar] [CrossRef] [PubMed]
- Johnson, P.B.; Christy, R.W. Optical constants of the noble metals. Phys. Rev. B 1972, 6, 4370–4379. [Google Scholar] [CrossRef]
- Quinten, M. Optical Properties of Nanoparticle Systems: Mie and Beyond; John Wiley & Sons: Hoboken, NJ, USA, 2011. [Google Scholar]


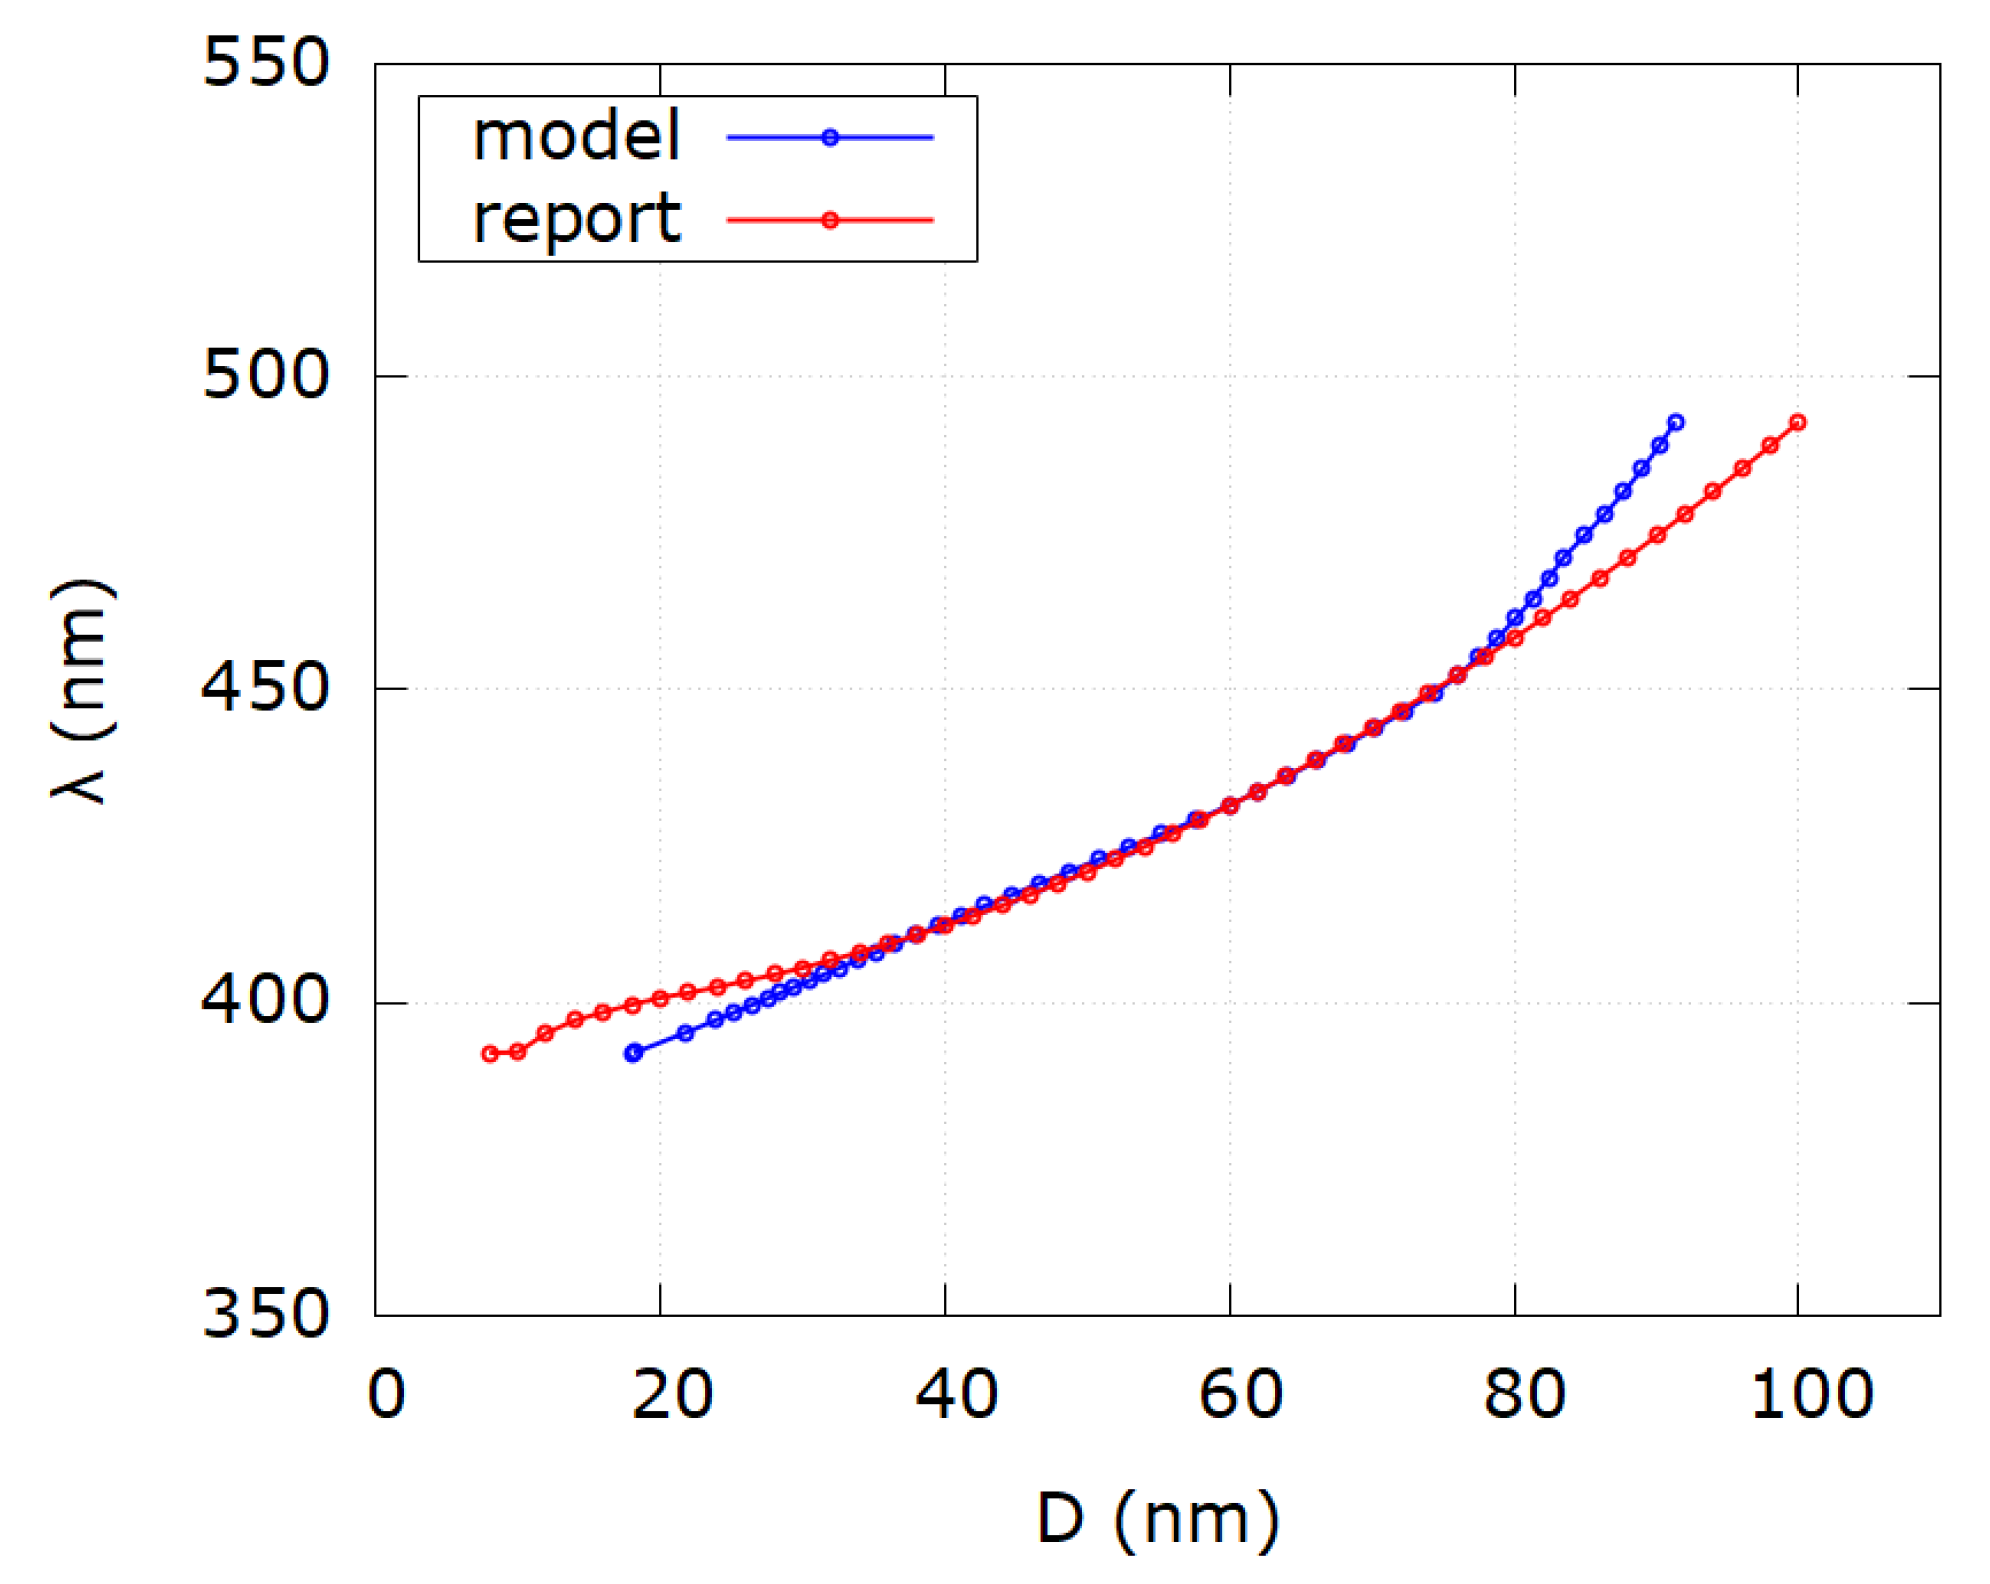
| Sample i | SPR Wavelength λSPR | Reported Diameter D | Modeled Diameter Dm | Reference |
|---|---|---|---|---|
| 1 | 392 | 8 | 18.1 | [22] |
| 2 | 392.1 | 10 | 18.3 | [22] |
| 3 | 395.2 | 12 | 21.7 | [22] |
| 4 | 397.2 | 14 | 23.9 | [22] |
| 5 | 398.5 | 16 | 25.2 | [22] |
| 6 | 399.7 | 18 | 26.5 | [22] |
| 7 | 400.8 | 20 | 27.6 | [22] |
| 8 | 401.6 | 22 | 28.5 | [22] |
| 9 | 402.5 | 24 | 29.4 | [22] |
| 10 | 403.5 | 26 | 30.4 | [22] |
| 11 | 404.5 | 28 | 31.5 | [22] |
| 12 | 405.6 | 30 | 32.6 | [22] |
| 13 | 406.8 | 32 | 33.9 | [22] |
| 14 | 408.1 | 34 | 35.2 | [22] |
| 15 | 409.4 | 36 | 36.5 | [22] |
| 16 | 410.8 | 38 | 37.9 | [22] |
| 17 | 412.3 | 40 | 39.5 | [22] |
| 18 | 413.9 | 42 | 41.1 | [22] |
| 19 | 415.5 | 44 | 42.8 | [22] |
| 20 | 417.3 | 46 | 44.8 | [22] |
| 21 | 419.1 | 48 | 46.7 | [22] |
| 22 | 420.9 | 50 | 48.7 | [22] |
| 23 | 422.9 | 52 | 50.8 | [22] |
| 24 | 424.9 | 54 | 53.0 | [22] |
| 25 | 427 | 56 | 55.3 | [22] |
| 26 | 429.2 | 58 | 57.7 | [22] |
| 27 | 431.5 | 60 | 60.0 | [22] |
| 28 | 433.8 | 62 | 62.0 | [22] |
| 29 | 436.2 | 64 | 64.1 | [22] |
| 30 | 438.7 | 66 | 66.2 | [22] |
| 31 | 441.3 | 68 | 68.3 | [22] |
| 32 | 443.8 | 70 | 70.2 | [22] |
| 33 | 446.7 | 72 | 72.4 | [22] |
| 34 | 449.5 | 74 | 74.4 | [22] |
| 35 | 452.3 | 76 | 76.1 | [22] |
| 36 | 455.3 | 78 | 77.5 | [22] |
| 37 | 458.3 | 80 | 78.8 | [22] |
| 38 | 461.4 | 82 | 80.1 | [22] |
| 39 | 464.6 | 84 | 81.3 | [22] |
| 40 | 467.9 | 86 | 82.4 | [22] |
| 41 | 471.2 | 88 | 83.5 | [22] |
| 42 | 474.6 | 90 | 84.9 | [22] |
| 43 | 478.1 | 92 | 86.4 | [22] |
| 44 | 481.6 | 94 | 87.7 | [22] |
| 45 | 485.3 | 96 | 89.0 | [22] |
| 46 | 489 | 98 | 90.2 | [22] |
| 47 | 492.8 | 100 | 91.3 | [22] |
| Sample i | SPR Wavelength λSPR | Reported Diameter D | Modeled Diameter Dm | Reference |
|---|---|---|---|---|
| 1 | 392 | 10 | 18.1 | [23] |
| 2 | 392 | 20 | 18.1 | [23] |
| 3 | 400 | 30 | 26.8 | [23] |
| 4 | 414 | 40 | 41.2 | [23] |
| 5 | 422 | 50 | 49.8 | [23] |
| 6 | 430 | 60 | 58.5 | [23] |
| 7 | 449 | 70 | 74.0 | [23] |
| 8 | 455 | 80 | 77.4 | [23] |
| 9 | 485 | 100 | 88.9 | [23] |
| 10 | 486 | 200 | 89.2 | [23] |
| 11 | 400 | 5 | 26.8 | [24] |
| 12 | 390 | 10 | 15.7 | [24] |
| 13 | 391 | 20 | 16.9 | [24] |
| 14 | 400 | 30 | 26.8 | [24] |
| 15 | 412 | 40 | 39.2 | [24] |
| 16 | 424 | 50 | 52.0 | [24] |
| 17 | 426 | 60 | 54.2 | [24] |
| 18 | 441 | 70 | 68.0 | [24] |
| 19 | 455 | 80 | 77.4 | [24] |
| 20 | 486 | 100 | 89.2 | [24] |
| 21 | 468 | 200 | 82.5 | [24] |
| Sample i | SPR Wavelength λSPR | Reported Diameter D | Modeled Diameter Dm | Reference |
|---|---|---|---|---|
| 1 | 395 | 10 | 21.5 | [25] |
| 2 | 400 | 20 | 26.8 | [25] |
| 3 | 400 | 30 | 26.8 | [25] |
| 4 | 410 | 40 | 37.1 | [25] |
| 5 | 420 | 50 | 47.7 | [25] |
| 6 | 435 | 60 | 63.0 | [25] |
| 7 | 440 | 70 | 67.2 | [25] |
| 8 | 460 | 80 | 79.5 | [25] |
| 9 | 480 | 90 | 87.1 | [25] |
| 10 | 500 | 100 | 93.2 | [25] |
| 11 | 515 | 110 | 95.9 | [25] |
Publisher’s Note: MDPI stays neutral with regard to jurisdictional claims in published maps and institutional affiliations. |
© 2022 by the authors. Licensee MDPI, Basel, Switzerland. This article is an open access article distributed under the terms and conditions of the Creative Commons Attribution (CC BY) license (https://creativecommons.org/licenses/by/4.0/).
Share and Cite
Car, J.; Krstulović, N. Analytical Model for Determination of Size-Distribution of Colloidal Silver Nanoparticles from Surface Plasmon Resonance Wavelength and Dielectric Functions. Nanomaterials 2022, 12, 3474. https://doi.org/10.3390/nano12193474
Car J, Krstulović N. Analytical Model for Determination of Size-Distribution of Colloidal Silver Nanoparticles from Surface Plasmon Resonance Wavelength and Dielectric Functions. Nanomaterials. 2022; 12(19):3474. https://doi.org/10.3390/nano12193474
Chicago/Turabian StyleCar, Julio, and Nikša Krstulović. 2022. "Analytical Model for Determination of Size-Distribution of Colloidal Silver Nanoparticles from Surface Plasmon Resonance Wavelength and Dielectric Functions" Nanomaterials 12, no. 19: 3474. https://doi.org/10.3390/nano12193474