Article

Direct Bactericidal Comparison of Metal Nanoparticles and Their Salts against S. aureus Culture by TEM and FT-IR Spectroscopy

1
P. N. Lebedev Physics Institute, Russian Academy of Sciences, 119991 Moscow, Russia
2
V. M. Gorbatov Federal Research Center for Food Systems, Russian Academy of Sciences, 109316 Moscow, Russia
3
N. F. Gamaleya Federal Research Centre of Epidemiology and Microbiology, 123098 Moscow, Russia
4
Institute of Crystallography, Branch of the Federal Scientific Research Centre “Crystallography and Photonics”, Russian Academy of Sciences, 119333 Moscow, Russia
5
Faculty of Physics, M. V. Lomonosov Moscow State University, 119991 Moscow, Russia
*
Author to whom correspondence should be addressed.
Nanomaterials 2022, 12(21), 3857; https://doi.org/10.3390/nano12213857
Submission received: 12 October 2022 / Revised: 26 October 2022 / Accepted: 28 October 2022 / Published: 1 November 2022

Abstract

:
We report the bactericidal effect of Ag and Cu NPs with different concentrations on methicillin-resistant S. aureus strain in comparison to the effect of AgNO3 and CuCl2 solutions, characterized by microbiological tests, TEM and Fourier-transform infrared spectroscopy. NPs were produced by nanosecond laser ablation in distilled water and characterized by scanning electron microscopy, UV-vis, energy dispersive X-ray, FT-IR spectroscopy, as well as X-ray diffraction, dynamic light scattering size and zeta-potential measurements. Microbiological tests showed antibacterial activity of NPs and metal ion-containing salts. Comparative FT-IR spectroscopy of bacteria, treated with metal NPs and salts, showed the broadening of amide I and II bands, a CH2-related peak and its frequency decrease, indicating the increase of membrane fluidity. The main mechanisms of the antibacterial effect were proposed: Ag and Cu NPs release ions and ROS, which result in lipid peroxidation; AgNO3 forms precipitates on the cell surface, which lead to the mechanical rupture of the membrane and subsequent possible penetration of the precipitates in the emerged damaged spots, complete destruction of the membrane and bacterial death; Cu ions from the CuCl2 solution cause damage to phosphorus- and sulfur-containing biomolecules, which leads to disruption of intracellular biochemical processes. The theories were confirmed by FT-IR spectroscopy and TEM.

Graphical Abstract

1. Introduction

In order to enhance the growth of livestock for further meat processing, antibiotics are often added to the nutrition in small doses over long periods of time, thus preventing possible diseases and death [1,2]. Needless to say, such a deliberate waste of antibiotics has a highly negative impact on human health [3], causing dysbacteriosis and allergic reactions. Pathogenic bacteria, being in the long-term presence of antibiotics, start to adjust by gene mutations, acquiring strong resistivity to commonly used drugs [4,5]. The specter of drugs, to which bacteria have developed resistivity, is growing, and we are in need of alternative methods for antibacterial procedures.
Such methods include the use of nanostructures and nanoparticles, which are affective either by direct mechanical damage to the cell membrane [6,7], or act through the formation of reactive oxygen species (ROS) [8,9]. Several theories have been proposed, such as the reaction of these metals with proteins by combining the -SH groups of enzymes, leading to the inactivation of the proteins [10]. A recent article [11] has proposed the optimal conditions for strong antibacterial effect of Ag NPs—their surface chemistry has to be controlled in order to elude aggregation and produce Ag+ ions, and its charge has to be positive to enhance the binding with bacterial cell membrane, while NP size should be 10 nm or less. Silver and copper NPs are widely known for their bactericidal action on microorganisms both in planktonic form and as durable biofilms [10,11,12,13,14,15,16]. Twelve-nm Cu NPs, prepared by inert gas condensation method, were effectively used against E. coli [13]. It was observed that Cu NPs damage cells by leaving cavities in the bacterial cell wall. Moreover, silver and copper ions can be used as disinfectants for wastewater from hospitals [17,18]. Copper NPs have proved to be more effective in antibacterial therapy than silver on E. coli and Bacillus subtilis [19].
Unlike metal NPs [20,21], ion-containing solutions are used more rarely in antimicrobial applications. The formation of dense granules around the AgNO3-treated bacteria, consisting of silver and sulfur, has been previously discovered to occur [22]. The comparison of the inhibition zone diameter after treatment of pathogenic bacteria with Ag NPs and AgNO3 was also carried out, and it was found out that, for NPs, the diameters were two-times higher [23]. Cu ion-containing solutions have also been previously tested against several microorganisms. It has been suggested, that, at given concentrations, Cu interacts with cellular nucleic acids and enzyme active sites, as well as plasma membrane [24,25,26,27,28,29], and that treatment of microorganisms with Cu can interfere with membrane integrity, which is accompanied by leakage of mobile cellular solutes such as K+ and the subsequent cell death [25]. A two-fold increase of cellular K+ release was observed after addition of Cu(NO3)2 to Saccharomyces cerevisiae—a yeast used in brewery and baking [27].
AgNO3 has been found to exhibit antimicrobial activity with a minimal inhibitory concentration of three μM against E. coli [30]. The bactericidal effect of Ag nanoparticles at millimolar levels (2–10 mM) has been previously studied on mesophilic and halophilic bacteria spp. such as Enterobacter, Bacillus subtilis and Marinobacter [31]. Bactericidal activity of Ag NPs has been detected at low concentrations against many bacterial strains. Guzman et al. reported bactericidal activity of Ag NPs against E. coli, S. aureus and Pseudomonas aeruginosa at ∼216 ppm (parts per million) [32]. Matzke et al. found that Ag NPs inhibited Pseudomonas putida growth at 3.4 g/L concentration [33].
AgNO3 can also be used as a catalyst for the preparation of biocompatible NPs, which may then be loaded with antimicrobial agents. The synthesis of low molecular weight chitosan NPs by ionotropic gelation of depolymerized chitosan for effective drug delivery in drug resistant bacteria in the presence of silver nitrate has been reported [34]. The resulting tetracycline-loaded NPs were then successfully used for antibacterial treatment on the strain of tetracycline-resistant E. coli. The authors also used AgNO3 for synthesis of low molecular weight alginic acid NPs for effective drug delivery to drug resistant bacteria [35].
Thus, Ag- and Cu-containing agents are effective against a plethora of microorganisms, but in order to define optimal treatment one has to include such methods of characterization as FT-IR spectroscopy, which allows the elucidation of the main differences in molecular structure of bacterial cells before and after NP treatment. Several studies address the issue of bacterial prototyping for subsequent database formation [36,37,38,39,40,41]. Some articles report the changes in FT-IR spectra and conclude that it is a promising method for the control and study of antibacterial agents.
The main changes in bacterial cell structure lead to the variation of width, intensity and area of bands, corresponding to specific chemical compounds, with the Lorentzian fit of the peaks giving the necessary information. The overall disruption of the membrane leads to a change in the lipid bilayer—the so-called increase of membrane fluidity [42]. The bands at 2854 cm−1 and 2924 cm−1 correspond to symmetric and asymmetric stretching vibrations of CH2, respectively, and their broadening indicates the molecular disorder in the membrane, which may be caused by metal ion adhesion to bacterial cells [43,44]. Amide I and II bandwidths illustrate conformational freedom of proteins [43,44], and their narrowing indicate an increase in protein binding, leading to the flexibility decrease caused by the proteins’ binding to metal ions.
TEM analysis is also a necessary tool for correct understanding of bacterial death mechanisms. It allows the detection of the penetration of NPs through the cell membrane and the subsequent damage [45].
In our work, we report the comparative analysis of Ag and Cu antibacterial effect in the form of NP colloidal solutions and ion-containing chemical compounds (AgNO3, CuCl) on S. aureus strain, supported with FT-IR spectroscopy data, TEM and SEM characterization along with EDS analysis and subsequent microbiological tests, confirming antibacterial effect.

2. Materials and Methods

For the comparison of the antibacterial effect of Ag-/Cu NPs and Ag-/Cu ion-containing salts we chose AgNO3 and CuCl2. Solutions with several concentrations were prepared for the subsequent bactericidal treatment: 10.8 mM, 7.2 mM and 3.6 mM AgNO3 solutions of metal-ion containing salts and Ag NPs colloid, fabricated in distilled water and then diluted resulting in 0.3 mg/mL, 0.18 mg/mL and 0.07 mg/mL concentration. For experiments with Cu, CuCl2 solutions were prepared with 51.6 mM, 12.4 mM and 6.2 mM concentrations, and Cu NPs colloids were diluted analogically to Ag NPs (0.3 mg/mL, 0.18 mg/mL and 0.07 mg/mL concentrations).
Colloidal Ag and Cu NPs were obtained via nanosecond laser ablation (laser system HTF-Mark, Bulat, wavelength λ = 1030 nm, pulsewidth τ = 120 ns) of 3 × 3 mm2 area on a bulk Ag (Sber, Moscow, Russia, 99.999% purity) or Cu target (P. N. Lebedev Physics Institute, Moscow, Russia, 99.999% purity) under the distilled water layer (thickness h ≈ 2 mm). Laser radiation was focused with an F-theta objective (focal length F = 160 mm) into a spot with 1/e diameter d ≈ 20 µm and raster-scanned across the area with the use of galvanometric scanning head (Ateko) with constant speed v = 60 mm/s, pulse repetition rate f = 20 kHz, average pulse energy E = 0.6 mJ, and for N = 40 times. As a result, the liquid above the target acquired either greyish-yellow color, which indicated the formation of Ag nanoparticles, or dark green in case of Cu NPs.
Surface topography and chemical composition of the samples were characterized by scanning electron microscope (SEM) TESCAN Vega (Tescan JSCo, Brno, Czech Republic), equipped with an energy-dispersive X-ray spectroscopy (EDS) module for the elemental composition analysis, by transmission electron microscope (TEM) Tecnai Osiris (FEI company, Hillsboro, OR) operating at 200 keV and equipped with Super-X SDD high-sensitivity EDS module. For SEM imaging a 5-µL drop of each sample was placed on a Si substrate and dried at room temperature. For TEM analysis the similar amount of liquid solution was placed on a carbon-coated golden grid.
XRD spectra were obtained with DR-02 RADIAN diffractometer (JSC Expertcentr, Moscow, Russia), using Cu Kα X-rays with wavelength λ = 0.154 nm. Data were recorded for the 2θ range of 10–60° with a 0.05 step.
For FT-IR spectral characterization, a drop of each sample (10 μL) was placed on a Si substrate and dried. Measurements were acquired in vacuum camera with the use of 2-mm diaphragm, in the range 800–3500 cm−1, using spectrometer V-70 (Bruker). Pure fluorite substrate and samples with deposited Ag and Cu oxide NPs were also measured for subsequent spectral normalization. After measurement of IR transmittance, all spectra were converted to optical density and normalized, after which their comparative analysis was implemented.
UV-vis spectra of all solutions were measured with SF-2000 spectrometer (190–1100 nm measurement range, resolution 0.1 nm), and NP size distributions and z-potential were measured by Zeta Sizer spectrometer (Malvern Instruments, Inc., Malvern, UK), with each value being averaged from three parallel measurements.
For biofilm preparation, substrates with areas 1 × 1 cm2 were cut from a large silicon (Si) plate (thickness 380 µM, purity 99.99%) for subsequent samples analysis. Bacterial isolates were provided by V. M. Gorbatov Federal Research Center for Food Systems of Russian Academy of Sciences. The over-night (18-h) culture was centrifuged with the subsequent removal of supernatant. The sedimented bacterial cells were intensively shaken with distilled water, after what the resulting suspension was then subjected to serial logarithmic dilutions up to 105 CFU/mL (colony-forming unit per milliliter).
For bactericidal treatment, biofilms of S. aureus were grown for 24 h on Si substrates. Several samples were prepared: untreated S. aureus biofilm for control, and biofilms treated with AgNO3, Ag NPs, CuCl2 and Cu NPs solutions with different concentrations, three of each. Drops of each solution (10 µL) were put on grown biofilms and left for 20 min, during which the complete evaporation of liquid occurred.
Each sample was also duplicated for parallel inoculation. One mL was taken from the biofilms in order to determine the number of CFU in the original sample (control). All samples were then titrated, plated on Petri dishes with solid nutrient medium and left for 24-h incubation, after which the number of CFU was determined.

3. Results

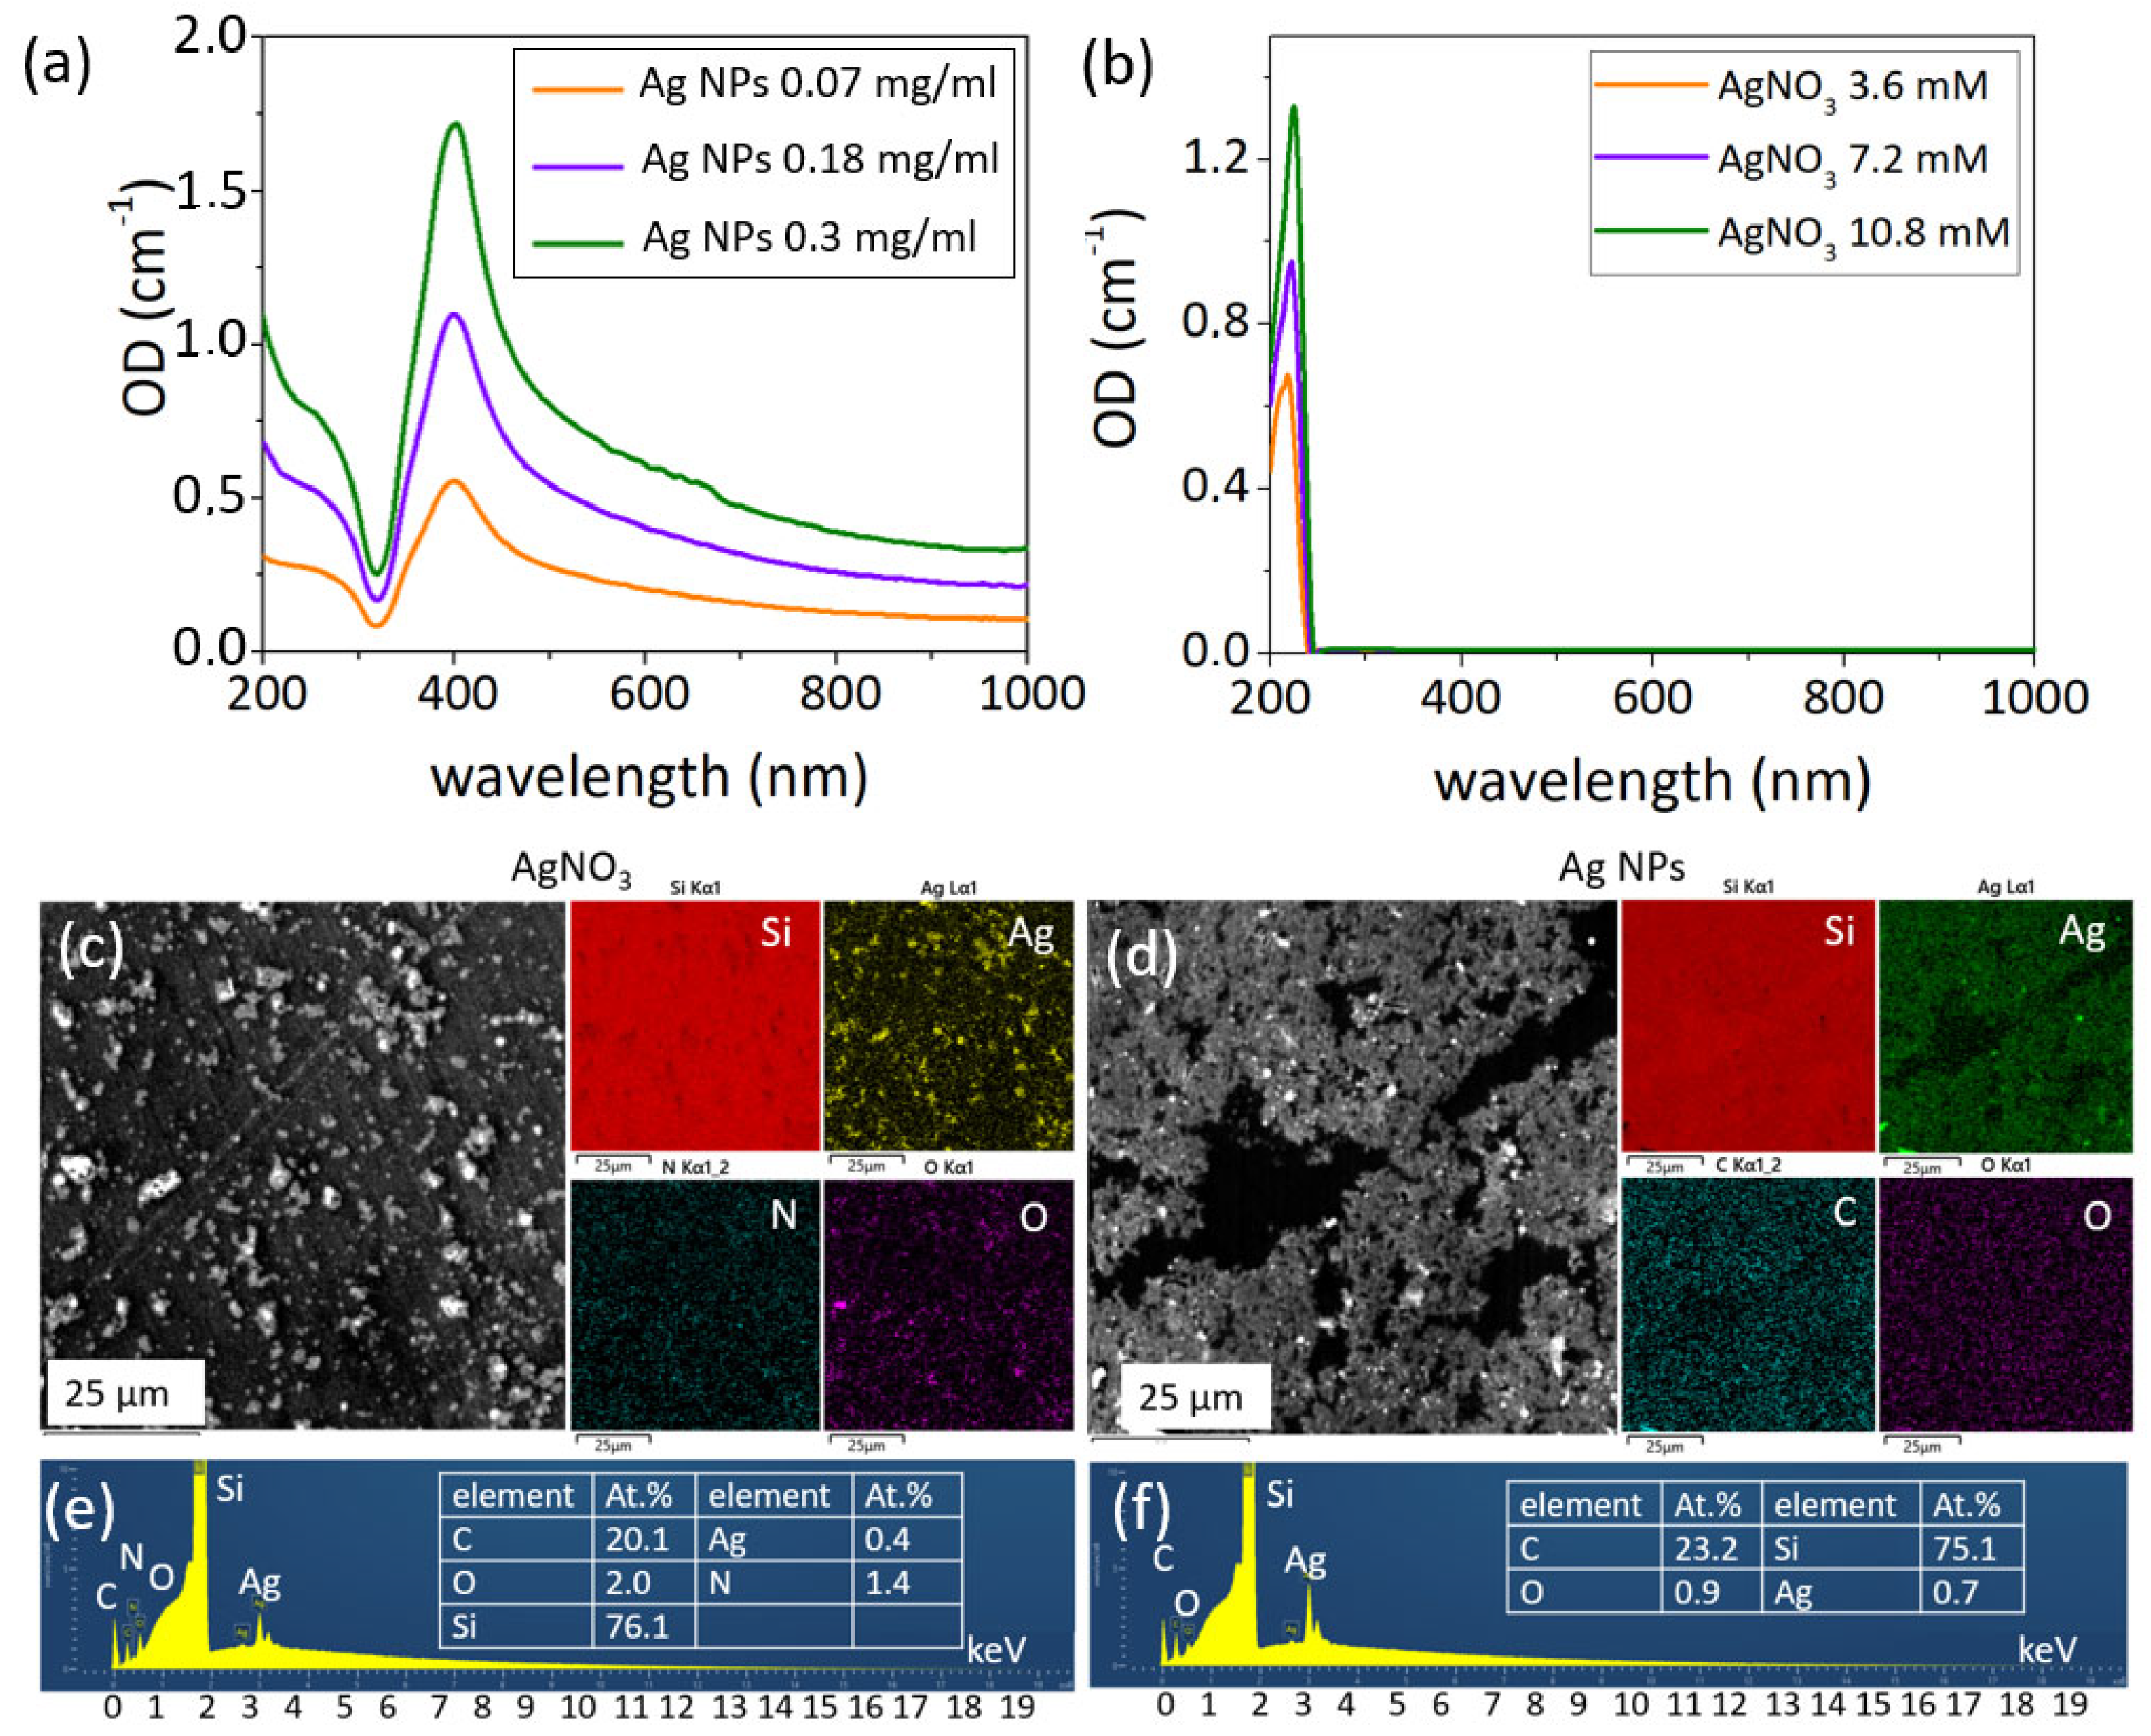
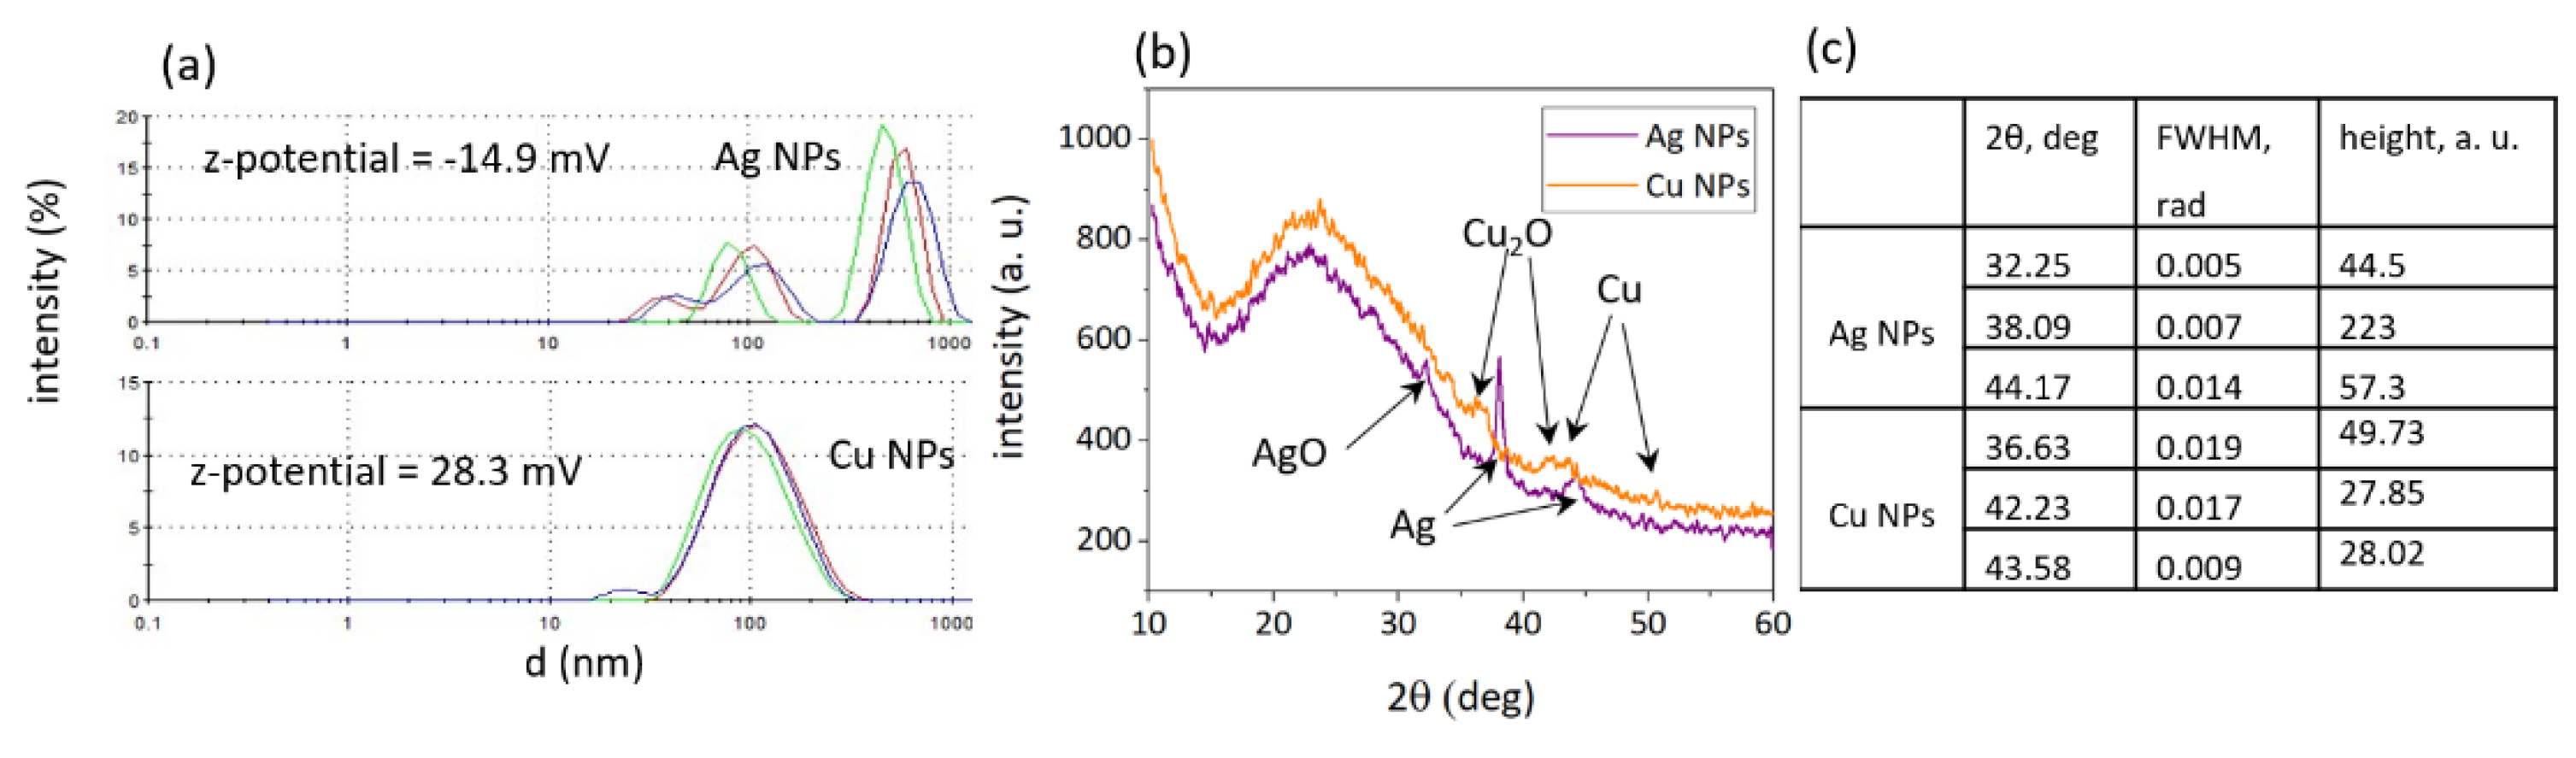
3.1. Characterization of NP Colloids and Solutions

Ag NPs colloids have an absorption band at ≈400 nm (Figure 1a), corresponding to the localized plasmon resonance [46]. Absorption of the colloids diminishes with lower concentrations. AgNO3 solution has a weak absorption band at ≈300 nm (Figure 1b), which is in agreement with the literature [47] and may be attributed to interband transitions in silver (4d → 5s, p) [48].
SEM characterization showed that AgNO3 solution, dried at silicon wafers, forms large precipitates (Figure 1c). Ag NPs have a round shape and a moderate polydispersity in size distribution (Figure 1d). Results of EDS, obtained at accelerating voltage of 10 keV, show the high content of oxygen in dried AgNO3 drop (1 to 5 ratio of silver to oxygen) (Figure 1e) and its significantly lower value for Ag NPs (Ag—0.7 at.%, O—0.9 at.%) (Figure 1f), which therefore prove the moderate oxidation of waterborne Ag NPs.
Cu NPs in colloidal form have a weak absorption band at ≈600 nm (Figure 2a), which corresponds to previously obtained data in the literature [49]. CuCl2 solutions have an absorption band at ≈200–250 nm (Figure 2b), which is in agreement with the literature [50] and disappears with a lowering of the solution concentration.
SEM characterization showed the formation of precipitates during the evaporation of liquid and drying of CuCl2, which consist of Cu, Cl and O (Figure 2c). Both these precipitates and waterborne Cu NPs (Figure 2d) exhibit strong oxidation—0.1 at.% (Cu) to 1 at.% (O) for CuCl2 (Figure 2e), and 0.2 at.% (Cu) to 2.4 at.% (O) for Cu NPs (Figure 2f).
Ag NPs, fabricated by laser ablation of bulk target, have three observable fractions with mean sizes of ≈38, 100 and 590 nm (Figure 3a) and negative z-potential −14.9 mV, whereas Cu NPs have main peaks at ≈25, 117 nm and a positive z-potential 28.3 mV (Figure 3a).
XRD spectra (Figure 3b) illustrate the phase composition of NPs, and have several diffraction peaks, which indicate the crystalline structure of both types of NPs. For the spectra registration, NPs from the colloidal solution were dried on a cover glass slide, therefore resulting in a broad fluorescence band from 2θ ~15 to 35° (Figure 3b). The observed diffraction peaks at angle 2θ ∼ 36.5°, 42° and 50.6° with (111), (002), and (200) planes correspond to face centered cubic structure (fcc) of Cu NPs [51]. Peaks at 2θ ∼ 32.2°, 38° and 44.2° with (220), (111), and (200) planes correspond to hcp structured nanoparticles [52]. The presence of both fcc and hcp structures is attributed to the growth along different crystallographic planes during the formation of NPs [53]. Cu NPs are presented in form of Cu2O and Ag NPs—AgO (Figure 3b). The crystallite size may be defined from the obtained spectra with the use of Scherer Formula (1):
Dh,k,l = 0.9 λ/(βh,k,lcosθ)
where λ = 0.154 nm (Cu Kα-line) is the X-ray wavelength, β is the full linewidth at half maximum (FWHM), and θ is the diffraction angle at the corresponding planes.
In order to get values of FWHM a Lorentz fit was implemented for each peak in Origin software, resulting in data (Figure 3c) that show the average size of Ag NP crystallites equals to ≈ 20 nm, and for Cu NP crystallites ≈11 nm, possibly illustrating the several-nm fraction in DLS size distributions (Figure 3a).

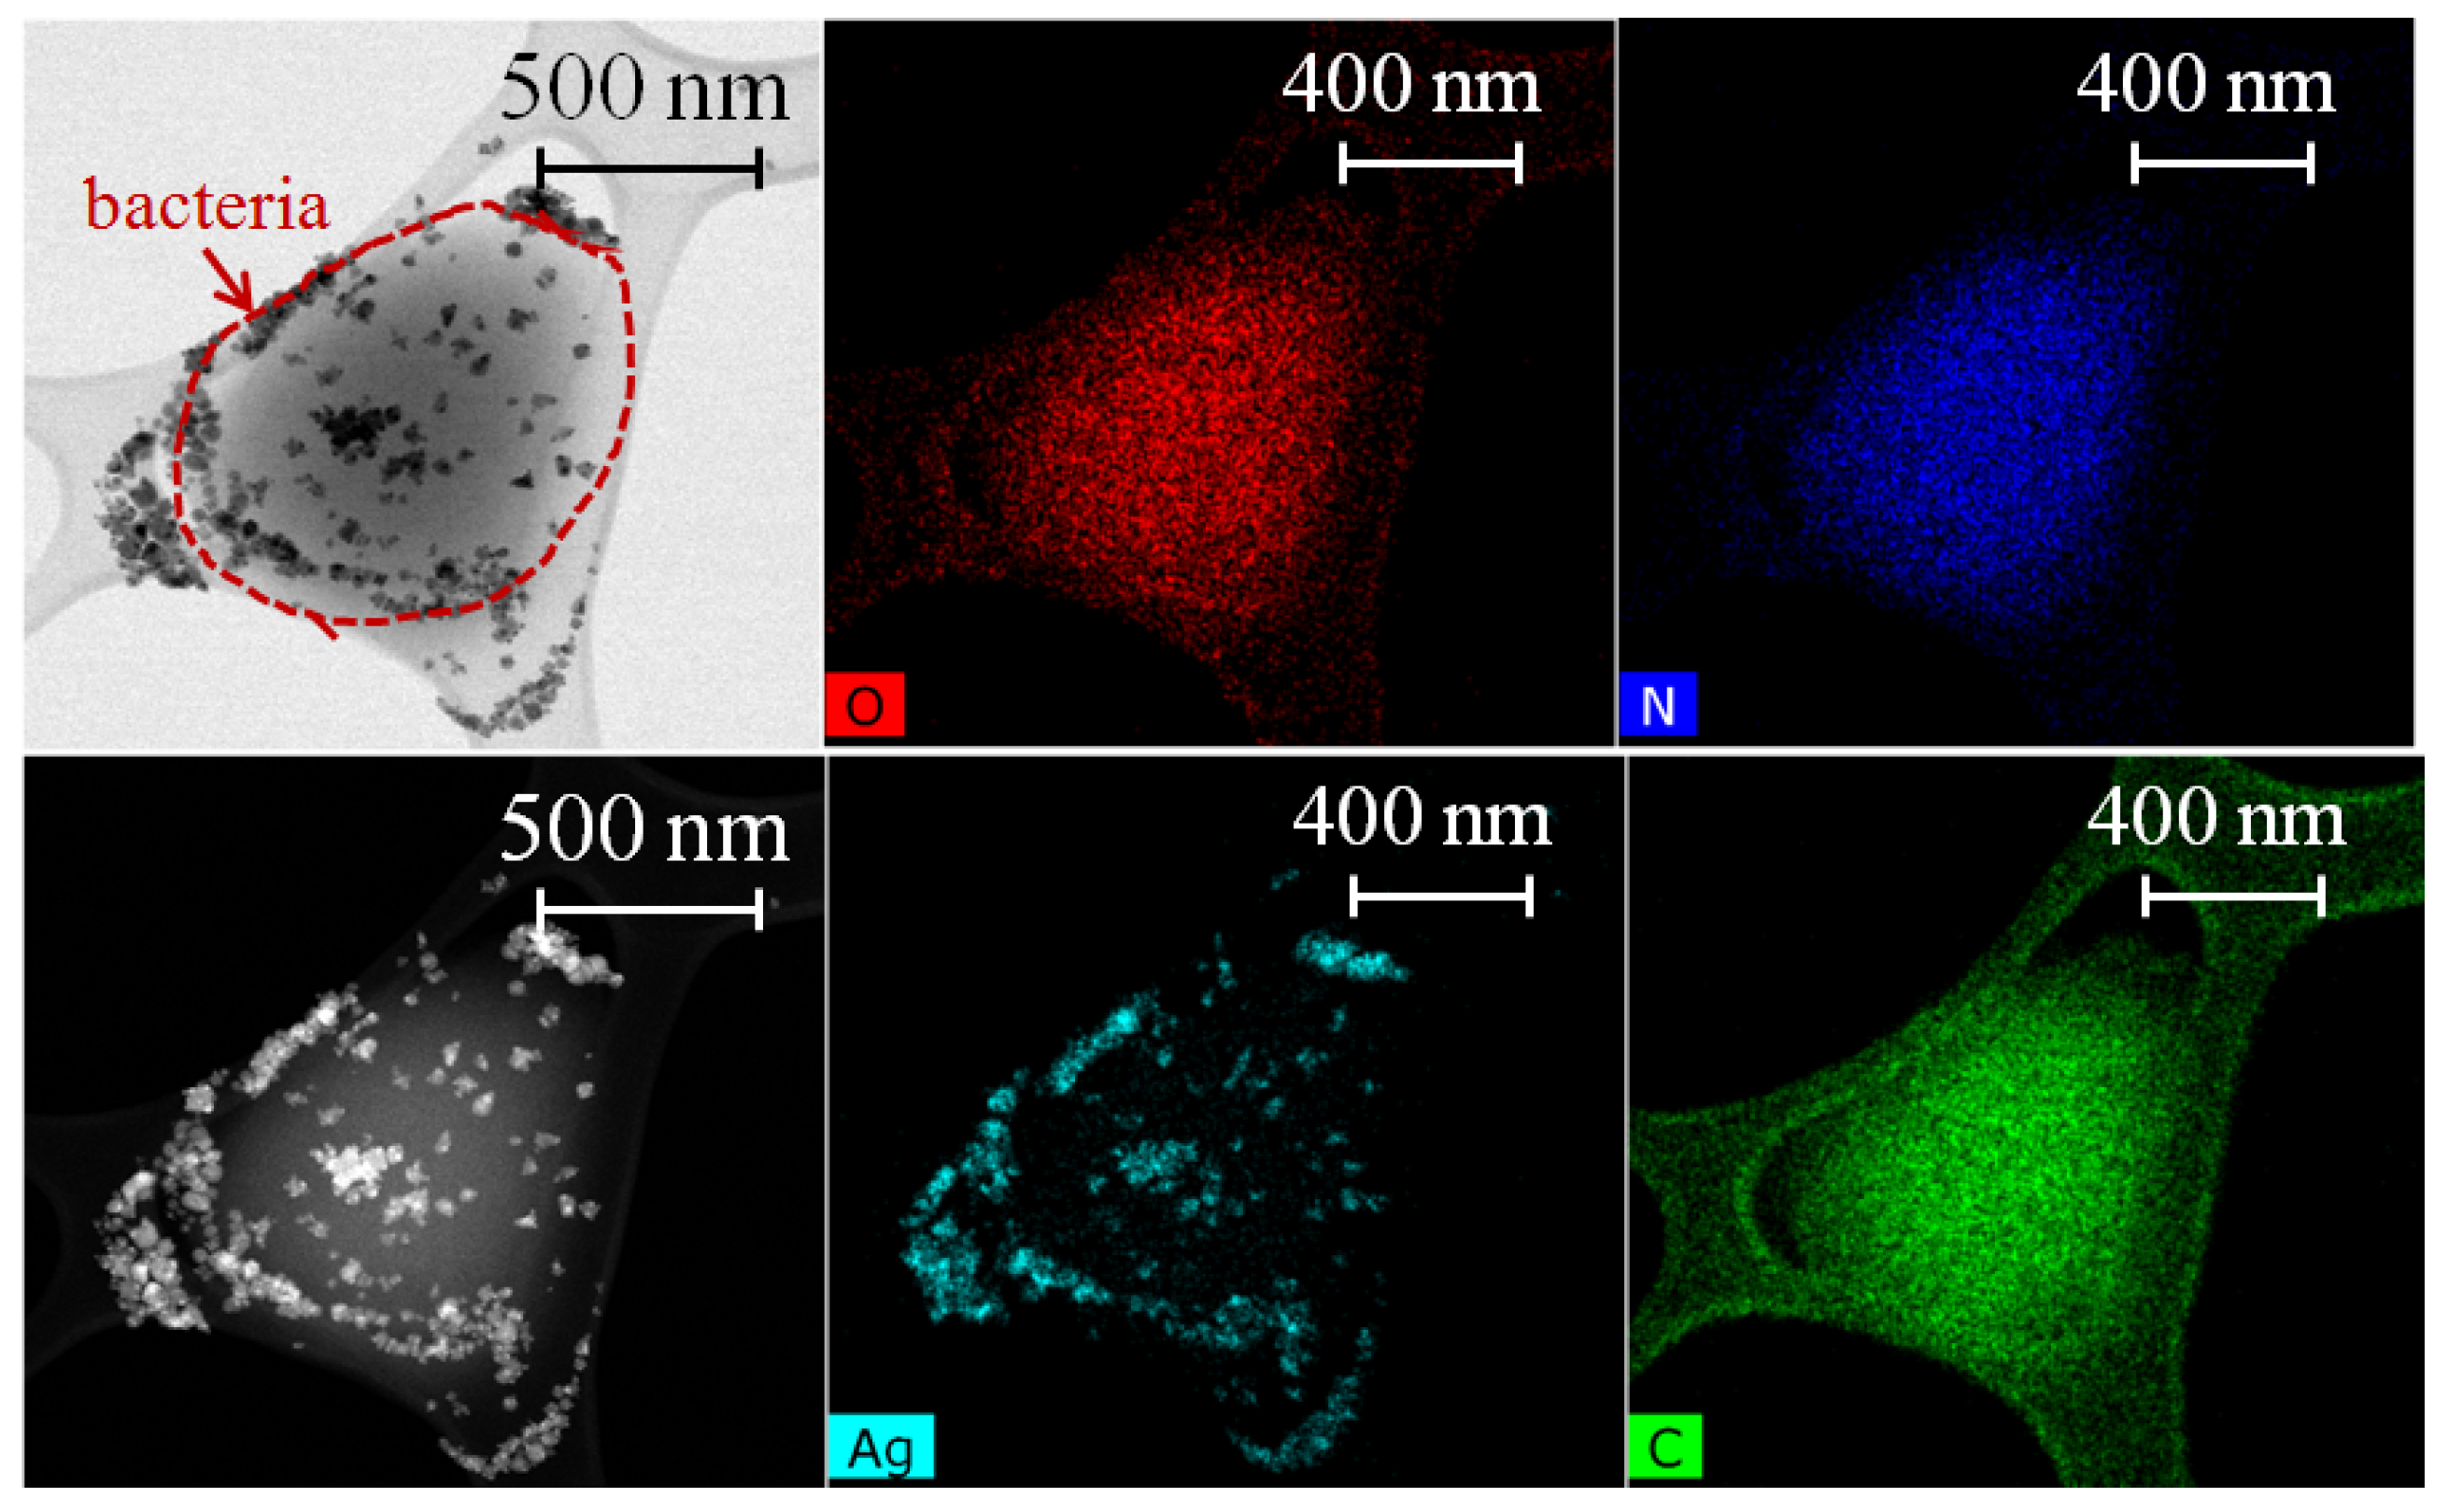
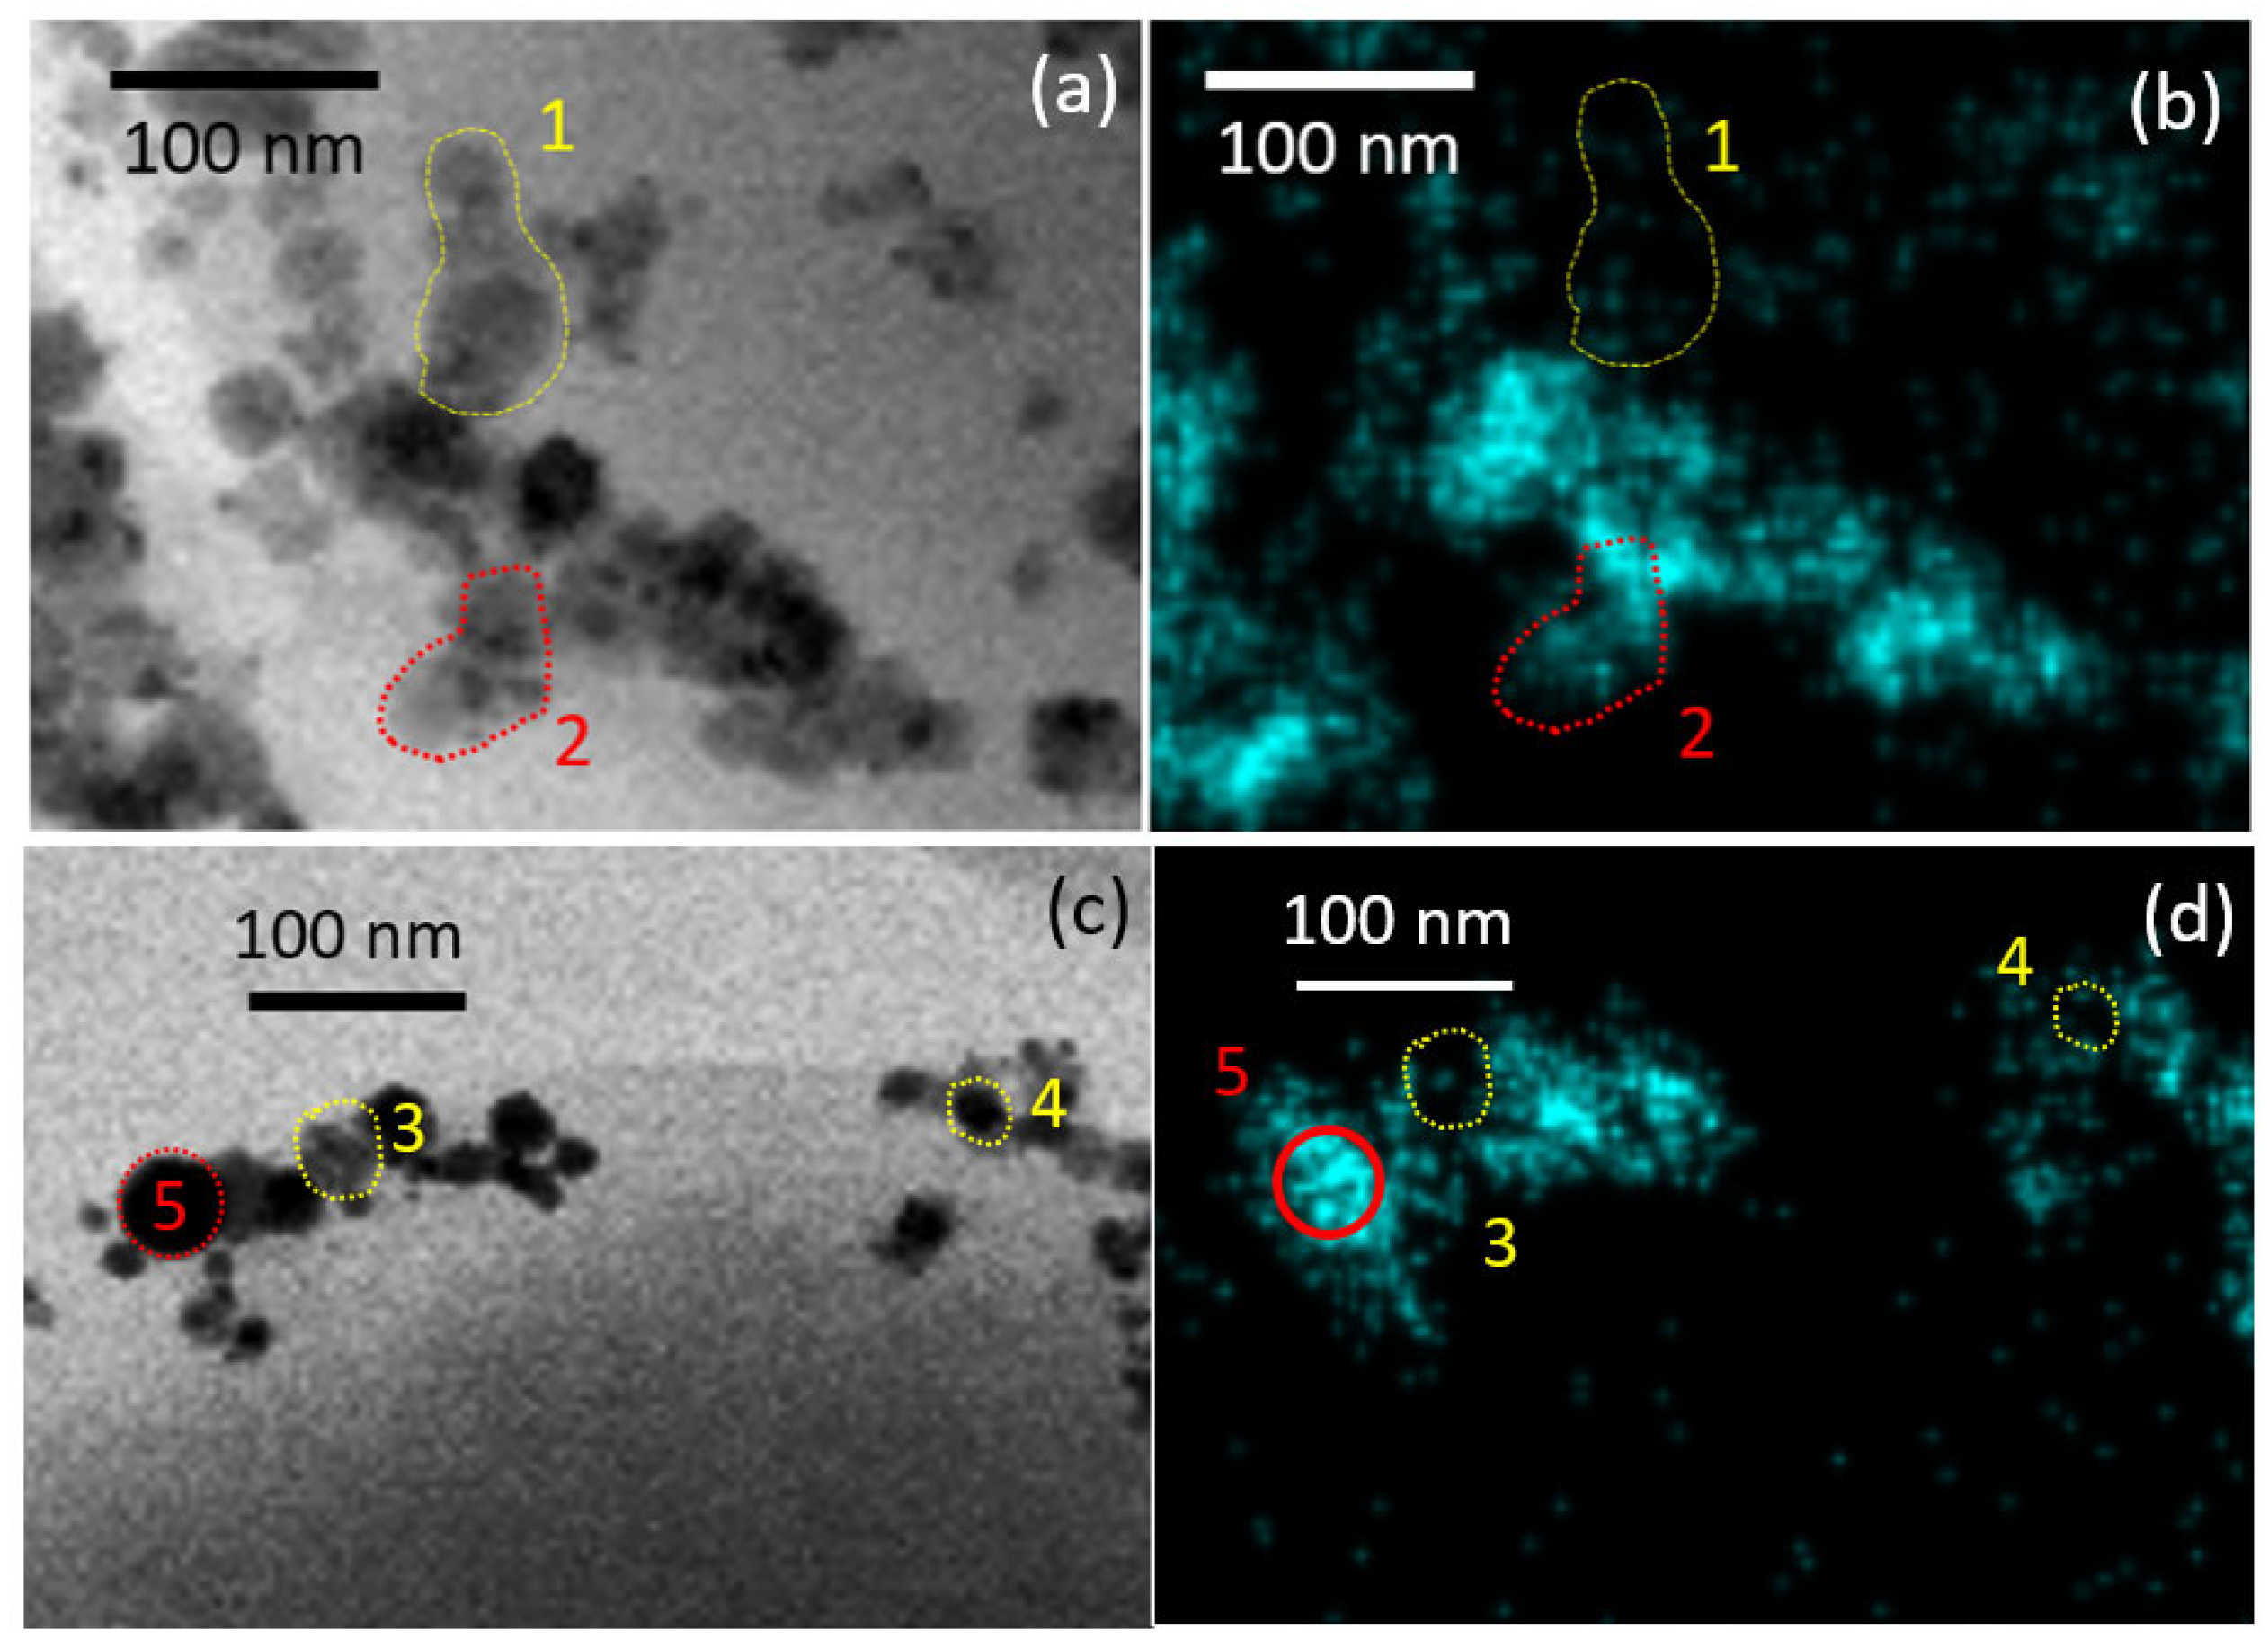
3.2. TEM Characterization of NP-Treated Cells

For bactericidal treatment, biofilms of S. aureus were grown for 24 h on Si substrates. Several samples were prepared: untreated S. aureus biofilm for control, and biofilms treated with AgNO3, Ag NPs, CuCl2 and Cu NPs solutions with different concentrations, three of each. Drops of each solution (10 μL) were put on grown biofilms and left for 20 min, during which the complete evaporation of liquid occurred. TEM images of S. aureus cells, treated with AgNO3 and Ag NPs (see Section 2 for details), along with a high-angle annular dark-field (HAADF) image, are shown in Figure 4 and Figure 5. According to EDS analysis, silver nitrate solution has precipitated in the form of nanoparticles on the cell surface, which may have ruptured the membrane and contributed to its bactericidal effect. The precipitate may have also penetrated the cell membrane, as the mean size of particles equals ≈ 8–10 nm (Figure 5). Despite its content in AgNO3 solution, N content was only observed in the volume of bacteria (Figure 4 and Figure 5), presumably from the glycyl amide nitrogens in peptidoglycan and the esterified D-alanyl amine nitrogens in the wall teichoic acid [54].
One can suggest the possible penetration of Ag NPs and Ag precipitates in the cell membrane by comparison of TEM image and the corresponding EDS of Ag distribution in the cell volume (Figure 6). The marked yellow (1) and red (2) shapes of Ag NPs on TEM image (Figure 6a) have the same contrast, which suggests the equal penetration depth of the electron beam, considering the exact same elemental composition of bacterial cell and NPs. The corresponding EDS map of the same area (Figure 6b) shows that, while shape 2 (red) is detected, shape 1 (yellow) is not seen. This may be explained by the longer path of the electron beam not reaching NPs inside the cell and therefore blocking the emission of characteristic X-rays. It is known that SEM EDS analysis of bulk samples obtain data from a pear-shaped interaction volume [55,56], thus acquiring elemental composition at high values of accelerating voltage (about 20 keV) not only from the surface and subsurface layers, but also (mainly) from the bulk of the material. TEM EDS analysis, on the other hand, deals with samples with thicknesses ≈ 80 nm, where the interaction volume is limited by the aperture size of the electron beam [57]. The minimization of interaction volume provides better spatial resolution [58], therefore the observed differences in EDS maps for Ag NP-treated S. aureus cells cannot be attributed to artefacts.
Likewise, Ag precipitate in area 3 (yellow) in Figure 6c,d is not seen in the corresponding EDS map. Areas 4 (yellow) and 5 (red) also have the same contrast, although while area 5 is clearly seen in the EDS map, area 4 is absent. This comparison also suggests the penetration of precipitates in the volume of bacterial cell.

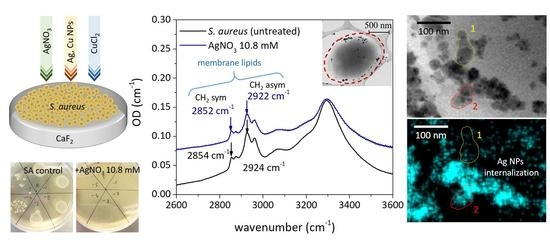
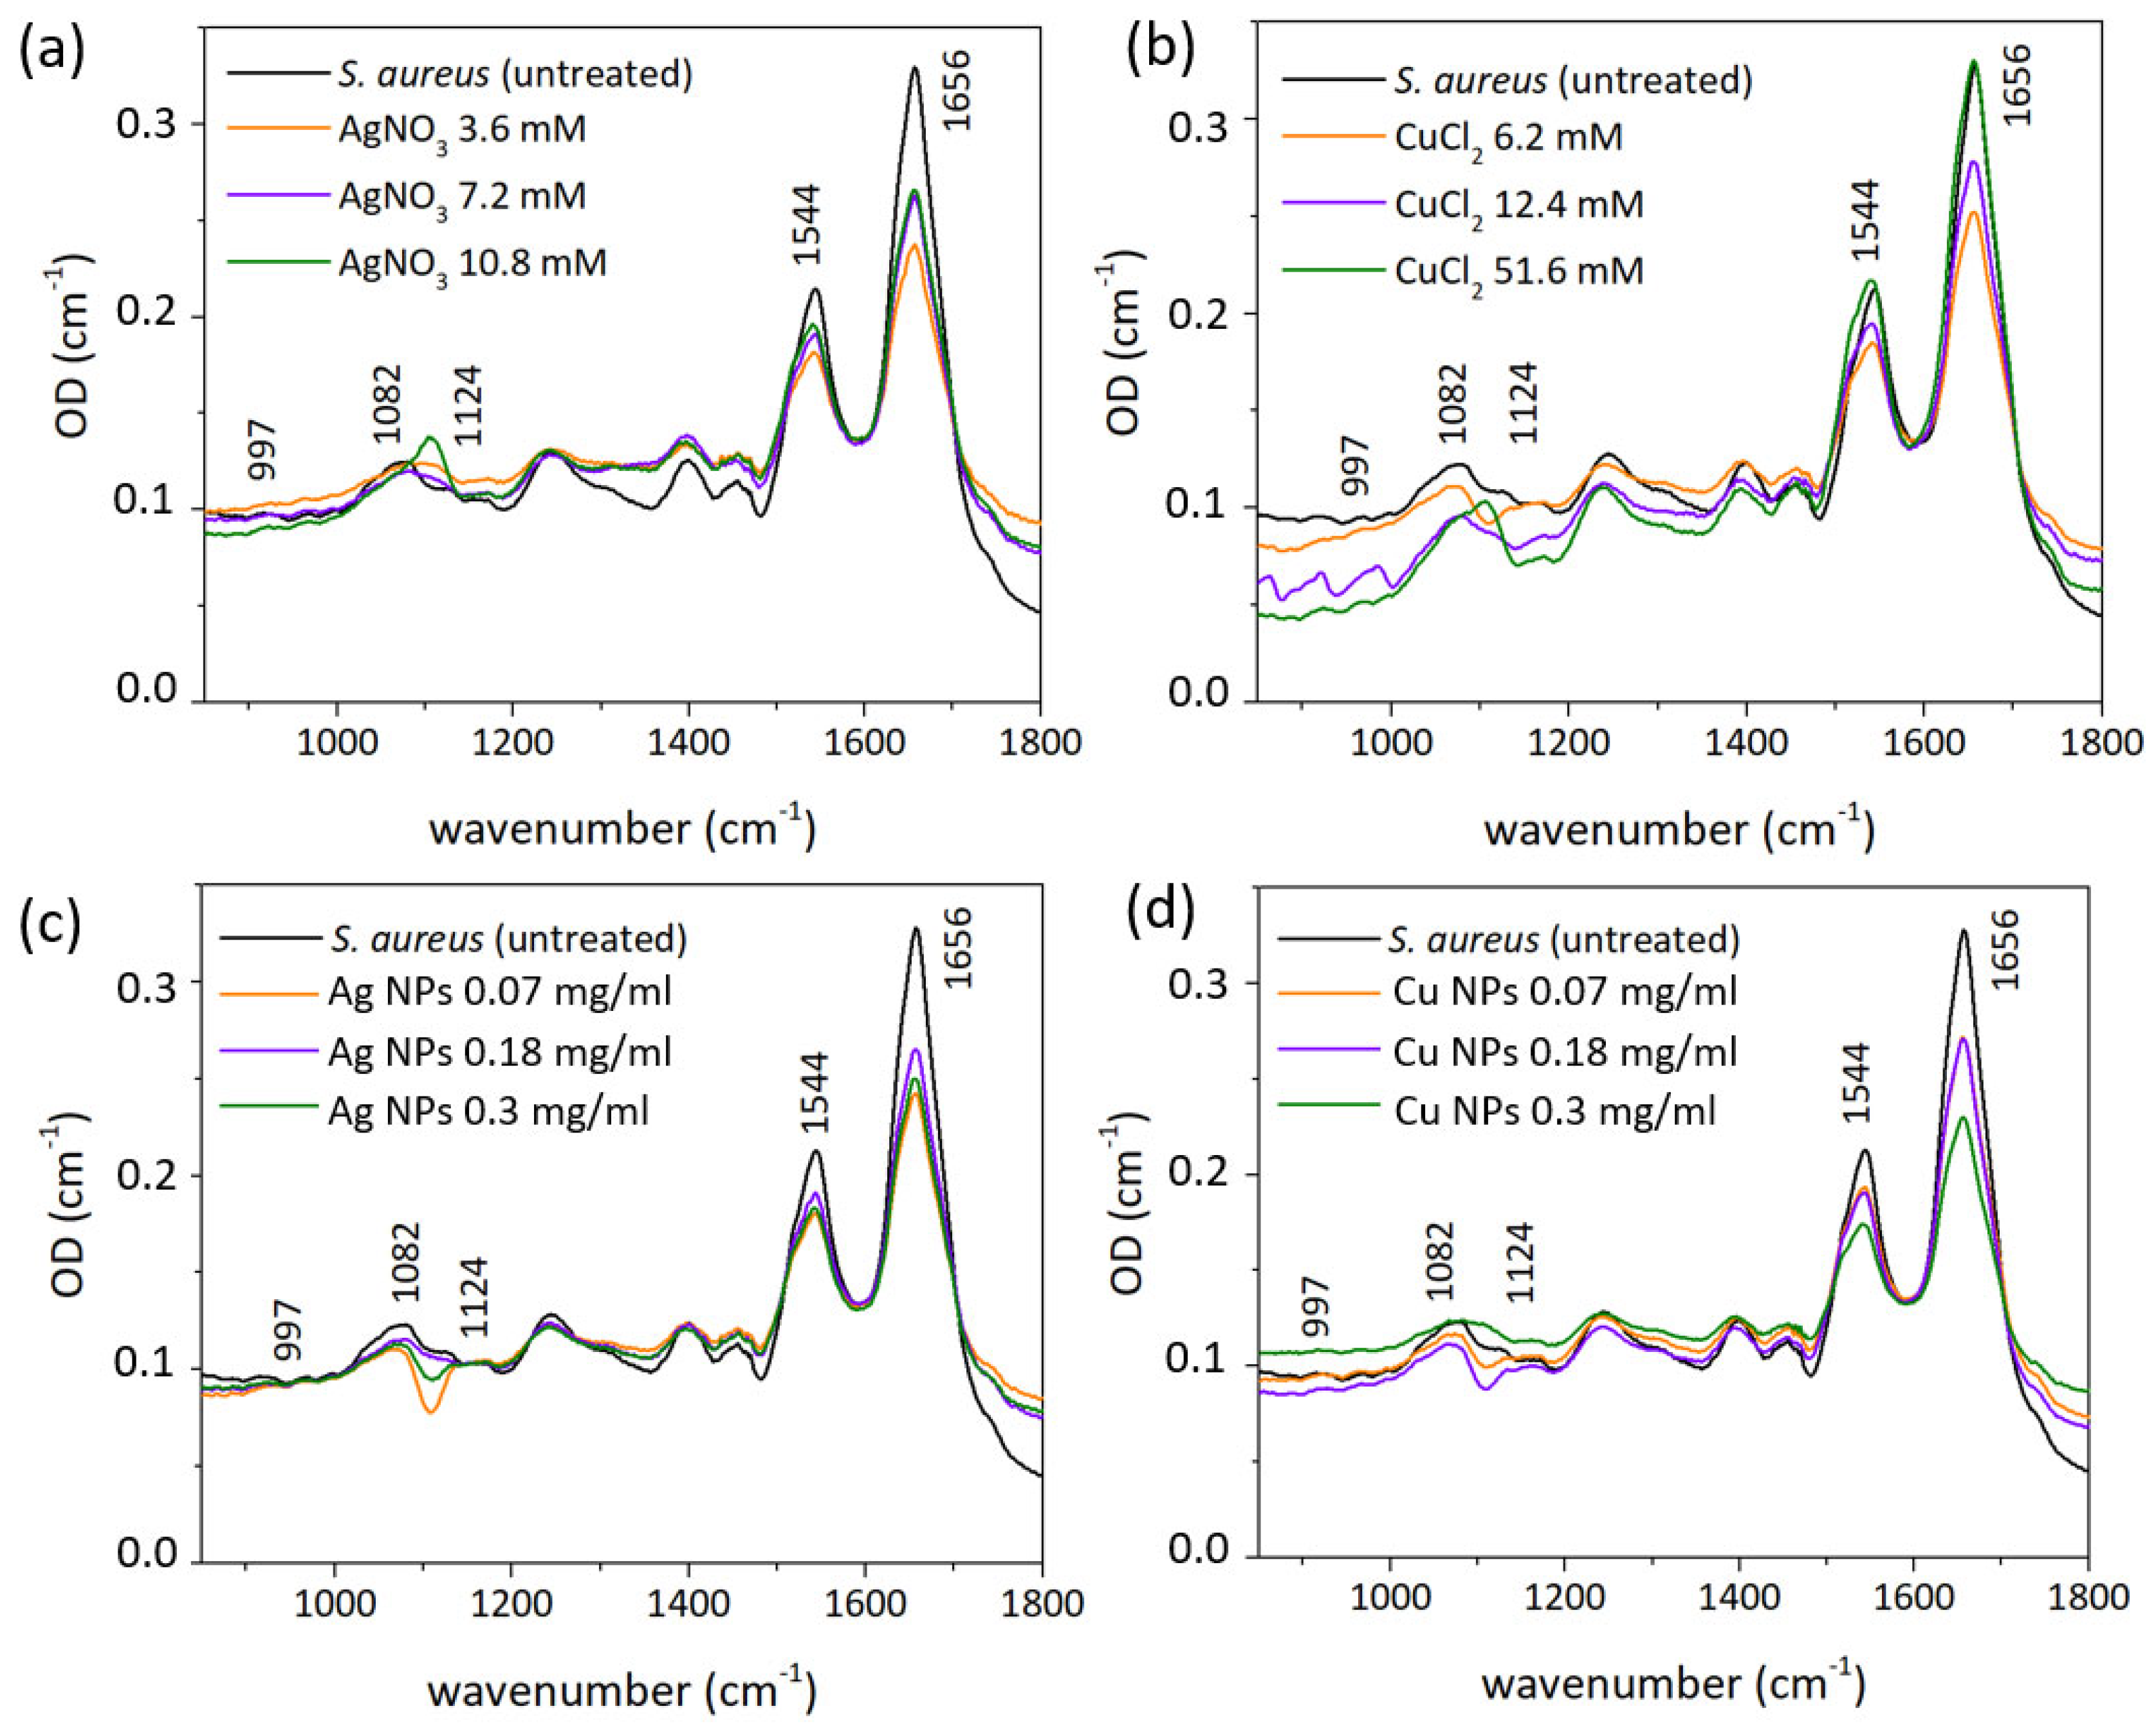
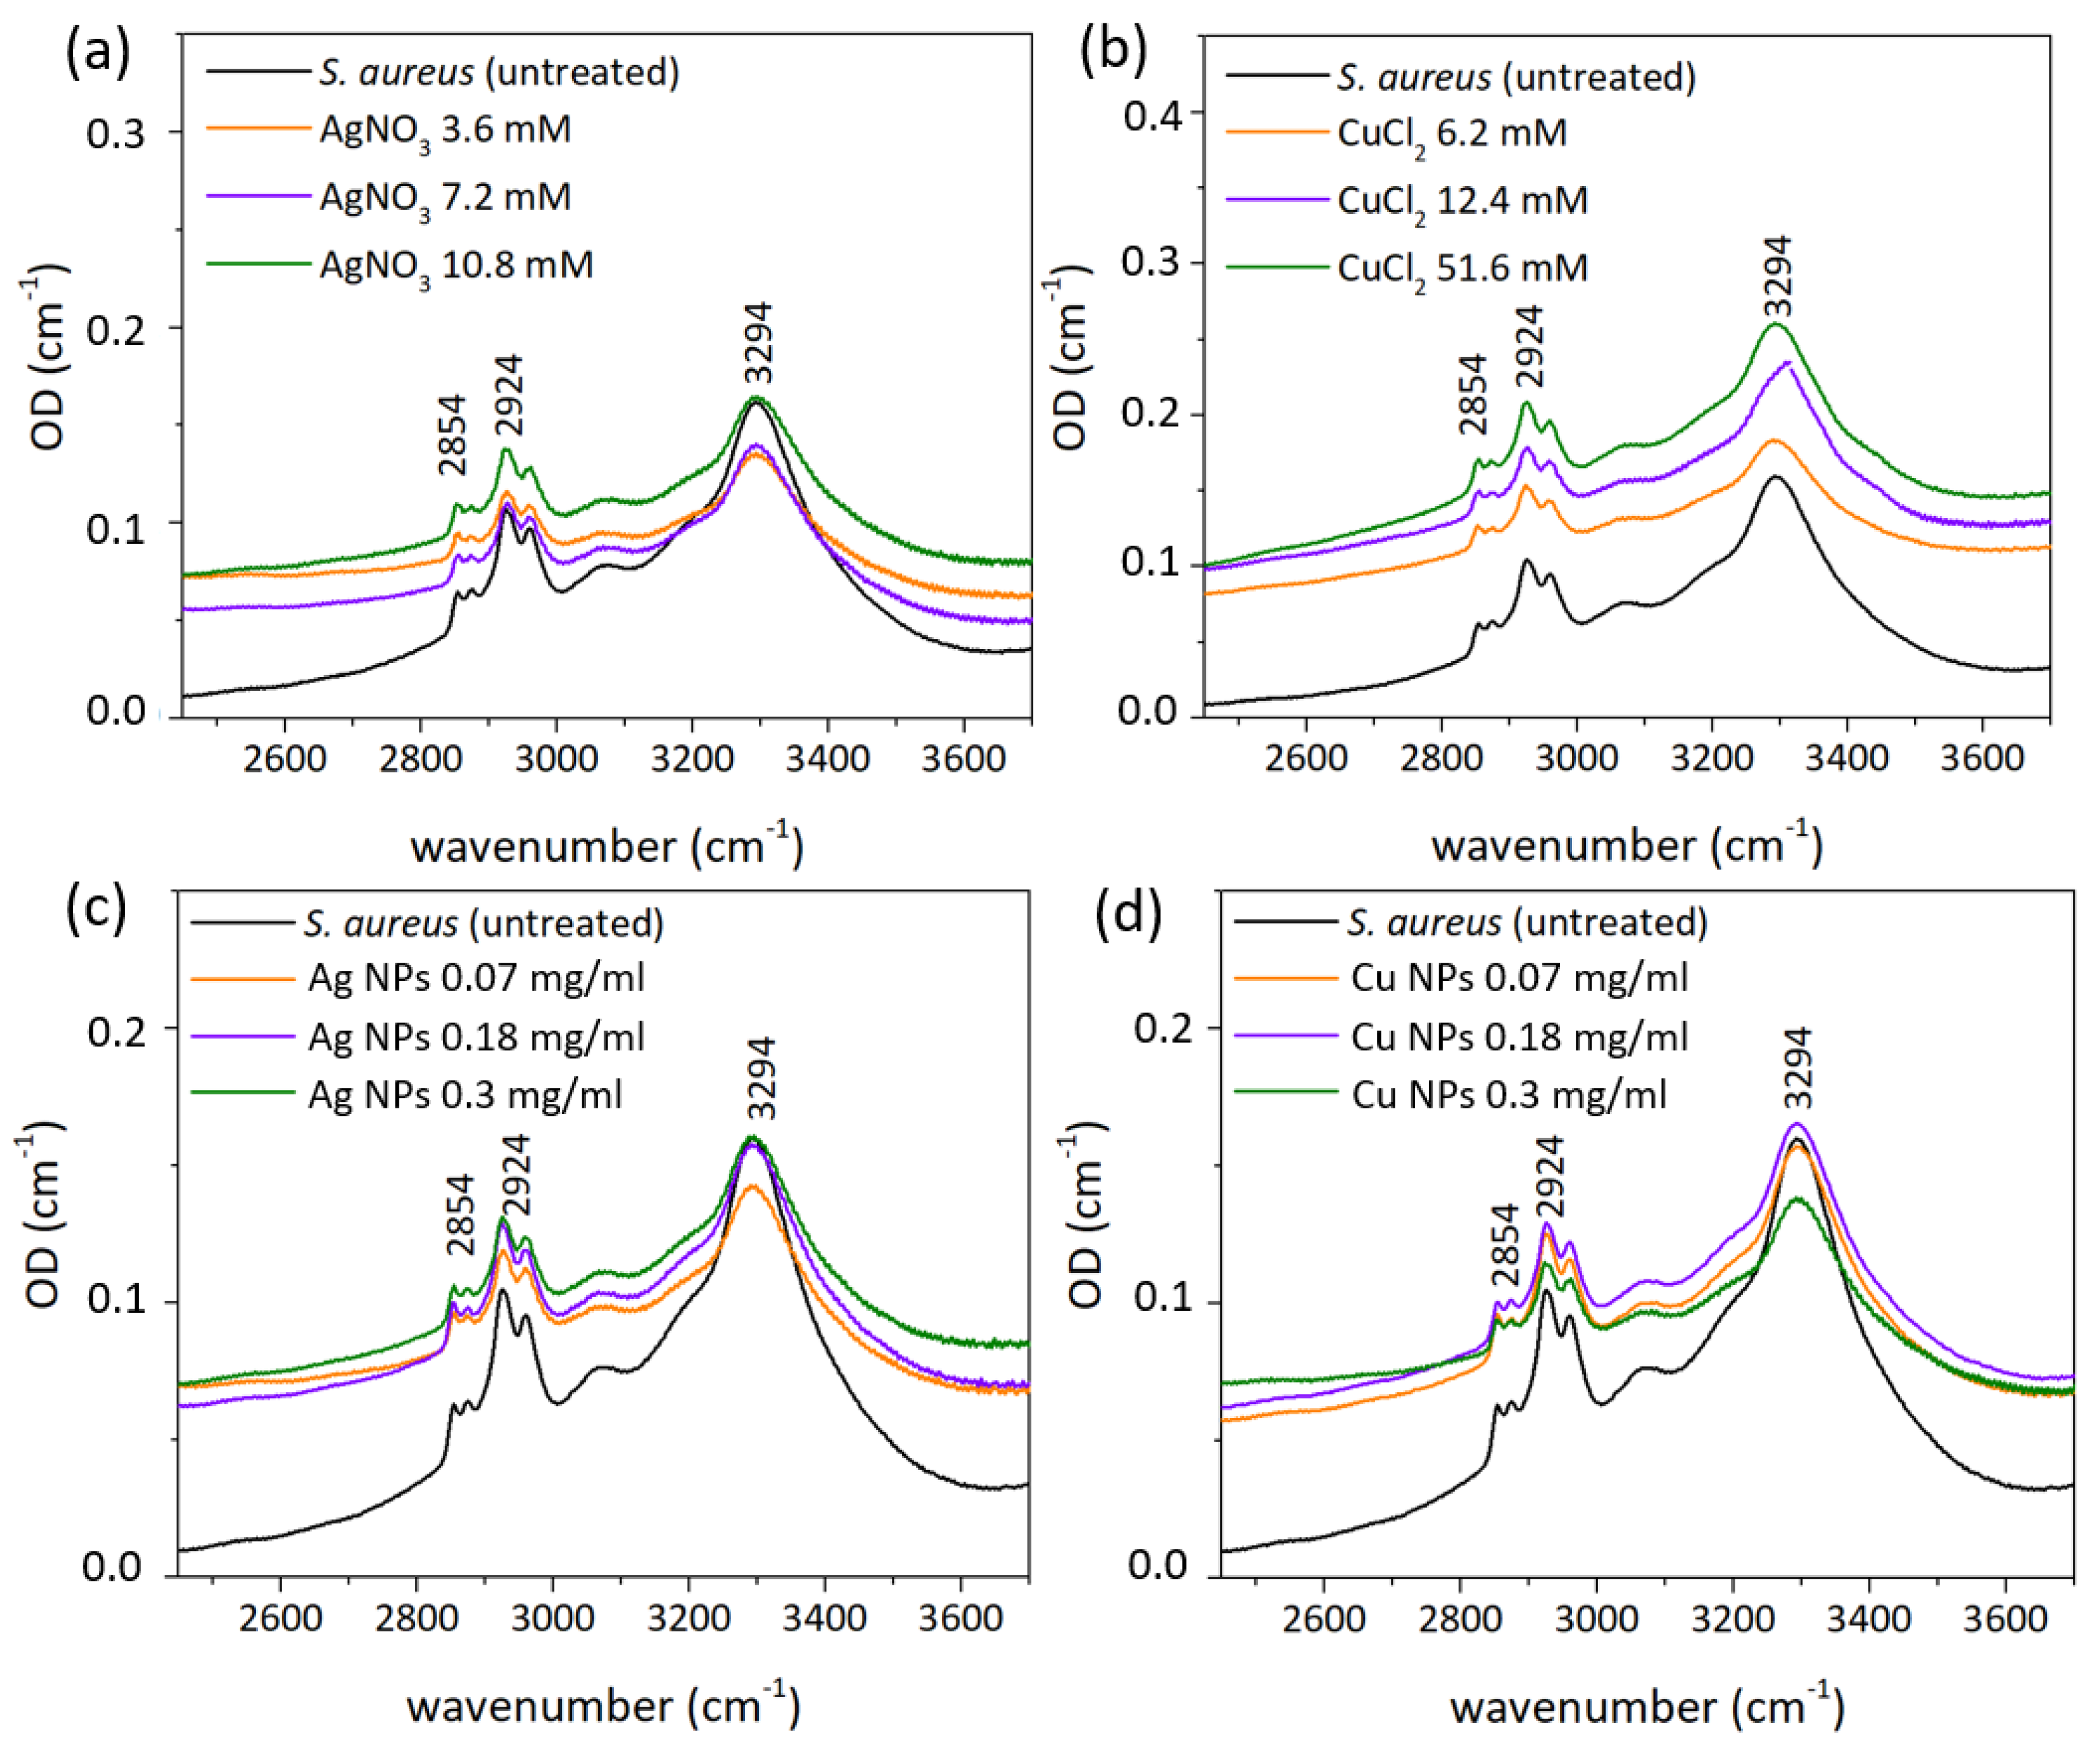
3.3. FT-IR Spectral Measurements

For bactericidal treatment, biofilms of S. aureus were grown for 24 h on Si substrates. Several samples were prepared: untreated S. aureus biofilm for control, and biofilms treated with AgNO3, Ag NPs, CuCl2 and Cu NPs solutions with different concentrations, three of each. Drops of each solution (10 μl) were put on grown biofilms and left for 20 min, during which the complete evaporation of liquid occurred. FT-IR spectra of all prepared samples are presented in Figure 7 (see Section 2 for detailed description of FT-IR measurements). Optical density values were calculated from the initial data by formula OD = lg(Tsubstrate/T).
Gram-positive bacteria have a thick layer of peptidoglycan (PG, 40–80% of the cell wall) [59]. Their primary structure consists of parallel polysaccharide chains of alternating N-acetylglucosamine (NAG) and N-acetylmuramic acid (NAM) residues joined by β(1 → 4) glycosidic bonds with parallel chains being linked by penta- or tetrapeptides. Gram-positive cell walls also contain teichoic acids that are covalently bound to the PG.
Band assignments are presented in Table 1. Spectra (Figure 7, Figure 8 and Figure 9) illustrate the presence of amide A band at ∼3300 cm−1 (N–H and O–H stretching vibration of proteins [60,61,62], 2957 cm−1 CH3 asymmetric stretching of fatty acids [63], 2930 cm−1 CH2 asymmetric stretching of lipids [64], 2875 cm−1 CH3 symmetric stretching of proteins [64], 2850 cm−1 CH2 symmetric stretching of lipids [64], 1737 cm−1 C-O stretching of triglycerides and cholesterol esters [64], 1693–1627 cm−1 amide I C-O stretching of proteins [65], 1541 cm−1 amide II: N–H bending, C–N stretching of proteins [65], 1452 cm−1 CH2 bending of lipids [66] 1390 cm−1 COO− symmetric stretching of amino acid side chains and fatty acids [64], 1300 cm−1 amide III band components of proteins [63,64], 1240 cm−1 PO2 asymmetric stretching of nucleic acids [64,65], 1110 cm−1 C-C symmetric stretching of ribose [67], 1082 cm−1 PO2 symmetric stretching of nucleic acids and phospholipids [62,64,65] 967 cm−1 RNA and DNA backbone C-C stretching of nucleic acids [62,67]).
The α-helix type of protein secondary structure is shown in spectra by a band at 1655–1658 cm−1 [68], β-sheets exhibit bands at 1637–1623 cm−1. Under normal growth conditions of bacterial cells, the maximum of the amide I band (1650–1660 cm−1) illustrates the predominance of α-helices among the secondary structure components of bacterial cellular proteins. Bands at 2854 cm−1 and 2924 cm−1 correspond to symmetrical and asymmetrical stretching vibrations of CH2 in lipids. Total band area corresponds to the concentration of the functional group, and its bandwidth reflects the conformational freedom and flexibility, and Lorentz fitting of the bands provided the necessary parameters (Table 2 and Table 3).
Bandwidths of amide I and II bands provide information about conformational freedom of proteins [61,62]. An increase in protein binding leads to the decrease of flexibility and the narrowing of the bandwidth, and in our work the amide II bandwidth narrows only in case of treatment of bacteria with CuCl2, which may indicate the binding of the proteins to Cu ions. The considerable broadening of amide bands in all other cases (up to ≈26%) may be caused by the rupture of the membrane. The areas of bands illustrate changes in the concentrations of molecules, to vibrations of which they correspond. Amide I and II bands area increased significantly in all cases except CuCl2 treatment (Table 3), which may indicate the increase of protein and polysaccharides concentrations [68].
Membrane lipids are represented in FT-IR spectra as bands at 2854 cm−1 and 2924 cm−1, which correspond to the symmetric and asymmetric CH2 stretching modes [69] and may indicate the disorder of the acyl chains of lipids and the interactions between lipids and membrane proteins. This frequency decrease by 2 cm−1 in AgNO3 indicates the transition of the membrane lipids from an ordered to a disordered state [70,71,72] and no shift in all other cases. Bands narrow after treatment with CuCl2 and Ag NPs (Table 2). Its broadening in all other cases may indicate a higher level of membrane fluidity [72]—the extent of molecular disorder and molecular motion within a lipid bilayer [69]. CH2 symmetric and asymmetric stretching bands’ areas decrease after treatment with almost all NPs and metal ion-containing solutions (Table 3), except some samples that were treated with CuCl2. This may indicate a lower concentration of saturated lipids [73] and an increase of membrane fluidity.
Amide A band at ≈3300 cm−1 demonstrates the increase of bandwidth in all treated samples except CuCl2 (Table 2) and overall decrease of area (Table 3).
C–C and PO2 symmetric stretching-related bands at ≈1124 cm−1 and 1082 cm−1 illustrate the vibrations of molecules in nucleic acids [73]. After treatment with metal ion-containing solutions (AgNO3, CuCl2) the peak at 1082 cm−1 disappeared, whereas the peak related to C–C vibrations shifted to a lower frequency (Table 1). After treatment with NPs, the inverse dynamic took place, where the peak at 1124 cm−1 disappeared and the PO2-related band shifted to a lower frequency.
The band at 966 cm−1 is related to RNA and DNA backbone C–C stretching of nucleic acids, and its presence in all spectra without frequency shifts indicates that DNA is in the β-helix form [67] but perhaps with reduced flexibility due to interaction with metal ions. The band at 996 cm−1 corresponds to ribose–phosphate main chain vibrations of the ribose skeleton [73] and is present in all spectra, both control and treated. Therefore, according to spectral data, DNA of bacteria are not modified or damaged.

3.4. Microbiological Tests

Culture of bacteria was implemented as follows: after treatment with NPs and metal-containing solutions, all substrates, including control, were moved to individual sterile testing tubes with saline solution and shaken intensively for 30 min. The resulting suspension was added to the nutrient medium and placed in a thermostat for 24 h at 37 °C. After that, the number of colony forming units (CFUs) was determined and compared with the control samples (Table 4, Figure A1).
Results of S. aureus treatment with Ag and Cu NPs, AgNO3 and CuCl2 solutions with different concentration (Table 4) demonstrate strong antibacterial effect.
In all cases, metal NPs and ion-containing solutions have shown 100% efficiency against S. aureus.
The increase of the membrane fluidity, shown in FT-IR spectra, and its subsequent rupture because of Ag and Cu NPs may be related to lipid peroxidation by ROS such as superoxide (O2) and hydroxyl radicals (•OH) [74]. Direct contact between NPs and the bacterial membrane is necessary [75,76,77], and while bacteria are known to have a negative charge, it is believed that the positive z-potential of NPs ensure the contact due to electrostatic attraction (Cu NPs in our experiments, Figure 5). Vice versa, electrostatic repulsion between bacterial cell and NPs with negative z-potential is assumed, although in our case negatively charged Ag NPs (Figure 5) still have a strong antibacterial effect. The detected increase of the membrane fluidity and the transition of the membrane lipids from an ordered to a disordered state, as well as NPs precipitation on the cell membranes (Figure 7 and Figure 8), confirms this implication.
It is believed that NPs toxicity on bacterial cells can be explained by NPs penetration in the cell. The largest pores in the bacterial membrane have a mean size of several nm [78,79], and NPs produced by laser ablation have a correspondingly small fraction (Figure 3a). According to TEM data, penetration of NPs and precipitates is observed (Figure 7 and Figure 8).
Cellular uptake of metallic ions leads to the subsequent disruption of DNA functionality and cell death [80,81,82]. It has also been suggested that Cu ions cause damage to phosphorus and sulfur-containing biomolecules, which leads to disruption of intracellular biochemical processes [13,14], which can explain the toxicity of metal salts on bacteria.
Summarizing all of the above, we can propose several individual mechanisms of S. aureus death due to Ag NPs, Cu NPs, AgNO3 and CuCl2.
(1)
Ag NPs release ions and ROS, which, due to the close contact of NPs and bacteria in a concentrated (0.3 mg/mL) colloidal solution, and despite negative z-potential, result in lipid peroxidation and cell destruction;
(2)
Cu NPs with high positive z-potential are adjacent to bacterial cells via electrostatic attraction and also cause ROS-related lipid peroxidation;
(3)
Ag NO3 solution forms precipitates on the bacterial cell surface, which lead to the mechanical rupture of the membrane and subsequent penetration of the precipitates in the emerged damaged spots, and to the complete destruction of the membrane and bacterial death;
(4)
Cu ions from the CuCl2 solution cause damage to phosphorus and sulfur-containing biomolecules, which leads to disruption of intracellular biochemical processes.

4. Conclusions

In this work, we studied the bactericidal effect of Ag and Cu NPs in colloidal form and AgNO3 and CuCl2 solutions with different concentrations on S. aureus strain. All samples were characterized by UV-vis spectroscopy, SEM, TEM and EDS. Bacterial inoculation showed considerable antibacterial activity of metal ions-containing salts regardless of their concentration. FT-IR spectroscopy analysis showed the broadening of the amide I and II bands, as well as CH2-related peak and its frequency decrease, which indicates the increase of membrane fluidity, leading to bacterial death. TEM analysis confirmed the penetration of Ag NPs and precipitates from AgNO3 solution. The main mechanisms of the antibacterial effect were proposed: Ag and Cu NPs release ions and ROS, which result in lipid peroxidation and cell destruction; AgNO3 solution forms precipitates on the bacterial cell surface, which lead to the mechanical rupture of the membrane and subsequent possible penetration of the precipitates in the emerged damaged spots, and to complete destruction of the membrane and bacterial death; Cu ions from the CuCl2 solution cause damage to phosphorus and sulfur-containing biomolecules, which leads to disruption of intracellular biochemical processes.

Author Contributions

Conceptualization, S.K.; writing—original draft preparation, I.S. (Irina Saraeva); writing—review and editing, S.K., E.T.; preparation of solutions, I.S. (Islam Sozaev) and V.S.; microbiological tests, E.T.; SEM visualization, S.S.; DLS analysis T.P.; XRD analysis, N.P.; TEM visualization, D.K., FT-IR analysis, R.K.; project administration, A.I., Y.Y. and A.S. All authors have read and agreed to the published version of the manuscript.

Funding

This research was funded by Ministry of science and higher education of the Russian Federation, grant number 075-15-2020-775.

Institutional Review Board Statement

Not applicable.

Informed Consent Statement

Not applicable.

Data Availability Statement

The data presented in this study are available on request from the corresponding author.

Conflicts of Interest

The authors declare no conflict of interest.

Appendix A

Figure A1. Photograph of S. aureus culture, treated with AgNO3 and CuCl2 solutions with different concentrations and the corresponding table with number of CFU after treatment. Data in the table represent the results for all used concentrations.
Nanomaterials 12 03857 g0a1

References

  1. Angenent, L.T.; Mau, M.; George, U.; Zahn, J.A.; Raskin, L. Effect of the presence of the antimicrobial tylosin in swine waste on anaerobic treatment. Wat. Res. 2008, 42, 2377–2384. [Google Scholar] [CrossRef] [PubMed]
  2. Kemper, N.; Färber, H.; Skutlarek, D.; Krieter, J. Analysis of antibiotic residues in liquid manure and leachate of dairy farms in northern Germany. Agr. Wat. Manag. 2008, 95, 1288–1292. [Google Scholar] [CrossRef]
  3. Chang, Q.; Wang, W.; Regev-Yochay, G.; Lipsitch, M.; Hanage, W.P. Antibiotics in agriculture and the risk to human health: How worried should we be? Evol. Appl. 2015, 8, 240–247. [Google Scholar] [CrossRef] [PubMed] [Green Version]
  4. Martínez, J.L. Antibiotics and antibiotic resistance genes in natural environments. Science 2008, 321, 365–367. [Google Scholar] [CrossRef] [PubMed]
  5. Aminov, R.I.; Mackie, R.I. Evolution and ecology of antibiotic resistance genes. FEMS Microbiol. Lett. 2007, 271, 147–161. [Google Scholar] [CrossRef] [PubMed]
  6. Vassallo, E.; Pedroni, M.; Silvetti, T.; Morandi, S.; Toffolatti, S.; Angella, G.; Brasca, M. Bactericidal performance of nanostructured surfaces by fluorocarbon plasma. Mat. Sci. Eng. C 2017, 80, 117–121. [Google Scholar] [CrossRef]
  7. Jiang, R.; Hao, L.; Song, L.; Tian, L.; Fan, Y.; Zhao, J.; Ren, L. Lotus-leaf-inspired hierarchical structured surface with non-fouling and mechanical bactericidal performances. Chem. Eng. J. 2020, 398, 125609. [Google Scholar] [CrossRef]
  8. Das, B.; Dash, S.K.; Mandal, D.; Ghosh, T.; Chattopadhyay, S.; Tripathy, S.; Roy, S. Green synthesized silver nanoparticles destroy multidrug resistant bacteria via reactive oxygen species mediated membrane damage. Arab. J. Chem. 2017, 10, 862–876. [Google Scholar] [CrossRef] [Green Version]
  9. Wang, D.; Zhao, L.; Ma, H.; Zhang, H.; Guo, L.H. Quantitative analysis of reactive oxygen species photogenerated on metal oxide nanoparticles and their bacteria toxicity: The role of superoxide radicals. Env. Sci. Tech. 2017, 51, 10137–10145. [Google Scholar] [CrossRef]
  10. Cho, K.H.; Park, J.E.; Osaka, T.; Park, S.G. The study of antimicrobial activity and preservative effects of nanosilver ingredient. Electrochim. Act. 2005, 51, 956–960. [Google Scholar] [CrossRef]
  11. Dakal, T.C.; Kumar, A.; Majumdar, R.S.; Yadav, V. Mechanistic basis of antimicrobial actions of silver nanoparticles. Front. Microbiol. 2016, 7, 1831. [Google Scholar] [CrossRef] [PubMed] [Green Version]
  12. Sharma, V.K.; Yngard, R.A.; Lin, Y. Silver nanoparticles: Green synthesis and their antimicrobial activities. Adv. Coll. Int. Sci. 2009, 145, 83–96. [Google Scholar] [CrossRef] [PubMed]
  13. Raffi, M.; Mehrwan, S.; Bhatti, T.M.; Akhter, J.I.; Hameed, A.; Yawar, W.; ul Hasan, M.M. Investigations into the antibacterial behavior of copper nanoparticles against Escherichia coli. Ann. Microbiol. 2010, 60, 75–80. [Google Scholar] [CrossRef]
  14. Esteban-Cubillo, A.; Pecharromán, C.; Aguilar, E.; Santarén, J.; Moya, J.S. Antibacterial activity of copper monodispersed nanoparticles into sepiolite. J. Mat. Sci. 2006, 41, 5208–5212. [Google Scholar] [CrossRef]
  15. Ruparelia, J.P.; Chatterjee, A.K.; Duttagupta, S.P.; Mukherji, S. Strain specificity in antimicrobial activity of silver and copper nanoparticles. Act. Biomater. 2008, 4, 707–716. [Google Scholar] [CrossRef]
  16. Theivasanthi, T.; Alagar, M. Studies of copper nanoparticles effects on micro-organisms. arXiv 2011, arXiv:1110.1372. [Google Scholar]
  17. Lin YS, E.; Vidic, R.D.; Stout, J.E.; Victor, L.Y. Individual and combined effects of copper and silver ions on inactivation of Legionella pneumophila. Wat. Res. 1996, 30, 1905–1913. [Google Scholar] [CrossRef]
  18. Yu-sen, E.L.; Vidic, R.D.; Stout, J.E.; McCartney, C.A.; Victor, L.Y. Inactivation of Mycobacterium avium by copper and silver ions. Wat. Res. 1998, 32, 1997–2000. [Google Scholar] [CrossRef]
  19. Yoon, K.Y.; Byeon, J.H.; Park, J.H.; Hwang, J. Susceptibility constants of Escherichia coli and Bacillus subtilis to silver and copper nanoparticles. Sci. Total Environ. 2007, 373, 572–575. [Google Scholar] [CrossRef]
  20. Jeon, H.J.; Yi, S.C.; Oh, S.G. Preparation and antibacterial effects of Ag–SiO2 thin films by sol–gel method. Biomaterials 2003, 24, 4921–4928. [Google Scholar] [CrossRef]
  21. Tang, S.; Zheng, J. Antibacterial activity of silver nanoparticles: Structural effects. Adv. Healthc. Mat. 2018, 7, 1701503. [Google Scholar] [CrossRef] [PubMed]
  22. Feng, Q.L.; Wu, J.; Chen, G.Q.; Cui, F.Z.; Kim, T.N.; Kim, J.O. A mechanistic study of the antibacterial effect of silver ions on Escherichia coli and Staphylococcus aureus. J. Biomed. Mat. Res. 2000, 52, 662–668. [Google Scholar] [CrossRef]
  23. Nanda, A.; Majeed, S. Comparative Analysis of Antibiotic Effect of AgNO3 and Silver Nanoparticles Synthesized from Penicillium fellutanum. Mat. Sci. Forum 2013, 760, 9–14. [Google Scholar] [CrossRef]
  24. Cervantes, C.; Gutierrez-Corona, F. Copper resistance mechanisms in bacteria and fungi. FEMS Microbiol. Rev. 1994, 14, 121–137. [Google Scholar] [CrossRef] [PubMed]
  25. Ohsumi, Y.; Kitamoto, K.; Anraku, Y. Changes induced in the permeability barrier of the yeast plasma membrane by cupric ion. J. Bacteriol. 1988, 170, 2676–2682. [Google Scholar] [CrossRef] [Green Version]
  26. Stohs, S.J.; Bagchi, D. Oxidative mechanisms in the toxicity of metal ions. Free Rad. Biol. Med. 1995, 18, 321–336. [Google Scholar] [CrossRef] [Green Version]
  27. Avery, S.V.; Howlett, N.G.; Radice, S. Copper toxicity towards Saccharomyces cerevisiae: Dependence on plasma membrane fatty acid composition. Appl. Environ. Microbiol. 1996, 62, 3960–3966. [Google Scholar] [CrossRef] [Green Version]
  28. Duffy, L.L.; Osmond-McLeod, M.J.; Judy, J.; King, T. Investigation into the antibacterial activity of silver, zinc oxide and copper oxide nanoparticles against poultry-relevant isolates of Salmonella and Campylobacter. Food Control 2018, 92, 293–300. [Google Scholar] [CrossRef]
  29. DeAlba-Montero, I.; Guajardo-Pacheco, J.; Morales-Sánchez, E.; Araujo-Martínez, R.; Loredo-Becerra, G.M.; Martínez-Castañón, G.A.; Ruiz, F.; Compeán Jasso, M.E. Antimicrobial properties of copper nanoparticles and amino acid chelated copper nanoparticles produced by using a soya extract. Bioinorg. Chem. Appl. 2017, 2017, 1064918. [Google Scholar] [CrossRef] [Green Version]
  30. Eckhardt, S.; Brunetto, P.S.; Gagnon, J.; Priebe, M.; Giese, B.; Fromm, K.M. Nanobio silver: Its interactions with peptides and bacteria, and its uses in medicine. Chem. Rev. 2013, 113, 4708–4754. [Google Scholar] [CrossRef] [Green Version]
  31. Sinha, R.; Karan, R.; Sinha, A.; Khare, S.K. Interaction and nanotoxic effect of ZnO and Ag nanoparticles on mesophilic and halophilic bacterial cells. Bioresour. Tech. 2011, 102, 1516–1520. [Google Scholar] [CrossRef] [PubMed]
  32. Guzman, M.; Dille, J.; Godet, S. Synthesis and antibacterial activity of silver nanoparticles against gram-positive and gram-negative bacteria. Nanomed. Nanotech. Biol. Med. 2012, 8, 37–45. [Google Scholar] [CrossRef]
  33. Matai, I.; Sachdev, A.; Dubey, P.; Kumar, S.U.; Bhushan, B.; Gopinath, P. Antibacterial activity and mechanism of Ag–ZnO nanocomposite on S. aureus and GFP-expressing antibiotic resistant E. coli. Coll. Surf. B Biointerfaces 2014, 115, 359–367. [Google Scholar] [CrossRef] [PubMed]
  34. Ghosh, D.; Pramanik, A.; Sikdar, N.; Ghosh, S.K.; Pramanik, P. Amelioration studies on optimization of low molecular weight chitosan nanoparticle preparation, characterization with potassium per sulfate and silver nitrate combined action with aid of drug delivery to tetracycline resistant bacteria. Int. J. Pharm. Sci. Drug Res. 2010, 2, 247–253. [Google Scholar]
  35. Ghosh, D.; Pramanik, A.; Sikdar, N.; Pramanik, P. Synthesis of low molecular weight alginic acid nanoparticles through persulfate treatment as effective drug delivery system to manage drug resistant bacteria. Biotechnol. Bioprocess Eng. 2011, 16, 383–392. [Google Scholar] [CrossRef]
  36. Wenning, M.; Breitenwieser, F.; Konrad, R.; Huber, I.; Busch, U.; Scherer, S. Identification and differentiation of food-related bacteria: A comparison of FTIR spectroscopy and MALDI-TOF mass spectrometry. J. Microbiol. Methods 2014, 103, 44–52. [Google Scholar] [CrossRef] [PubMed]
  37. Mariey, L.; Signolle, J.P.; Amiel, C.; Travert, J. Discrimination, classification, identification of microorganisms using FTIR spectroscopy and chemometrics. Vib. Spectrosc. 2001, 26, 151–159. [Google Scholar] [CrossRef]
  38. Zarnowiec, P.; Lechowicz, L.; Czerwonka, G.; Kaca, W. Fourier transform infrared spectroscopy (FTIR) as a tool for the identification and differentiation of pathogenic bacteria. Curr. Med. Chem. 2015, 22, 1710–1718. [Google Scholar] [CrossRef]
  39. Tang, M.; McEwen, G.D.; Wu, Y.; Miller, C.D.; Zhou, A. Characterization and analysis of mycobacteria and Gram-negative bacteria and co-culture mixtures by Raman microspectroscopy, FTIR, and atomic force microscopy. Anal. Bioanal. Chem. 2013, 405, 1577–1591. [Google Scholar] [CrossRef]
  40. Huleihel, M.; Pavlov, V.; Erukhimovitch, V. The use of FTIR microscopy for the evaluation of anti-bacterial agents activity. J. Photochem. Photobiol. B Biol. 2009, 96, 17–23. [Google Scholar] [CrossRef]
  41. Kudryashov, S.I.; Nastulyavichus, A.A.; Tolordava, E.R.; Kirichenko, A.N.; Saraeva, I.N.; Rudenko, A.A.; Romanova, Y.M.; Panarin, A.Y.; Ionin, A.A.; Itina, T.E. Surface-Enhanced IR-Absorption Microscopy of Staphylococcus aureus Bacteria on Bactericidal Nanostructured Si Surfaces. Molecules 2019, 24, 4488. [Google Scholar] [CrossRef] [PubMed] [Green Version]
  42. Los, D.A.; Murata, N. Membrane fluidity and its roles in the perception of Env. signals. Biochim. Biophys. Acta (BBA)-Biomembr. 2004, 1666, 142–157. [Google Scholar] [CrossRef] [PubMed]
  43. Wharton, C.W. Infrared spectroscopy of enzyme reaction intermediates. Nat. Prod. Rep. 2000, 17, 447–453. [Google Scholar] [CrossRef] [PubMed]
  44. Barth, A.; Zscherp, C. What vibrations tell about proteins. Q. Rev. Biophys. 2002, 35, 369–430. [Google Scholar] [CrossRef]
  45. Sondi, I.; Salopek-Sondi, B. Silver nanoparticles as antimicrobial agent: A case study on E. coli as a model for Gram-negative bacteria. J. Coll. Int. Sci. 2004, 275, 177–182. [Google Scholar] [CrossRef]
  46. Kreibig, U.; Vollmer, M. Optical Properties of Metal Clusters; Springer: Berlin, Germany, 1995. [Google Scholar] [CrossRef]
  47. Szymańska-Chargot, M.; Gruszecka, A.; Smolira, A.; Bederski, K.; Głuch, K.; Cytawa, J.; Michalak, L. Formation of nanoparticles and nanorods via UV irradiation of AgNO3 solutions. J. Alloys Compd. 2009, 486, 66–69. [Google Scholar] [CrossRef]
  48. Henglein, A.; Meisel, D. Spectrophotometric observations of the adsorption of organosulfur compounds on Coll.al silver nanoparticles. J. Phys. Chem. B 1998, 102, 8364–8366. [Google Scholar] [CrossRef]
  49. Wu, S.H.; Chen, D.H. Synthesis of high-concentration Cu nanoparticles in aqueous CTAB solutions. J. Coll. Int. Sci. 2004, 273, 165–169. [Google Scholar] [CrossRef]
  50. Higuchi, M.; Imoda, D.; Hirao, T. Redox Behavior of Polyaniline− Transition Metal Complexes in Solution. Macromolecules 1996, 29, 8277–8279. [Google Scholar] [CrossRef]
  51. Salavati-Niasari, M.; Davar, F. Synthesis of copper and copper (I) oxide nanoparticles by thermal decomposition of a new precursor. Mat. Lett. 2009, 63, 441–443. [Google Scholar] [CrossRef]
  52. Babu, S.A.; Prabu, H.G. Synthesis of AgNPs using the extract of Calotropis procera flower at room temperature. Mat. Lett. 2011, 65, 1675–1677. [Google Scholar] [CrossRef]
  53. Shamaila, S.; Wali, H.; Sharif, R.; Nazir, J.; Zafar, N.; Rafique, M.S. Antibacterial effects of laser ablated Ni nanoparticles. Appl. Phys. Lett. 2013, 103, 153701. [Google Scholar] [CrossRef]
  54. Romaniuk, J.A.; Cegelski, L. Peptidoglycan and teichoic acid levels and alterations in Staphylococcus aureus by cell-wall and whole-cell nuclear magnetic resonance. Biochemistry 2018, 57, 3966–3975. [Google Scholar] [CrossRef] [PubMed]
  55. Vernon-Parry, K.D. Scanning electron microscopy: An introduction. III-Vs Rev. 2000, 13, 40–44. [Google Scholar] [CrossRef] [Green Version]
  56. Newbury, D.E.; Ritchie, N.W. Elemental mapping of microstructures by scanning electron microscopy-energy dispersive X-ray spectrometry (SEM-EDS): Extraordinary Adv. with the silicon drift detector (SDD). J. Anal. At. Spectrom. 2013, 28, 973–988. [Google Scholar] [CrossRef]
  57. Jabbari, E.; Peppas, N.A. Quantitative measurement of interdiffusion at polymer–polymer interfaces with TEM/EDS and EELS. J. Appl. Polym. Sci. 1995, 57, 775–779. [Google Scholar] [CrossRef]
  58. Stevie, F.A.; Vartuli, C.B.; Giannuzzi, L.A.; Shofner, T.L.; Brown, S.R.; Rossie, B.; Hillion, F.; Mills, R.H.; Antonell, M.; Irwin, R.B.; et al. Application of focused ion beam lift-out specimen preparation to TEM, SEM, STEM, AES and SIMS analysis. Surf. Interface Anal. 2001, 31, 345–351. [Google Scholar] [CrossRef]
  59. Davis, R.; Mauer, L.J. Fourier transform infrared (FT-IR) spectroscopy: A rapid tool for detection and analysis of foodborne pathogenic bacteria. In Current Research, Technology and Education Topics in Applied Microbiology and Microbial Biotechnology; Formatex Research Center: Badajoz, Spain, 2010; Volume 2, pp. 1582–1594. Available online: https://d1wqtxts1xzle7.cloudfront.net/61513069/Davis___Mauer__201020191214-15260-1c3stns-with-cover-page-v2.pdf?Expires=1667211919&Signature=OyHGC9yeSIZ2xAY~U6Bp9tyI9p4cu039Ba7yEsDOyXAGI-~qfWGvgpfI~9Bbc5r~kGiBg4sSzHyethXnWiYyECu6EnsxkR4-~KQSyzApAH3d4m6CoVe9VmlxKiH-q6JIOOClmuoYajUgKC6o70oUnYq0UvnMYaq3rkmRC0d~Ei06haIKPTmK9DdP2Ltl0uEpHscZTMEmLEF5VsmmEEh2y82Ik9p7ZMJgIpmIFOgLDNjExPf3imWFx0BxJOxnYMW5M9~1NKcIGvMwDQTsc5MuxA7GpfF3PrIH4z1jo4MU3j3x-GOO3wfecvuLzljlVxuTaJTgXY166oAnlypqT~wCEQ__&Key-Pair-Id=APKAJLOHF5GGSLRBV4ZA (accessed on 24 October 2022).
  60. Melin, A.M.; Perromat, A.; Déléris, G. Pharmacologic application of Fourier transform IR spectroscopy: In vivo toxicity of carbon tetrachloride on rat liver. Biopolym. Orig. Res. Biomol. 2000, 57, 160–168. [Google Scholar] [CrossRef]
  61. Gorgulu, S.T.; Dogan, M.; Severcan, F. The characterization and differentiation of higher plants by Fourier transform infrared spectroscopy. Appl. Spectrosc. 2007, 61, 300–308. [Google Scholar] [CrossRef]
  62. Garip, S.; Gozen, A.C.; Severcan, F. Use of Fourier transform infrared spectroscopy for rapid comparative analysis of Bacillus and Micrococcus isolates. Food Chem. 2009, 113, 1301–1307. [Google Scholar] [CrossRef]
  63. Maquelin, K.; Kirschner, C.; Choo-Smith, L.P.; van den Braak, N.; Endtz, H.P.; Naumann, D.; Puppels, G.J. Identification of medically relevant microorganisms by vibrational spectroscopy. J. Microbiol. Methods 2002, 51, 255–271. [Google Scholar] [CrossRef]
  64. Naumann, D. FT-infrared and FT-Raman spectroscopy in Biomed. Res. Appl. Spectrosc. Rev. 2001, 36, 239–298. [Google Scholar] [CrossRef]
  65. Ozek, N.S.; Bal, I.B.; Sara, Y.; Onur, R.; Severcan, F. Structural and functional characterization of simvastatin-induced myotoxicity in different skeletal muscles. Biochim. Biophys. Acta (BBA)-Gen. Subj. 2014, 1840, 406–415. [Google Scholar] [CrossRef] [PubMed]
  66. Kamnev, A.A. FTIR spectroscopic studies of bacterial cellular responses to Env. factors, plant-bacterial interactions and signalling. Spectroscopy 2008, 22, 83–95. [Google Scholar] [CrossRef]
  67. Banyay, M.; Sarkar, M.; Gräslund, A. A library of IR bands of nucleic acids in solution. Biophys. Chem. 2003, 104, 477–488. [Google Scholar] [CrossRef]
  68. Jackson, M.; Sowa, M.G.; Mantsch, H.H. Infrared spectroscopy: A new frontier in medicine. Biophys. Chem. 1997, 68, 109–125. [Google Scholar] [CrossRef]
  69. Szalontai, B.; Nishiyama, Y.; Gombos, Z.; Murata, N. Membrane dynamics as seen by Fourier transform infrared spectroscopy in a cyanobacterium, Synechocystis PCC 6803: The effects of lipid unsaturation and the protein-to-lipid ratio. Biochim. Biophys. Acta (BBA)-Biomembr. 2000, 1509, 409–419. [Google Scholar] [CrossRef] [Green Version]
  70. Severcan, F.; Cannistraro, S. A spin label ESR and saturation transfer ESR study of alpha-tocopherol containing model membranes. Chem. Phys. Lipids 1990, 53, 17–26. [Google Scholar] [CrossRef]
  71. Boyar, H.; Boyar, F. Oestrogen-phospholipid membrane interactions: An FTIR study. J. Mol. Struct. 1997, 408/409, 269–272. [Google Scholar] [CrossRef]
  72. Cakmak, G.; Togan, I.; Severcan, F. 17-Estradiol induced compositional, structural and functional changes in rainbow trout liver, revealed by FT-IR spectroscopy: A comparative study with nonylphenol. Aquat. Toxicol. 2006, 77, 53–63. [Google Scholar] [CrossRef]
  73. Kardas, M.; Gozen, A.G.; Severcan, F. FTIR spectroscopy offers hints towards widespread molecular changes in cobalt-acclimated fresh water. bacteria. Aquat. Toxicol. 2014, 155, 15–23. [Google Scholar] [CrossRef] [PubMed]
  74. Lovrić, J.; Cho, S.J.; Winnik, F.M.; Maysinger, D. Unmodified cadmium telluride quantum dots induce reactive oxygen species formation leading to multiple organelle damage and cell death. Chem. Biol. 2005, 12, 1227–1234. [Google Scholar] [CrossRef] [Green Version]
  75. Kang, S.; Pinault, M.; Pfefferle, L.D.; Elimelech, M. Single-walled carbon nanotubes exhibit strong antimicrobial activity. Langmuir 2007, 23, 8670–8673. [Google Scholar] [CrossRef] [PubMed]
  76. Thill, A.; Zeyons, O.; Spalla, O.; Chauvat, F.; Rose, J.; Auffan, M.; Flank, A.M. Cytotoxicity of CeO2 nanoparticles for Escherichia coli. Physico-Chemical. insight of the cytotoxicity mechanism. Env. Sci. Tech. 2006, 40, 6151–6156. [Google Scholar] [CrossRef] [PubMed]
  77. Stoimenov, P.K.; Klinger, R.L.; Marchin, G.L.; Klabunde, K.J. Metal oxide nanoparticles as bactericidal agents. Langmuir 2002, 18, 6679–6686. [Google Scholar] [CrossRef]
  78. Thayer, M.M.; Flaherty, K.M.; McKay, D.B. Three-dimensional structure of the elastase of Pseudomonas aeruginosa at 1.5-A resolution. J. Biol. Chem. 1991, 266, 2864–2871. [Google Scholar] [CrossRef]
  79. Bitter, W.; Koster, M.; Latijnhouwers, M.; De Cock, H.; Tommassen, J. Formation of oligomeric rings by XcpQ and PilQ, which are involved in protein transport across the outer membrane of Pseudomonas aeruginosa. Mol. Microbiol. 1998, 27, 209–219. [Google Scholar] [CrossRef]
  80. Kim, J.S.; Kuk, E.; Yu, K.N.; Kim, J.H.; Park, S.J.; Lee, H.J.; Cho, M.H. Antimicrobial effects of silver nanoparticles. Nanomed. Nanotech. Biol. Med. 2007, 3, 95–101. [Google Scholar] [CrossRef]
  81. Lok, C.N.; Ho, C.M.; Chen, R.; He, Q.Y.; Yu, W.Y.; Sun, H.; Che, C.M. Proteomic analysis of the mode of antibacterial action of silver nanoparticles. J. Proteome Res. 2006, 5, 916–924. [Google Scholar] [CrossRef]
  82. Morones, J.R.; Elechiguerra, J.L.; Camacho, A.; Holt, K.; Kouri, J.B.; Ramírez, J.T.; Yacaman, M.J. The bactericidal effect of silver nanoparticles. Nanotechnology 2005, 16, 2346. [Google Scholar] [CrossRef]
Figure 1. UV−vis spectra of (a) Ag NP colloids and (b) AgNO3 solutions with different concentrations; SEM and EDS characterization of AgNO3 solution (c,e) and Ag NP colloid (d,f), dried on a Si substrate. Insets on (e,f): tables of elements.
Nanomaterials 12 03857 g001
Figure 2. UV−vis spectra of (a) Cu NP colloid and (b) CuCl2 solutions with different concentrations. SEM and EDS characterization of CuCl2 solution (c,e) and Cu NP colloid (d,f) dried on a Si substrate. Insets on (e,f): tables of elements.
Nanomaterials 12 03857 g002
Figure 3. (a) DLS size distribution of Ag and Cu NPs with corresponding Z-potential values (green, red and purple lines represent the results of three measurements of the same samples); (b) XRD spectra of Ag (purple line) and Cu (orange line) NPs; (c) data of XRD pattern of Ag and Cu NPs.
Nanomaterials 12 03857 g003
Figure 4. TEM image of S. aureus cells after treatment with AgNO3 10.8 mM-solution, distribution of elements in the sample, acquired by EDS and HAADF image.
Nanomaterials 12 03857 g004
Figure 5. TEM image of S. aureus cells after treatment with Ag NPs colloid (concentration 1 mg/mL), distribution of elements in the sample, acquired by EDS and HAADF image.
Nanomaterials 12 03857 g005
Figure 6. Enlarged TEM images of S. aureus cell after treatment with (a) Ag NPs solution; (c) treated with AgNO3and; and (b,d) the corresponding EDS map of Ag content in (a,c). Yellow shapes highlight NPs, visible on TEM images but absent in EDS maps. Red shapes highlight NPs visible both in TEM image and EDS maps. See text for details.
Nanomaterials 12 03857 g006
Figure 7. FT−IR optical density (OD) spectra of S. aureus before and after treatment with (a) AgNO3, (b) CuCl2, (c) Ag NPs, and (d) Cu NPs solutions with different concentrations.
Nanomaterials 12 03857 g007
Figure 8. Selected regions (850–1800 cm−1) of FT−IR spectra of S. aureus before and after treatment with (a) AgNO3, (b) CuCl2, (c) Ag NPs, and (d) Cu NPs solutions with different concentrations.
Nanomaterials 12 03857 g008
Figure 9. Selected regions (2450–3700 cm−1) of FT−IR spectra of S. aureus before and after treatment with (a) AgNO3, (b) CuCl2, (c) Ag NPs, and (d) Cu NPs solutions with different concentrations.
Nanomaterials 12 03857 g009
Table 1. IR band assignments of bacteria (treated with antibacterial agents and control).
Functional GroupsFrequency (cm−1)
ControlAgNO3-TreatedAg NP-TreatedCuCl2-TreatedCu NP-Treated
Amide A32943294329432943294
CH2 asym str29242922292529252925
CH2 sym str28542852285428542852
Amide I16561656165516551655
Amide II15441541154115431541
C-C11241104-1106-
PO21082-1082-1085
ribose skeleton997997997997997
Table 2. Differences in bandwidths of peaks between control and treated bacteria.
Functional GroupsBandwidth (cm−1)%Change %Change %Change %Change
ControlAgNO3-Treated Ag NP-Treated CuCl2-Treated Cu NP-Treated
Amide I53.5 ± 2.3561.39 ± 1.83+14.7563.28 ± 1.67+18.2855.69 ± 1.28+4.0964.17 ± 1.64+19.94
Amide II57.19 ± 2.7464.59 ± 1.83+12.9468.54 ± 1.34+19.8552.71 ± 1.53−7.8370.30 ± 1.45+22.92
CH2 sym str8.82 ± 2.0410.18 ± 1.81+15.48.82 ± 1.79011.54 ± 2.63+30.848.56 ± 1.75−2.95
CH2 asym str33.5 ± 1.7533.76 ± 1.43+0.833.81 ± 1.64+0.9330.54 ± 2.22−8.8434.46 ± 1.52+2.09
Amide A156.24 ± 2.42164.21 ± 2.33+5.11157.32 ± 1.96+0.69147.59 ± 2.2−5.54173.07 ± 2.19+10.77
Table 3. Differences in area of peaks between control and treated bacteria.
Functional GroupsArea (a.u.)%Change %Change %Change %Change
ControlAgNO3-Treated Ag NP-Treated CuCl2-Treated Cu NP-Treated
Amide I21.51 ± 0.3617.48 ± 0.17−18.7417.12 ± 0.15−20.4122.43 ± 0.4+4.2814.47 ± 0.12−32.73
Amide II11.6 ± 0.3810.57 ± 0.1−8.8810.66 ± 0.17−8.110.95 ± 0.4−5.69.48 ± 0.14−18.28
CH2 sym str0.18 ± 0.040.18 ± 0.0400.13 ± 0.03−27.80.24 ± 0.06+33.340.1 ± 0.02−44.4
CH2 asym str2.51 ± 0.181.96 ± 0.1−21.911.63 ± 0.1−35.062.04 ± 0.24+18.731.42 ± 0.08−43.43
Amide A29.35 ± 0.7120.68 ± 0.48−29.5417.92 ± 0.33−38.9425.52 ± 0.58−13.0518.01 ± 0.35−38.64
Table 4. Number of S. aureus CFU after treatment with Ag, Cu NPs, AgNO3 and CuCl2 solutions with different concentrations. Data in the table represent the results for all used concentrations.
S. aureus (CFU)
control108
AgNO30
CuCl20
Ag NPs0
Cu NPs0
Publisher’s Note: MDPI stays neutral with regard to jurisdictional claims in published maps and institutional affiliations.

