
New Conjugates Based on AIS/ZnS Quantum Dots and Aluminum Phthalocyanine Photosensitizer: Synthesis, Properties and Some Perspectives


 , , , ,
Abstract
:1. Introduction
2. Materials and Methods
2.1. QDs Synthesis
2.2. Used Equipment
3. Results and Discussion
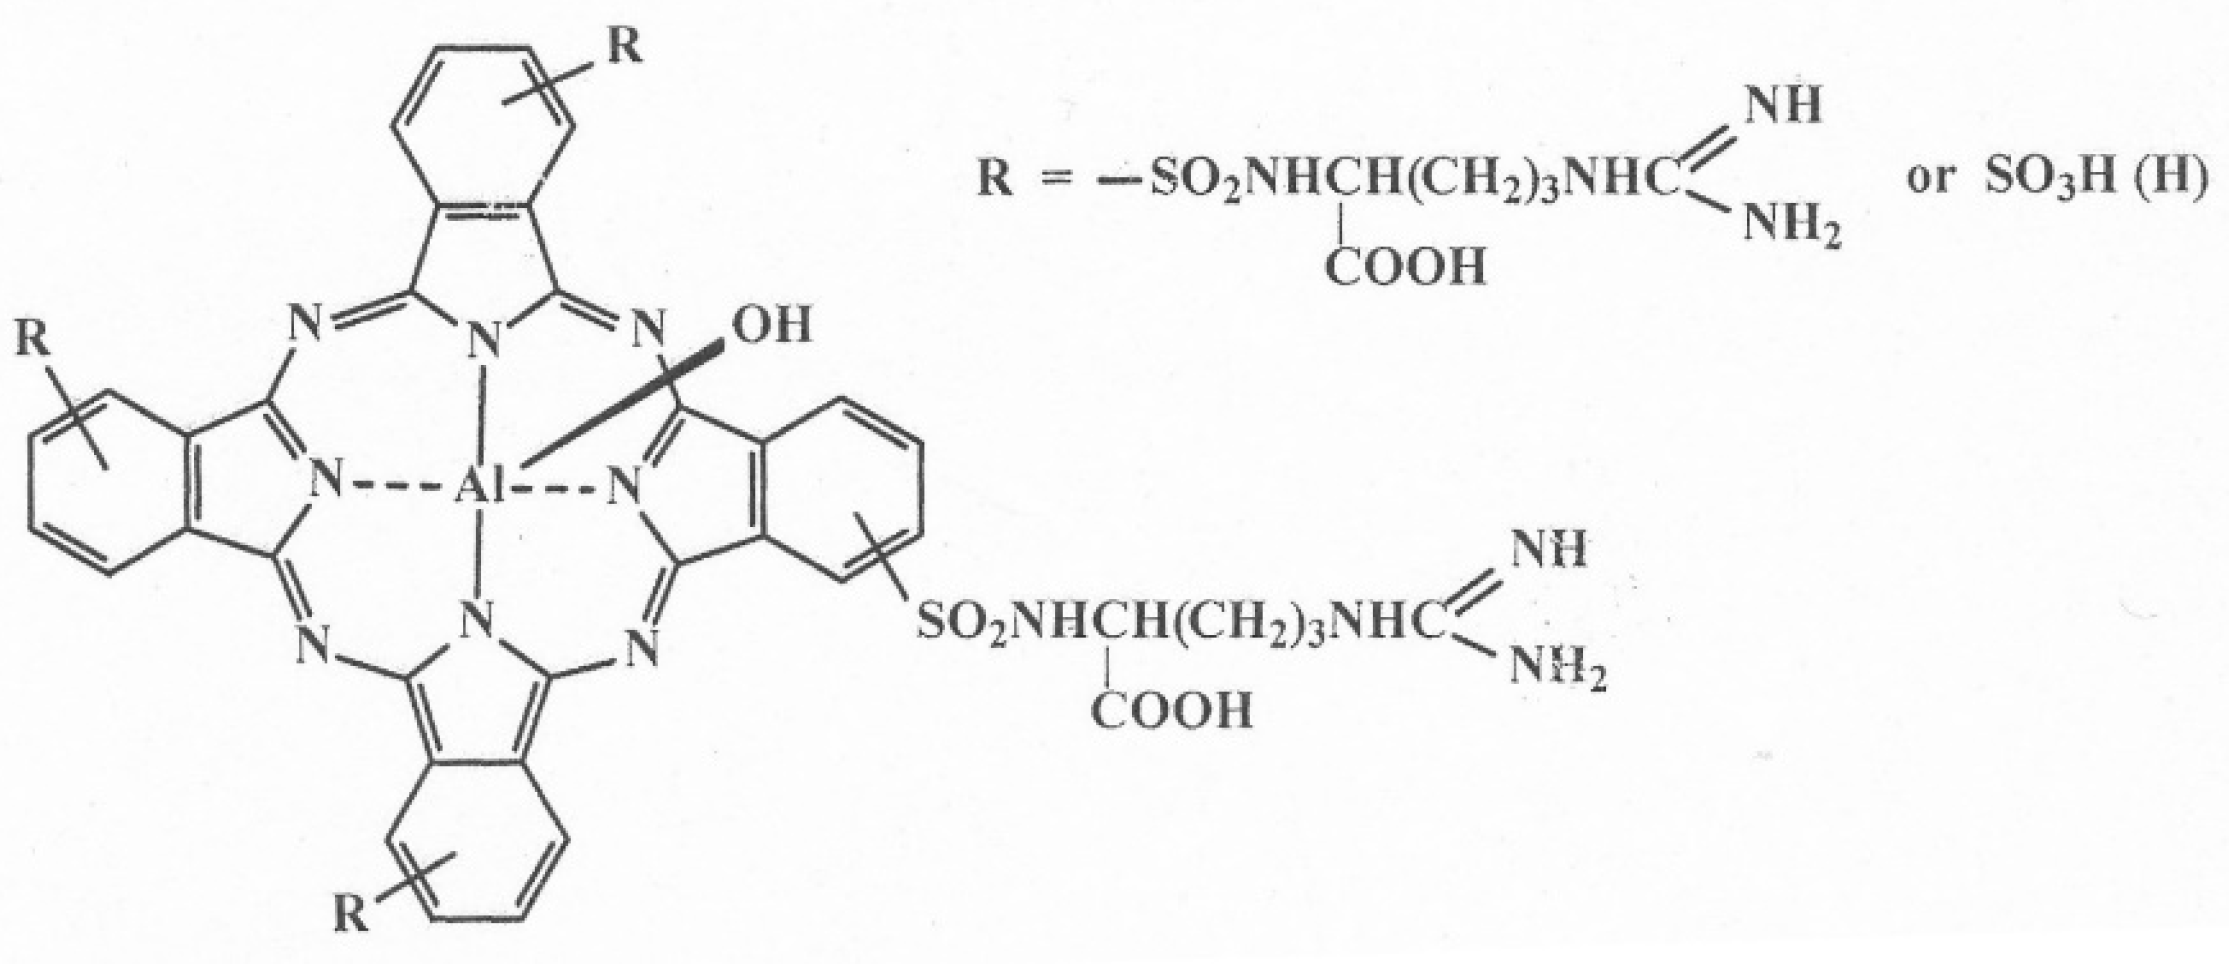
3.1. Conjugation of AIS/ZnS QDs and PS Molecules
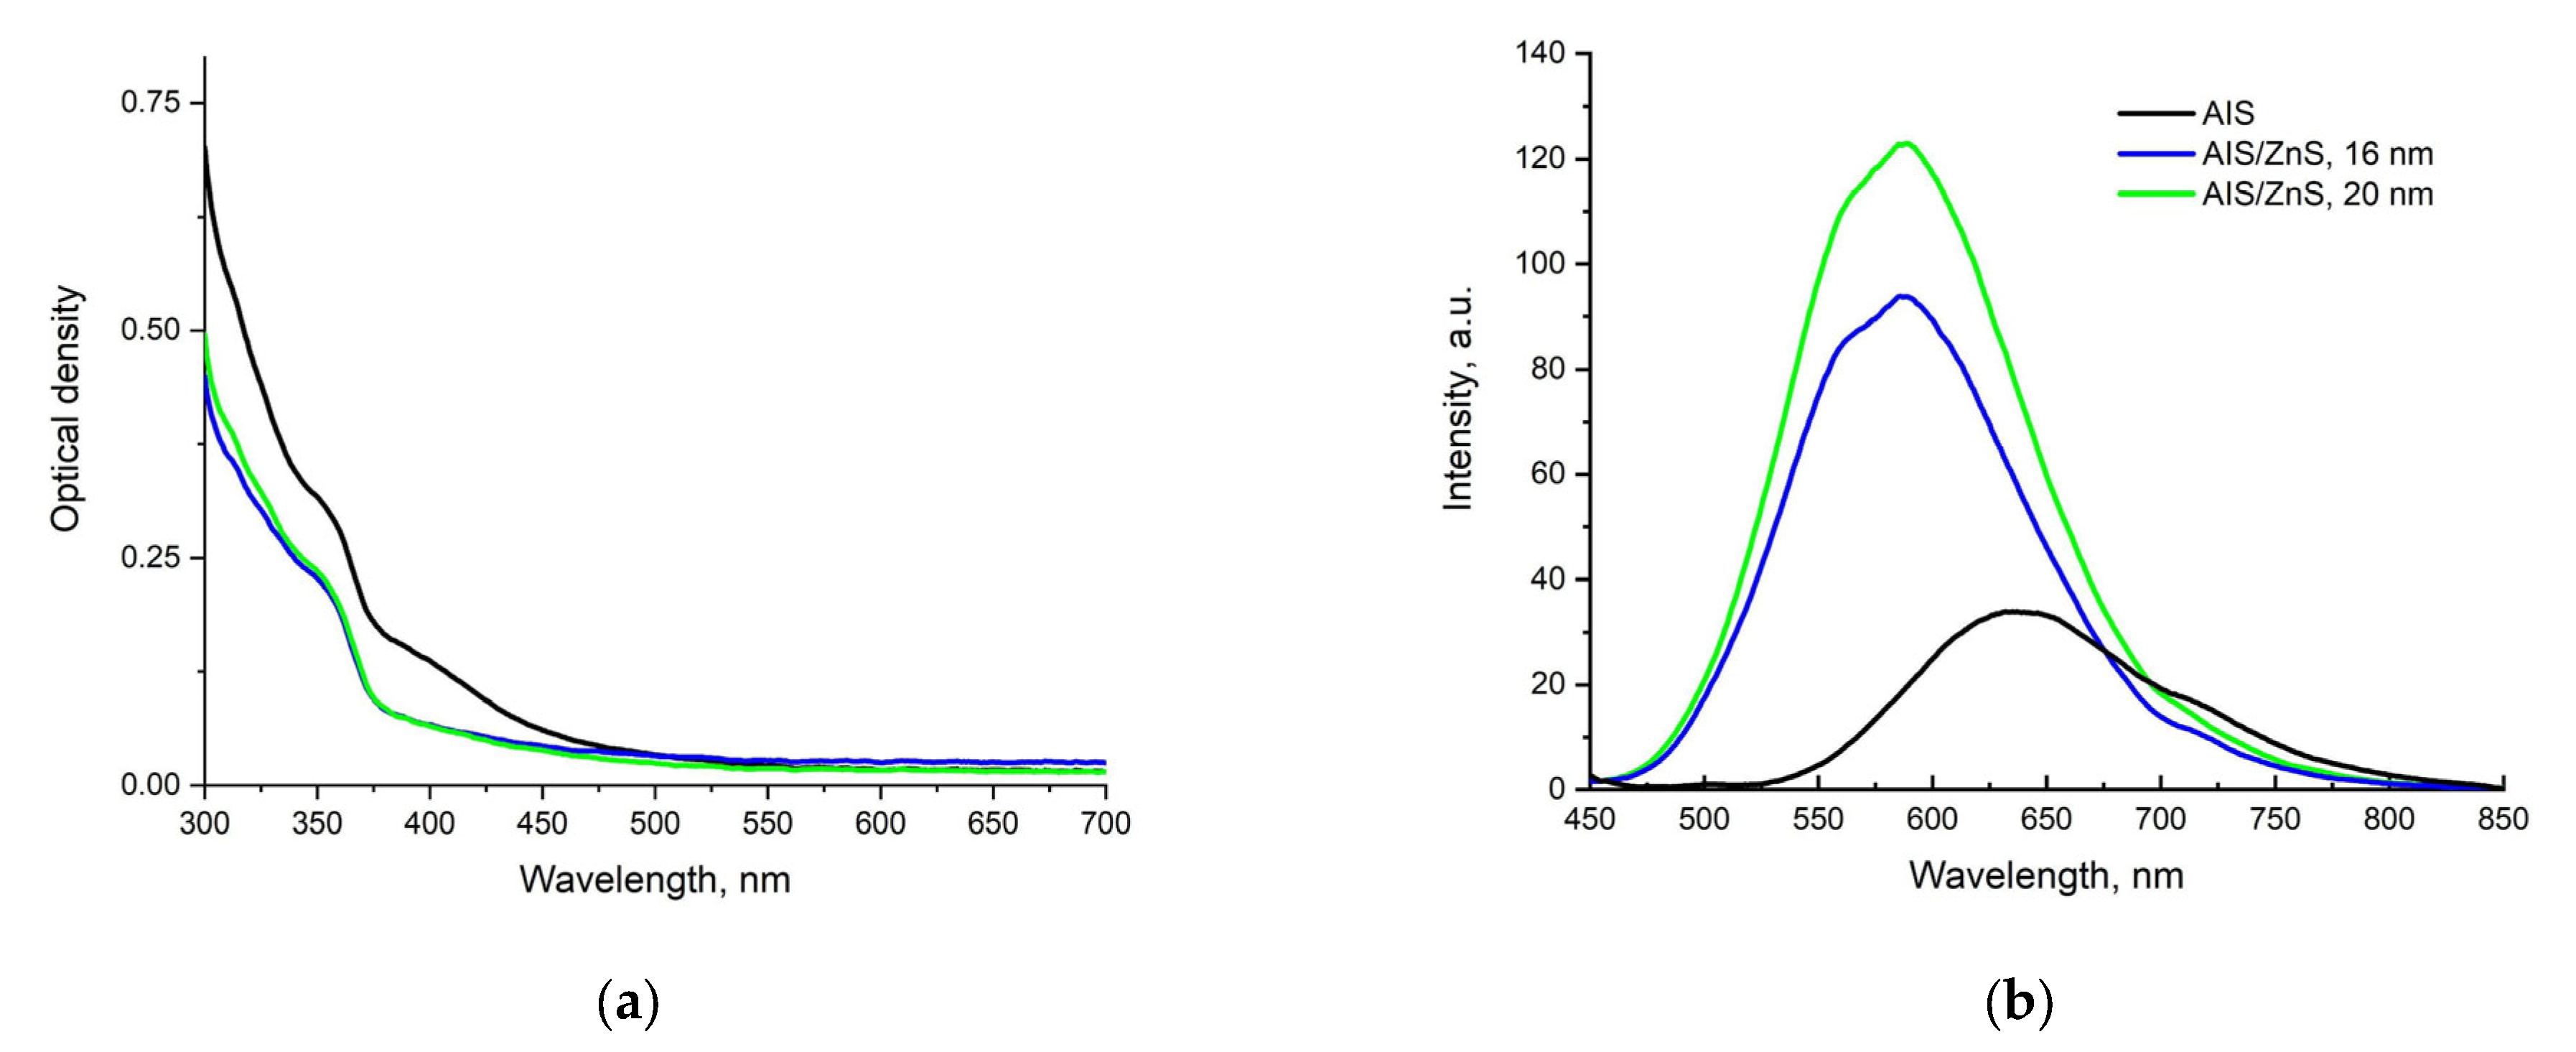
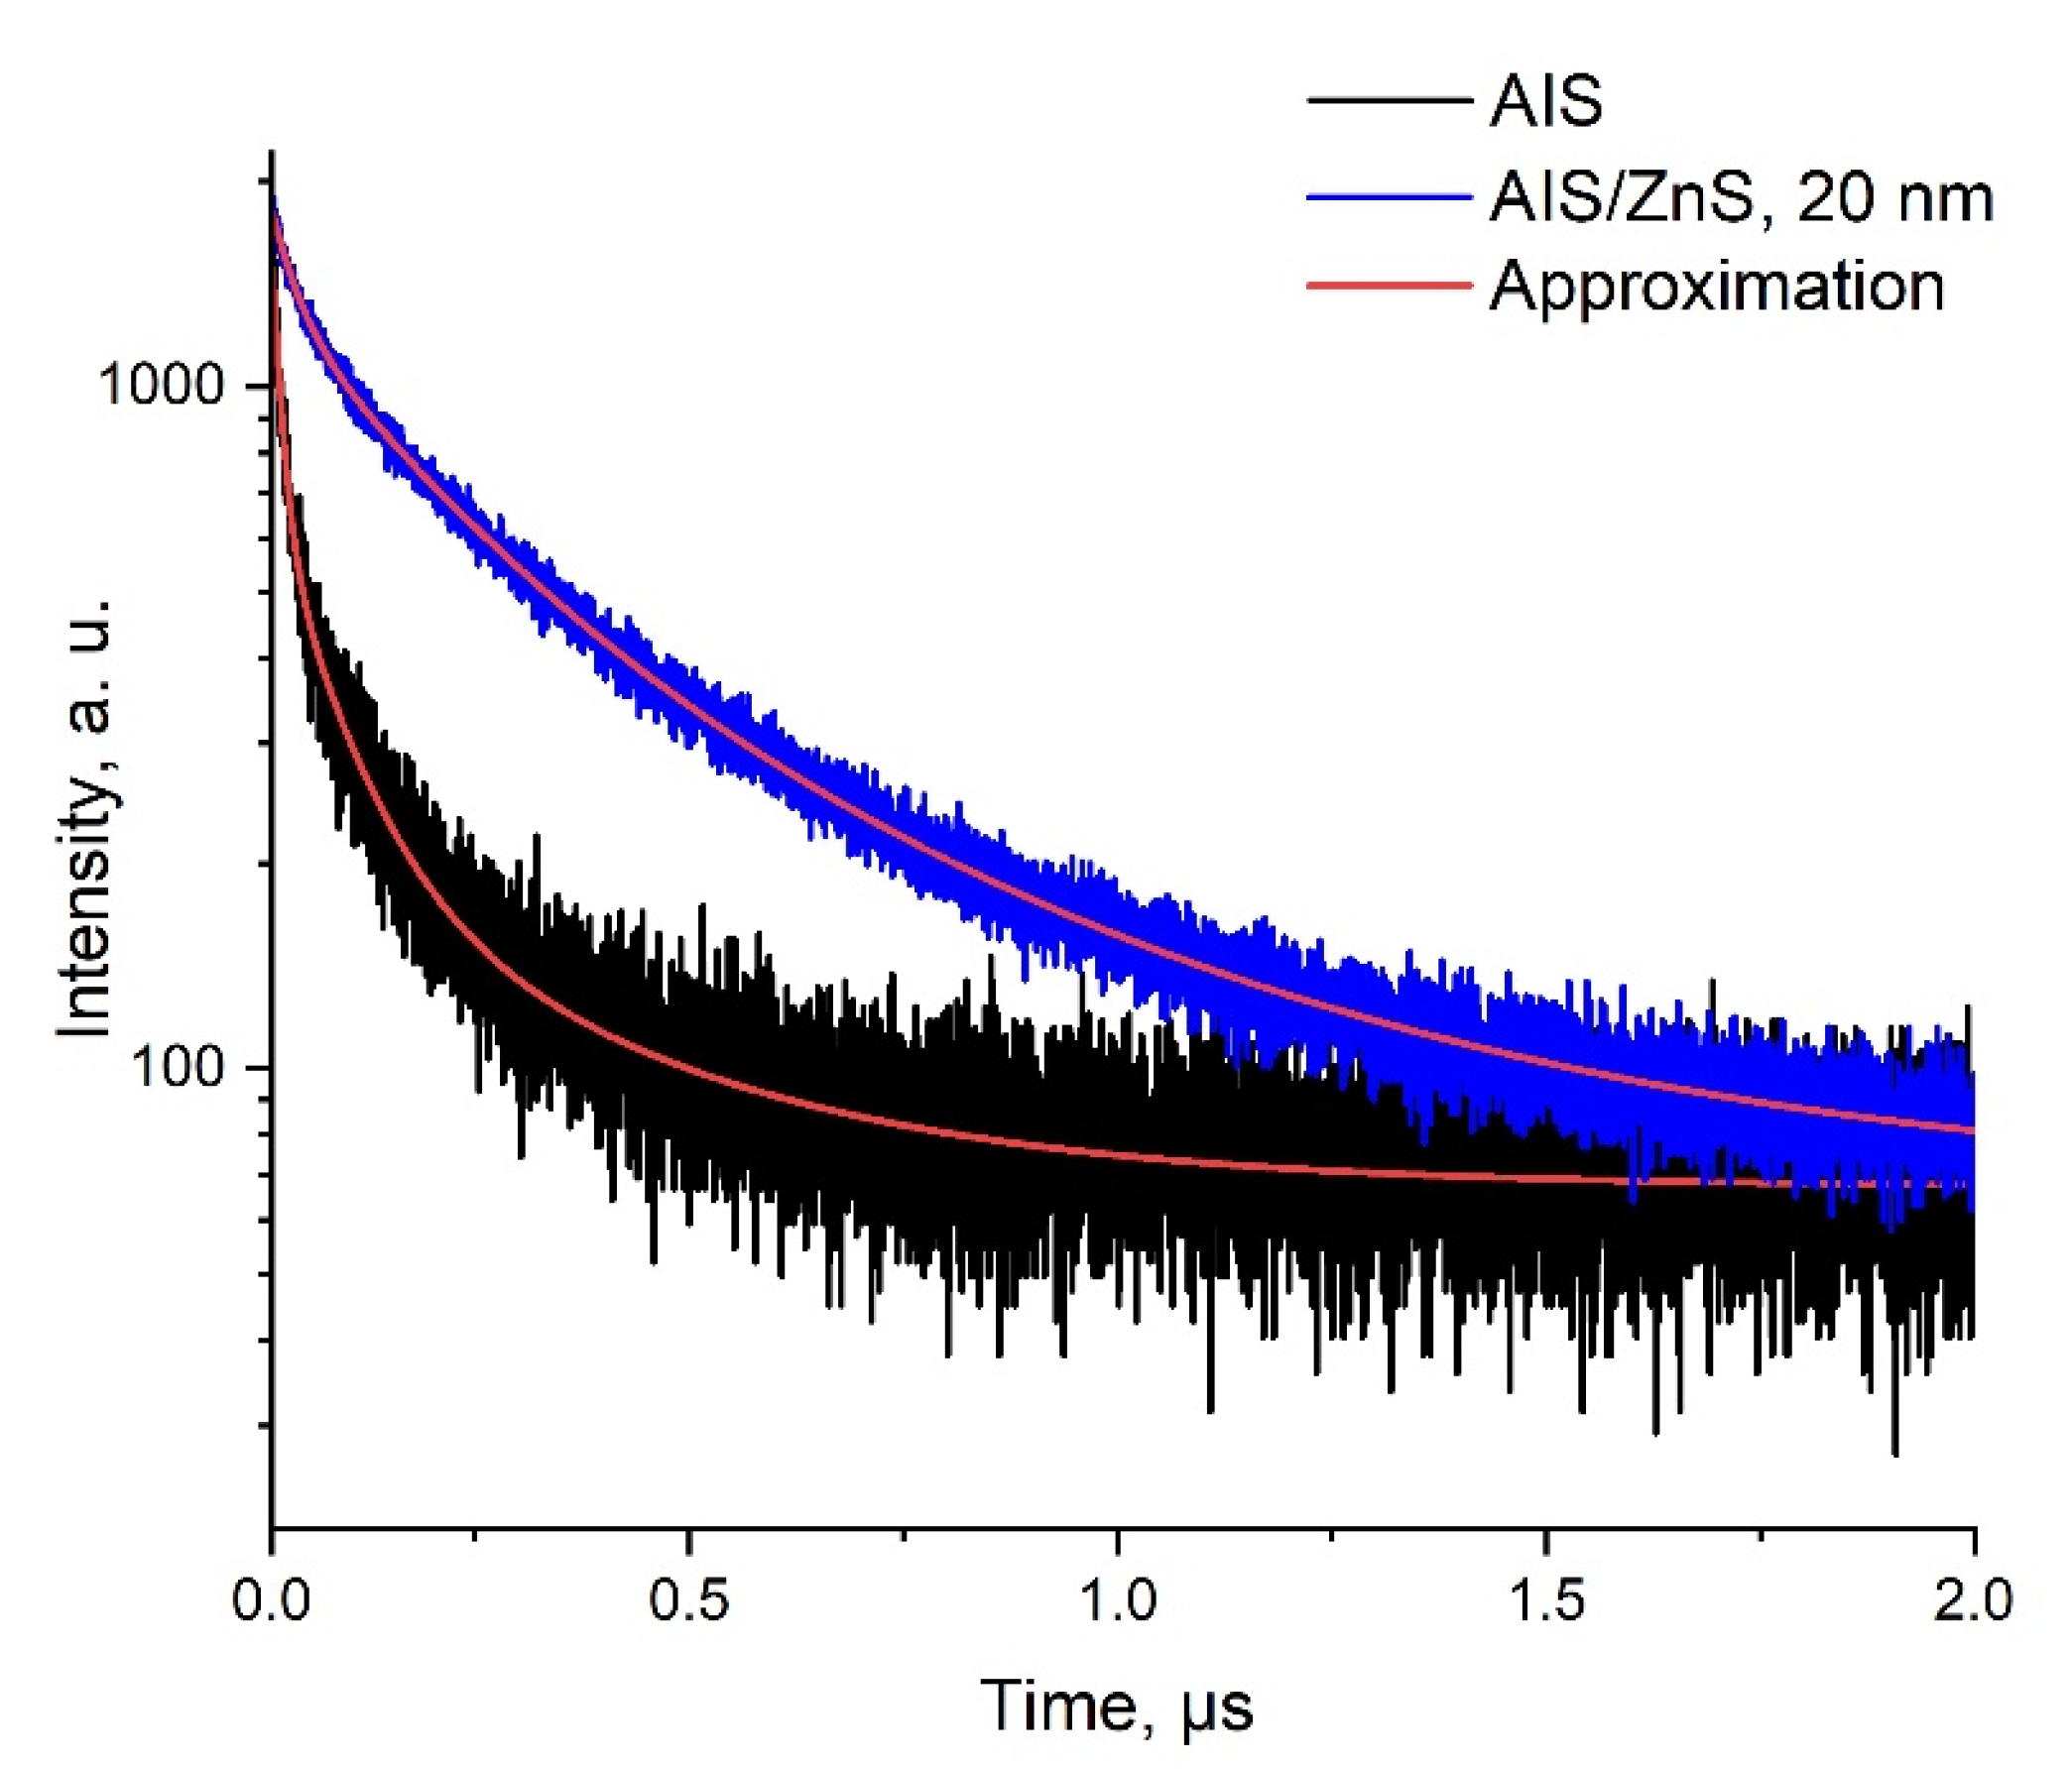
3.2. Characterization of Ag-In-S2/ZnS QDs
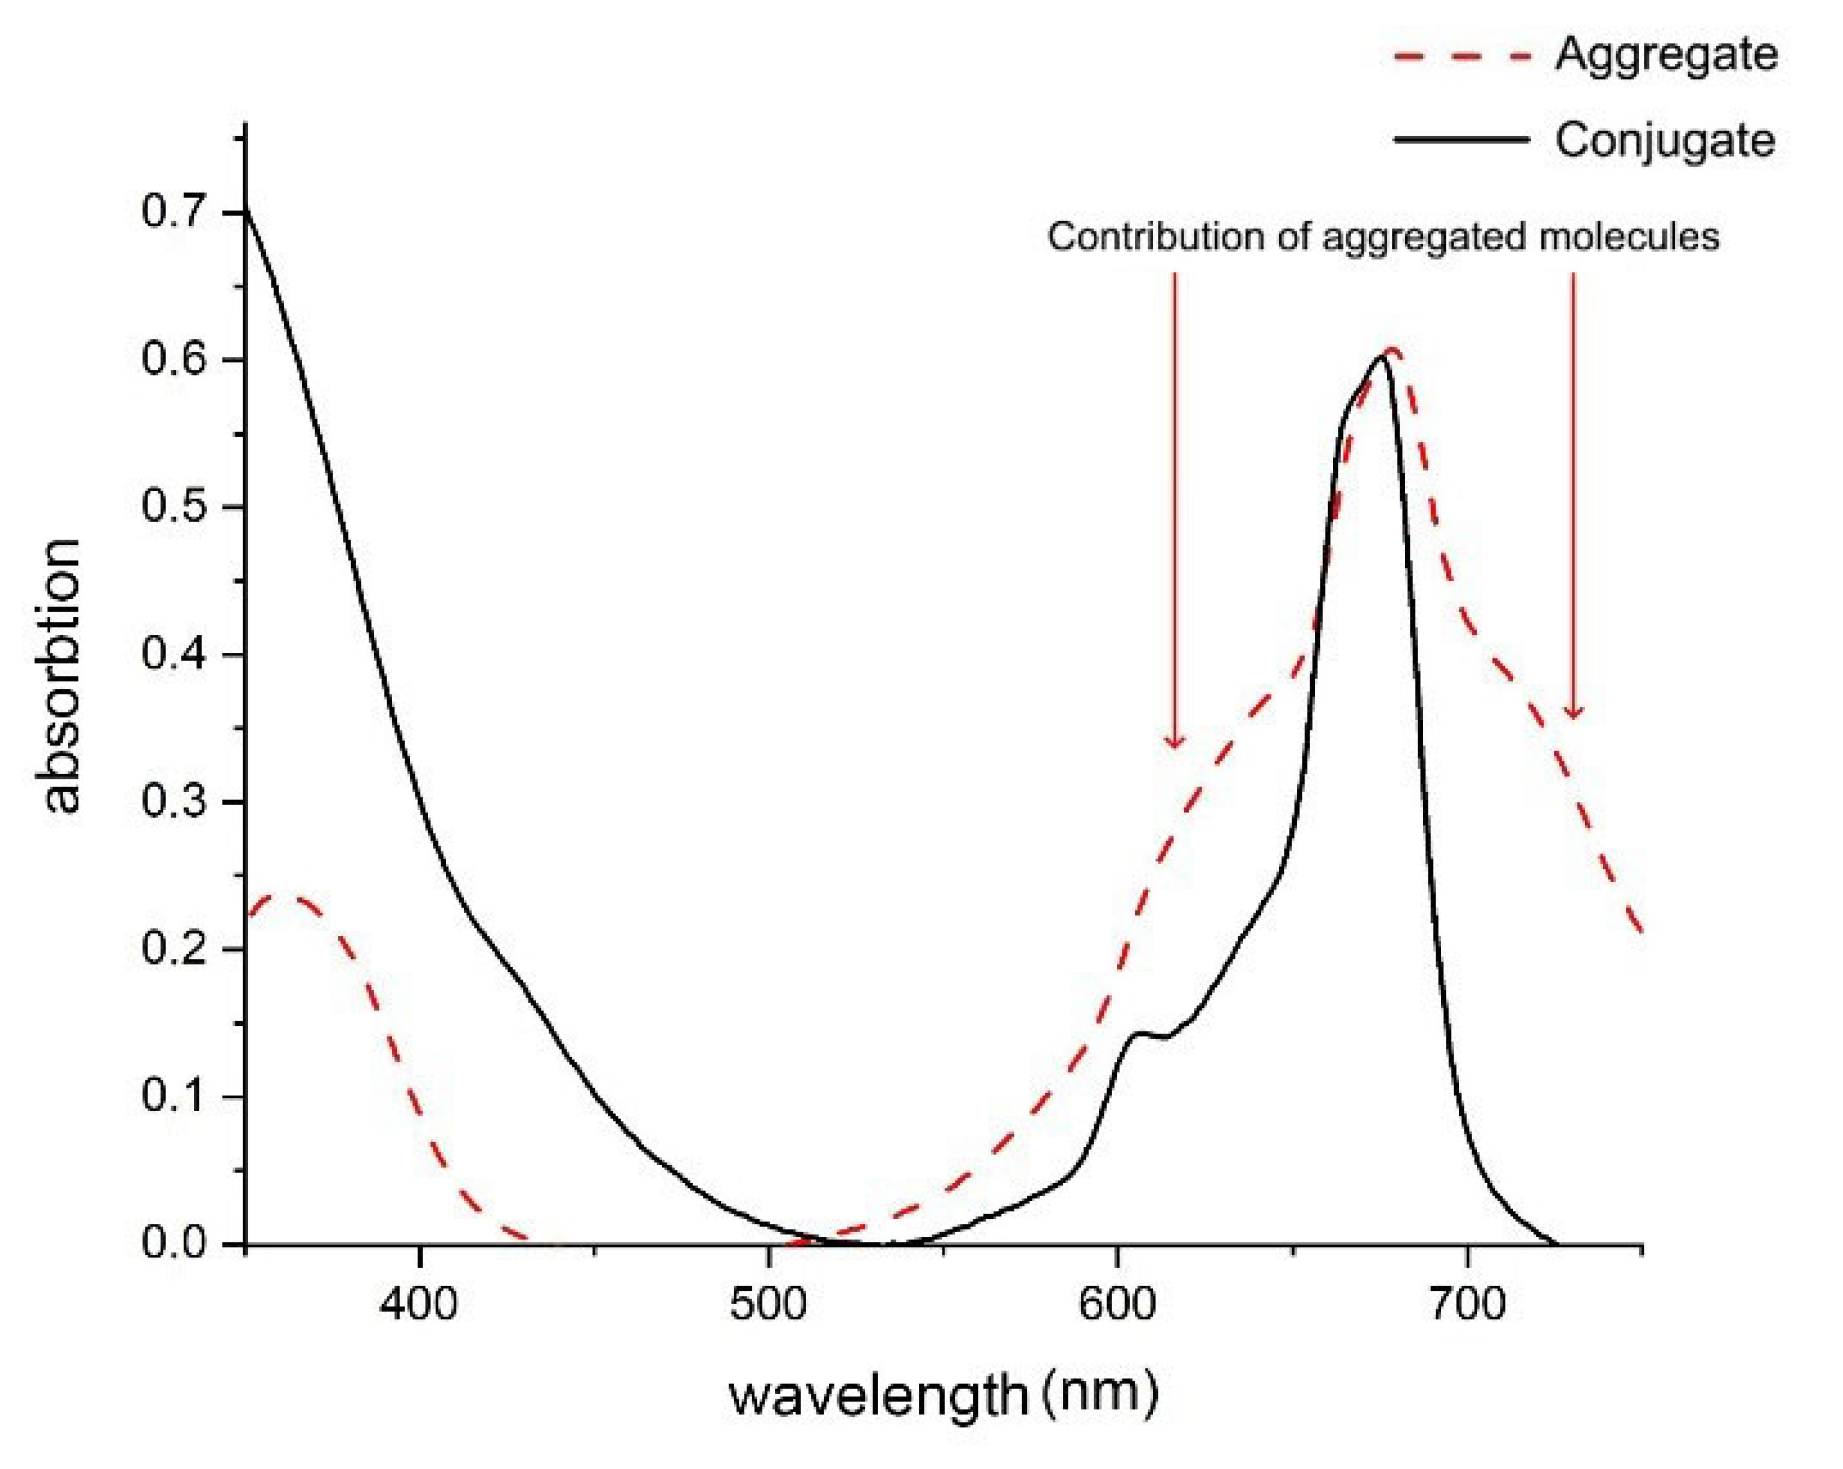
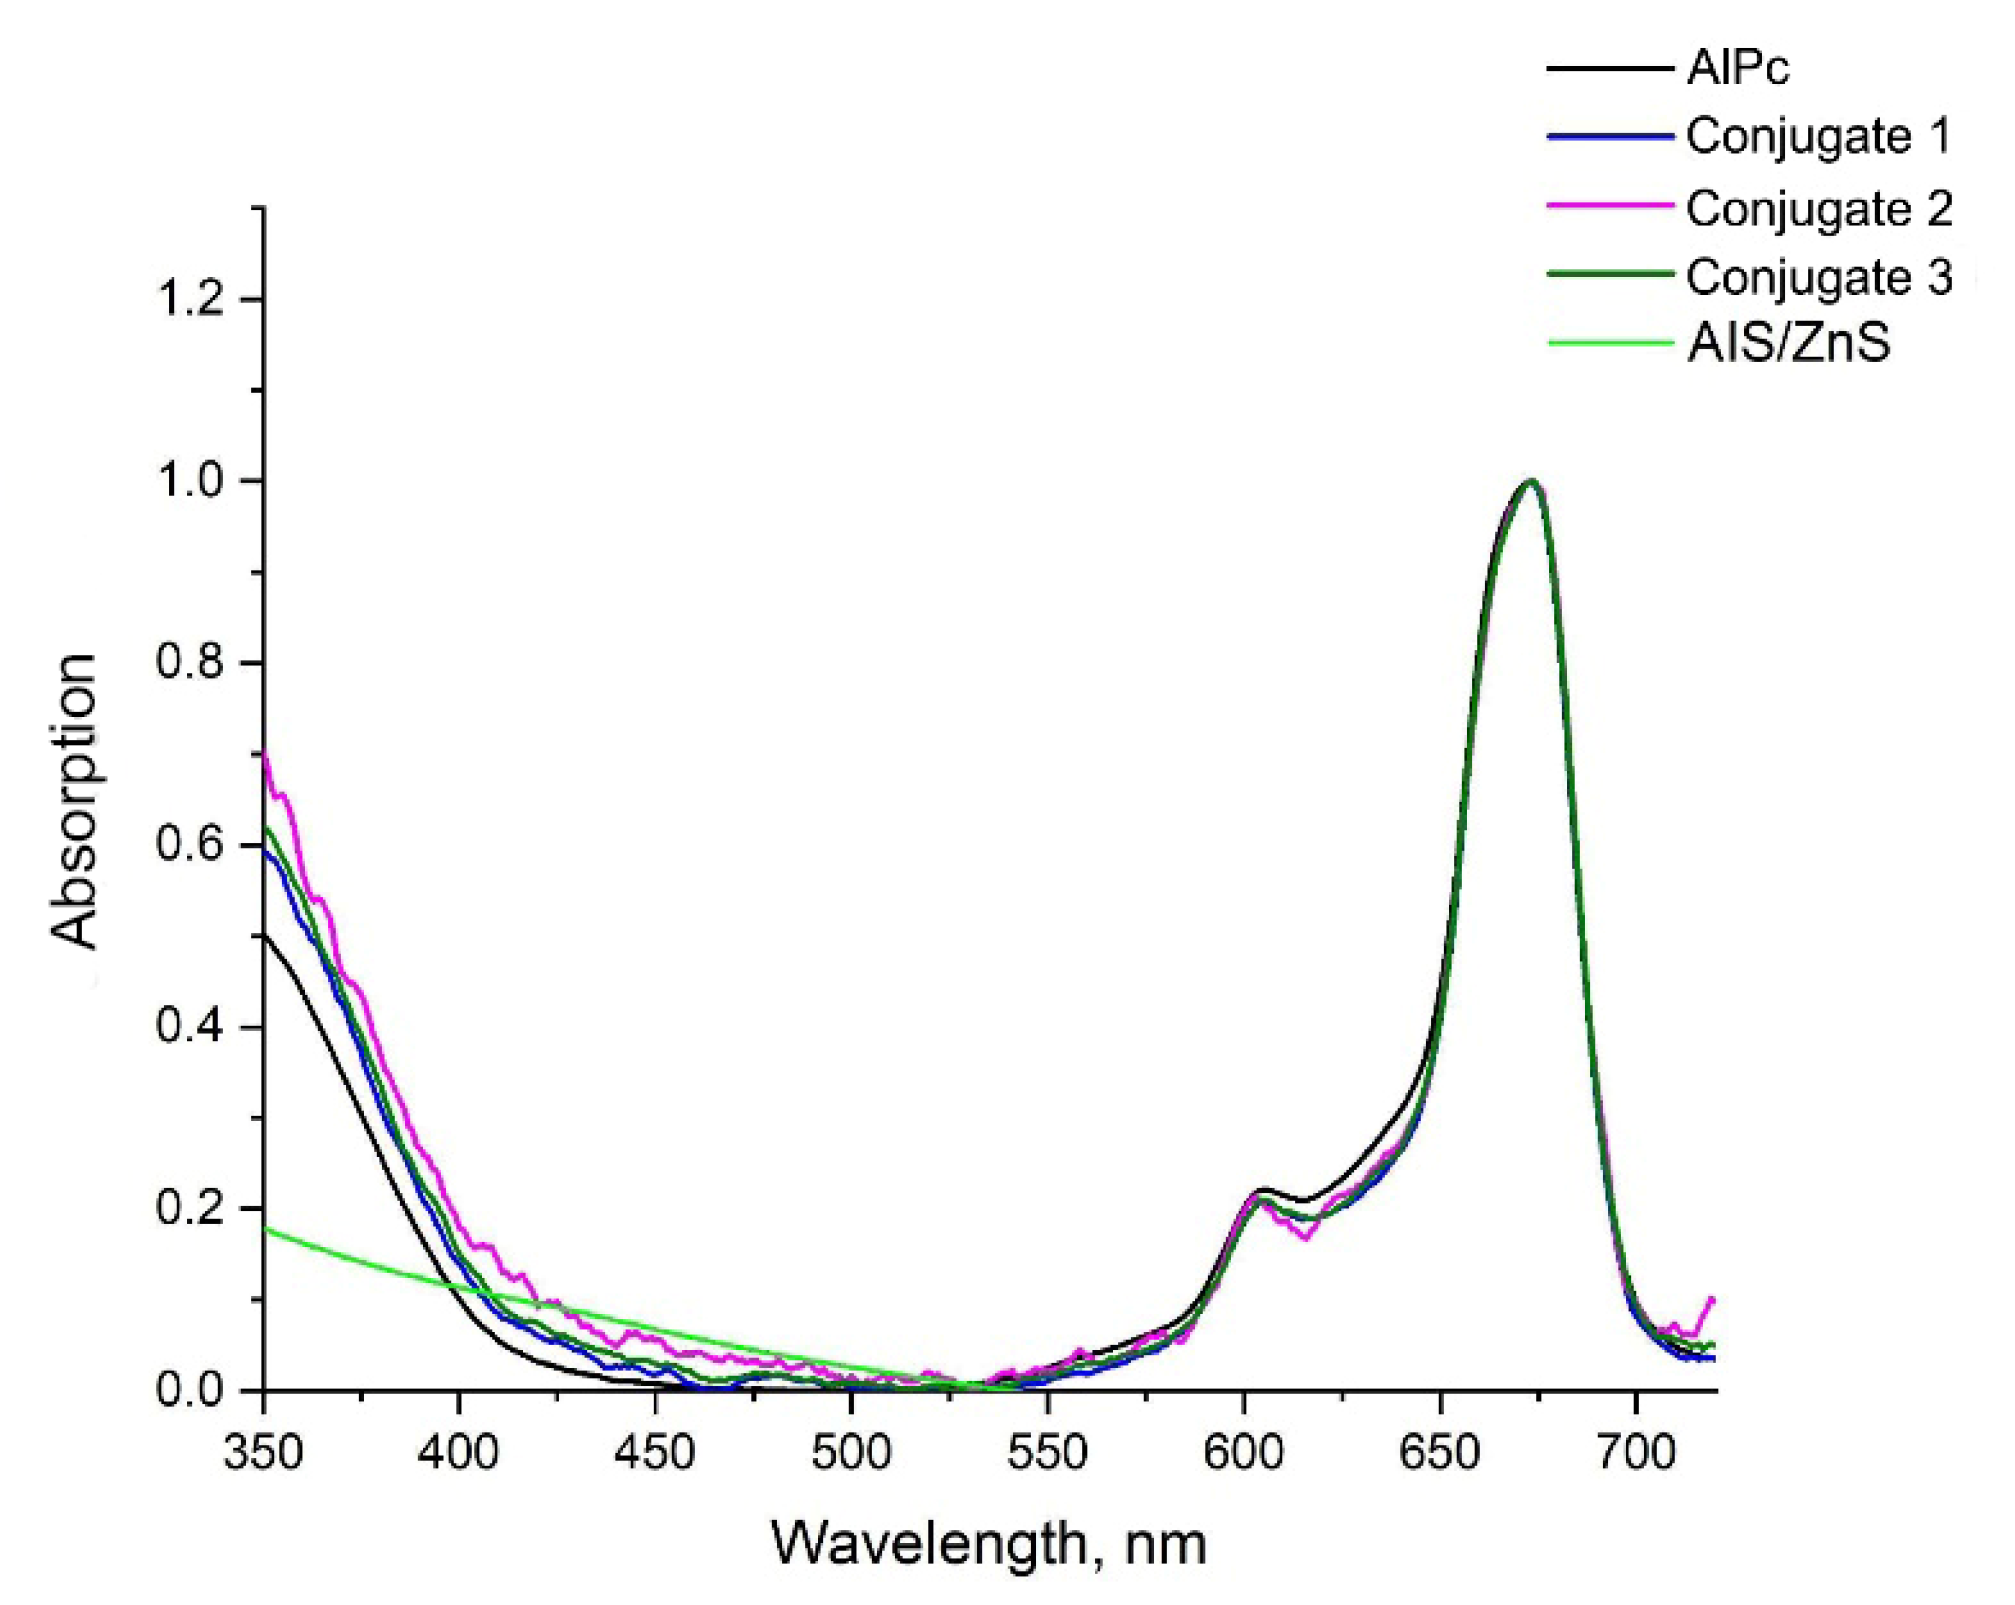
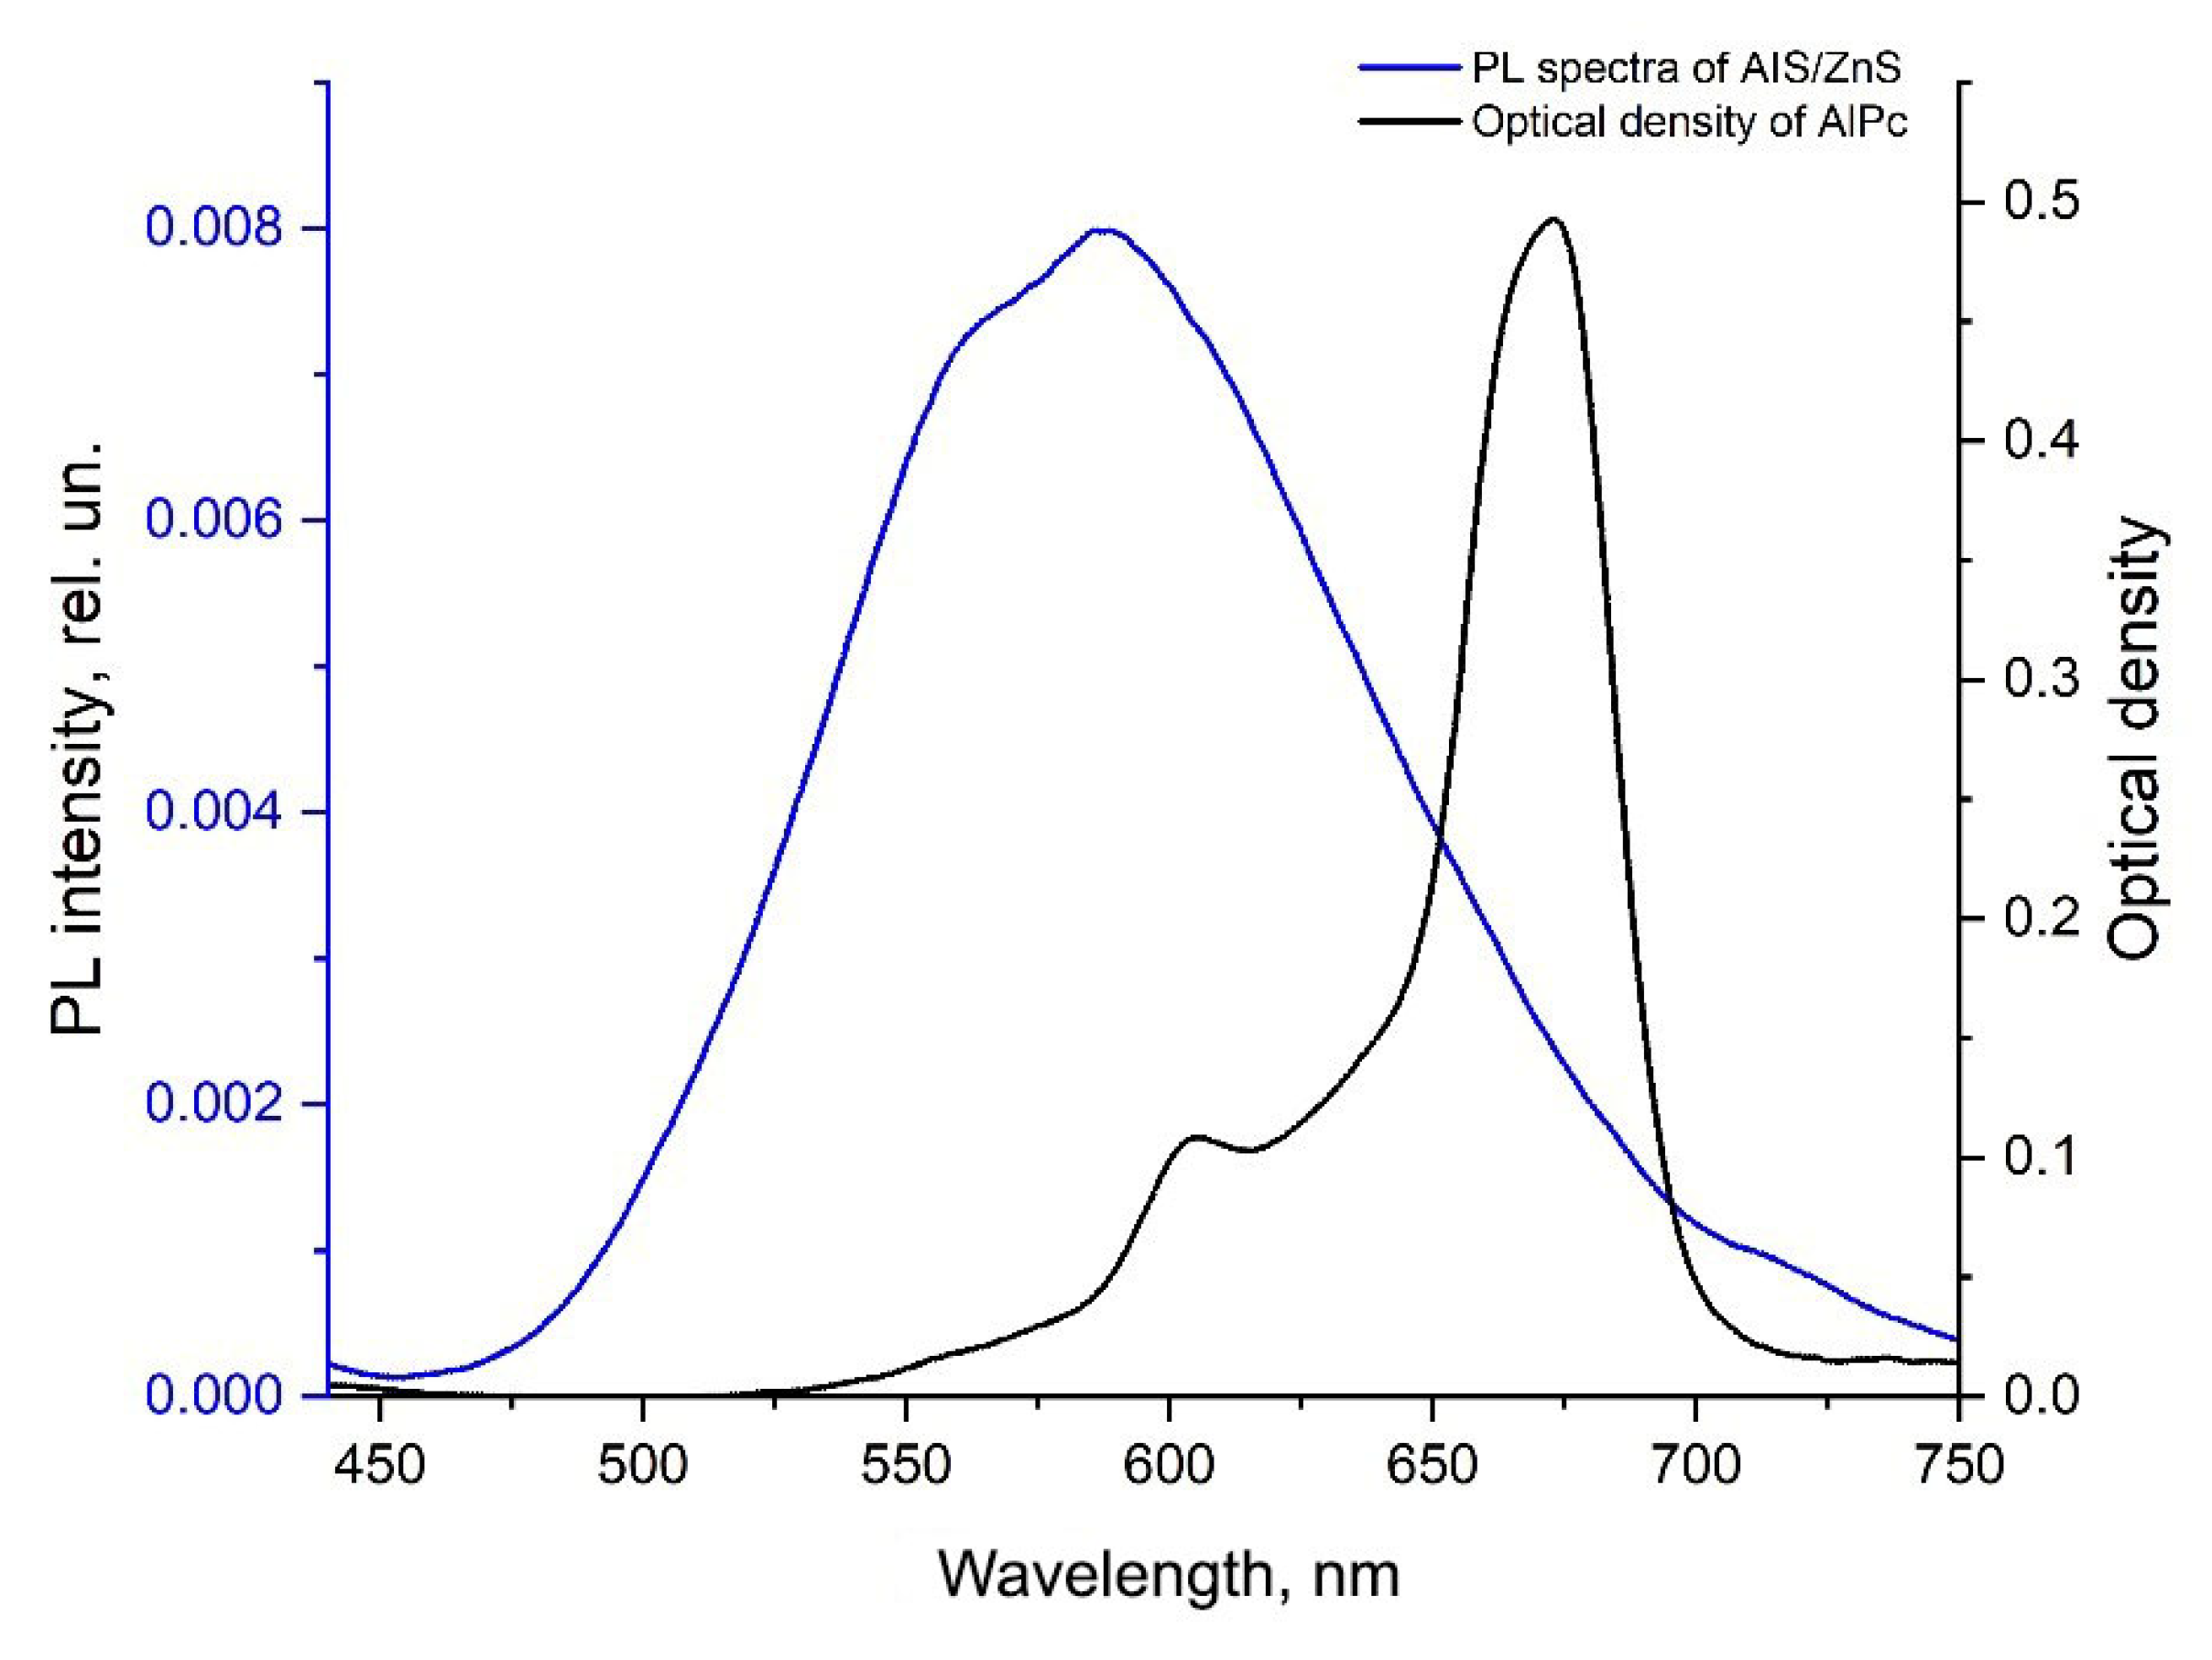
3.3. Spectral and Luminescent Characteristics of Conjugates Based on AIS/ZnS QDs and PS
3.4. Calculation of Theoretical and Experimental FRET
4. Conclusions
Author Contributions
Funding
Data Availability Statement
Conflicts of Interest
References
- Iannazzo, D.; Espro, C.; Celesti, C.; Ferlazzo, A.; Neri, G. Smart biosensors for cancer diagnosis based on graphene quantum dots. Cancers 2021, 13, 3194. [Google Scholar] [CrossRef] [PubMed]
- Kalkal, A.; Pradhan, R.; Kadian, S.; Manik, G.; Packirisamy, G. Biofunctionalized graphene quantum dots based fluorescent biosensor toward efficient detection of small cell lung cancer. ACS Appl. Bio Mater. 2020, 3, 4922–4932. [Google Scholar] [CrossRef] [PubMed]
- Yang, Y.; Zheng, Y.; Cao, W.; Titov, A.; Hyvonen, J.; Manders, J.R.; Xue, J.; Holloway, P.H.; Qian, L. High-efficiency light-emitting devices based on quantum dots with tailored nanostructures. Nat. Photonics 2015, 9, 259–266. [Google Scholar] [CrossRef]
- Yuan, M.; Liu, M.; Sargent, E.H. Colloidal quantum dot solids for solution-processed solar cells. Nat. Energy 2016, 1, 16016. [Google Scholar] [CrossRef]
- Girma, W.M.; Fahmi, M.Z.; Permadi, A.; Abate, M.A.; Chang, J.Y. Synthetic strategies and biomedical applications of I-III-VI ternary quantum dots. J. Mater. Chem. B 2017, 5, 6193–6216. [Google Scholar] [CrossRef]
- Liu, B.R.; Li, J.F.; Lu, S.W.; Lee, H.J.; Huang, Y.W.; Shannon, K.B.; Aronstam, R.S. Cellular Internalization of Quantum Dots Noncovalently Conjugated with Arginine-Rich Cell-Penetrating Peptides. J. Nanosci. Nanotechnol. 2010, 10, 6534–6543. [Google Scholar] [CrossRef] [Green Version]
- Qu, L.; Peng, X. Control of photoluminescence properties of CdSenanocrystals in growth. J. Am. Chem. Soc. 2002, 124, 2049–2055. [Google Scholar] [CrossRef]
- Su, Y.; Hu, M.; Fan, C.; He, Y.; Li, Q.; Li, W.; Wang, L.H.; Shen, P.; Huang, Q. The cytotoxicity of CdTe quantum dots and the relative contributions from released cadmium ions and nanoparticles properties. Biomaterials 2010, 31, 4829–4834. [Google Scholar] [CrossRef]
- Tsoi, K.M.; Dai, Q.; Alman, B.A.; Chan, W.C.W. Are quantum dots toxic? Exploring the discrepancy between cell culture and animal studies. Acc. Chem. Res. 2013, 46, 662–671. [Google Scholar]
- Ye, L.; Yong, K.T.; Liu, L.; Roy, I.; Hu, R.; Zha, J.; Cai, H.; Law, W.C.; Liu, J.; Wang, K.; et al. A pilot study in non-human primates shows no adverse response to intravenous injection of quantum dots. In Nano-Enabled Medical Applications; Jenny Stanford Publishing: Dubai, United Arab Emirates, 2012; pp. 453–458. [Google Scholar]
- Winnik, F.M.; Maysinger, D. Quantum dot cytotoxicity and ways to reduce it. Acc. Chem. Res. 2013, 46, 672–680. [Google Scholar] [CrossRef] [Green Version]
- Ding, Y.; Jiang, Z.; Saha, K.; Kim, C.S.; Kim, S.T.; Landis, R.F.; Rotello, V.M. Gold nanoparticles for nucleic acid delivery. Mol. Ther. 2014, 22, 1075–1083. [Google Scholar] [CrossRef]
- Fitzpatrick, J.A.J.; Andreko, S.K.; Ernst, L.A.; Waggoner, A.S.; Ballou, B.; Bruchez, M.P. Long-term persistence and spectral blue shifting of quantum dots in vivo. Nano Lett. 2009, 9, 2736–2741. [Google Scholar] [CrossRef] [Green Version]
- Nel, A.E.; Mädler, L.; Velegol, D.; Xia, T.; Hoek, E.; Somasundaran, P.; Klaessig, F.; Castranova, V.; Thompson, M. Understanding biophysicochemical interactions at the nano-bio interface. Nat. Mater. 2009, 8, 543–557. [Google Scholar] [CrossRef]
- Maslov, V.; Orlova, A.; Baranov, A. Combination Therapy: Complexing of QDs with tetrapyrrols and other dyes. In Photosensitizers in Medicine, Environment, and Security; Springer: Dordrecht, The Netherlands, 2011; pp. 351–389. [Google Scholar]
- Mir, I.A.; Radhakrishanan, V.S.; Rawat, K.; Prasad, T.; Bohidar, H.B. Bandgap Tunable AgInS based Quantum Dots for High Contrast Cell Imaging with Enhanced Photodynamic and Antifungal Applications. Sci. Rep. 2018, 8, 9322. [Google Scholar] [CrossRef] [Green Version]
- Stranadko, E.P.; Skobelkin, O.K.; Litvin, G.D.; Astrakhankina, T.A. Photodynamic therapy of human malignant tumors: A comparative study between photohem and tetrasulfonated aluminum phthalocyanine. In Photochemotherapy: Photodynamic Therapy and Other Modalities; SPIE: Washington, DC, USA, 1996; Volume 2625, pp. 440–448. [Google Scholar]
- Melerzanov, A.; Moskalev, A.; Zharov, V. Precision medicine and molecular theranostics. Doctor 2016, 12, 11–14. [Google Scholar]
- Kuznetsova, N.A.; Gretsova, N.S.; Derkacheva, V.M.; Mikhalenko, S.A.; Solov’eva, L.I.; Yuzhakova, O.A.; Luk’yanets, E.A. Generation of singlet oxygen with anionic aluminum phthalocyanines in water. Russ. J. Gen. Chem. 2002, 72, 300–306. [Google Scholar] [CrossRef]
- Lawrence, D.S.; Whitten, D.G. Photochemistry and Photophysical Properties of Novel, Unsymmetrically Substituted Metallophthalocyanines. Photochem. Photobiol. 1996, 64, 923–935. [Google Scholar] [CrossRef]
- Ishii, K.; Hirose, Y.; Fujitsuka, H.; Ito, O.; Kobayashi, N. Time-resolved EPR, fluorescence, and transient absorption studies on phthalocyaninatosilicon covalently linked to one or two tempo radicals. J. Am. Chem. Soc. 2001, 123, 702–708. [Google Scholar] [CrossRef]
- Lin, G.; Wang, X.; Yin, F.; Yong, K.T. Passive tumor targeting and imaging by using mercaptosuccinic acid-coated near-infrared quantum dots. Int. J. Nanomed. 2015, 10, 335. [Google Scholar] [CrossRef] [Green Version]
- Istomina, M.S.; Korolev, D.V.; Pochkaeva, E.I.; Mazing, D.S.; Moshnikov, V.A.; Gareev, K.G.; Babikova, K.Y.; Postnov, V.N. colloidal quantum dots based on AgInS2/ZnS for fluorescent imaging in comparison with fluorophores fixed on the surface of nanoparticles. Transl. Med. 2017, 4, 56–65. [Google Scholar]
- Zhong, H.; Bai, Z.; Zou, B. Tuning the Luminescence Properties of Colloidal I-III-VI Semiconductor Nanocrystals for Optoelectronics and Biotechnology Applications. J. Phys. Chem. Lett. 2012, 3, 3167–3175. [Google Scholar] [CrossRef] [PubMed]
- Kang, X.; Huang, L.; Yang, Y.; Pan, D. Scaling up the aqueous synthesis of visible light emitting multinary AgInS2/ZnS core/shell quantum dots. J. Phys. Chem. 2015, C119, 7933–7940. [Google Scholar] [CrossRef]
- Regulacio, M.D.; Win, K.Y.; Lo, S.L.; Zhang, S.Y.; Zhang, X.; Wang, S.; Zheng, Y. Aqueous synthesis of highly luminescent AgInS 2-ZnS quantum dots and their biological applications. Nanoscale 2013, 5, 2322–2327. [Google Scholar] [CrossRef] [PubMed]
- Kobosko, S.M.; Jara, D.H.; Kamat, P.V. AgInS2-ZnS Quantum Dots: Excited State Interactions with TiO2 and Photovoltaic Performance. ACS Appl. Mater. Interfaces 2017, 9, 33379–33388. [Google Scholar] [CrossRef] [PubMed]
- Mao, B.; Chuang, C.H.; Lu, F.; Sang, L.; Zhu, J.; Burda, C. Study of the partial Ag-to-Zn cation exchange in AgInS2/ZnS nanocrystals. J. Phys. Chem. 2012, C117, 648–656. [Google Scholar] [CrossRef]
- Chang, J.-Y.; Wang, G.-Q.; Cheng, C.-Y.; Lin, W.-X.; Hsu, J.-C. Strategies for photoluminescence enhancement of AgInS2 quantum dots and their application as bioimaging probes. J. Mater. Chem. 2012, 22, 10609–10618. [Google Scholar] [CrossRef]
- Torimoto, T.; Adachi, T.; Okazaki, K.I.; Sakuraoka, M.; Shibayama, T.; Ohtani, B.; Kuwabata, S. Facile synthesis of ZnS? AgInS2 solid solution nanoparticles for a color-adjustable luminophore. J. Am. Chem. Soc. 2007, 129, 12388–12389. [Google Scholar]
- Raevskaya, A.; Lesnyak, V.; Haubold, D.; Dzhagan, V.; Stroyuk, O.; Gaponik, N.; Eychmüller, A. A fine size selection of brightly luminescent water-soluble Ag-In-S and Ag-In-S/ZnS quantum dots. J. Phys. Chem. C 2017, 121, 9032–9042. [Google Scholar] [CrossRef] [Green Version]
- Kadlag, K.P.; Patil, P.; Jagadeeswara Rao, M.; Datta, S.; Nag, A. Luminescence and solar cell from ligand-free colloidal AgInS2 nanocrystals. CrystEngComm 2014, 16, 3605–3612. [Google Scholar] [CrossRef]
- Cichy, B.; Rich, R.; Olejniczak, A.; Gryczynski, Z.; Strek, W. Two blinking mechanisms in highly confined AgInS2 and AgInS2/ZnS quantum dots evaluated by single particle spectroscopy. Nanoscale 2016, 8, 4151–4159. [Google Scholar] [CrossRef]
- Stroyuk, O.; Weigert, F.; Raevskaya, A.; Spranger, F.; Würth, C.; Resch-Genger, U.; Zahn, D.R.T. Inherently broadband photoluminescence in Ag-In-S/ZnS quantum dots observed in ensemble and single-particle studies. J. Phys. Chem. C 2019, 123, 2632–2641. [Google Scholar] [CrossRef]
- Dhami, S.; Mello, A.D.; Rumbles, G.; Bishop, S.M.; Phillips, D.; Beeby, A. Phthalocyanine fluorescence at high concentration: Dimers or reabsorption effect? Photochem. Photobiol. 1995, 61, 341–346. [Google Scholar] [CrossRef]
- Palewska, K.; Sworakowski, J.; Lipiński, J.; Nešpůrek, S. Effect of electric permittivity of the solvent on aggregation process of the water-soluble sulfonated metal phthalocyanines. J. Photochem. Photobiol. A Chem. 2011, 223, 149–156. [Google Scholar] [CrossRef]
- Palewska, K. Molecular aggregation in soluble phthalocyanines—Chemical interactions vs. π-stacking. Opt. Mater. 2012, 34, 1717–1724. [Google Scholar] [CrossRef]
- Ekimov, A.I. Optical Spectroscopy of Size Effects in Semiconductor Microcrystals. In Laser Optics of Condensed Matter; Ekimov, A.I., Efros, A.L., Ekimov, A.I., Eds.; Springer: New York, NY, USA, 1988; Volume 25, pp. 199–207. [Google Scholar]
- Liu, K.; Wang, Y.; Yao, J.; Luo, Y. Origin of the Q-band splitting in the absorption spectra of aluminum phthalocyanine chloride. Chem. Phys. Lett. 2007, 438, 36–40. [Google Scholar] [CrossRef]
- Sewid, F.A.; Annas, K.I.; Dubavik, A.; Veniaminov, A.V.; Maslov, V.G.; Orlova, A.O. Chitosan nanocomposites with CdSe/ZnS quantum dots and porphyrin. RSC Adv. 2022, 12, 899–906. [Google Scholar] [CrossRef]


| Sample | Shell Synthesis Time, min. | Average Hydrodynamic Diameter, nm |
|---|---|---|
| AIS | 0 | 6 |
| AIS/ZnS | 24 | 16 |
| AIS/ZnS | 34 | 20 |
| Sample | τ1, ns. | Contribution of the First Component, % | τ2, ns. | Contribution of the Second Component, % | τ3, ns. | Contribution of the Third Component, % |
|---|---|---|---|---|---|---|
| AIS | 348 ± 35 | 58 | 80 ± 8 | 34 | 11 ± 1 | 8 |
| AIS/ZnS 20 nm | 566 ± 55 | 61 | 203 ± 20 | 34 | 29 ± 3 | 5 |
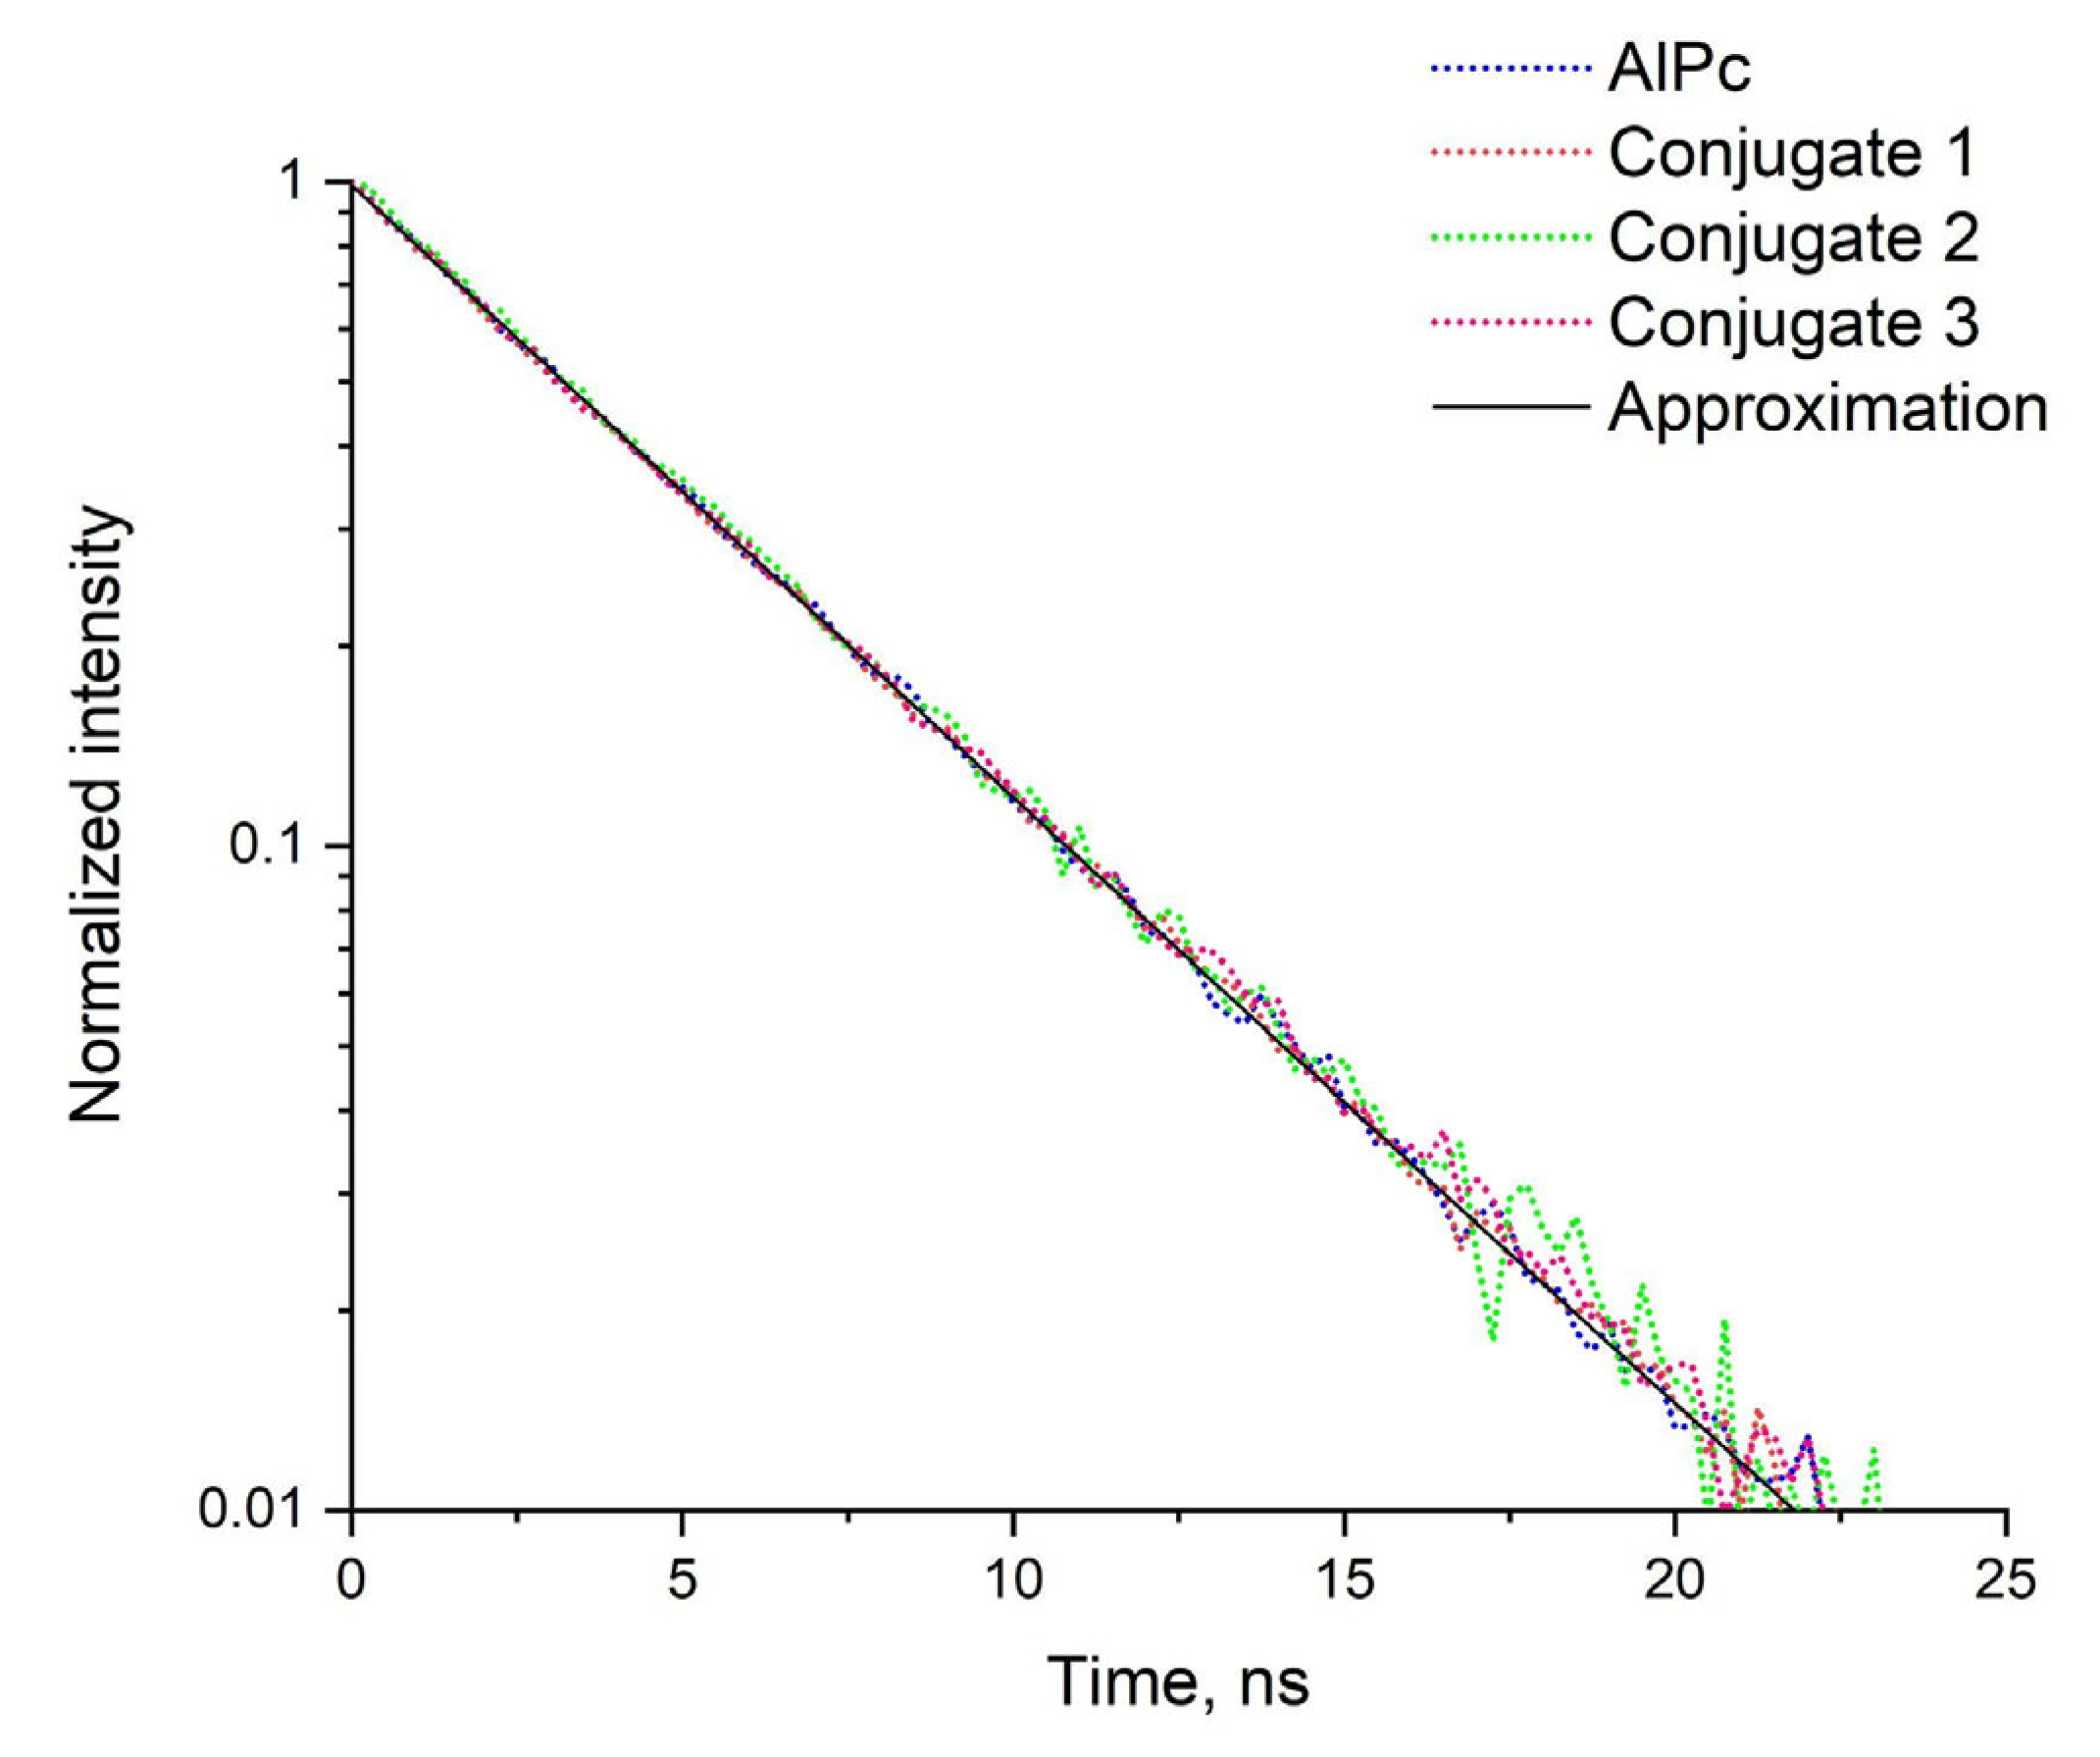
| Sample | τ, ns | I, kCounts |
|---|---|---|
| AlPc | 4.73 | 192 |
| Conjugate 1 | 4.73 | 195 |
| Conjugate 2 | 4.73 | 80 |
| Conjugate 3 | 4.78 | 145 |
| Sample | QD Size, nm | QD: AlPc Ratio | Qtheor., % | Qexp., % |
|---|---|---|---|---|
| Conjugate 1 | 16 | 1:6 | 97 | 81 |
| Conjugate 2 | 20 | 1:3 | 92 | 48 |
| Conjugate 3 | 16 | 1:6 | 96 | 80 |
Publisher’s Note: MDPI stays neutral with regard to jurisdictional claims in published maps and institutional affiliations. |
© 2022 by the authors. Licensee MDPI, Basel, Switzerland. This article is an open access article distributed under the terms and conditions of the Creative Commons Attribution (CC BY) license (https://creativecommons.org/licenses/by/4.0/).
Share and Cite
Yakovlev, D.; Kolesova, E.; Sizova, S.; Annas, K.; Tretyak, M.; Loschenov, V.; Orlova, A.; Oleinikov, V. New Conjugates Based on AIS/ZnS Quantum Dots and Aluminum Phthalocyanine Photosensitizer: Synthesis, Properties and Some Perspectives. Nanomaterials 2022, 12, 3874. https://doi.org/10.3390/nano12213874
Yakovlev D, Kolesova E, Sizova S, Annas K, Tretyak M, Loschenov V, Orlova A, Oleinikov V. New Conjugates Based on AIS/ZnS Quantum Dots and Aluminum Phthalocyanine Photosensitizer: Synthesis, Properties and Some Perspectives. Nanomaterials. 2022; 12(21):3874. https://doi.org/10.3390/nano12213874
Chicago/Turabian StyleYakovlev, Dmitry, Ekaterina Kolesova, Svetlana Sizova, Kirill Annas, Marina Tretyak, Victor Loschenov, Anna Orlova, and Vladimir Oleinikov. 2022. "New Conjugates Based on AIS/ZnS Quantum Dots and Aluminum Phthalocyanine Photosensitizer: Synthesis, Properties and Some Perspectives" Nanomaterials 12, no. 21: 3874. https://doi.org/10.3390/nano12213874