3.3. Structural Description of [Ln(μ-Htart)2(OH)(H2O)2]n [where Ln = Y(III), Sm(III), Eu(III), Gd(III), Tb(III), Dy(III), Ho(III), Er(III), Tm(III), or Yb(III)]
As confirmed by X-ray diffraction data, these isostructural compounds consist of a 2D-layered framework that crystallizes in the non-enantiogenic P41212 (L-enantiomers) and P43212 (D-enantiomers) space groups. Accordingly, both structures retain the chirality afforded by L-/D-tartrate ligands. It should be noted that, unlike the above-described three-dimensional tartrate-based compounds, these MOFs contain hydrogen tartrate ligands, hence with a single deprotonated carboxylate group capable of coordinating with metal centers. As a result, the crystal structure is limited to a two-dimensional layer.
The asymmetric unit is composed by half a Ln(III) ion, one hydrogen tartrate ligand, half a hydroxide anion, and a coordination water molecule. As for the lanthanide atoms, they present a nine-fold coordinated sphere, with six oxygen atoms, four of which belong to two chelating hydrogen tartrate ligands (by means of the carboxylate and neighboring hydroxyl oxygen atoms) and the remaining two to the non-chelating carboxylate oxygen atoms, two oxygen atoms from coordination water molecules, and one additional oxygen donor atom of the hydroxide ion (see
Figure 1). It is important to notice that the oxygen atom of the hydroxide group is sited on a binary axis, a special position of the lattice with half multiplicity, in such a way that the hydrogen atom is inherently disordered into two equivalent positions. Continuous shape measurements (CShMs) [
68] on the [Ln(O
carb)
3(O
hid)
3(O
w)
2(O
OH)
1] chromophore revealed that Ln atoms are surrounded by a tricapped trigonal prism J51 (JTCTPR-9). The hydrogen tartrate ligands display a tridentate µ-
kO:k2O’,O’’ coordination mode by which they bridge Ln atoms one another through the five-member chelating ring and the non-chelating monodentate carboxylate oxygen atoms.
The successive bridges established between hydrogen tartrate ligands and Ln(III) atoms yield a 2D chiral layer exhibiting a four-membered grid that may be described as a
sql topological network with the (4
4·6
2) point symbol [
69]. Another interesting feature of the layers is the fact that the coordinated water molecules and hydroxide anions act as hydrogen bonding donors in some remarkable intramolecular interactions that reinforce the arrangement of the grid (
Table 2). From there on, the layers are interconnected with each other by means of a hydrogen-bonding network that involves the hydroxyl and carboxylate groups (
Table 3 and
Figure 2), which directs the piling of the layers to give rise to the overall compact three-dimensional framework.
Importantly, all our D and L-tartrate based enantiomeric pairs of MOFs have been subjected to an atomic level structural comparison by means of root mean square deviation (RMSD) analysis (see
Table S9) showing that D-tartrate-based MOFs show a perfectly equivalent arrangement which results from the application of an inversion center (see
Table S3 in Supplementary Materials).
It must be mentioned that other works gathered in the bibliography report some two-dimensional CPs which, despite being very similar, cannot be considered isostructural to those studied in this paper. The main difference lies on the protonation of tartrate because those compounds consist of a dianionic tartrate, a hydrogen tartrate, and three water molecules according to the [Ln(μ-Htart)(μ-tart)(H
2O)
3]
n formula, which excludes the presence of a hydroxide anion as in the herein described compounds [
70,
71,
72,
73,
74]. Notwithstanding the fact that hydroxide ions are easily formed in the presence of oxophilic lanthanides(III) and usually incorporated to neutral and stable two-dimensional LnMOFs [
75], bond distances of carboxylate groups were analyzed and compared with the results deposited in the CCDC database to support the occurrence of a unique type of tartrate ligand in the latter [
76]. In essence, C-O bonds of the terminal carboxylate group are 1.282 Å, in line with single C-O bonds, and 1.228 Å, corresponding to a double C=O bond (
Figure 3), whereas they are similar to each other and close to the media found for deprotonated carboxylates in those reported compounds.
3.5. Luminescence Properties
Lanthanide-centered emissions in CPs are useful in the development of solid-state photodevices [
26,
77,
78], particularly due to their intense emissions either in the visible or the near-infrared (NIR) region of the electromagnetic spectrum [
79,
80]. For this reason, a thorough analysis of the photoluminescence properties was carried out on polycrystalline samples of L-enantiomeric compounds as representative of the enantiomeric pairs of all compounds (
Figures S46–S70 in Supplementary Materials). Starting with the 3D MOFs, the exposure of
3D_Sm-L and
3D_Gd-L to UV excitation at room temperature (λ
ex = 325 nm of a Xe discharge lamp) yields no characteristic Sm(III) or Gd(III)-centered emissions, but the emission spectra consist of a weak wideband, featured with some intense peaks, covering the 400–650 nm range (see
Figures S48 and S49). This band can be attributed to the n ← π* emissions of the tartrate ligands coordinated to lanthanide(III) ions, in good agreement with previous TD-DFT calculations performed over the ligand [
56]. On another level, tartrate ligands are able to sensitize europium(III) ions because both 3D and 2D compounds (
3D_Eu-L and
2D_Eu-L) show the characteristic emissions of the lanthanide when they are excited under the same previously mentioned experimental setup. Both compounds present emission spectra composed of a first wideband peaking at ca. 400 nm that resembles that shown by compounds
3D_Sm-L and
3D_Gd-L, thus assigned to the ligand fluorescence, in addition to intraionic transitions associated with the Eu(III) ion. In particular, a shoulder at 580 nm (
7F
0 ←
5D
0), three main bands at 590 nm (
7F
1 ←
5D
0), 615 nm (
7F
2 ←
5D
0), and 698 nm (
7F
4 ←
5D
0), in addition to a minor band sited at 653 nm (
7F
3 ←
5D
0), are observed in both cases (
Figures S46 and S51). These figures also gather the excitation spectra recorded at the main emission line (λ
em = 615 nm), which reveal the absence of any significant wideband and, hence, weak ligand-centered excitation. Instead, the excitation spectra are characterized by narrow bands associated with the intraionic
f-f transitions of Eu(III), among which
7F
0 →
5L
6 (λ
ex = 397 nm) is the most intense one [
81]. As a consequence, these compounds present no excitation wavelength-dependent emission as corroborated for
3D_Eu-L (
Figure S47). In view of the good emissive characteristics of the Eu-based MOFs, the samples were then exposed to monochromatic laser excitation (λ
ex = 325 nm) under vacuum and at variable temperature. As observed in
Figure 5, the spectra are characterized by intense multiplets presenting substantial structure (see the captures of the hypersensitive
7F
2 ←
5D
0 transition centered at 616 nm), which are significantly stronger than the band corresponding to the ligand (λ
em,max = 430 nm).
It is known that the ligand scaffold is crucial to modulate the luminescence of a CP since the rigidity of the crystal structure reduces molecular vibrations, rotations, and torsions in the ligand, preventing the non-radiative excitation decay [
82]. In this way, changes in the dimensionality of MOFs could also influence the luminescence properties since the structure’s rigidity may affect luminescent processes. For comparative purposes, the relative intensity of the latter is more pronounced for
2D_Eu-L vs.
3D_Eu-L, a fact that may indicate a weaker energy transfer from tartrate ligand to Eu(III) for the former. To further analyze the emissive properties, the decay curves were recorded by monitoring the band of the hypersensitive transition using pulsed UV light (λ
ex = 325 nm). The curves show a linear exponential shape that suggests the emission of a unique radiative component, so they were fitted with the [I
t = A
0 + A
1exp(t/
τ1)] equation giving lifetimes of 342.0(6) and 409.1(2) µs, respectively, for
2D_Eu-L and
3D_Eu-L. These results, which are similar to other previously reported CPs based on nine-coordinated Eu environments [
83,
84], are in line with the occurrence of a symmetrically unique Eu(III) ion in
2D_Eu-L and the fact that the two Eu1 and Eu2 independent ions are practically undistinguishable regarding the coordination environment. Moreover, the shorter lifetime of
2D_Eu-L compared with
3D_Eu-L may be attributed to the presence of more coordination water molecules and/or hydroxide anions (3 vs. 1 per Eu(III) ion), which are known to act as effective vibrational quenchers by means of the coupling of O–H oscillators with the energy gaps between the intraionic emissive levels of Eu(III) [
85,
86]. Moreover, the decay curve collected λ
em = 430 nm supports that the process occurring in the ligand is, as expected, short fluorescence of only ca. 1.6 ns thus associated with the S
0 ← S
1 (
Sections S18 and S19, Figure S67).
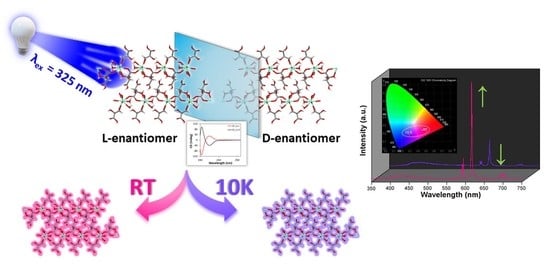
On another level, when the solid samples are cooled down to 10 K they exhibit an unusual behavior because they do not follow the usual trend by which lanthanide-centered emissions are progressively strengthened when the molecular vibrations are frozen, i.e., vibrational energy of the bonds (
Figure S52) [
87]. Instead, in this case it was observed that the europium(III) characteristic emissions become less and less intense as the temperature decreases while the ligand-centered emission (band at λ
em,max = 430 nm) is maintained all over the inspected temperature range (300—10 K,
Figure 6). As a consequence of the progressive change in the relative intensity of the bands, the emitted color of the samples shifts accordingly from red (at RT) towards blue as the ligand fluorescence gains importance. In fact, as inferred from the colorimetric diagrams, the color change is more pronounced for
2D_Eu-L since it shifts from pinkish red (0.45236, 0.24047) to reddish-purple (0.29445,0.18077) in CIE1931 scale. This interesting behavior seems to be derived from the changing excitation scenario found for the compound around 325 nm with the temperature. In this line, as observed in
Figure S52, at 10 K the sample exhibits a unique multiplet centered at 320 nm, whereas at RT it exhibits additional bands covering the 315–330 nm range, which explains the better Eu-centered emission at high temperature. To better characterize the potential performance of
2D_Eu-L as a luminescent thermometer, the generalized relative sensitivity (
Sr) was estimated by means of a ratiometric analysis of the thermal evolution of the relative intensity of the bands attributed to the
7F
2 ←
5D
0 and S
0 ← S
1 transitions (see
Figure S53). The maximum sensitivity was observed at 50 K (
Sm = 1.42 %K
−1), which is a value that falls within the range found for other lanthanide(III)-based CPs [
26,
88]. Therefore, although
2D_Eu-L presents sizeable thermometric luminescence, the changes with temperature are not so large as to further consider this compound as a luminescent sensor of the temperature. Although no further studies have been conducted in this regard, it is worth highlighting that the region of 380–390 nm could be even more adequate as to explore the luminescent thermometry caused by the mentioned temperature-dependent excitation. Interestingly, these variations in the emission hardly impact on the lifetimes as the radiative features of the
5D
0 state remain almost unchanged with a τ of 349.1(1) µs (vs 342.0(6) µs at RT). In contrast, the lifetime is more significantly enlarged for
3D_Eu-L (from 409.1(2) up to 434.3(2) µs, see
Figure S68 in the Supplementary Materials). Moreover, the absolute quantum yields (QY) were measured in solid polycrystalline samples at room temperature by means of an integrating sphere, using the same excitation and emission conditions as for the estimation of lifetimes. Among them, the QY was much higher for compound
3D_Eu-L (Φ = 32.1%) than for
2D_Eu-L (Φ = 4.8%). Based on these results, and considering that Φ
Ln = τ
obs/τ
R, the experimental radiative (
kr) and non-radiative (
knr) constants can be easily calculated:
kr = 785 s
−1 and
knr = 1660 s
−1 for
3D_Eu-L and
kr = 140 s
−1 and
knr = 2784 s
−1 for
2D_Eu-L (
Table 4).
In order to better understand the luminescence properties of these two related compounds, the most relevant theoretical parameters were calculated on the basis of the experimentally recorded spectra by means of the LUMPAC program [
61]. In this way, we followed a largely contrasted procedure to calculate the intensity parameters and quantum efficiencies as previously discussed for other works [
89,
90,
91,
92]. First, appropriate models of the compounds (models 2D-Eu and 3D-Eu hereafter) based on the spherical atomic coordinates of the coordination polyhedra were optimized by the Sparkle/RM1 model, after which charge factor (
g) and polarizability (
α) were adjusted according to the experimental emission spectra (
Table 5). Fitting of the data by LUMPAC gave 1.51 10
−20 cm
−1 and 6.14 10
−20 cm
−1 (Ω
2), 0.18 10
−20 cm
−1 and 2.19 10
−20 cm
−1 (Ω
4), and 0.01 10
−20 cm
−1 and 0.07 10
−20 cm
−1 (Ω
2), respectively, for
2D_Eu-L and
3D_Eu-L. From these values, the intensity parameters were estimated as follows:
Arad equals 149.7 s
−1 for
2D_Eu-L, with a contribution of the magnetic transition (
7F
1 ←
5D
0) being 90.2 s
−1, whereas the value of
Arad increases up to 827.8 s
−1 with a magnetic contribution of only 16.3 s
−1 for
3D_Eu-L. Taking into account the experimental lifetimes recorded for both compounds at RT, the non-radiative rates (
Anrad) may be estimated to be of 2774.2 and 1616.6 s
−1, which corroborates the better performance shown by
3D_Eu-L. These values are slightly smaller than those experimentally estimated; however they are in the range of the results commonly observed for other luminescent complexes using the same computational methodology (see
Table 4) [
90,
93].
Another relevant parameter to be determined to gain deeper insight into the energy transfers occurring in these compounds is the energy of the ligand’s excited states. To that end, the configuration interaction simple (CIS) of INDO/S implemented into ORCA program was employed [
94,
95]. These calculations set the singlet (S) and triplet (T) excited states around 39,000 (39304 and 38,997 cm
−1 for
2D_Eu-L and
3D_Eu-L) and 36,500 cm
−1 (36,360 and 36,653 cm
−1 for
2D_Eu-L and
3D_Eu-L). The non-radiative energy transfer rates between the ligands’ and Eu(III) excited states were also calculated by means of Malta’s models [
96], which consider the occurrence of three mechanisms for the excitation of metal ions during the antenna effect: dipole-2
λpole, dipole–dipole, and exchange. A comparative analysis for both compounds brings, once again, another important difference between them because both singlet (S) →
5D
4 and triplet (T) →
5D
4 multipolar transfers (
WET being 4.44 10
2 and 3.45 10
3 s
−1, respectively) are dominant for
3D_Eu-L, whereas only the T →
5D
4 is significant (
WET = 6.26 10
3 s
−1) for
2D_Eu-L (
Figure 7 and
Table 6). The lower values found for the T →
5D
1,0 transitions suggest the lesser importance of the exchange mechanism in both compounds. Similarly, the back-transfer rates are slightly greater for
2D_Eu-L than for
3D_Eu-L, among which the triplet ←
5D
4 is the dominant with values of
WBET = 3.32 10
−15 and 4.49 10
−16 s
−1. Using all these data, the quantum efficiency is determined as 5.12 and 33.87% for
2D_Eu-L and
3D_Eu-L, respectively, which are comparatively higher than the experimental values (see
Table 6). All these data are in line with the previously mentioned ratio of H
2O/OH per Eu(III), which is 3 for
2D_Eu-L but only 1 for
3D_Eu-L, in such a way that the probability of the O–H oscillator-driven quenching [
97], mediated through a vibronic coupling with the Eu-centered excited states, is simply higher. Therefore, this fact could be responsible for the large non-radiative contribution and, hence, low emission efficiency present in compound
2D_Eu-L.
When Tb(III) ion occupies the crystallographically independent metal site of the two-dimensional network, the solid sample of compound
2D_Tb-L displays bright green emission upon irradiation with UV light. Although it is true that the emission spectrum at RT with a Xe discharge lamp (λ
ex = 325 nm) presents both the characteristic intraionic bands and the band assigned to ligand’s fluorescence, the latter is not the dominating one in contrast with previous compounds. In fact, the spectrum collected under monochromatic laser beam at the same wavelength shows only the four groups of signals sited at 490 nm (
7F
6 ←
5D
4), 544 nm (
7F
5 ←
5D
4), 585 nm (
7F
4 ←
5D
4), and 622 nm (
7F
3 ←
5D
4) arising from being centered on Tb(III) ions. Under variable temperature, this compound also exhibits sizeable color change as depicted in
Figure 8, which is thought to come from the relative increase in the bands assigned to the intraionic excitations of the lanthanide ion (see
Figure S54). The analysis of the decay curves reveals that the radiative emission of Tb(III) in this structure rises up to 870.1(4) µs at RT, while it is 894.9(5) µs at 10 K (see
Figure S69 in the Supplementary Materials). The QY for this sample at RT was also experimentally measured (Φ = 28%).
The analysis of the luminescent properties of
2D_Dy-L shows that this compound presents a similar behavior with respect to its counterparts. The emission spectrum under monochromated laser excitation (λ
ex = 325 nm) shows two characteristic bands at 481 nm (
6H
15/2 ←
4F
9/2) and 574 nm (
6H
13/2 ←
4F
9/2,
Figure S56) [
81]. It is remarkable that the band assigned to the tartrate ligand (λ
em = 413 nm) remains comparatively weak with the latter bands despite the fact that tartrate lacks strong absorbing chromophores, a fact that derives from the matching of the employed excitation wavelength with the dysprosium’s intraionic transitions (see
Figure S55). Given that these spectra do not change with the temperature,
2D_Dy-L hardly changes the emission with regard to the temperature, except for the usual increase in emission intensity with the drop in temperature that implies no remarkable color change (
Figure S57). However, further analysis of the radiative signal by means of the emission lifetimes on the solid indicates the sensitization gets worse when lowering the temperature, since the ligand’s fluorescence doubles its lifetime (λ
em = 413 nm is 1.4 and 2.4 ns at RT and 10 K, respectively, see
Figure S70) whereas Dy(III)’s emission is slightly shortened (λ
em = 574 nm is 23.2 and 21.2 µs at RT and 10 K, respectively, see
Figure S71). A very low QY was also estimated from the experimental measurement (Φ = 1.6%).
At last, compounds
2D_Y-L, Sm-L, 2D_Gd-L, 2D_Ho-L, 2D_Er-L, 2D_Tm-L, and
2D_Yb-L yielded no characteristic lanthanide(III)-centered emissions upon exposition to UV excitation but only an almost identical band in the 400–650 nm range (see
Figures S57–S63) corresponding to the n ← π* emissions of the metal-coordinated hydrogen tartrate ligands.

 ,
, 


