
Continuous Hydrothermal Flow Synthesis and Characterization of ZrO2 Nanoparticles Doped with CeO2 in Supercritical Water

Abstract
:1. Introduction
2. Materials and Methods
2.1. Materials
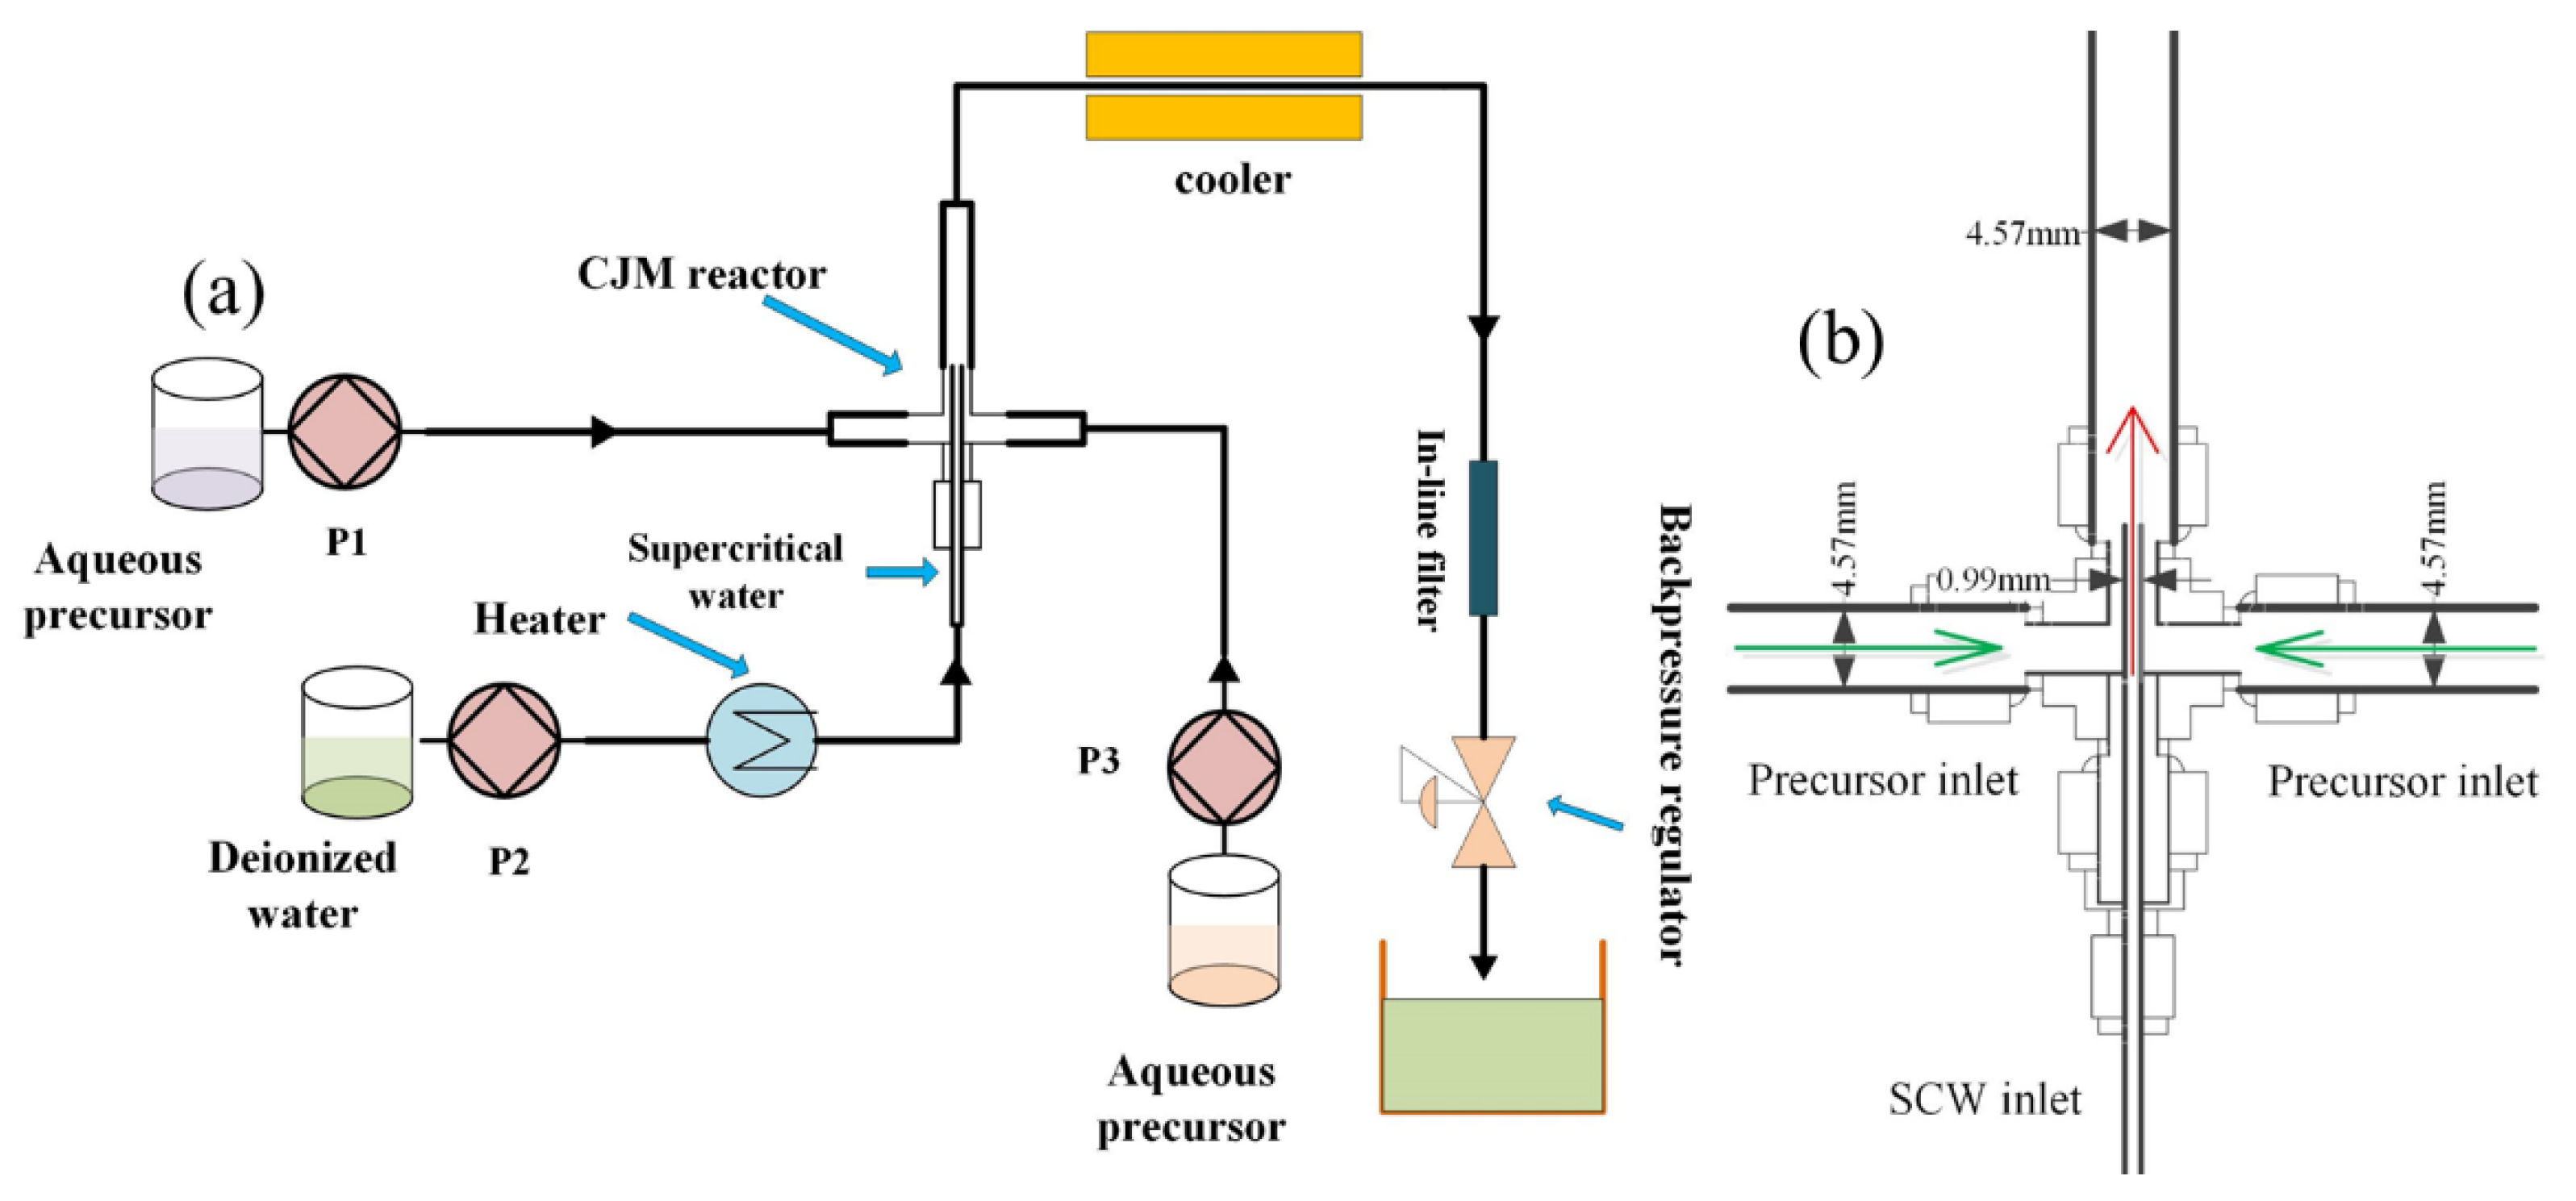
2.2. CHFS System
2.3. CZ Characterization
2.3.1. SEM-EDS
2.3.2. ICP-AES
2.3.3. X-ray Diffraction
2.3.4. FTIR
2.3.5. RAMAN
2.3.6. TEM-SEAD
2.3.7. BET-Specific Surface Area Test
2.3.8. Oxygen Storage Capacity (OSC) Test
2.3.9. H2-TPR Test
3. Results and Discussion
3.1. Elemental Analysis
3.2. X-ray Diffraction
3.3. FTIR
3.4. RAMAN
3.5. TEM-SEAD
3.6. Specific Surface and Pore Analysis
3.7. Oxygen Storage Capacity (OSC) Test
3.8. H2-TPR Test
4. Conclusions
Author Contributions
Funding
Institutional Review Board Statement
Informed Consent Statement
Data Availability Statement
Conflicts of Interest
References
- Diagne, C.; Idriss, H.; Kiennemann, A. Hydrogen production by ethanol reforming over Rh/CeO2–ZrO2 catalysts. Catal. Commun. 2002, 3, 565–571. [Google Scholar] [CrossRef]
- Hori, C.E.; Permana, H.; Ng, K.Y.S.; Brenner, A.; More, K.; Rahmoeller, K.M.; Belton, D. Thermal stability of oxygen storage properties in a mixed CeO2-ZrO2 system. Appl. Catal. B Environ. 1998, 16, 105–117. [Google Scholar] [CrossRef]
- Hosoya, A.; Tamura, S.; Imanaka, N. Catalytic combustion-type CO sensor applying Pt loaded CeO2-ZrO2-ZnO solid solution. J. Ceram. Soc. Jpn. 2014, 122, 601–603. [Google Scholar] [CrossRef] [Green Version]
- Arsent’ev, M.Y.; Kalinina, M.V.; Tikhonov, P.A.; Morozova, L.V.; Kovalenko, A.S.; Koval’ko, N.Y.; Khlamov, I.I.; Shilova, O.A. Synthesis and study of sensor oxide nanofilms in a ZrO2-CeO2 system. Glass Phys. Chem. 2014, 40, 362–366. [Google Scholar] [CrossRef]
- Izu, N.; Shin, W.; Matsubara, I.; Murayama, N. Resistive oxygen gas sensors using ceria-zirconia thick films. J. Ceram. Soc. Jpn. 2004, 112, S535–S539. [Google Scholar]
- Ahn, K.Y.; He, H.P.; Vohs, J.M.; Gorte, R.J. Enhanced thermal stability of SOFC anodes made with CeO2-ZrO2 solutions. Electrochem. Solid State Lett. 2005, 8, A414–A417. [Google Scholar] [CrossRef]
- Xia, C.; Liu, M. Low-temperature SOFCs based on Gd0.1Ce0.9O1.95 fabricated by dry pressing. Solid State Ion. 2001, 144, 249–255. [Google Scholar] [CrossRef]
- Celik, E.; Akın, Y.; Avci, E.; Sigmund, W.; Hascicek, Y. CeO2-ZrO2 insulation coatings on Ag/AgMg sheathed Bi-2212 superconducting tapes by sol-gel process for magnet technology. Appl. Supercond. IEEE Trans. 2002, 12, 1223–1226. [Google Scholar] [CrossRef]
- Terribile, D.; Trovarelli, A.; Llorca, J.; de Leitenburg, C.; Dolcetti, G. The preparation of high surface area CeO2–ZrO2 mixed oxides by a surfactant-assisted approach. Catal. Today 1998, 43, 79–88. [Google Scholar] [CrossRef]
- Daturi, M.; Finocchio, E.; Binet, C.; Lavalley, J.C.; Fally, F.; Perrichon, V.; Vidai, H.; Hickey, N.; Kašpar, J. Reduction of high surface area CeO2-ZrO2 mixed oxides. J. Phys. Chem. B 2000, 104, 9186–9194. [Google Scholar] [CrossRef]
- Jiang, P.; Lu, G.; Li, Y.; Guo, Y.; Guo, Y.; Wang, X. Preparation of La2O3-doped CeO2–ZrO2 Solid Solution with High Thermal Stability by Water-in-Oil Microemulsion. Chem. Lett. 2004, 33, 1064–1065. [Google Scholar] [CrossRef]
- Gao, F.; Xu, Z.; Wang, Q.; Hu, Z.; Gu, G. Preparation, Characterization of CeO2-ZrO2 Composite Hollow Microspheres and Their Application as Electrocatalysis Materials for Hemoglobin in Biosensor. J. Dispers. Sci. Technol. 2009, 30, 178–184. [Google Scholar] [CrossRef]
- Bhosale, A.K.; Shinde, P.; Tarwal, D.N.L.; Pawar, R.; Kadam, P.M.; Patil, P. Synthesis and characterization of highly stable optically passive CeO2–ZrO2 counter electrode. Electrochim. Acta 2010, 55, 1900–1906. [Google Scholar] [CrossRef]
- Hirano, M.; Miwa, T.; Inagaki, M. Low-Temperature Direct Synthesis of Nanoparticles of Fluorite-Type Ceria–Zirconia Solid Solutions by “Forced Cohydrolysis” at 100 °C. J. Solid State Chem. 2001, 158, 112–117. [Google Scholar] [CrossRef]
- Hirano, M.; Miwa, T.; Inagaki, M. Effect of the Presence of Ammonium Peroxodisulfate on the Direct Precipitation of Ceria and Ceria–Zirconia Solid Solutions from Acidic Aqueous Solutions. J. Am. Ceram. Soc. 2001, 84, 1728–1732. [Google Scholar] [CrossRef]
- Eslamian, M.; Ahmed, M.; Ashgriz, N. Modeling of Nano-particle Formation during Spray Pyrolysis. Nanotechnology 2006, 17, 1674–1685. [Google Scholar] [CrossRef]
- Darr, J.A.; Zhang, J.; Makwana, N.M.; Weng, X. Continuous Hydrothermal Synthesis of Inorganic Nanoparticles: Applications and Future Directions. Chem. Rev. 2017, 117, 11125–11238. [Google Scholar] [CrossRef] [Green Version]
- Kawasaki, S.-i.; Xiuyi, Y.; Sue, K.; Hakuta, Y.; Suzuki, A.; Arai, K. Continuous supercritical hydrothermal synthesis of controlled size and highly crystalline anatase TiO2 nanoparticles. J. Supercrit. Fluids 2009, 50, 276–282. [Google Scholar] [CrossRef]
- Lester, E.; Blood, P.; Denyer, J.; Giddings, D.; Azzopardi, B.; Poliakoff, M. Reaction engineering: The supercritical water hydrothermal synthesis of nano-particles. J. Supercrit. Fluids 2006, 37, 209–214. [Google Scholar] [CrossRef]
- Zhang, Z.; Brown, S.; Goodall, J.B.M.; Weng, X.; Thompson, K.; Gong, K.; Kellici, S.; Clark, R.J.H.; Evans, J.R.G.; Darr, J.A. Direct continuous hydrothermal synthesis of high surface area nanosized titania. J. Alloys Compd. 2009, 476, 451–456. [Google Scholar] [CrossRef]
- Zielke, P.; Xu, Y.; Simonsen, S.B.; Norby, P.; Kiebach, R. Simulation, design and proof-of-concept of a two-stage continuous hydrothermal flow synthesis reactor for synthesis of functionalized nano-sized inorganic composite materials. J. Supercrit. Fluids 2016, 117, 1–12. [Google Scholar] [CrossRef] [Green Version]
- Sue, K.; Suzuki, M.; Arai, K.; Ohashi, T.; Ura, H.; Matsui, K.; Hakuta, Y.; Hayashi, H.; Watanabe, M.; Hiaki, T. Size-controlled synthesis of metal oxide nanoparticles with a flow-through supercritical water method. Green Chem. 2006, 8, 634–638. [Google Scholar] [CrossRef]
- Loppinet-Serani, A.; Aymonier, C.; Cansell, F. Current and foreseeable applications of supercritical water for energy and the environment. ChemSusChem 2008, 1, 486–503. [Google Scholar] [CrossRef] [PubMed]
- Adschiri, T.; Lee, Y.-W.; Goto, M.; Takami, S. Green materials synthesis with supercritical water. Green Chem. 2011, 13, 1380–1390. [Google Scholar] [CrossRef]
- Adschiri, T.; Yoko, A. Supercritical fluids for nanotechnology. J. Supercrit. Fluids 2018, 134, 167–175. [Google Scholar] [CrossRef]
- Kim, J.-R.; Lee, K.-Y.; Suh, M.-J.; Ihm, S.-K. Ceria–zirconia mixed oxide prepared by continuous hydrothermal synthesis in supercritical water as catalyst support. Catal. Today 2012, 185, 25–34. [Google Scholar] [CrossRef]
- Kim, J.-R.; Myeong, W.-J.; Ihm, S.-K. Characteristics of CeO2–ZrO2 mixed oxide prepared by continuous hydrothermal synthesis in supercritical water as support of Rh catalyst for catalytic reduction of NO by CO. J. Catal. 2009, 263, 123–133. [Google Scholar] [CrossRef]
- Weng, X.; Cockcroft, J.K.; Hyett, G.; Vickers, M.; Boldrin, P.; Tang, C.C.; Thompson, S.P.; Parker, J.E.; Knowles, J.C.; Rehman, I.; et al. High-Throughput Continuous Hydrothermal Synthesis of an Entire Nanoceramic Phase Diagram. J. Comb. Chem. 2009, 11, 829–834. [Google Scholar] [CrossRef]
- Weng, X.; Perston, B.; Wang, X.Z.; Abrahams, I.; Lin, T.; Yang, S.; Evans, J.R.G.; Morgan, D.J.; Carley, A.F.; Bowker, M.; et al. Synthesis and characterization of doped nano-sized ceria–zirconia solid solutions. Appl. Catal. B Environ. 2009, 90, 405–415. [Google Scholar] [CrossRef]
- Ma, C.Y.; Chen, M.; Wang, X.Z. Modelling and simulation of counter-current and confined jet reactors for hydrothermal synthesis of nano-materials. Chem. Eng. Sci. 2014, 109, 26–37. [Google Scholar] [CrossRef]
- Ma, C.Y.; Liu, J.J.; Zhang, Y.; Wang, X.Z. Simulation for scale-up of a confined jet mixer for continuous hydrothermal flow synthesis of nanomaterials. J. Supercrit. Fluids 2015, 98, 211–221. [Google Scholar] [CrossRef]
- Gruar, R.I.; Tighe, C.J.; Darr, J.A. Scaling-up a Confined Jet Reactor for the Continuous Hydrothermal Manufacture of Nanomaterials. Ind. Eng. Chem. Res. 2013, 52, 5270–5281. [Google Scholar] [CrossRef]
- Holder, C.F.; Schaak, R.E. Tutorial on Powder X-ray Diffraction for Characterizing Nanoscale Materials. ACS Nano 2019, 13, 7359–7365. [Google Scholar] [CrossRef] [PubMed] [Green Version]
- Renuka, L.; Anantharaju, K.S.; Sharma, S.C.; Nagabhushana, H.; Vidya, Y.S.; Nagaswarupa, H.P.; Prashantha, S.C. A comparative study on the structural, optical, electrochemical and photocatalytic properties of ZrO2 nanooxide synthesized by different routes. J. Alloys Compd. 2017, 695, 382–395. [Google Scholar] [CrossRef]
- Guo, G.-Y.; Chen, Y.-L.; Ying, W.-J. Thermal, spectroscopic and X-ray diffractional analyses of zirconium hydroxides precipitated at low pH values. Mater. Chem. Phys. 2004, 84, 308–314. [Google Scholar] [CrossRef]
- Kanade, K.G.; Baeg, J.O.; Apte, S.K.; Prakash, T.L.; Kale, B.B. Synthesis and characterization of nanocrystallined zirconia by hydrothermal method. Mater. Res. Bull. 2008, 43, 723–729. [Google Scholar] [CrossRef]
- Liu, X.; Wang, T.; Liu, J.; Jiang, F.; Tang, H.; Feng, G.; Jiang, W. Preparation, characterization and growth mechanism of ZrO2 nanosheets. Ceram. Int. 2020, 46, 4864–4869. [Google Scholar] [CrossRef]
- Gurushantha, K.; Anantharaju, K.S.; Nagabhushana, H.; Sharma, S.C.; Vidya, Y.S.; Shivakumara, C.; Nagaswarupa, H.P.; Prashantha, S.C.; Anilkumar, M.R. Facile green fabrication of iron-doped cubic ZrO2 nanoparticles by Phyllanthus acidus: Structural, photocatalytic and photoluminescent properties. J. Mol. Catal. A Chem. 2015, 397, 36–47. [Google Scholar] [CrossRef]
- Wang, S.F.; Gu, F.; Lü, M.K.; Yang, Z.S.; Zhou, G.J.; Zhang, H.P.; Zhou, Y.; Wang, S.M. Structure evolution and photoluminescence properties of ZrO2:Eu3+ nanocrystals. Opt. Mater. 2006, 28, 1222–1226. [Google Scholar] [CrossRef]
- Reddy, C.V.; Babu, B.; Reddy, I.N.; Shim, J. Synthesis and characterization of pure tetragonal ZrO2 nanoparticles with enhanced photocatalytic activity. Ceram. Int. 2018, 44, 6940–6948. [Google Scholar] [CrossRef]
- Davar, F.; Hassankhani, A.; Loghman-Estarki, M.R. Controllable synthesis of metastable tetragonal zirconia nanocrystals using citric acid assisted sol–gel method. Ceram. Int. 2013, 39, 2933–2941. [Google Scholar] [CrossRef]
- Buttersack, C. Modeling of type IV and V sigmoidal adsorption isotherms. Phys. Chem. Chem. Phys. PCCP 2019, 21, 5614–5626. [Google Scholar] [CrossRef] [PubMed] [Green Version]
- Scherdel, C.; Reichenauer, G.; Wiener, M. Relationship between pore volumes and surface areas derived from the evaluation of N2-sorption data by DR-, BET- and t-plot. Microporous Mesoporous Mater. 2010, 132, 572–575. [Google Scholar] [CrossRef]
- Harkins, W.D.; Jura, G. Surfaces of Solids. XIII. A Vapor Adsorption Method for the Determination of the Area of a Solid without the Assumption of a Molecular Area, and the Areas Occupied by Nitrogen and Other Molecules on the Surface of a Solid. J. Am. Chem. Soc. 1944, 66, 1366–1373. [Google Scholar] [CrossRef]
- Haghighatju, F.; Hashemipour Rafsanjani, H.; Esmaeilzadeh, F. Estimation of the dimension of micropores and mesopores in single walled carbon nanotubes using the method Horvath–Kawazoe, Saito and Foley and BJH equations. Micro Nano Lett. 2017, 12, 1–5. [Google Scholar] [CrossRef]
- Aneggi, E.; Boaro, M.; de Leitenburg, C.; Dolcetti, G.; Trovarelli, A. Insights into the redox properties of ceria-based oxides and their implications in catalysis. J. Alloys Compd. 2006, 408, 1096–1102. [Google Scholar] [CrossRef]


| 1CZ | 2CZ | 3CZ | 4CZ | |
|---|---|---|---|---|
| ZrO(NO3)2·xH2O (g) | 20.8107 | 18.4984 | 16.1861 | 13.8738 |
| Ce(NO3)3·6H2O (g) | 4.3422 | 8.6844 | 13.0266 | 17.3688 |
| Ce: Zr (molar ratio) | 1:9 | 2:8 | 3:7 | 4:6 |
| Ce:Zr (Molar Ratio) | 1CZ | 2CZ | 3CZ | 4CZ |
|---|---|---|---|---|
| EDS | 1.76:18.72 | 3.43:15.46 | 5.71:14.61 | 6.84:11.26 |
| ICP-AES | 2.16:20.47 | 4.61:19.4 | 6.22:15.51 | 7.69:12.54 |
| Date | 1CZ | 2CZ | 3CZ | 4CZ |
|---|---|---|---|---|
| BET surface area (m2/g) | 147.7 | 164.4 | 153.6 | 161.1 |
| C | 92.75 | 83.88 | 83.07 | 96.14 |
| Correlation coefficient | 0.9999539 | 0.9999827 | 0.9999418 | 0.9999625 |
| Volume (cm3/g) | 1CZ | 2CZ | 3CZ | 4CZ |
|---|---|---|---|---|
| t-Plot | 0.005626 | 0.006665 | 0.002708 | 0.003913 |
| BJH | 0.289700 | 0.245361 | 0.273827 | 0.260834 |
| Samples | 1CZ | 2CZ | 3CZ | 4CZ |
|---|---|---|---|---|
| OSC (μmol/g) | 433.7 | 495.6 | 535.7 | 631.1 |
Publisher’s Note: MDPI stays neutral with regard to jurisdictional claims in published maps and institutional affiliations. |
© 2022 by the authors. Licensee MDPI, Basel, Switzerland. This article is an open access article distributed under the terms and conditions of the Creative Commons Attribution (CC BY) license (https://creativecommons.org/licenses/by/4.0/).
Share and Cite
Li, Q.; Liu, L.; Wang, Z.; Wang, X. Continuous Hydrothermal Flow Synthesis and Characterization of ZrO2 Nanoparticles Doped with CeO2 in Supercritical Water. Nanomaterials 2022, 12, 668. https://doi.org/10.3390/nano12040668
Li Q, Liu L, Wang Z, Wang X. Continuous Hydrothermal Flow Synthesis and Characterization of ZrO2 Nanoparticles Doped with CeO2 in Supercritical Water. Nanomaterials. 2022; 12(4):668. https://doi.org/10.3390/nano12040668
Chicago/Turabian StyleLi, Qingyun, Lingyu Liu, Zihua Wang, and Xuezhong Wang. 2022. "Continuous Hydrothermal Flow Synthesis and Characterization of ZrO2 Nanoparticles Doped with CeO2 in Supercritical Water" Nanomaterials 12, no. 4: 668. https://doi.org/10.3390/nano12040668