
Nanoarchitectonics of Ni/CeO2 Catalysts: The Effect of Pretreatment on the Low-Temperature Steam Reforming of Glycerol

Abstract
:
1. Introduction
2. Materials and Methods
2.1. Materials and Catalyst Preparation
2.2. Catalyst Characterization
2.3. Catalytic Test
3. Results and Discussion
3.1. Structure and Properties of Calcined/Reduced Catalysts
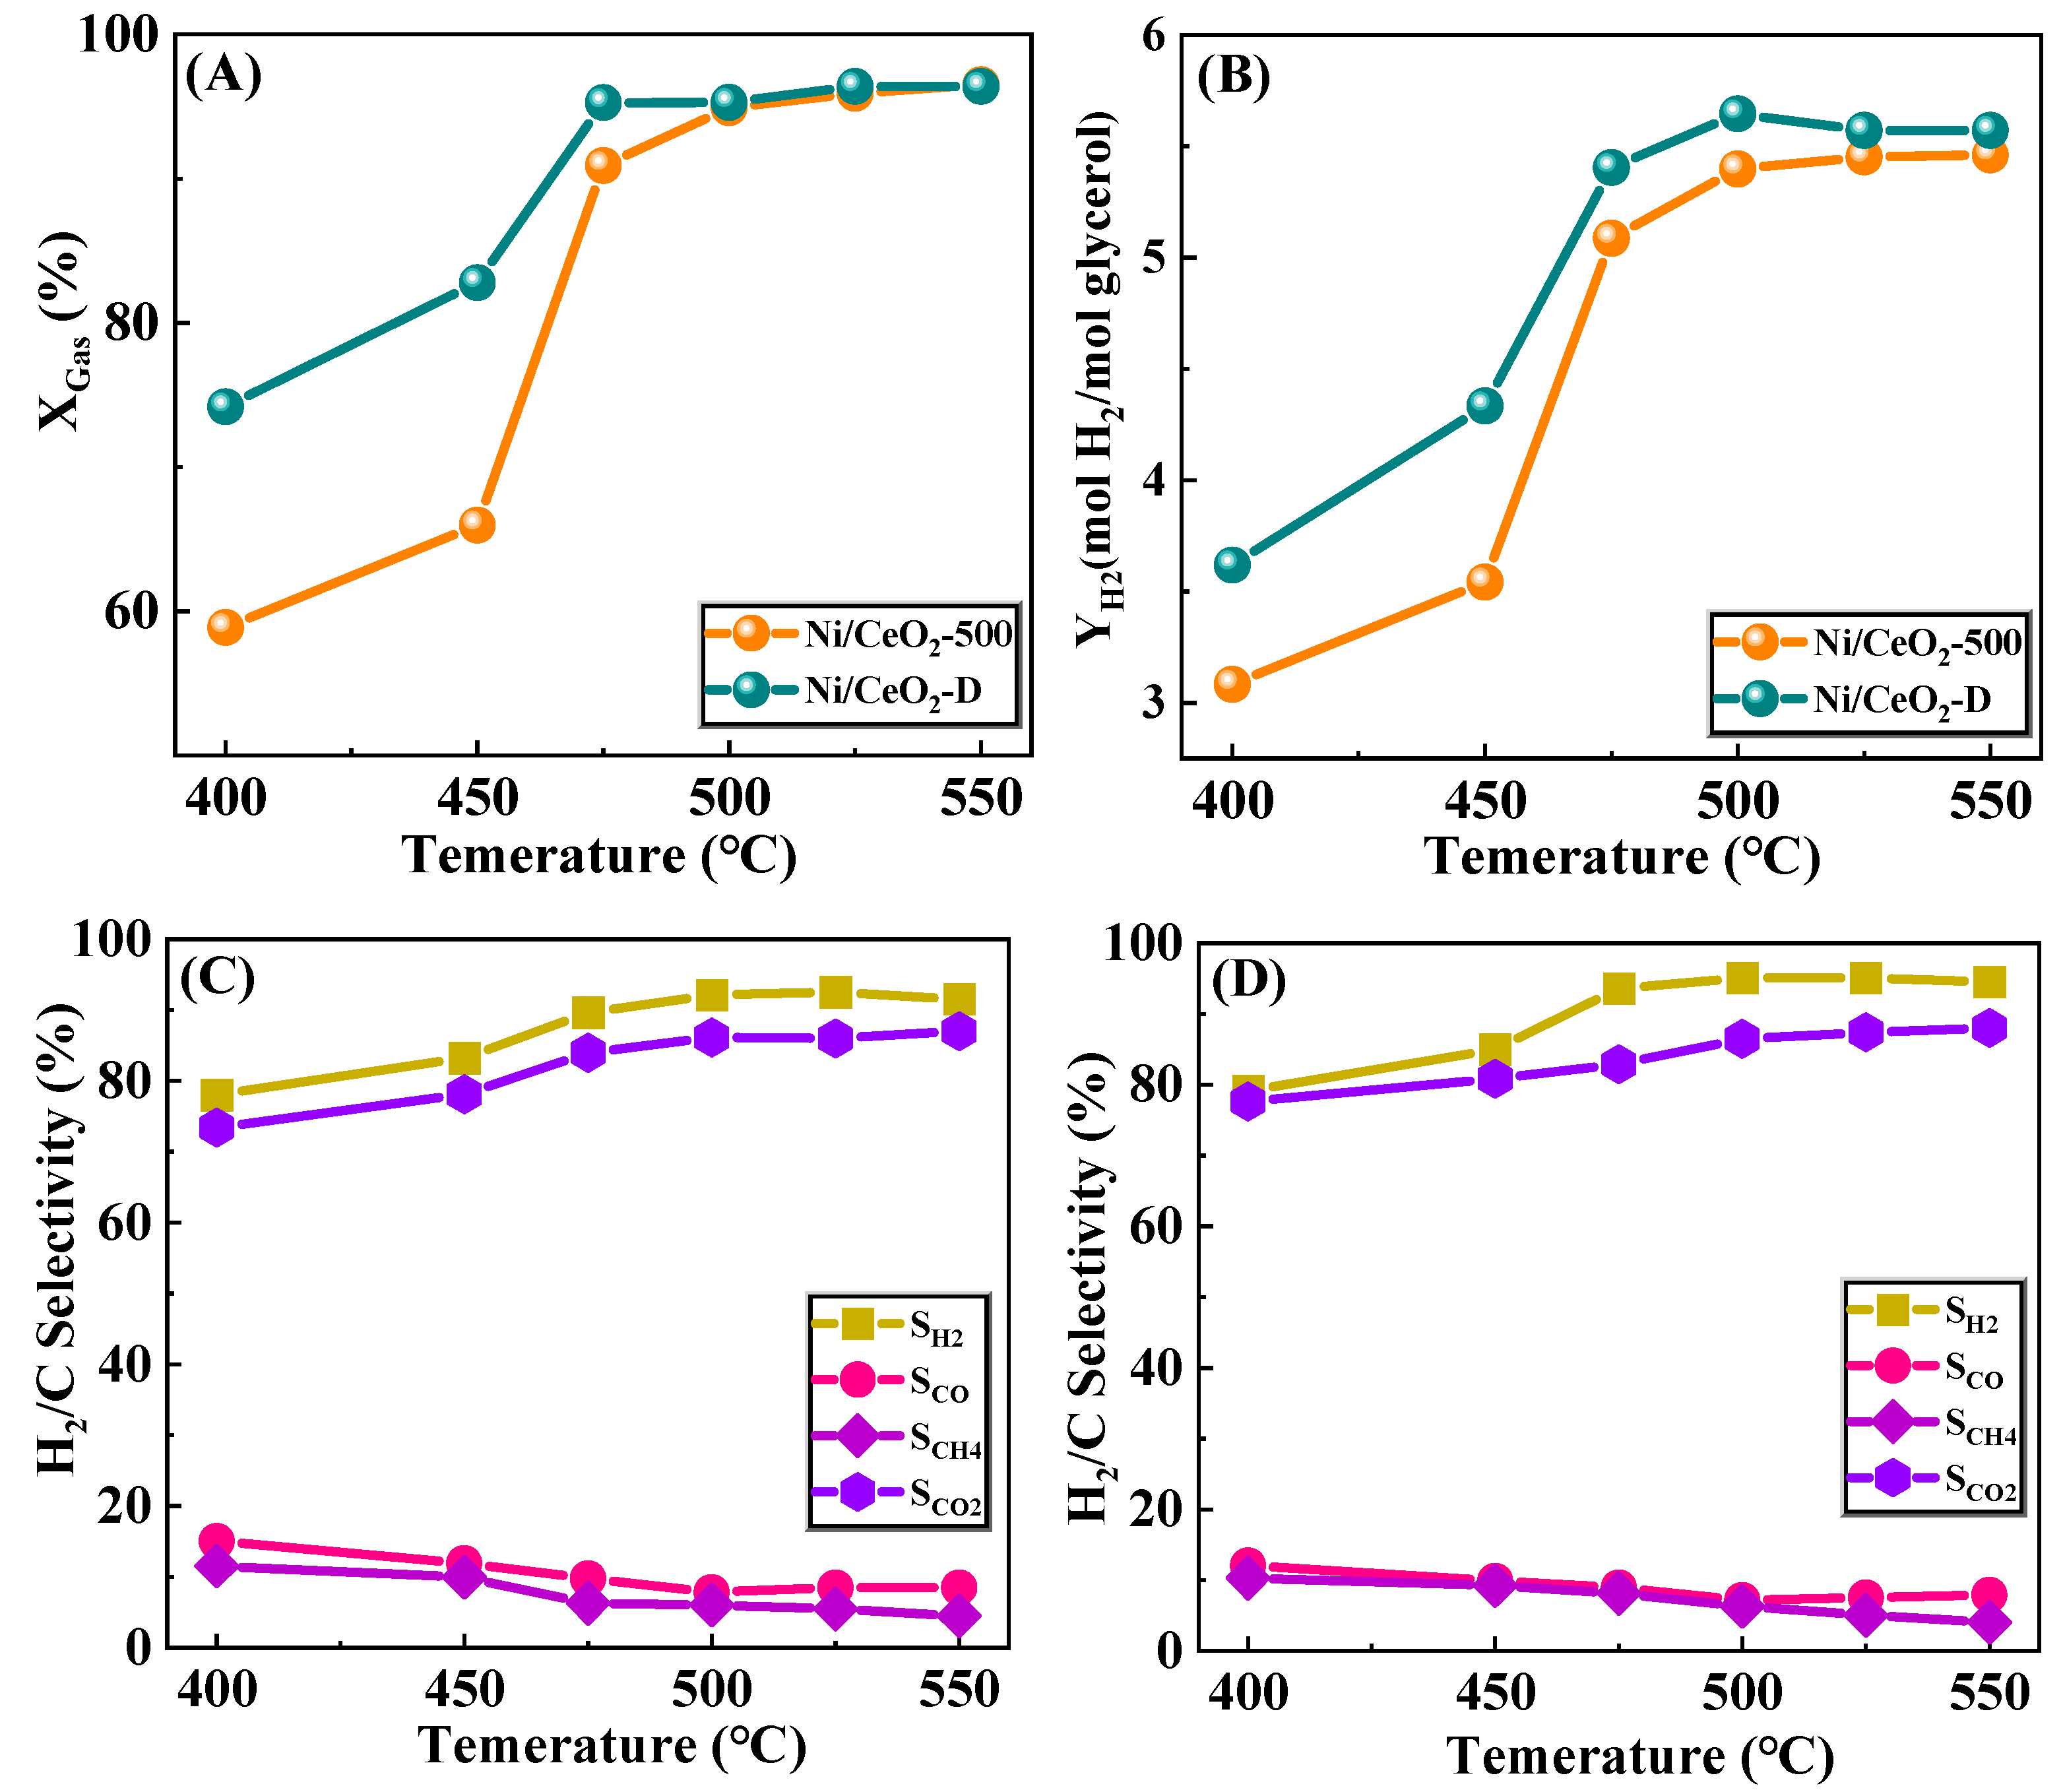
3.2. Activity Evaluation of Ni/CeO2-500 and Ni/CeO2-D Catalysts
3.3. Catalytic Stability Test and Characterization of the Spent Catalyst
3.3.1. Catalytic Stability Test
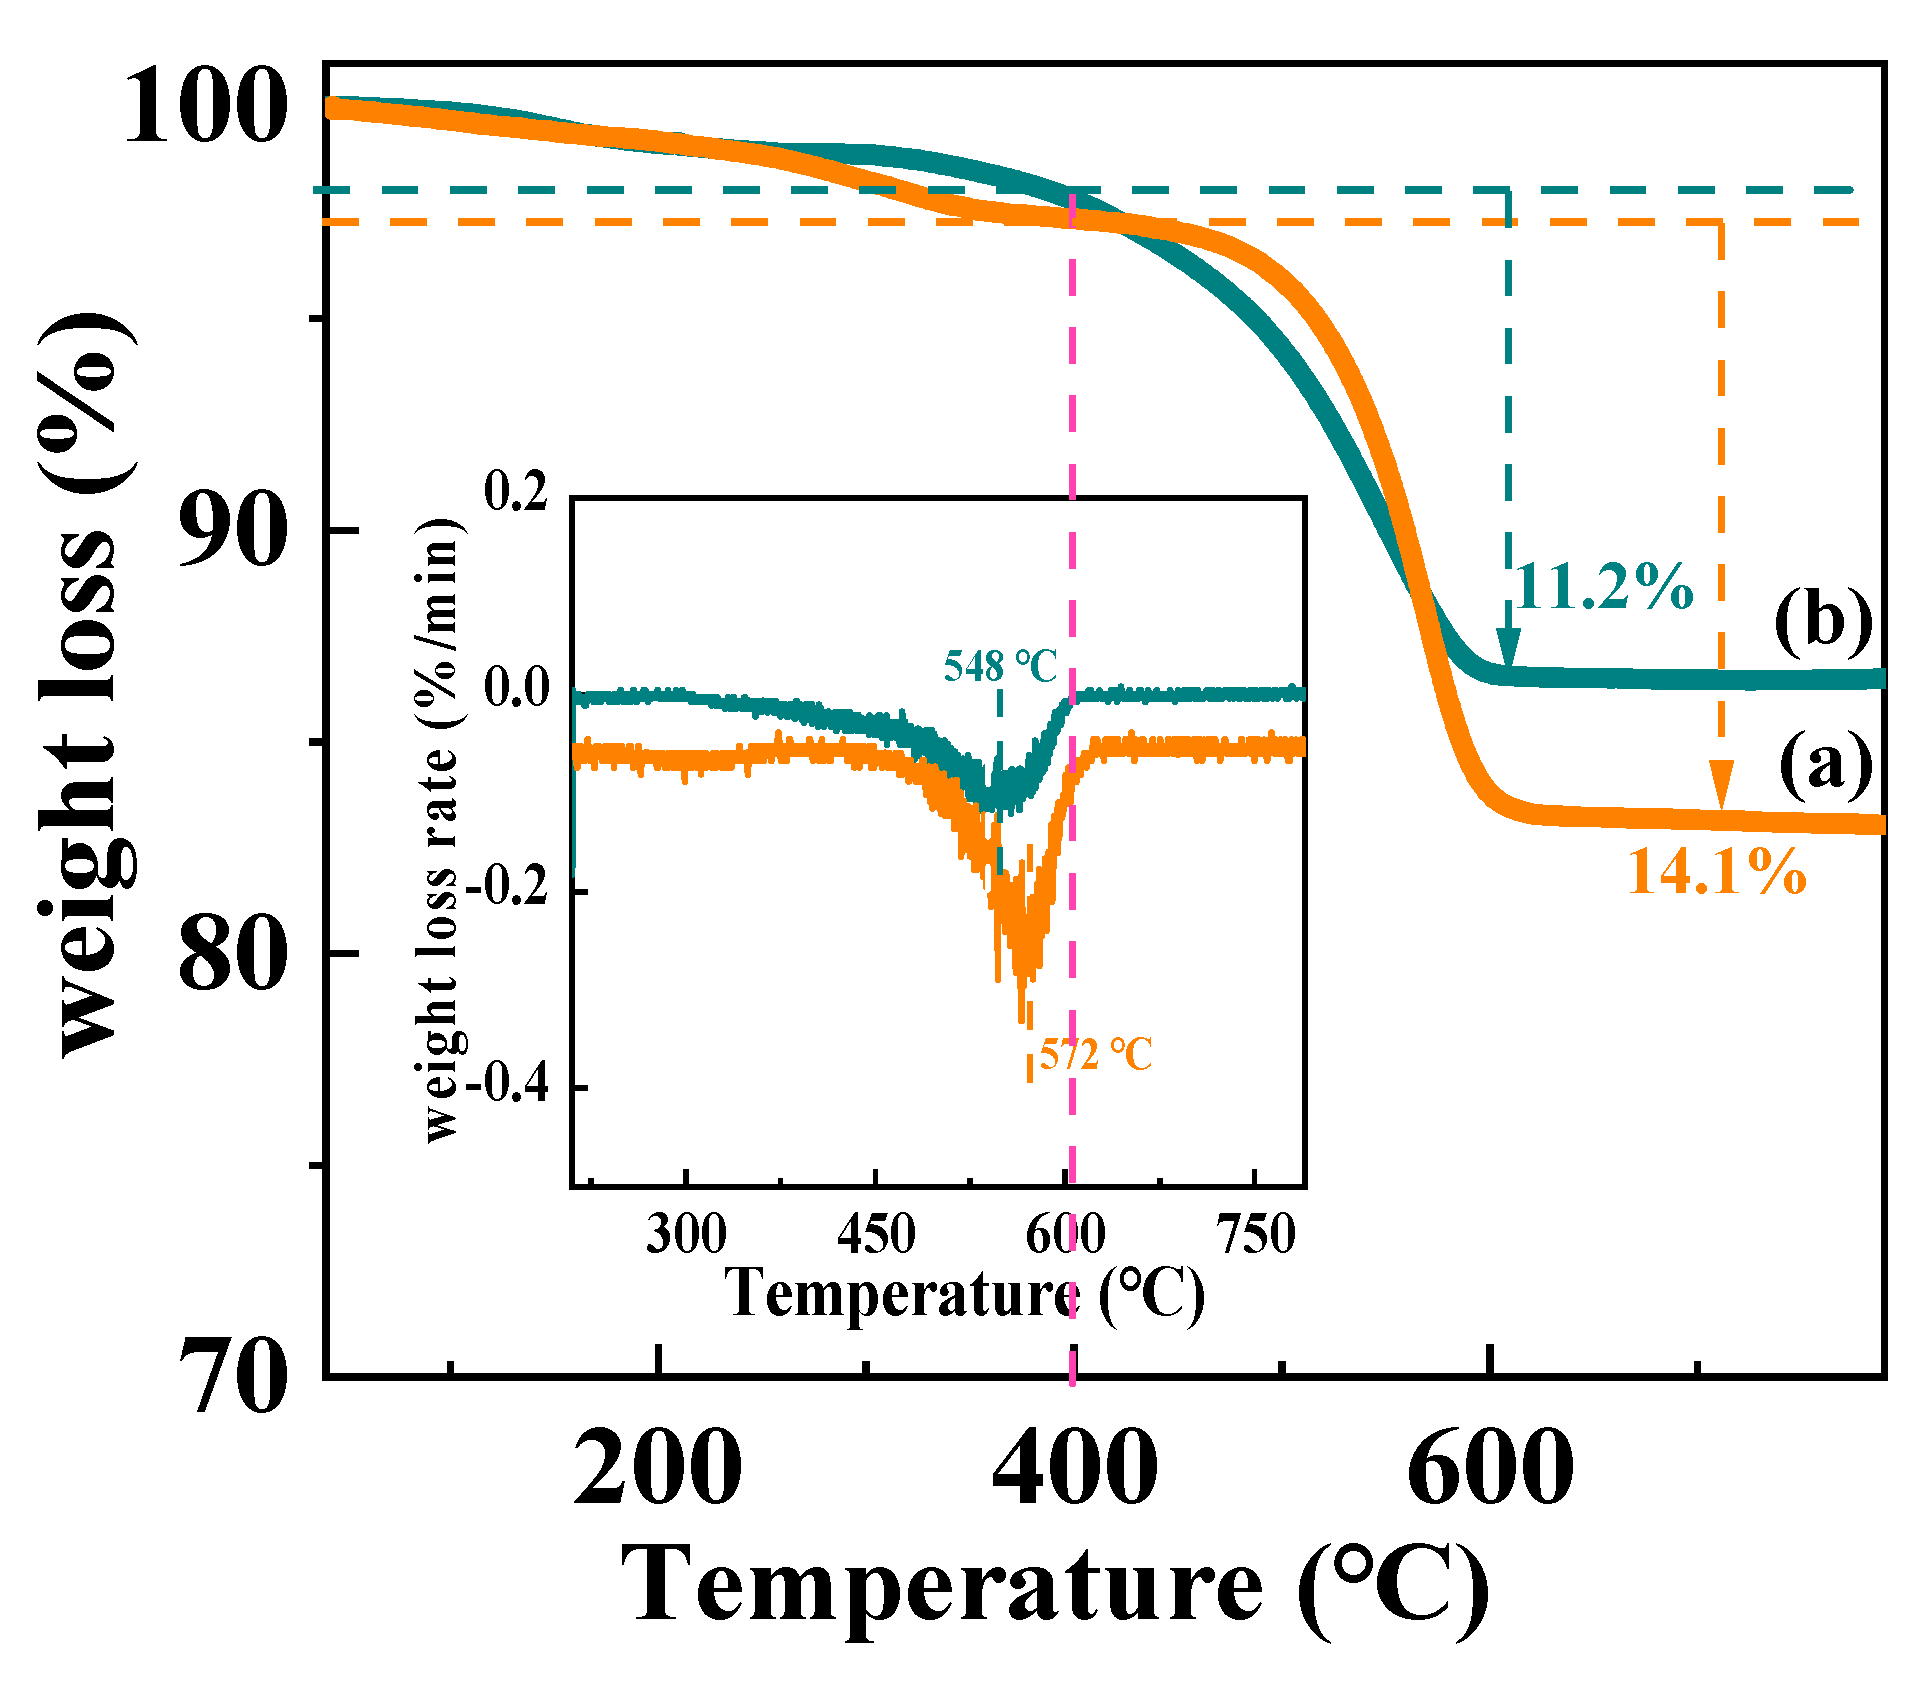
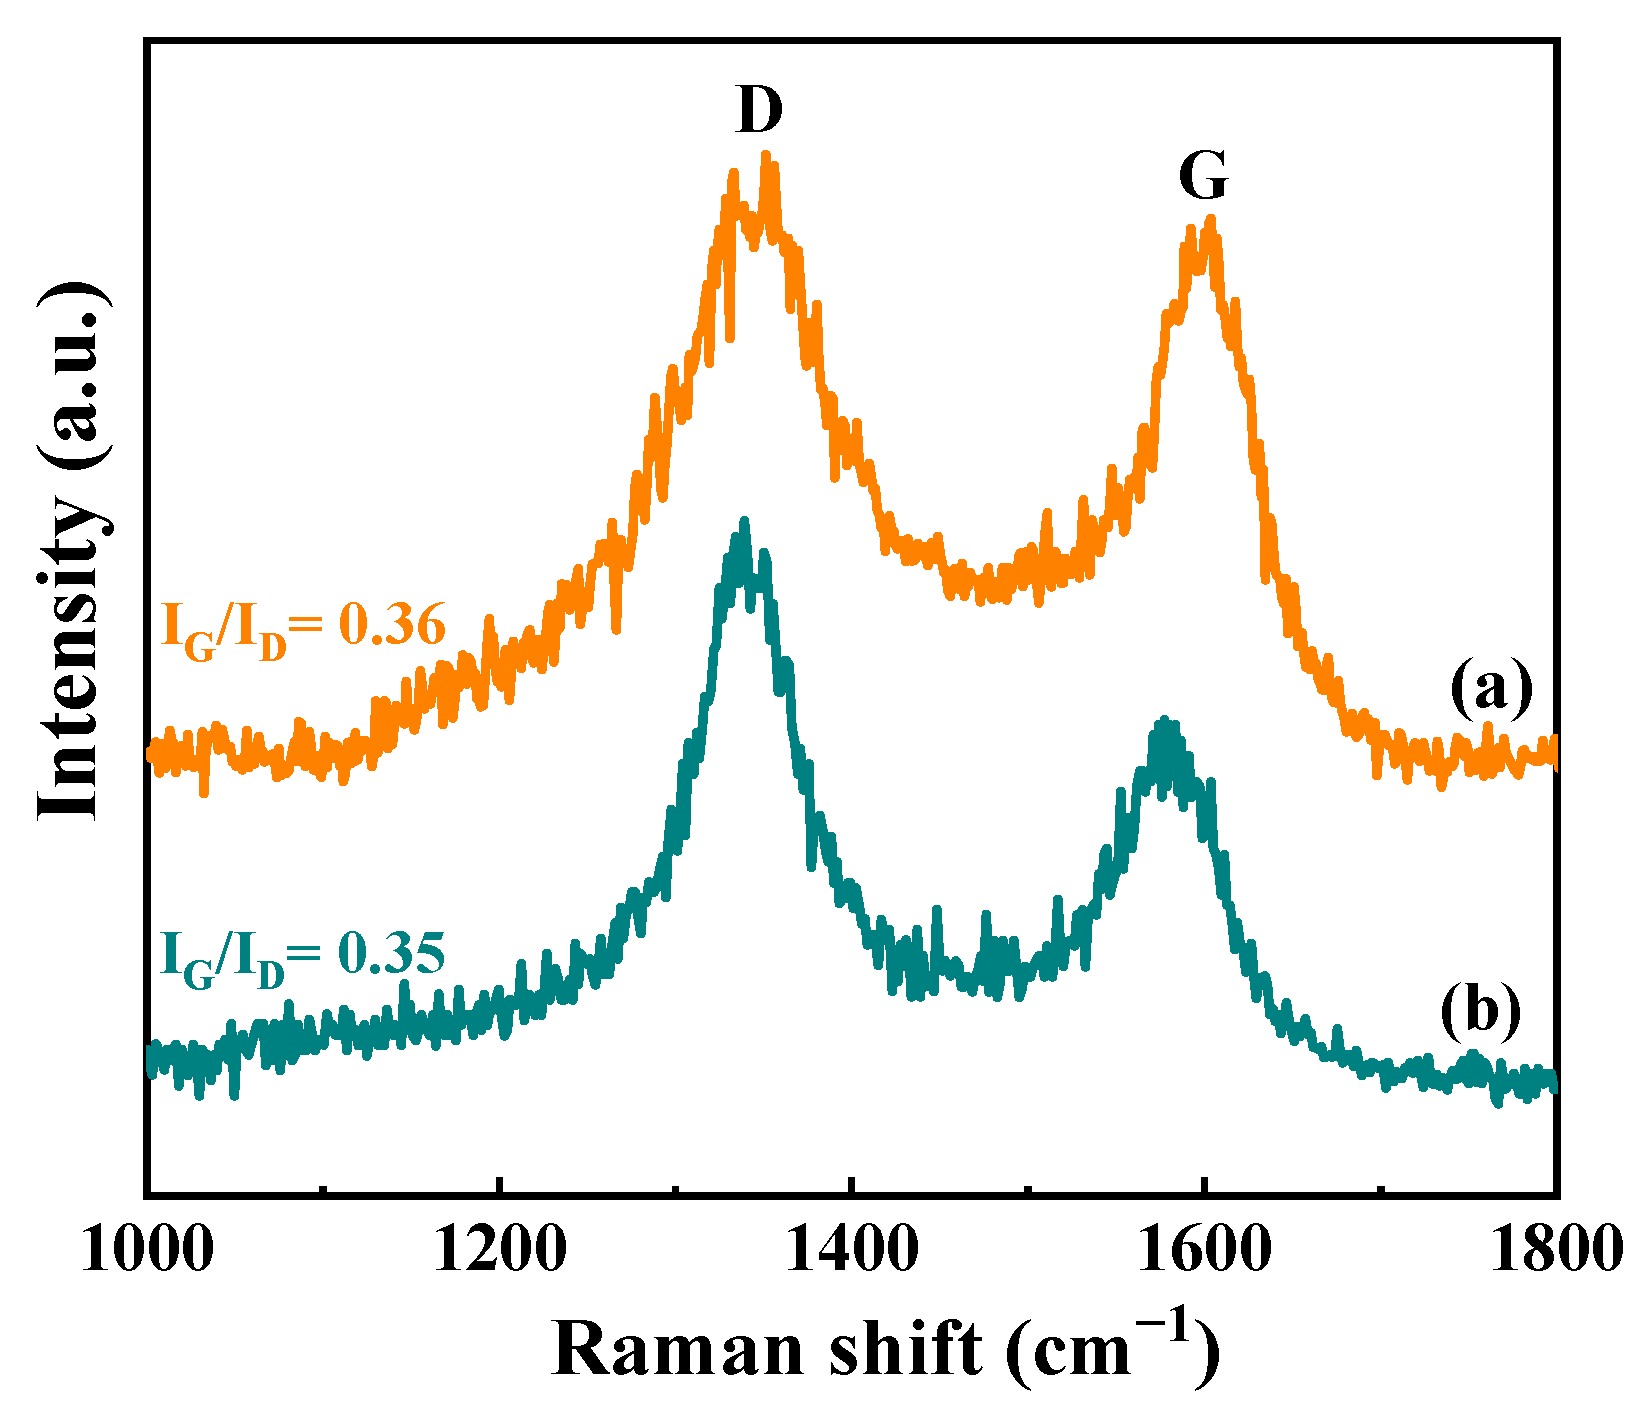
3.3.2. Structure and Properties of Spent Catalysts
4. Conclusions
Author Contributions
Funding
Data Availability Statement
Conflicts of Interest
References
- Wu, G.W.; Zhang, C.X.; Li, S.R.; Han, Z.P.; Wang, T.; Ma, X.B.; Gong, J.L. Hydrogen Production via Glycerol Steam Reforming over Ni/Al2O3: Influence of Nickel Precursors. ACS Sustain. Chem. Eng. 2013, 1, 1052–1062. [Google Scholar] [CrossRef]
- Schwengber, C.A.; Alves, H.J.; Schaffner, R.A.; da Silva, F.A.; Sequinel, R.; Bach, V.R.; Ferracin, R.J. Overview of glycerol reforming for hydrogen production. Renew. Sustain. Energy Rev. 2016, 58, 259–266. [Google Scholar] [CrossRef]
- Tran, N.H.; Kamali Kannangara, G.S. Conversion of glycerol to hydrogen rich gas. Chem. Soc. Rev. 2013, 42, 9454–9479. [Google Scholar] [CrossRef]
- Dou, B.L.; Song, Y.C.; Wang, C.; Chen, H.S.; Xu, Y.J. Hydrogen production from catalytic steam reforming of biodiesel byproduct glycerol: Issues and challenges. Renew. Sustain. Energy Rev. 2014, 30, 950–960. [Google Scholar] [CrossRef]
- Cui, Y.; Galvita, V.; Rihko-Struckmann, L.; Lorenz, H.; Sundmacher, K. Steam reforming of glycerol: The experimental activity of La1-Ce NiO3 catalyst in comparison to the thermodynamic reaction equilibrium. Appl. Catal. B 2009, 90, 29–37. [Google Scholar] [CrossRef]
- Zhou, C.H.; Beltramini, J.N.; Fan, Y.X.; Lu, G.Q. Chemoselective catalytic conversion of glycerol as a biorenewable source to valuable commodity chemicals. Chem. Soc. Rev. 2008, 37, 527–549. [Google Scholar] [CrossRef]
- Silva, J.M.; Soria, M.A.; Madeira, L.M. Challenges and strategies for optimization of glycerol steam reforming process. Renew. Sustain. Energy Rev. 2015, 42, 1187–1213. [Google Scholar] [CrossRef] [Green Version]
- Charisiou, N.D.; Polychronopoulou, K.; Asif, A.; Goula, M.A. The potential of glycerol and phenol towards H2 production using steam reforming reaction: A review. Surf. Coat. Technol. 2018, 352, 92–111. [Google Scholar] [CrossRef]
- Rossetti, I.; Gallo, A.; Dal Santo, V.; Bianchi, C.L.; Nichele, V.; Signoretto, M.; Finocchio, E.; Ramis, G.; Michele, A.D. Nickel Catalysts Supported Over TiO2, SiO2 and ZrO2 for the Steam Reforming of Glycerol. ChemCatChem 2013, 5, 294–306. [Google Scholar] [CrossRef]
- Pompeo, F.; Santori, G.F.; Nichio, N.N. Hydrogen production by glycerol steam reforming with Pt/SiO2 and Ni/SiO2 catalysts. Catal. Today 2011, 172, 183–188. [Google Scholar] [CrossRef]
- Li, S.R.; Gong, J.L. Strategies for improving the performance and stability of Ni-based catalysts for reforming reactions. Chem. Soc. Rev. 2014, 43, 7245–7256. [Google Scholar] [CrossRef]
- Sharma, Y.C.; Kumar, A.; Prasad, R.; Upadhyay, S.N. Ethanol steam reforming for hydrogen production: Latest and effective catalyst modification strategies to minimize carbonaceous deactivation. Renew. Sustain. Energy Rev. 2017, 74, 89–103. [Google Scholar] [CrossRef]
- Tian, H.; Li, X.Y.; Zeng, L.; Gong, J.L. Recent Advances on the Design of Group VIII Base-Metal Catalysts with Encapsulated Structures. ACS Catal. 2015, 5, 4959–4977. [Google Scholar] [CrossRef]
- Ahmadi, M.; Mistry, H.; Roldan Cuenya, B. Tailoring the Catalytic Properties of Metal Nanoparticles via Support Interactions. J. Phys. Chem. Lett. 2016, 7, 3519–3533. [Google Scholar] [CrossRef] [PubMed]
- Paier, J.; Penschke, C.; Sauer, J. Oxygen defects and surface chemistry of ceria: Quantum chemical studies compared to experiment. Chem. Rev. 2013, 113, 3949–3985. [Google Scholar] [CrossRef] [PubMed]
- López, J.M.; Gilbank, A.L.; García, T.; Solsona, B.; Agouram, S.; Torrente-Murciano, L. The prevalence of surface oxygen vacancies over the mobility of bulk oxygen in nanostructured ceria for the total toluene oxidation. Appl. Catal. B 2015, 174-175, 403–412. [Google Scholar] [CrossRef] [Green Version]
- Kourtelesis, M.; Moraes, T.S.; Mattos, L.V.; Niakolas, D.K.; Noronha, F.B.; Verykios, X. The effects of support morphology on the performance of Pt/CeO2 catalysts for the low temperature steam reforming of ethanol. Appl. Catal. B 2021, 284, 119757. [Google Scholar] [CrossRef]
- Nahar, G.; Dupont, V. Hydrogen production from simple alkanes and oxygenated hydrocarbons over ceria-zirconia supported catalysts: Review. Renew. Sustain. Energy Rev. 2014, 32, 777–796. [Google Scholar] [CrossRef]
- Xiao, Z.; Wu, C.; Wang, L.; Xu, J.; Zheng, Q.; Pan, L.; Zou, J.; Zhang, X.; Li, G. Boosting hydrogen production from steam reforming of ethanol on nickel by lanthanum doped ceria. Appl. Catal. B 2021, 286, 119884. [Google Scholar] [CrossRef]
- Rodríguez, C.; Moreno, S.; Molina, R. Oxygen mobility and its relationship with the oxidative steam reforming of ethanol (OSRE). Appl. Surf. Sci. 2019, 485, 293–303. [Google Scholar] [CrossRef]
- Song, H.; Ozkan, U. Ethanol steam reforming over Co-based catalysts: Role of oxygen mobility. J. Catal. 2009, 261, 66–74. [Google Scholar] [CrossRef]
- Pant, K.K.; Jain, R.; Jain, S. Renewable hydrogen production by steam reforming of glycerol over Ni/CeO2 catalyst prepared by precipitation deposition method. Korean J. Chem. Eng. 2011, 28, 1859–1866. [Google Scholar] [CrossRef]
- Wang, B.; Xiong, Y.Y.; Han, Y.Y.; Hong, J.P.; Zhang, Y.H.; Li, J.L.; Jing, F.L.; Chu, W. Preparation of stable and highly active Ni/CeO2 catalysts by glow discharge plasma technique for glycerol steam reforming. Appl. Catal. B 2019, 249, 257–265. [Google Scholar] [CrossRef]
- Zhu, H.; Qin, Z.; Shan, W.; Shen, W.; Wang, J. Pd/CeO2-TiO2 catalyst for CO oxidation at low temperature: A TPR study with H2 and CO as reducing agents. J. Catal. 2004, 225, 267–277. [Google Scholar] [CrossRef]
- Chen, L.; Zhang, J.; Liang, X. Reducing gas atmosphere (H2, CO) assisted formation of Fe-Ce-Ox composite oxides with enhanced catalytic activity for water-gas shift reaction. Catal. Commun. 2020, 138, 105849. [Google Scholar] [CrossRef]
- Wang, Y.Z.; Zhu, S.S.; Zheng, X.Q.; Lu, J.C.; Zhao, Y.; He, S.F.; Lu, H.H.; Luo, Y.M. Tuning Metal-Support Interaction and Surface Acidic Sites of Ni/Al2O3 by Dopamine Modification for Glycerol Steam Reforming. ChemCatChem 2021, 14, 1–16. [Google Scholar]
- Kamonsuangkasem, K.; Therdthianwong, S.; Therdthianwong, A.; Thammajak, N. Remarkable activity and stability of Ni catalyst supported on CeO2-Al2O3 via CeAlO3 perovskite towards glycerol steam reforming for hydrogen production. Appl. Catal. B 2017, 218, 650–663. [Google Scholar] [CrossRef]
- Wang, R.; Liu, S.; Liu, S.; Li, X.; Zhang, Y.; Xie, C.; Zhou, S.; Qiu, Y.; Luo, S.; Jing, F.; et al. Glycerol steam reforming for hydrogen production over bimetallic MNi/CNTs (M Co, Cu and Fe) catalysts. Catal. Today 2020, 355, 128–138. [Google Scholar] [CrossRef]
- Araiza, D.G.; Gómez-Cortés, A.; Díaz, G. Effect of ceria morphology on the carbon deposition during steam reforming of ethanol over Ni/CeO2 catalysts. Catal. Today. 2020, 349, 235–243. [Google Scholar] [CrossRef]
- Hu, J.; Yu, C.; Bi, Y.; Wei, L.; Chen, J.; Chen, X. Preparation and characterization of Ni/CeO2-SiO2 catalysts and their performance in catalytic partial oxidation of methane to syngas. Chin. J. Catal. 2014, 35, 8–20. [Google Scholar] [CrossRef]
- Chen, D.; He, D.; Lu, J.; Zhong, L.; Liu, F.; Liu, J.; Yu, J.; Wan, G.; He, S.; Luo, Y. Investigation of the role of surface lattice oxygen and bulk lattice oxygen migration of cerium-based oxygen carriers: XPS and designed H2-TPR characterization. Appl. Catal. B 2017, 218, 249–259. [Google Scholar] [CrossRef]
- Yang, S.; Zhou, F.; Liu, Y.; Zhang, L.; Chen, Y.; Wang, H.; Tian, Y.; Zhang, C.; Liu, D. Morphology effect of ceria on the performance of CuO/CeO2 catalysts for hydrogen production by methanol steam reforming. Int. J. Hydrogen Energy 2019, 44, 7252–7261. [Google Scholar] [CrossRef]
- Ye, R.-P.; Li, Q.; Gong, W.; Wang, T.; Razink, J.J.; Lin, L.; Qin, Y.-Y.; Zhou, Z.; Adidharma, H.; Tang, J.; et al. High-performance of nanostructured Ni/CeO2 catalyst on CO2 methanation. Appl. Catal. B 2020, 268, 118474. [Google Scholar] [CrossRef]
- Zheng, X.; Li, Y.; Zhang, L.; Shen, L.; Xiao, Y.; Zhang, Y.; Au, C.; Jiang, L. Insight into the effect of morphology on catalytic performance of porous CeO2 nanocrystals for H2S selective oxidation. Appl. Catal. B 2019, 252, 98–110. [Google Scholar] [CrossRef]
- Li, M.; van Veen, A.C. Tuning the catalytic performance of Ni-catalysed dry reforming of methane and carbon deposition via Ni-CeO2−x interaction. Appl. Catal. B 2018, 237, 641–648. [Google Scholar] [CrossRef] [Green Version]
- Singha, R.K.; Shukla, A.; Yadav, A.; Sivakumar Konathala, L.N.; Bal, R. Effect of metal-support interaction on activity and stability of Ni-CeO2 catalyst for partial oxidation of methane. Appl. Catal. B 2017, 202, 473–488. [Google Scholar] [CrossRef]
- Xiao, Z.; Li, Y.; Hou, F.; Wu, C.; Pan, L.; Zou, J.; Wang, L.; Zhang, X.; Liu, G.; Li, G. Engineering oxygen vacancies and nickel dispersion on CeO2 by Pr doping for highly stable ethanol steam reforming. Appl. Catal. B 2019, 258, 117940. [Google Scholar] [CrossRef]
- Ma, H.Y.; Zeng, L.; Tian, H.; Li, D.; Wang, X.; Li, X.Y.; Gong, J.L. Efficient hydrogen production from ethanol steam reforming over La-modified ordered mesoporous Ni-based catalysts. Appl. Catal. B 2016, 181, 321–331. [Google Scholar] [CrossRef]
- Lu, G.; Linsebigler, A.; Yates, J.T., Jr. Photooxidation of CH3CI on TiO2 (110): A Mechanism Not Involving H2O. J. Phys. Chem. 1995, 99, 7626–7631. [Google Scholar] [CrossRef]
- Henderson, M.A.; Epling, W.S.; Perkins, C.L.; Peden, C.H.; Diebold, U. Interaction of Molecular Oxygen with the Vacuum-Annealed TiO2(110) Surface: Molecular and Dissociative Channels. J. Phys. Chem. B 1999, 103, 5328–5337. [Google Scholar] [CrossRef]
- Charisiou, N.D.; Siakavelas, G.; Papageridis, K.N.; Baklavaridis, A.; Tzounis, L.; Polychronopoulou, K.; Goula, M.A. Hydrogen production via the glycerol steam reforming reaction over nickel supported on alumina and lanthana-alumina catalysts. Int. J. Hydrogen Energy 2017, 42, 13039–13060. [Google Scholar] [CrossRef]
- Carrero, A.; Calles, J.; García-Moreno, L.; Vizcaíno, A. Production of Renewable Hydrogen from Glycerol Steam Reforming over Bimetallic Ni-(Cu,Co,Cr) Catalysts Supported on SBA-15 Silica. Catalysts 2017, 7, 55. [Google Scholar] [CrossRef] [Green Version]
- Papageridis, K.N.; Siakavelas, G.; Charisiou, N.D.; Avraam, D.G.; Tzounis, L.; Kousi, K.; Goula, M.A. Comparative study of Ni, Co, Cu supported on γ-alumina catalysts for hydrogen production via the glycerol steam reforming reaction. Fuel Process. Technol. 2016, 152, 156–175. [Google Scholar] [CrossRef]
- Kousi, K.; Chourdakis, N.; Matralis, H.; Kontarides, D.; Papadopoulou, C.; Verykios, X. Glycerol steam reforming over modified Ni-based catalysts. Appl. Catal. A 2016, 518, 129–141. [Google Scholar] [CrossRef]
- Charisiou, N.D.; Italiano, C.; Pino, L.; Sebastian, V.; Vita, A.; Goula, M.A. Hydrogen production via steam reforming of glycerol over Rh/γ-Al2O3 catalysts modified with CeO2, MgO or La2O3. Renew. Energy 2020, 162, 908–925. [Google Scholar] [CrossRef]
- Charisiou, N.D.; Papageridis, K.N.; Siakavelas, G.; Tzounis, L.; Kousi, K.; Baker, M.A.; Hinder, S.J.; Sebastian, V.; Polychronopoulou, K.; Goula, M.A. Glycerol Steam Reforming for Hydrogen Production over Nickel Supported on Alumina, Zirconia and Silica Catalysts. Top. Catal. 2017, 60, 1226–1250. [Google Scholar] [CrossRef]
- Sahoo, S.K.; Ray, S.S.; Singh, I.D. Structural characterization of coke on spent hydroprocessing catalysts used for processing of vacuum gas oils. Appl. Catal. A 2004, 278, 83–91. [Google Scholar] [CrossRef]
- Zhang, L.; Li, W.; Liu, J.; Guo, C.; Wang, Y.; Zhang, J. Ethanol steam reforming reactions over Al2O3·SiO2-supported Ni-La catalysts. Fuel 2009, 88, 511–518. [Google Scholar] [CrossRef]
- Montero, C.; Ochoa, A.; Castaño, P.; Bilbao, J.; Gayubo, A.G. Monitoring Ni0 and coke evolution during the deactivation of a Ni/La2O3-αAl2O3 catalyst in ethanol steam reforming in a fluidized bed. J. Catal. 2015, 331, 181–192. [Google Scholar] [CrossRef]
- Damyanova, S.; Pawelec, B.; Palcheva, R.; Karakirova, Y.; Sanchez, M.C.C.; Tyuliev, G.; Gaigneaux, E.; Fierro, J.L.G. Structure and surface properties of ceria-modified Ni-based catalysts for hydrogen production. Appl. Catal. B 2018, 225, 340–353. [Google Scholar] [CrossRef]
- Li, X.Y.; Li, D.; Tian, H.; Zeng, L.; Zhao, Z.-J.; Gong, J.L. Dry reforming of methane over Ni/La2O3 nanorod catalysts with stabilized Ni nanoparticles. Appl. Catal. B 2017, 202, 683–694. [Google Scholar] [CrossRef]


| Catalysts | Ni Content (wt.%) | Surface Area (m2/g) | Pore Volume (cc/g) | BJH Pore Size (nm) | CeO2 Lattice Parameter (Å) |
|---|---|---|---|---|---|
| CeO2 | - | 153.8 | 0.32 | 3.9 | 5.412 |
| Ni/CeO2-500 | 7.05% | 110.8 | 0.27 | 4.3 | 5.406 |
| Ni/CeO2-D | 4.15% | 137.9 | 0.29 | 4.1 | 5.409 |
| Catalyst | Ce3+/(Ce3+ + Ce4+) (%) | Ni0/(Ni0 + Ni2+) (%) | ID/IF2g | CO-OSC/OSCC (mmolOg−1cat) |
|---|---|---|---|---|
| Ni/CeO2-500 | 18.05 | 24.57 | 0.216 | 3.79/40.27 |
| Ni/CeO2-D | 18.81 | 25.01 | 0.268 | 3.90/43.59 |
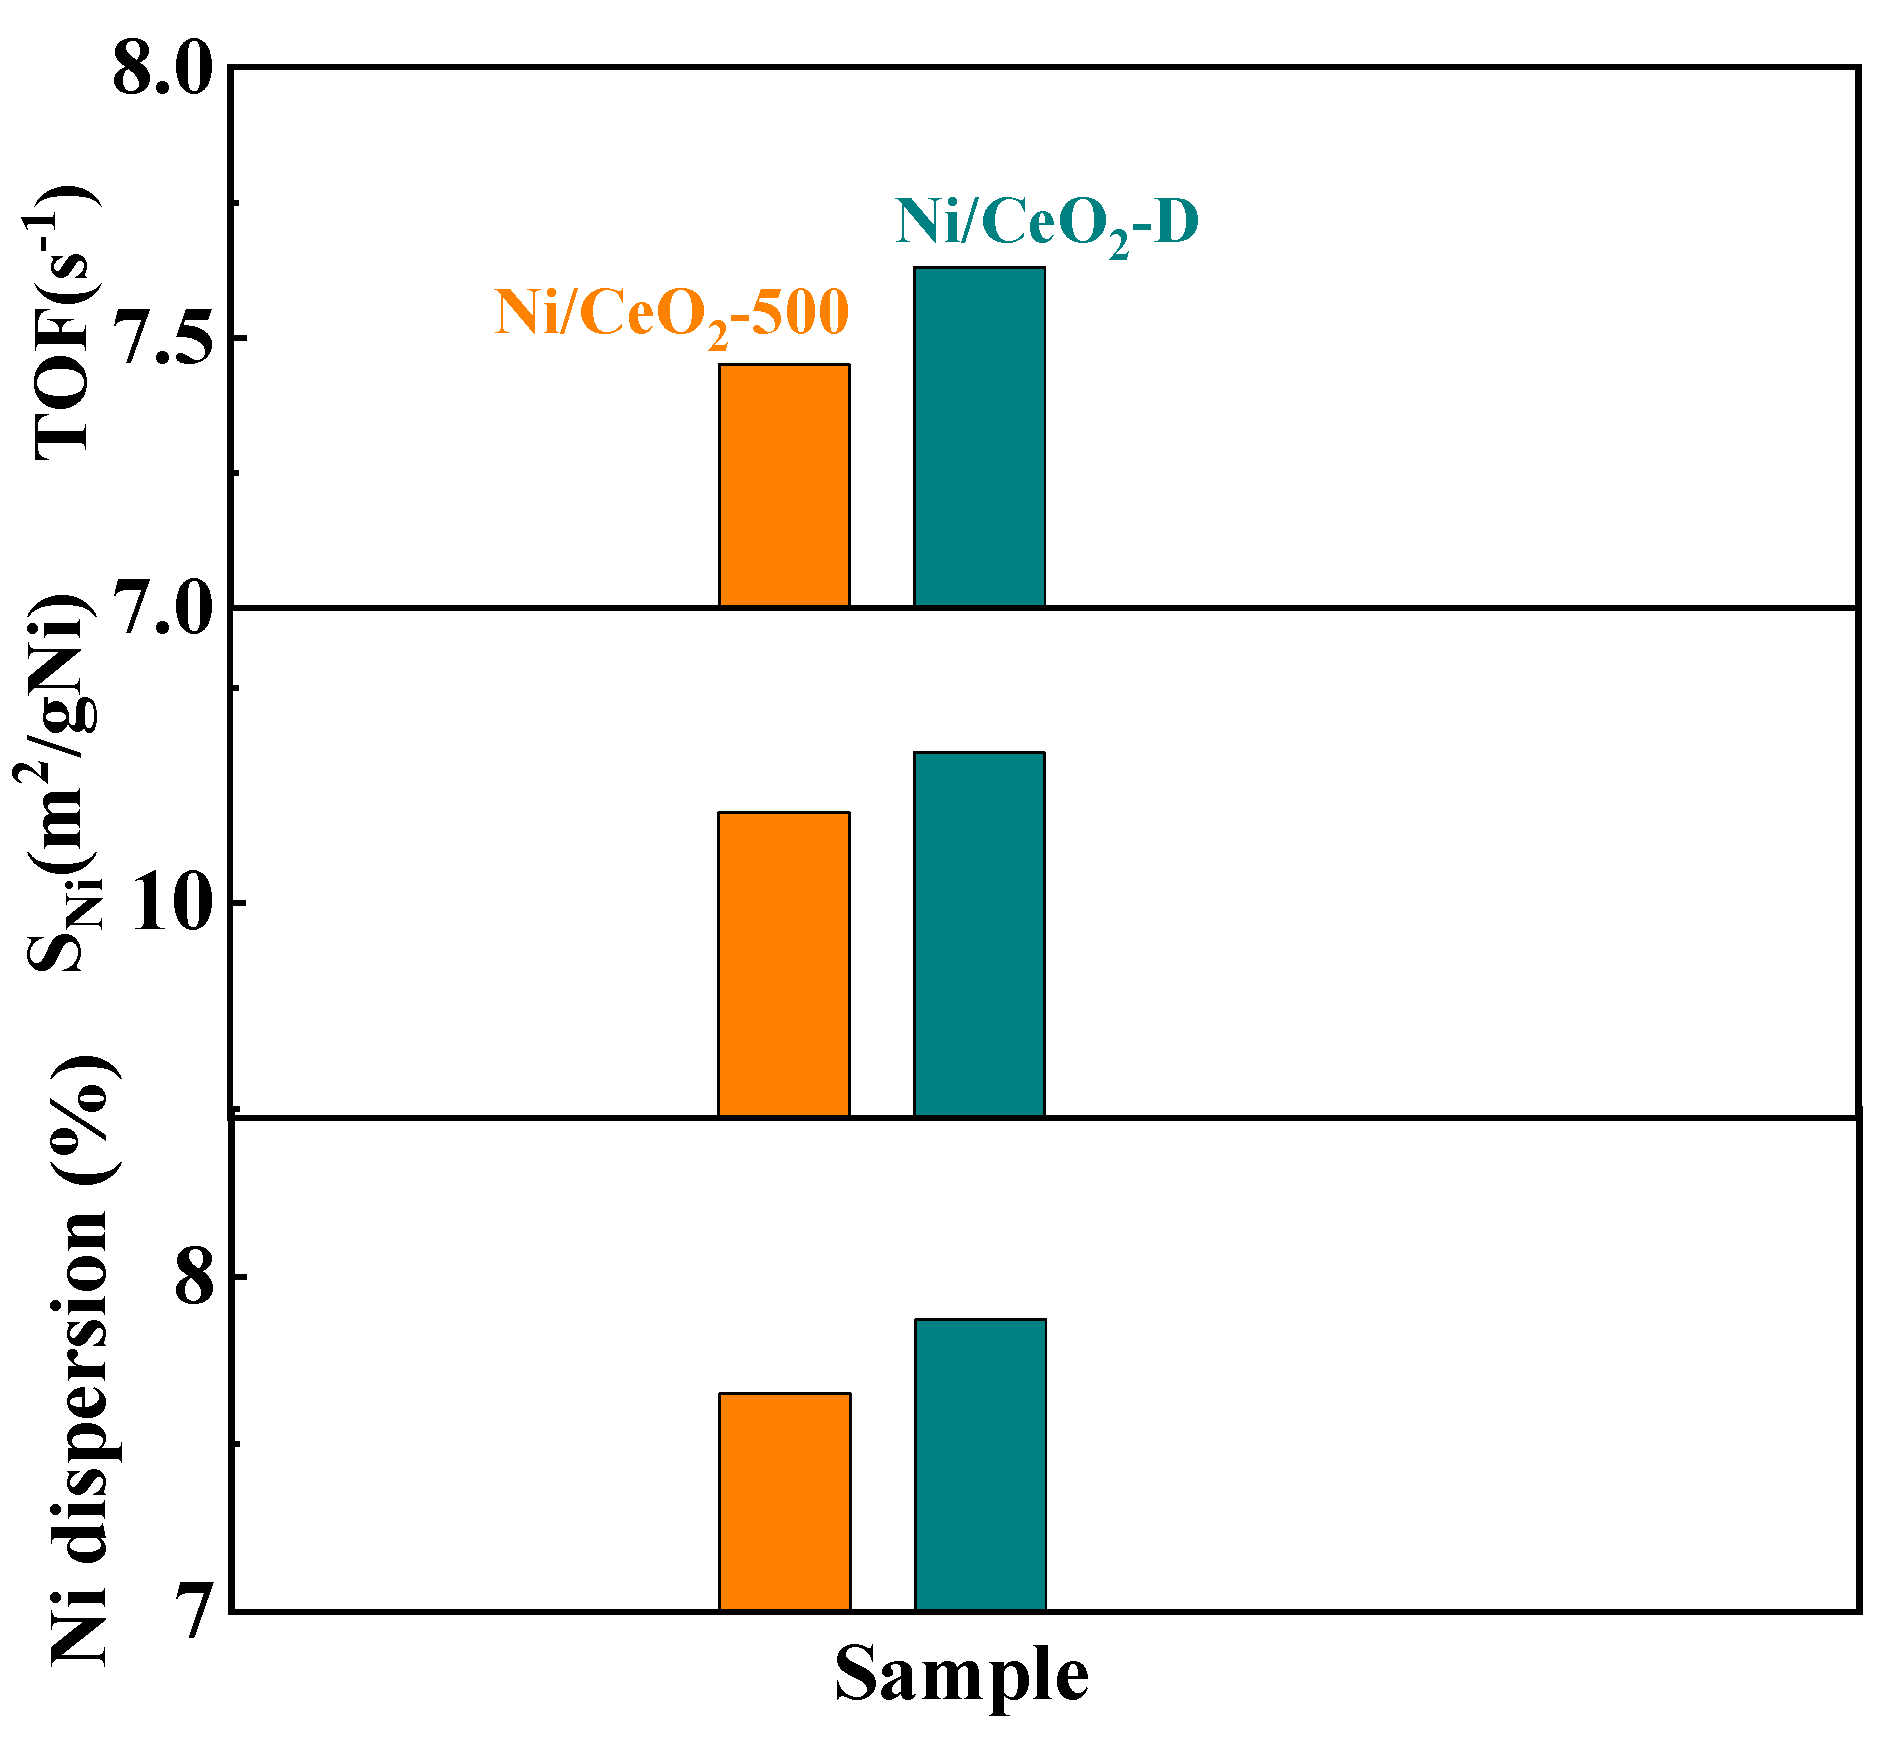
| Catalyst | Metal Dispersion a (%) | Active Nickel Surface Areas (m2/gNi) a | TOF (s−1) b |
|---|---|---|---|
| Ni/CeO2-500 | 7.65 | 10.21 | 7.45 |
| Ni/CeO2-D | 7.87 | 10.35 | 7.63 |
| Catalysts | Temperature (°C) | nH2O/Gly | WHSV/ mL/gcat/h | Initial Conversion/ H2 Selectivity/% | Conversion/H2 Selectivity after 16 h/% | H2 Yield (mol/molGly) | Ref. |
|---|---|---|---|---|---|---|---|
| Ni/Ce | 475 | 9 | 28,000 | 95/93 | 95/93 | 5.4/5.4 | present work |
| Ni/CeAl | 700 | 9 | 42,000 | 80/78 | 89/71 | - | [27] |
| Ni/LaAl | 600 | 9 | 50,000 | 93/96 | 80/86 | 3/3 | [41] |
| Ni-Cr/SBA-15 | 600 | 6 | - | 100/65 | 95/55 | - | [42] |
| Ni/Al | 600 | 20 | 50,000 | 90/60 | 52/80 | 3.35/0.65 | [43] |
| 10Ni/Al | 600 | - | - | 100/92 | 100/82 | - | [44] |
| Rh/MgAl | 600 | 9 | 50,000 | 55/88 | 45/78 | 2.9/2.4 | [45] |
| 10Ni/Si | 600 | - | 21,300 | 89/88 | 70/81 | 3.1/2.5 | [46] |
| Catalyst | Weight Loss (%) | Carbon/Glycerol (mmol/mol) | Carbon Formation Rate (mmol/gcat/h) | C Balance |
|---|---|---|---|---|
| Ni/CeO2-500 | 14.1 | 15.2 | 0.39 | 99.7% |
| Ni/CeO2-D | 11.2 | 11.8 | 0.3 | 99.8% |
Publisher’s Note: MDPI stays neutral with regard to jurisdictional claims in published maps and institutional affiliations. |
© 2022 by the authors. Licensee MDPI, Basel, Switzerland. This article is an open access article distributed under the terms and conditions of the Creative Commons Attribution (CC BY) license (https://creativecommons.org/licenses/by/4.0/).
Share and Cite
Wang, Y.; Zhu, S.; He, S.; Lu, J.; Liu, J.; Lu, H.; Song, D.; Luo, Y. Nanoarchitectonics of Ni/CeO2 Catalysts: The Effect of Pretreatment on the Low-Temperature Steam Reforming of Glycerol. Nanomaterials 2022, 12, 816. https://doi.org/10.3390/nano12050816
Wang Y, Zhu S, He S, Lu J, Liu J, Lu H, Song D, Luo Y. Nanoarchitectonics of Ni/CeO2 Catalysts: The Effect of Pretreatment on the Low-Temperature Steam Reforming of Glycerol. Nanomaterials. 2022; 12(5):816. https://doi.org/10.3390/nano12050816
Chicago/Turabian StyleWang, Yunzhu, Songshan Zhu, Sufang He, Jichang Lu, Jiangping Liu, Huihui Lu, Di Song, and Yongming Luo. 2022. "Nanoarchitectonics of Ni/CeO2 Catalysts: The Effect of Pretreatment on the Low-Temperature Steam Reforming of Glycerol" Nanomaterials 12, no. 5: 816. https://doi.org/10.3390/nano12050816