Article

Construction of N-CDs and Calcein-Based Ratiometric Fluorescent Sensor for Rapid Detection of Arginine and Acetaminophen

1
College of Chemistry and Chemical Engineering, Qiqihar University, No. 42, Wenhua Street, Qiqihar 161006, China
2
School of Medicine and Health, Harbin Institute of Technology, No.92, West Dazhi Street, Harbin 150000, China
3
Department of Food Science and Nutrition, College of Sciences, Taif University, P.O. Box 11099, Taif 21944, Saudi Arabia
4
Department of Mechanical Engineering, Faculty of Engineering, Taif University, P.O. Box 11099, Taif 21944, Saudi Arabia
5
Department of Clinical Laboratory Sciences, College of Applied Medical Sciences, Taif University, P.O. Box 11099, Taif 21944, Saudi Arabia
6
Department of Physical Sport Science, College of Education, Princess Nourah bint Abdulrahman University, P.O. Box 84428, Riyadh 11671, Saudi Arabia
*
Authors to whom correspondence should be addressed.
Nanomaterials 2022, 12(6), 976; https://doi.org/10.3390/nano12060976
Submission received: 17 February 2022 / Revised: 12 March 2022 / Accepted: 14 March 2022 / Published: 16 March 2022

Abstract

:
In our study, a unique ratiometric fluorescent sensor for the rapid detection of arginine (Arg) and acetaminophen (AP) was constructed by the integration of blue fluorescent N-CDs and yellowish-green fluorescent calcein. The N-CD/calcein ratiometric fluorescent sensor exhibited dual emission at 435 and 519 nm under the same excitation wavelength of 370 nm, and caused potential Förster resonance energy transfer (FRET) from N-CDs to calcein. When detecting Arg, the blue fluorescence from the N-CDs of the N-CD/calcein sensor was quenched by the interaction of N-CDs and Arg. Then, the fluorescence of our sensor was recovered with the addition of AP, possibly due to the stronger association between AP and Arg, leading to the dissociation of Arg from N-CDs. Meanwhile, we observed an obvious fluorescence change from blue to green, then back to blue, when Arg and AP were added, exhibiting the “on–off–on” pattern. Next, we determined the detection limits of the N-CD/calcein sensor to Arg and AP, which were as low as 0.08 μM and 0.02 μM, respectively. Furthermore, we discovered that the fluorescence changes of the N-CD/calcein sensor were only responsible for Arg and AP. These results suggested its high sensitivity and specificity for Arg and AP detection. In addition, we have successfully achieved its application in bovine serum samples, indicating its practicality. Lastly, the logic gate was generated by the N-CD/calcein sensor and presented its good reversibility. Overall, we have demonstrated that our N-CD/calcein sensor is a powerful sensor to detect Arg and AP and that it has potential applications in biological analysis and imaging.

1. Introduction

As an α-amino acid that is used in the biosynthesis of proteins, arginine (Arg) is classified as a conditionally essential amino acid, especially in young mammals. It acts as an important synthetic precursor for protein, creatine, polyamine and nitric oxide [1,2], and is mainly involved in multiple physiological processes, including metabolism, immunomodulatory function, intestinal development, anti-tumor and anti-obesity pathways [3]. Arg deficiency in the human body could cause endothelium dysfunction, a late asthmatic response and difficulties in wound healing [4,5,6,7,8]. However, excessive Arg also leads to acute and chronic pancreatitis [9], increased perivascular NO levels [10], cellular damage [11] and even toxic effects [12].
Acetaminophen (AP) is a type of phenolic analgesic drug that exerts anti-inflammatory and antipyretic effects [13,14]. Nonetheless, overdose uptake and long-term use of AP could cause many medical problems, including asthma [15], renal injury [16], severe liver injury, coma or even death [17].
Therefore, it is important to monitor the concentrations of Arg and AP in the human body qualitatively and quantitatively to prevent potential serious diseases. To date, various methods have been exploited to detect Arg and AP, including high performance liquid chromatography(HPLC) [18], capillary zone electrophoresis(CZE) [19], amino acid analyzers [20], high-temperature paper chromatography [21], voltammetry [22], raman detected differential scanning calorimetry (RD-DSC)[23] and liquid chromatography-mass spectormetry(LC/MS) [24]. However, most of them are laborious, entail high consumption of material resources [25] and require professional operation. Therefore, it is highly necessary to develop a simple and easy approach to detect Arg and AP with high sensitivity and specificity.
Carbon dots (CDs), a new type of fluorescent carbon nanomaterial, have multiple advantages, including excellent optical properties, easy synthesis and modification, low toxicity and high stability [26]. Thus, CDs can be extensively used in several areas, such as drug transportation [27,28,29], biological imaging [30,31], cancer therapy [32], catalysis [33,34], sensing [35,36,37] and so on. In recent years, CDs have also been employed as a fluorescent sensor for detection and mostly exhibit a single-signal output. However, a single-signal output heavily depends upon the accurate measurement of the signal strength, and the background signals could easily disturb the signal strength and lead to potential fluctuations in outcomes, resulting in low accuracy. Therefore, ratiometric fluorescent sensors based on dual-signal output have been developed, and the detection of arginine or AP by ratiometric fluorescent sensors based on carbon dots has gradually gained more attention [38,39,40]. Compared with the single-signal output, the dual-signal output has the abilities of signal strength self-calibration, better signal-to-noise ratio, reduced background interference and superior accuracy and reliability [41,42,43,44,45,46].
In this study, we have designed a dual-emission ratiometric fluorescent sensor based on N-CDs and calcein for fluorescence and visual detection of Arg and AP, and the sensor has high sensitivity and selectivity. Briefly, our N-CD/calcein fluorescent sensor displays the “on–off–on” mode in sensing Arg and AP (Figure 1).

2. Experimental Part

2.1. Materials

Acetaminophen (AP), calcein, tryptophan (Trp), threonine (Thr), glucose (Glc), cysteine (Cys), phenylalanine (Phe), glycine (Gly), tyrosine (Tyr), urea (Urea), ascorbic acid (AA), serine (Ser) and other amino acids were purchased from Aladdin Chemical Reagent Co., Ltd. (Shanghai, China). NaCl, HCl, NaOH, quinine sulfate and other chemical reagents were obtained from Beijing Chemical Plant (Beijing, China). All chemicals used in the experiments were of analytically pure grade and no further refinement was required. Ultra-pure water generated from the ultra-pure water purification system was utilized in the experimental process.

2.2. Experimental Instruments

Transmission electron microscope (TEM) images were captured through the JEM-2100F electron microscope (JEOL, Tokyo, Japan). X-ray diffraction (XRD) analysis was performed by the D8 FOCUS (Bruker AXS, Karlsruhe, Germany). X-ray photoelectron spectroscopy (XPS) was performed by the ESCALAB250Xi X-ray photoelectron spectrometer (Thermo, Waltham, MA, USA). Fourier-transform infrared spectroscopy (FTIR) was performed by the NICOLET 380 FTIR spectrometer (Thermo, Waltham, MA, USA). The fluorescence spectra were acquired by the RF-5301PC fluorescence spectrophotometer (Shimadzu, Kyoto, Japan). The UV–vis absorption spectra were acquired on the TU-1901 UV–visible spectrophotometer (Purkinje, Beijing, China). Zeta potential was recorded on the Zetasizer Nano ZS90 (Malvern, UK). The exposure experiment was carried out using the WD-9403E UV analyzer (Liuyi, Beijing, China) with the power of 6 W.

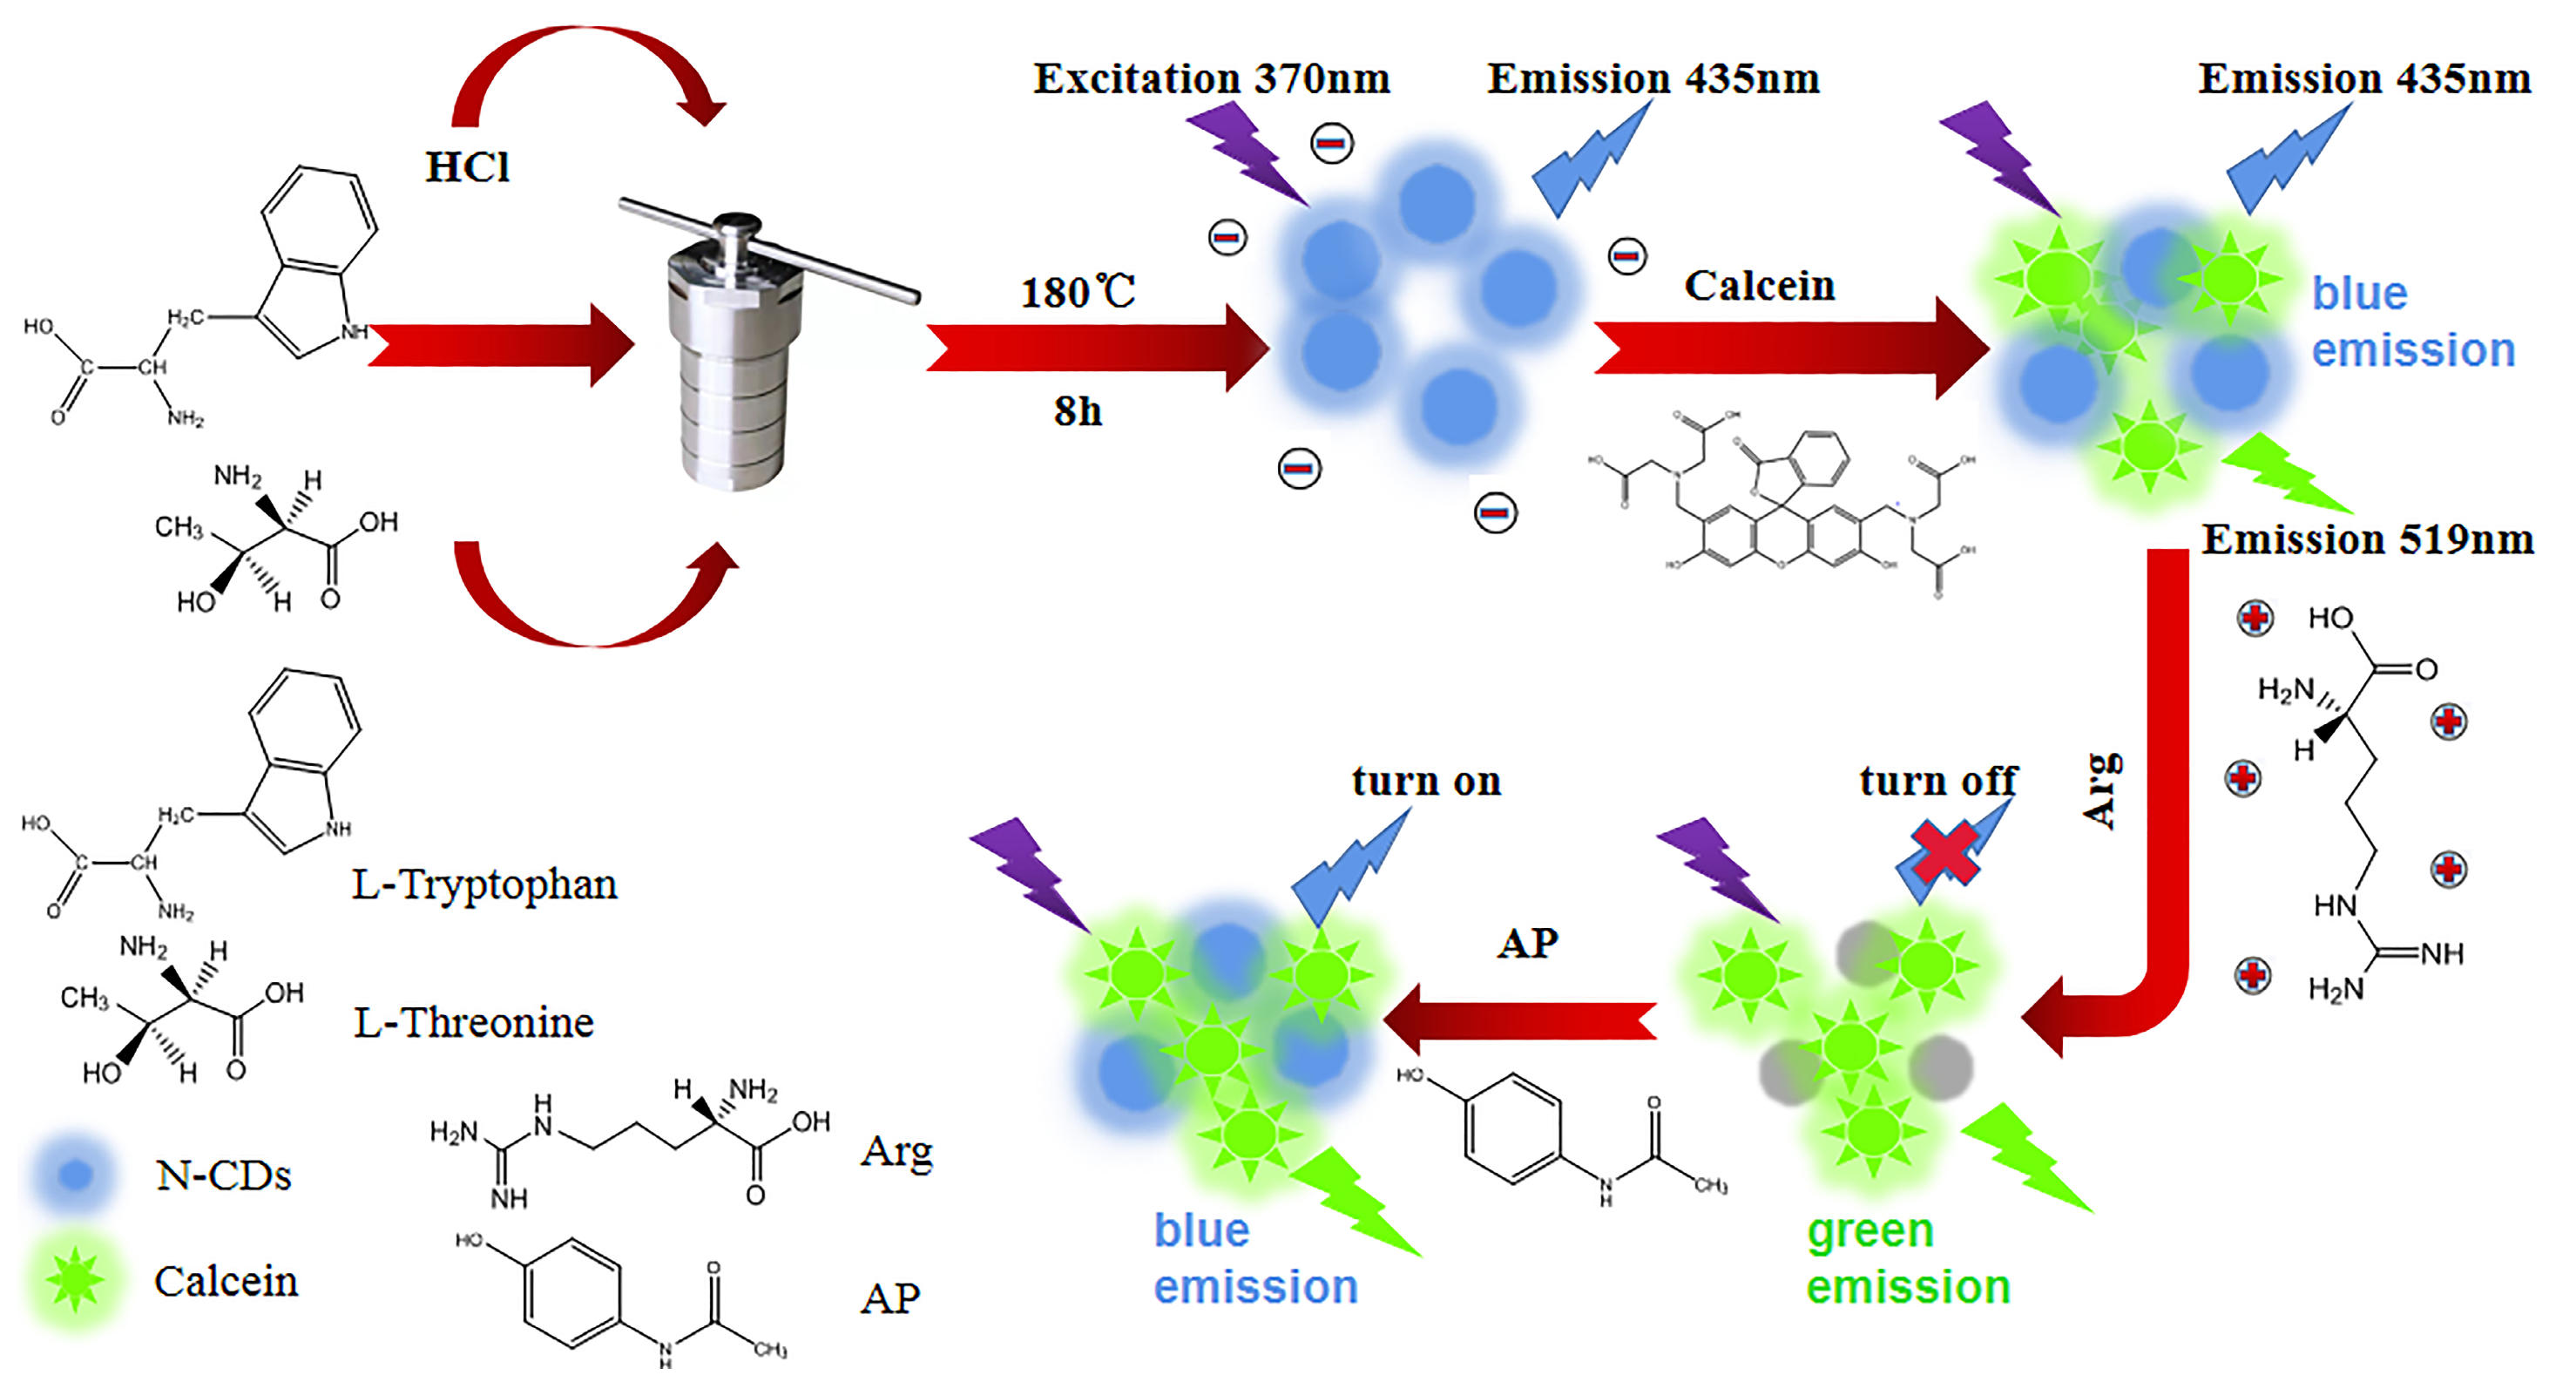
2.3. Synthesis of N-CDs

First, 102.2 mg of tryptophan and 59.2 mg of threonine were mixed at a 1:1 ratio and dissolved in concentrated hydrochloric acid (pH = 2), stirring with a glass rod continuously. The mixed solution was then transferred to a 30 mL reaction kettle and heated at 180 °C for 8 h. After cooling down, the solution was filtered using a 0.22 μm filter membrane and further dialyzed through a dialysis bag (MWCO = 500 Da) for 2 days. Lastly, the dialyzed solution was freeze-dried in a freeze-dryer; then, we stored the N-CD solid powders in the refrigerator at 4 °C.

2.4. Quantum Yield of N-CDs

We performed quantum yield measurements, and used the below equation for calculation:
Y x = Y S × F X F S × A S A X × ( η S η X ) 2
Y was the quantum yield, F was the integrated emission area, A was the absorbance and η was the refractive index. The subscript x and s refers to the measured substance and the standard substance, respectively.

2.5. Construction of N-CD/Calcein Ratiometric Fluorescent Sensor

Because the distribution ratio of N-CDs and calcein influenced the ability to detect Arg and AP, we calculated the N-CD/calcein sensor fluorescence intensity (ratio of F1/F2) under the same excitation wavelength of 370 nm and demonstrated the optimized ratio as 1:3. Briefly, we mixed 50 μL of 3.74 mg/mL N-CD solution with 150 μL of 5.61 mg/mL calcein solution and dissolved the mixture in 2 mL of ultra-pure water.

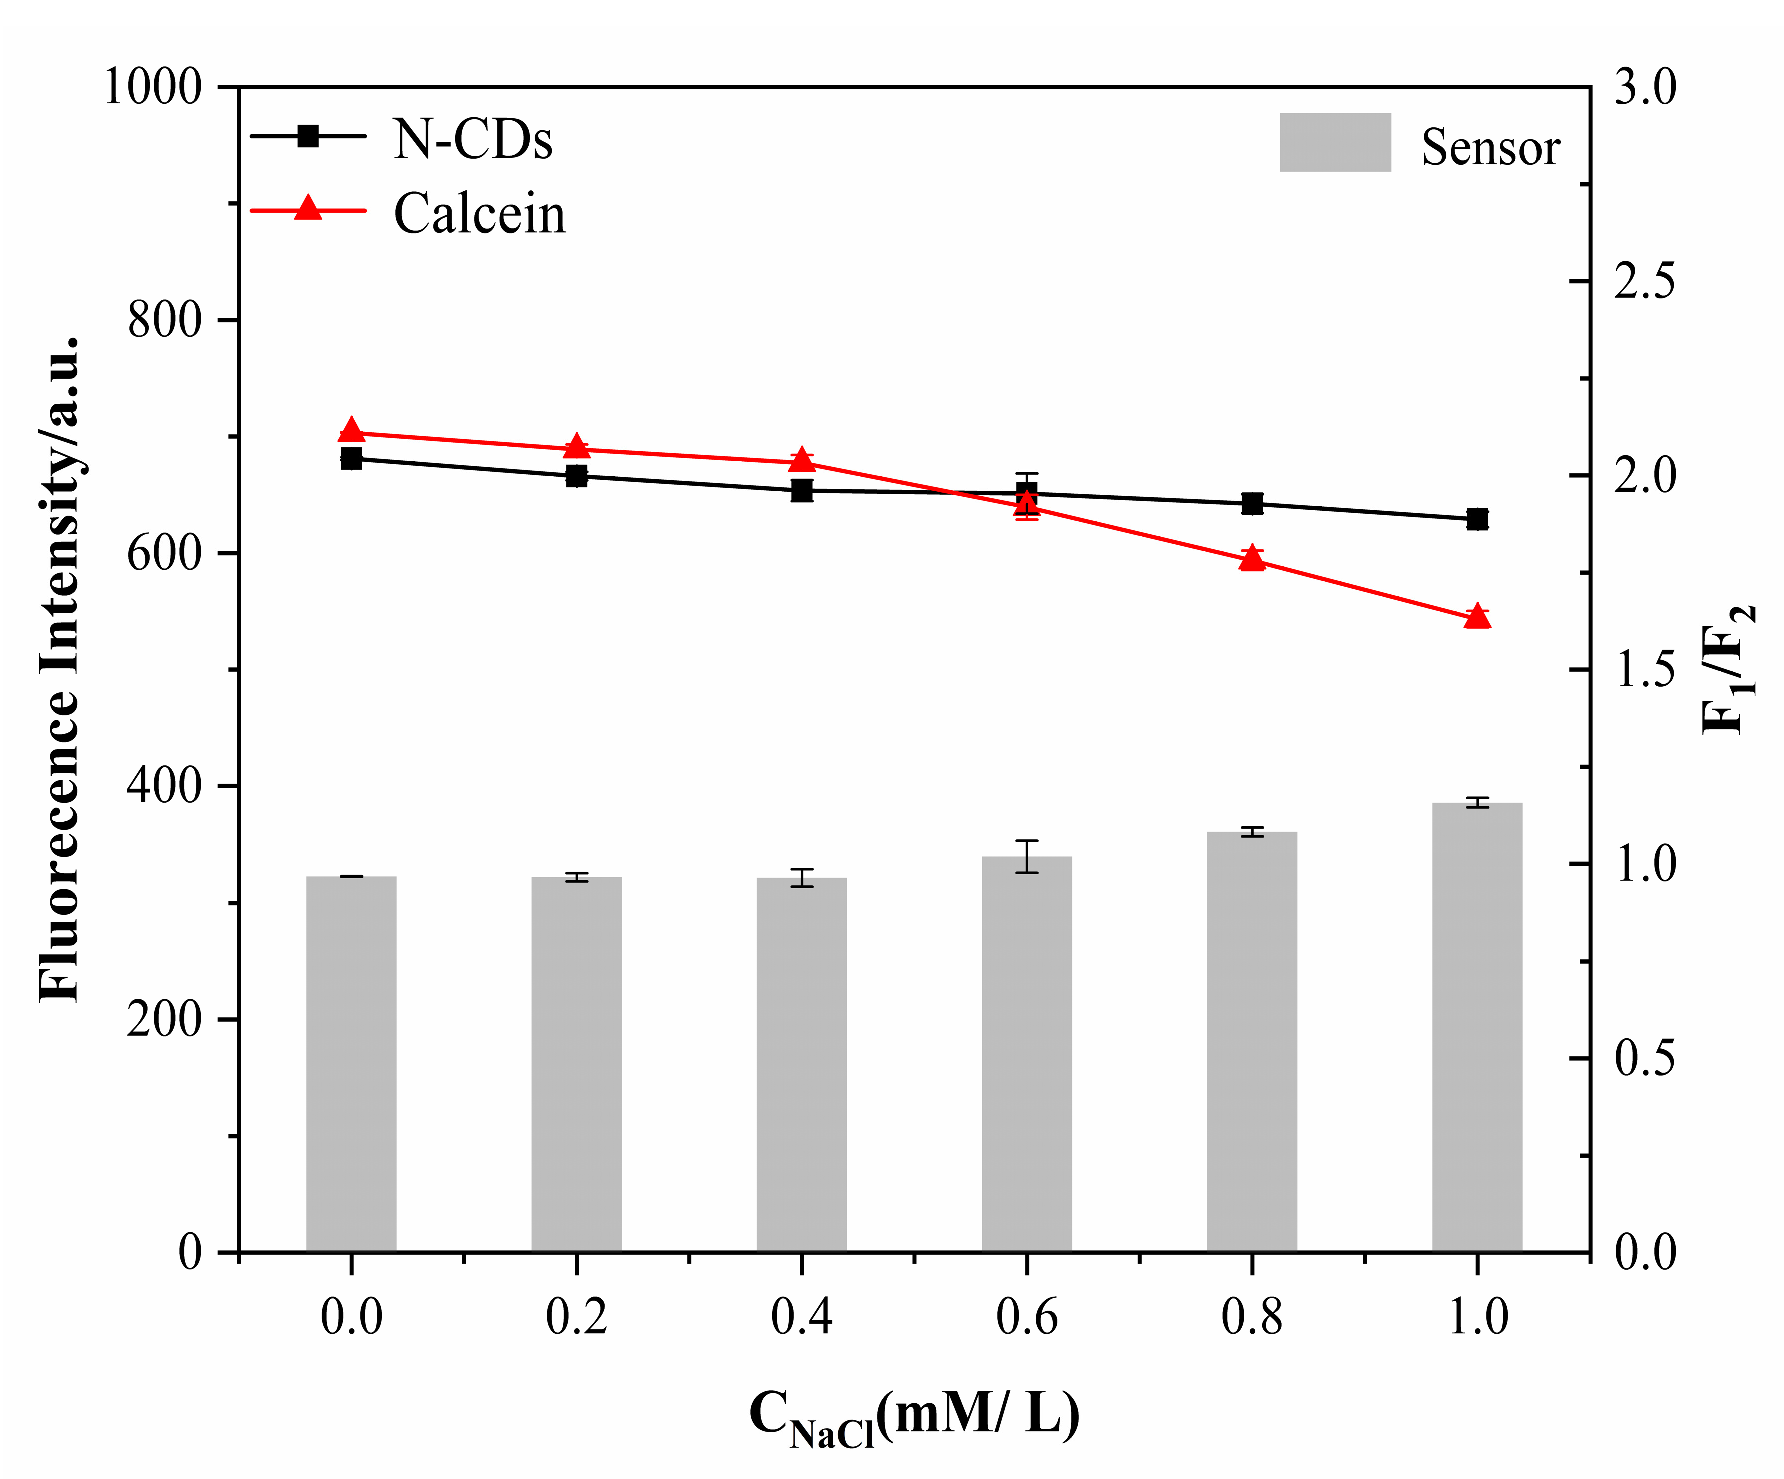
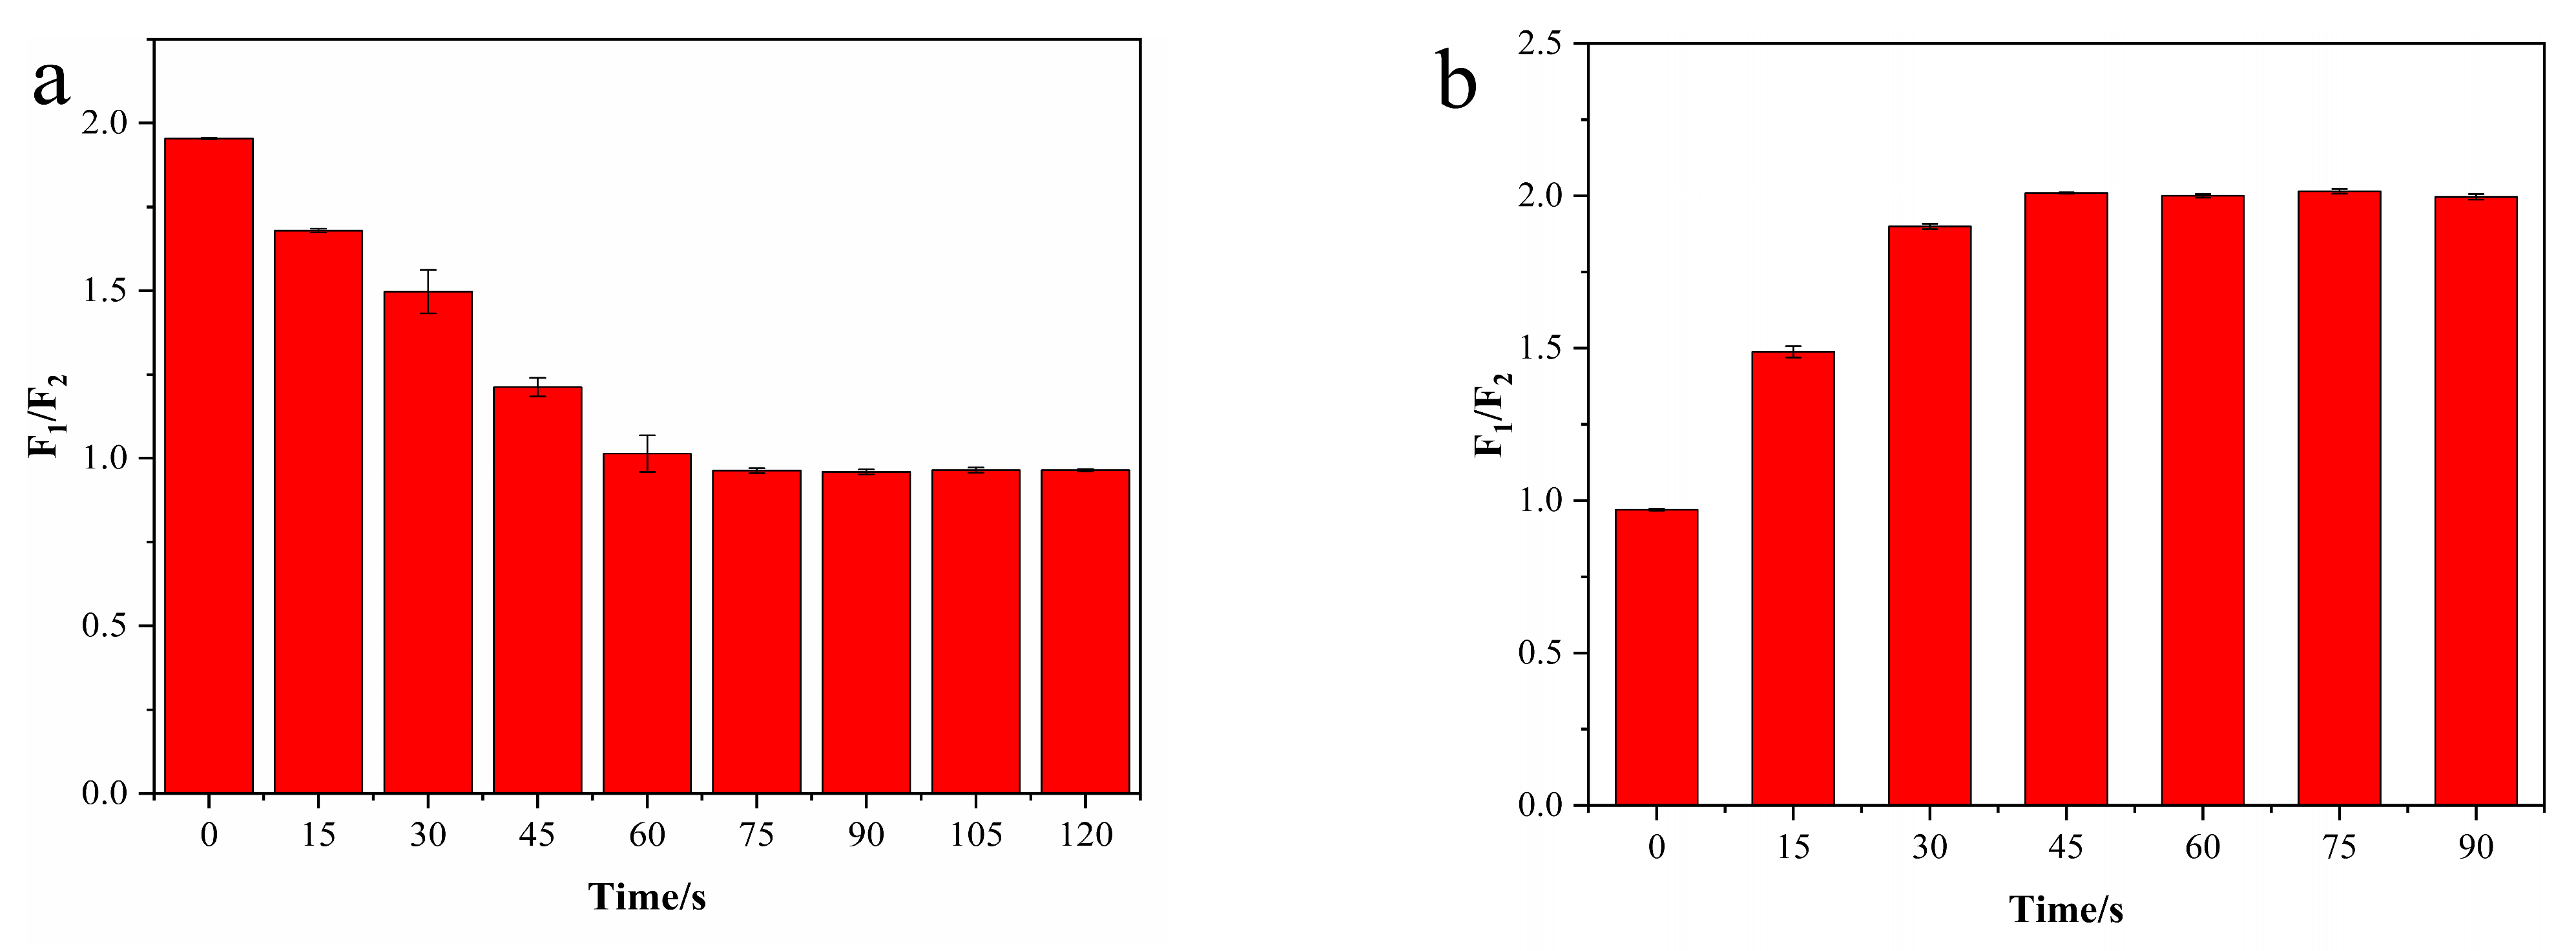
2.6. Stability Evaluation

We examined the stability of N-CDs, calcein and N-CD/calcein (50 μL, 3.74 mg/mL N-CDs; 150 μL, 5.61 mg/mL calcein) under various conditions, including pH (from 1 to 10), ionic strength (0, 0.2, 0.4, 0.6, 0.8, 1.0 mM) and illumination under a UV analyzer (0, 10, 20, 30, 40, 50, 60 min), and the excitation wavelength was 370 nm.

2.7. Characteristics of N-CD/Calcein Sensor in Arg and AP Detection

All fluorescence measurements and the fluorescence spectra acquisition were carried out at room temperature. For Arg detection, Arg at varied concentrations (ranging from 0 to 100 μM) was added into 2 mL of aqueous N-CD/calcein sensor. When detecting AP, a series of various concentrations of AP solutions (ranging from 0 to 3 μM) were added into the N-CD/calcein/Arg complex system (mixed with 100 μM Arg). The fluorescence color changes of our sensor were recorded by a camera under ultraviolet light at 365 nm. To determine its specificity, we examined the fluorescence response toward various substances including Na+, Mn2+, K+, Trp, Thr, Glc, Cys, Phe, Gly, Tyr, Urea and AA, and the concentrations were all 1 mM.

3. Results and Discussion

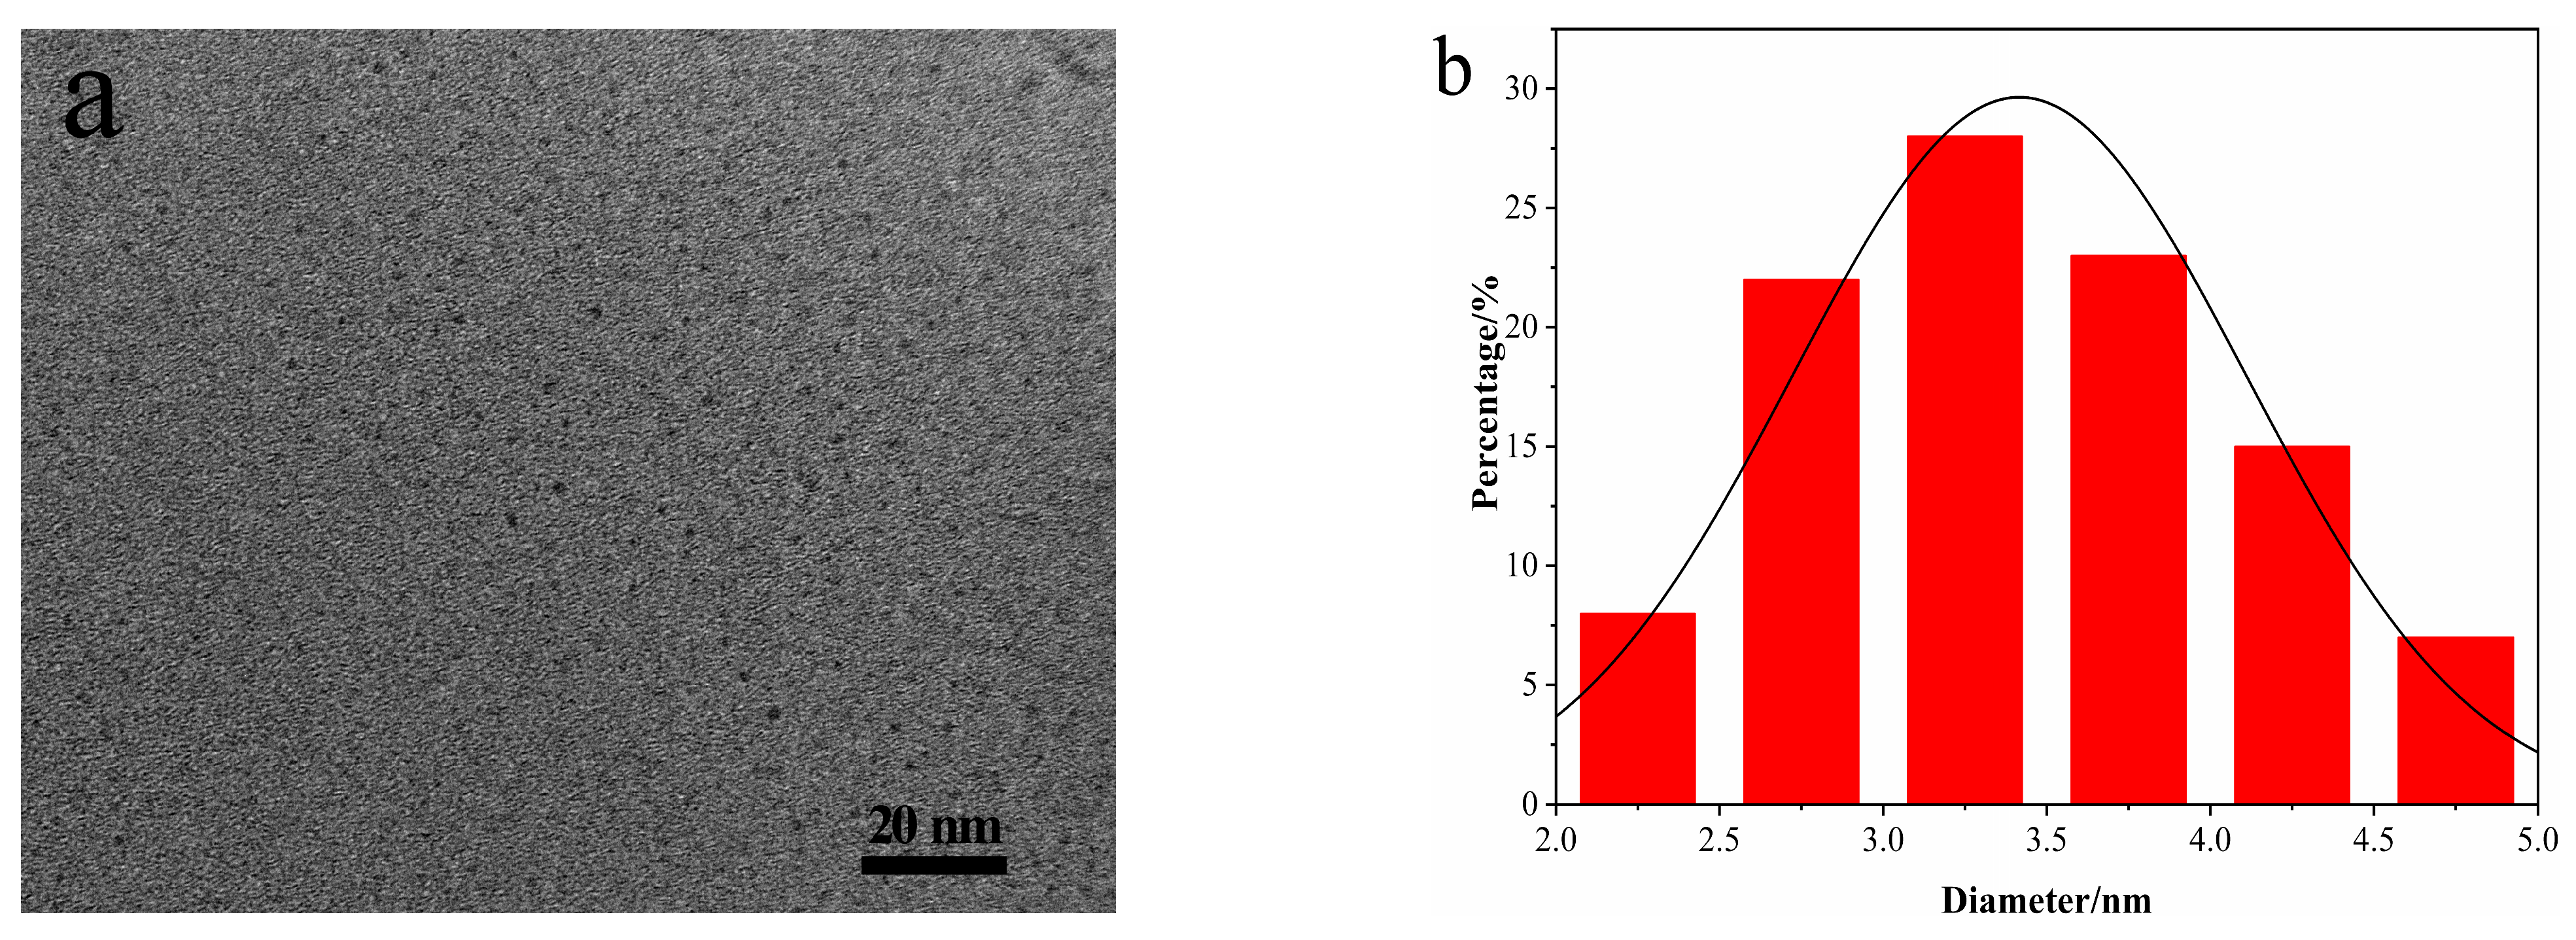
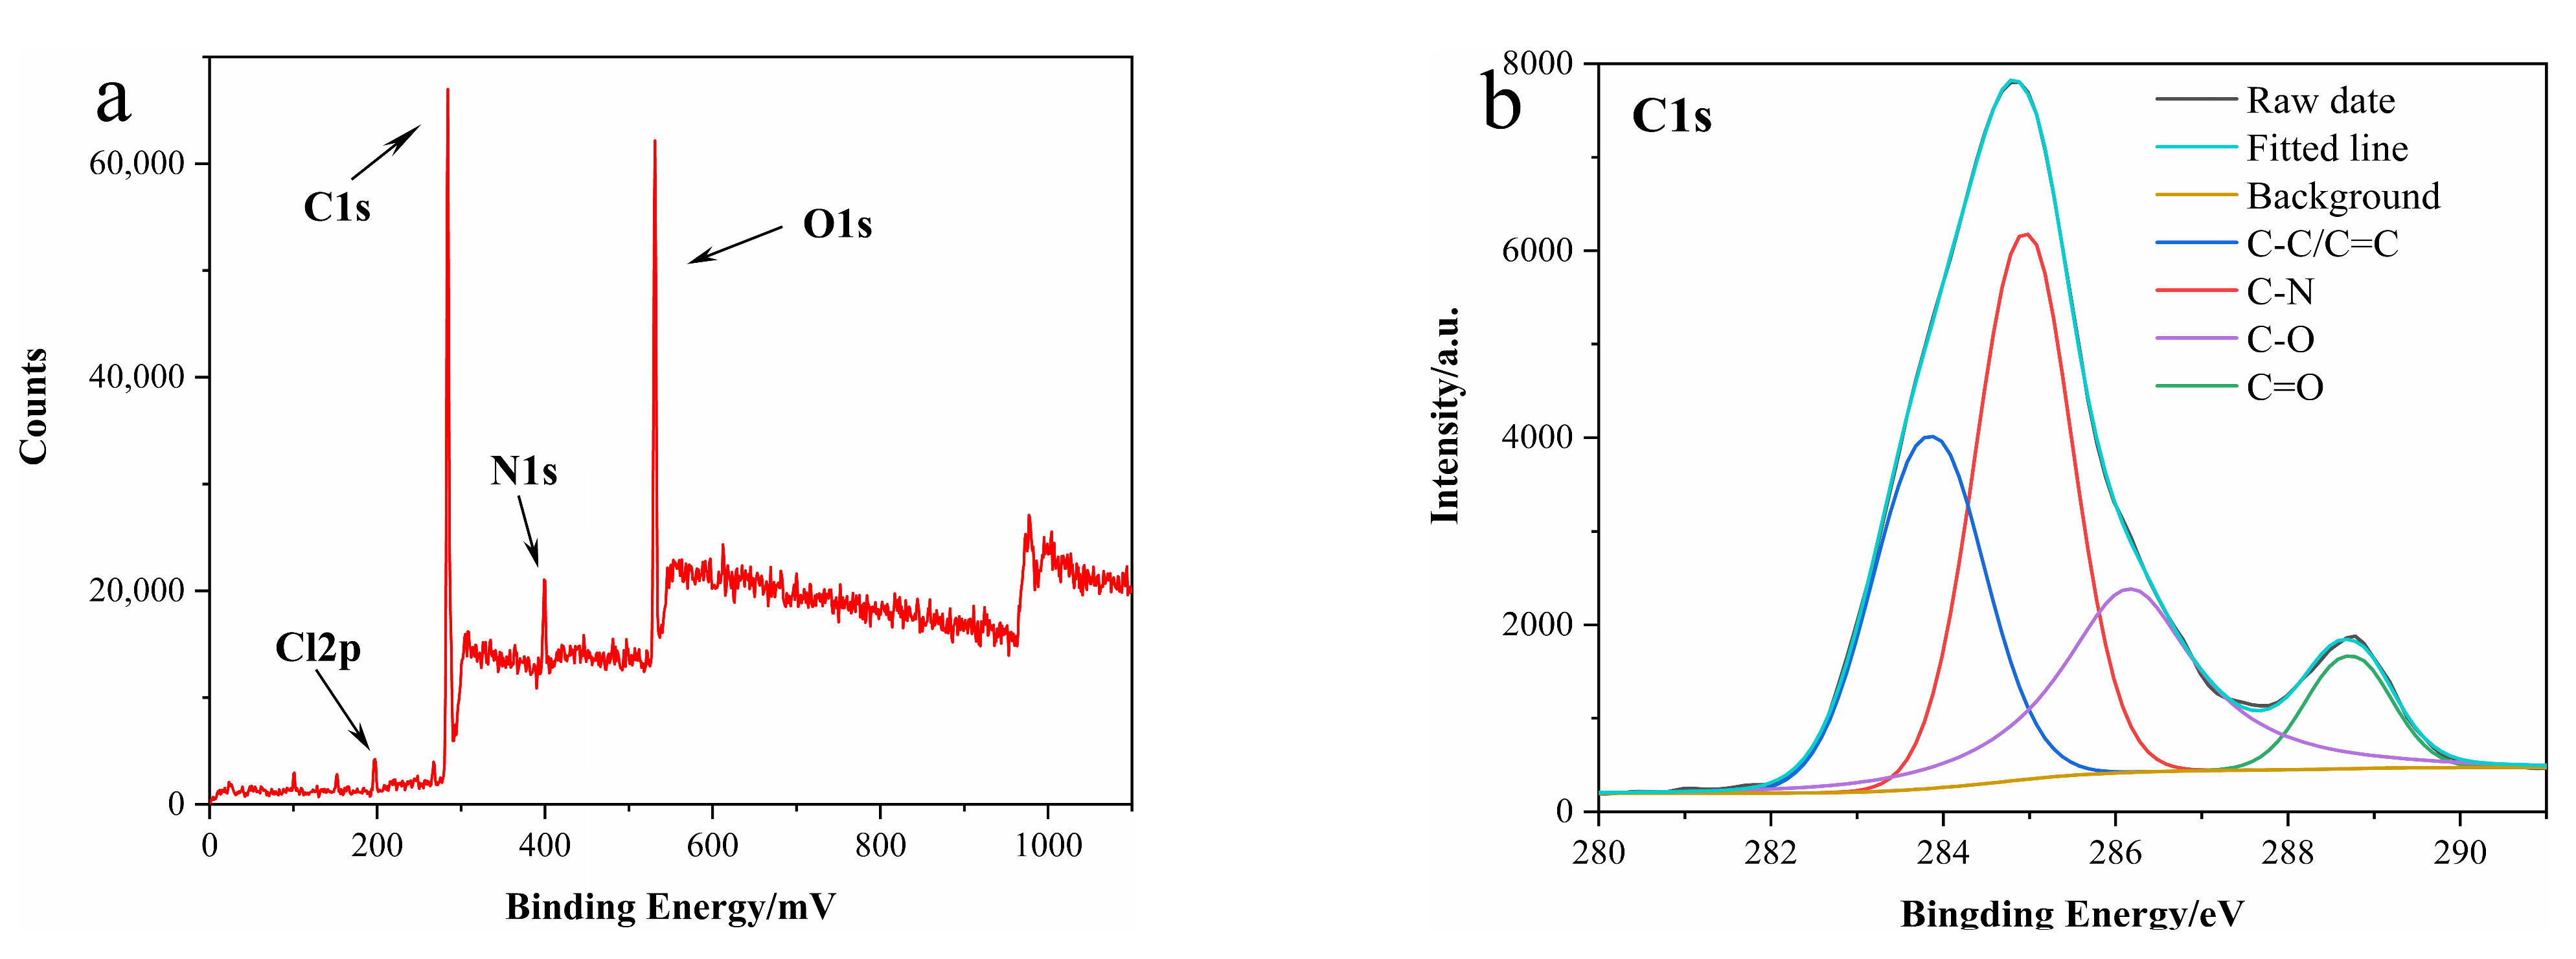
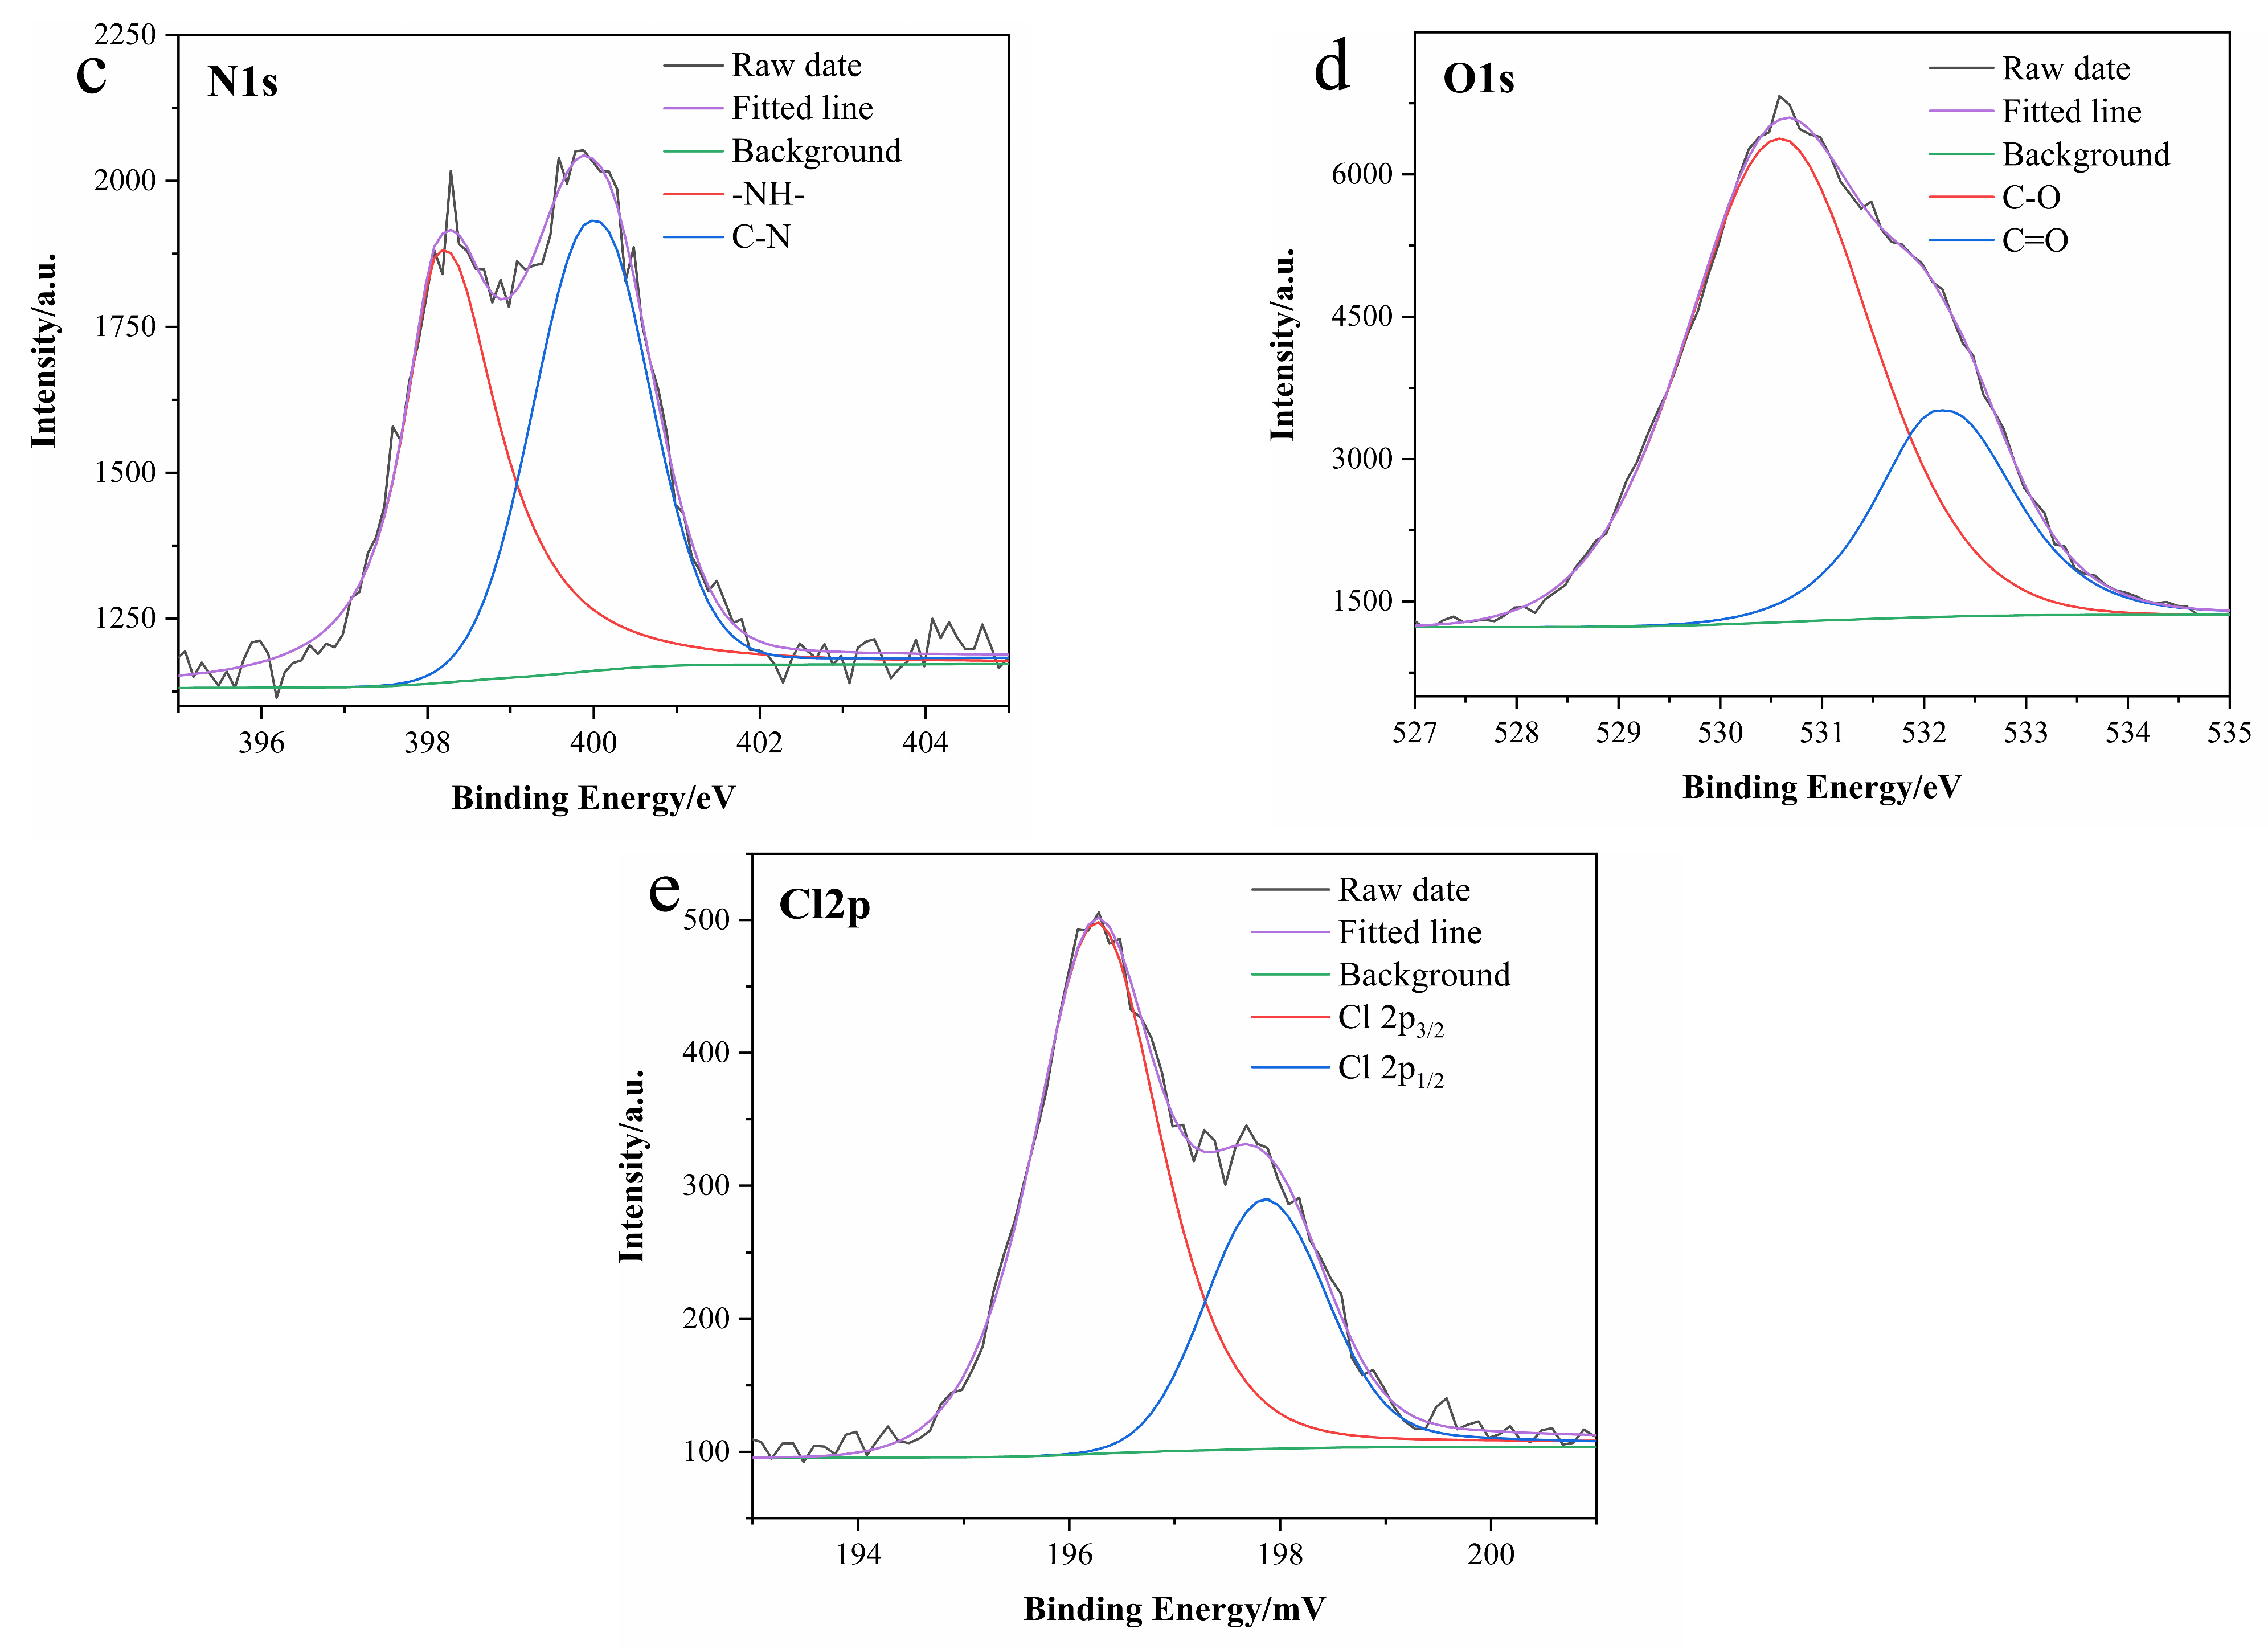
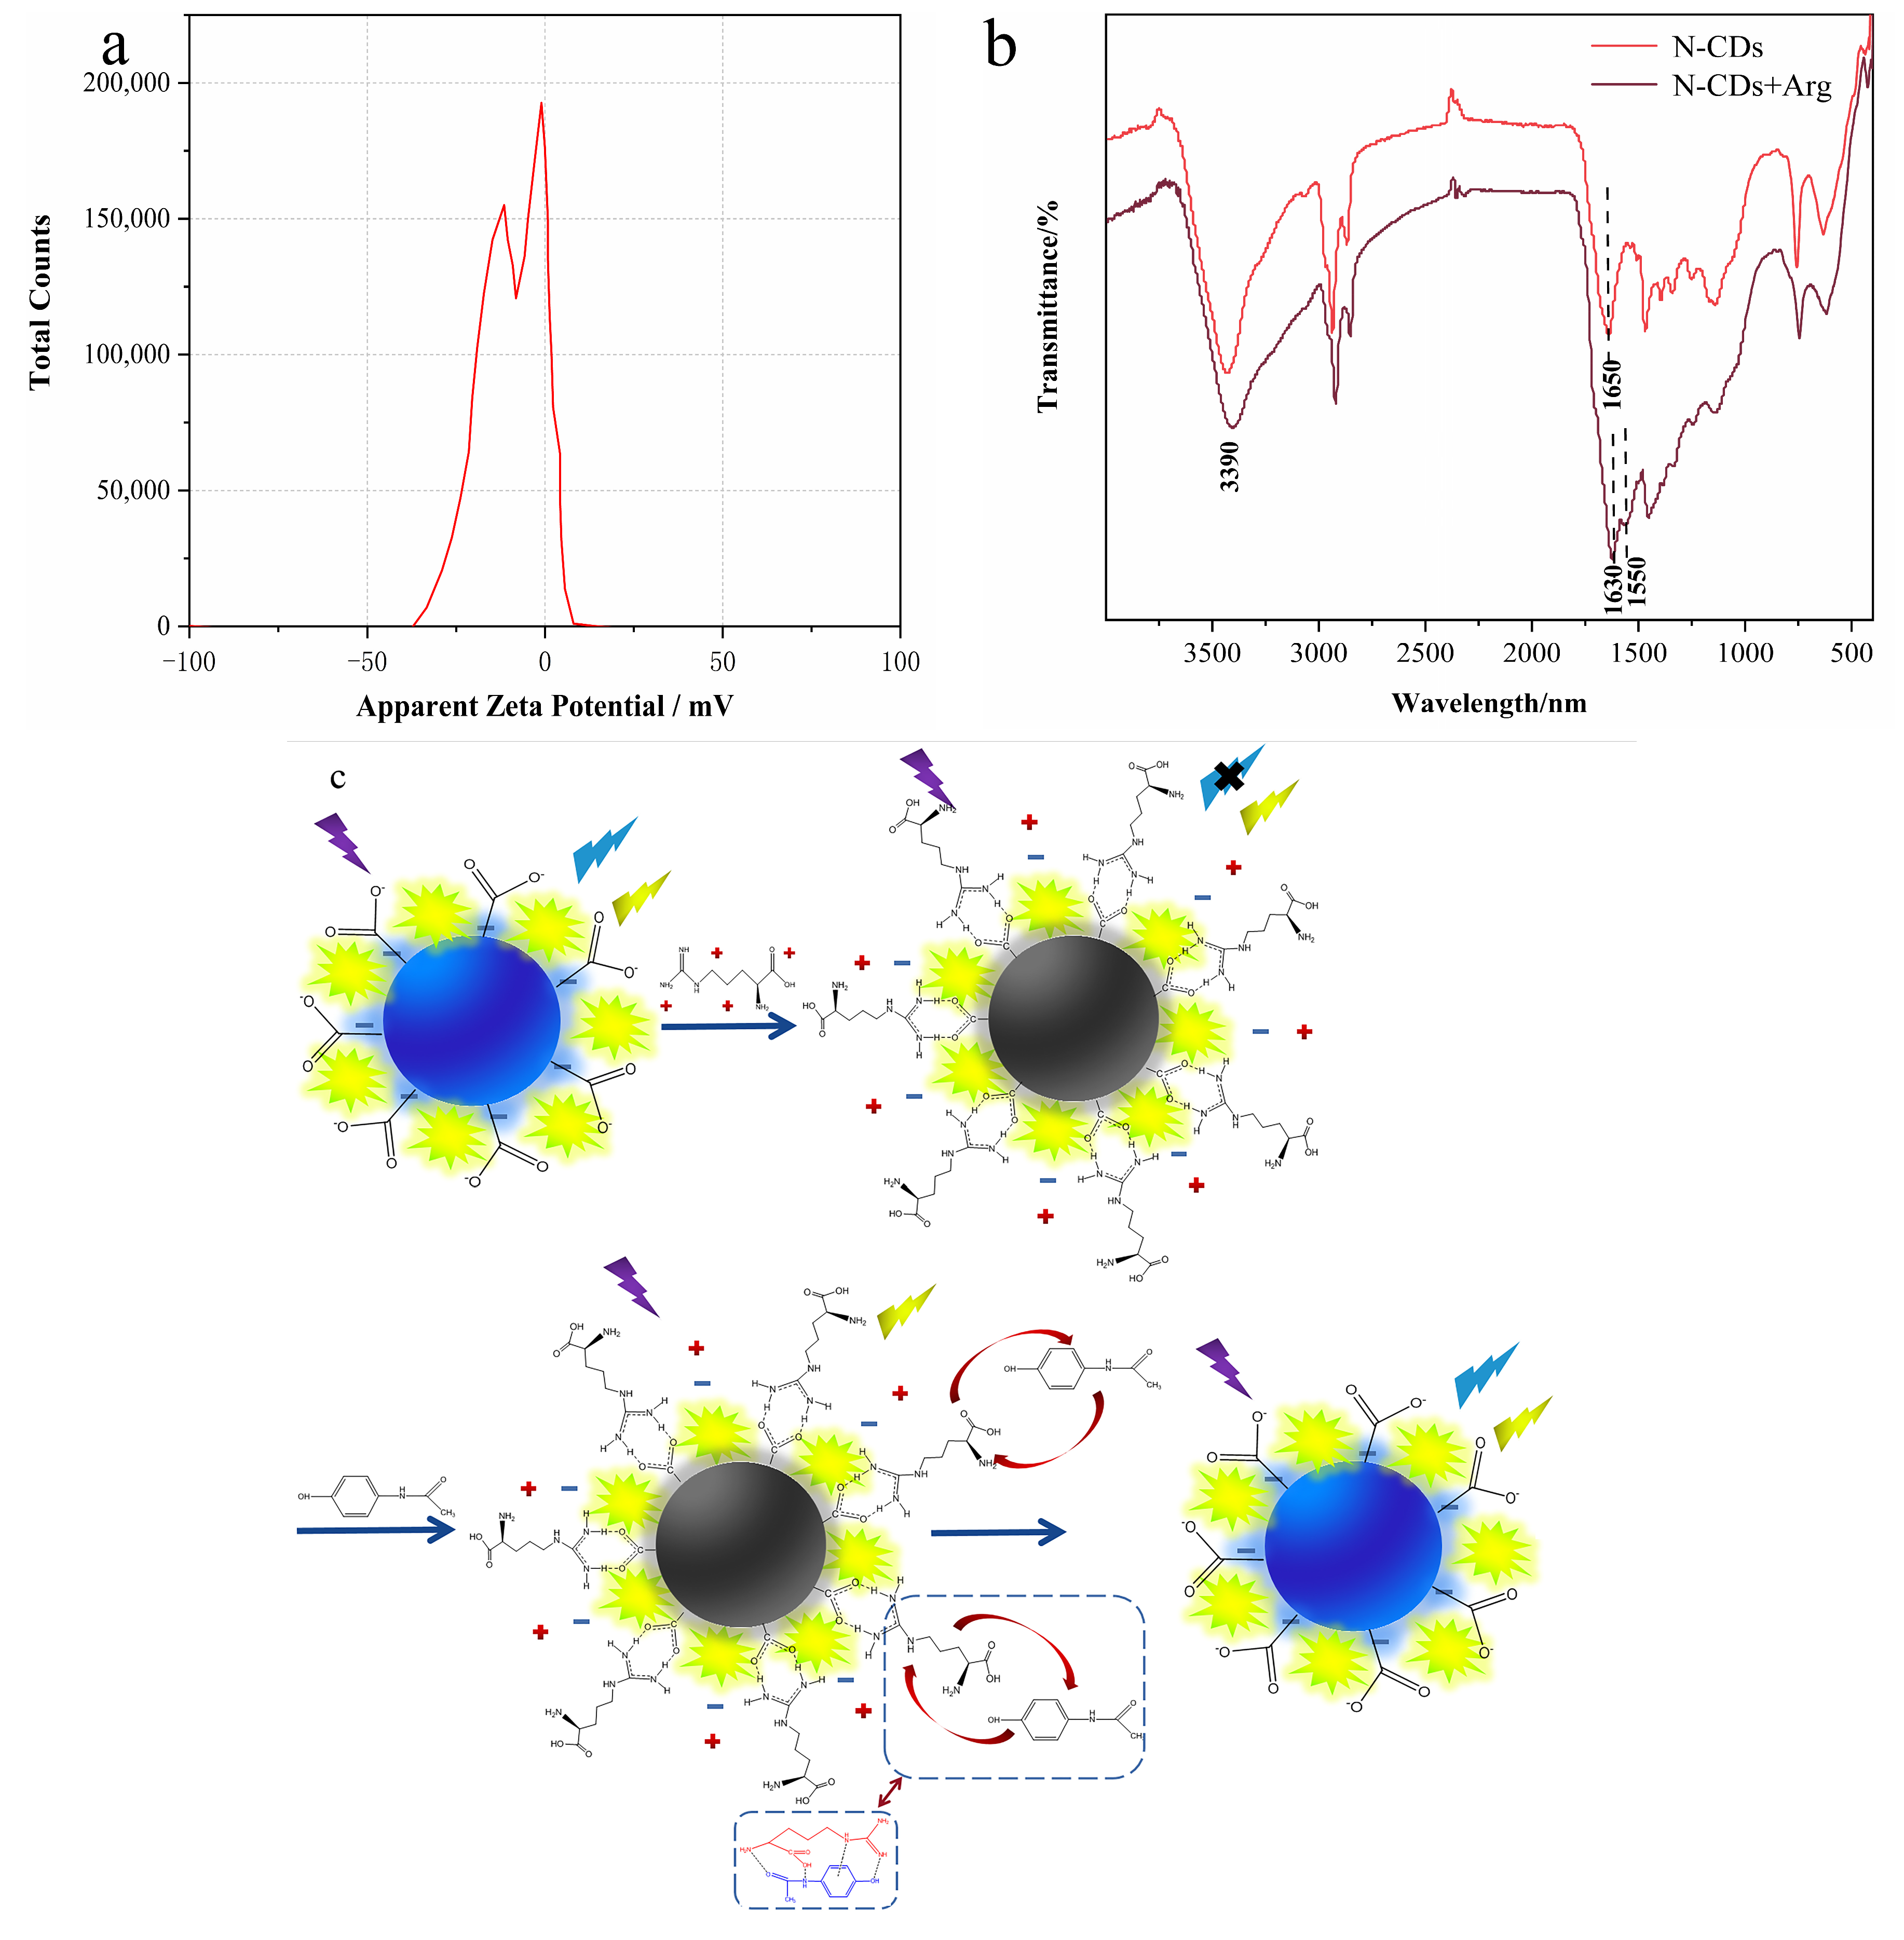
3.1. Characterization of N-CDs

In this study, we used tryptophan and threonine as the nitrogen source and hydrochloric acid as a co-reactant to synthesize the N-CDs by the one-pot hydrothermal method. High resolution transmission electron microscopy (HRTEM) image of N-CDs indicated that the CDs were approximately spherical (Figure 2a). The diameters of N-CDs were in the range of 2.0 to 5.0 nm, with an average value of 3.29 nm (Figure 2b). Furthermore, the crystal structure of the N-CDs showed only one obvious diffraction peak near 2θ = 23° [47] (Figure 2c), indicating their amorphous structure. The surface functional groups of the N-CDs were determined by FTIR. Figure 2d shows that multiple peaks were observed. The bonds from 3390 to 240 cm−1 corresponded to N−H, −OH and C−H, and 1650 cm−1 corresponded to C=O/C=C stretching vibration, respectively. Moreover, the peaks at 1450, 1327, 1110 and 744 cm−1 were ascribed to C−H bending, C−N stretching, C−O stretching and N−H out-of-plane bending vibration, respectively.
The chemical components and surface states of N-CDs were studied by XPS (Figure 3). The XPS full spectrum of N-CDs exhibited four obvious peaks at 197.62, 284.8, 400.04 and 531.77 eV corresponding to Cl2p, C1s, N1s and O1s, respectively (Figure 3a). The preliminary results suggested that our N-CDs were composed of Cl, C, N and O, and the atomic percentages of Cl, C, N and O were 1.44%, 70.01%, 8.61% and 19.94%, respectively. For each element’s high-resolution XPS spectrum, the C1s spectrum displayed four peaks at 283.78, 284.98, 286.18 and 288.68 eV, which corresponded to C−C/C=C, C−N, C−O and C=O [48,49], respectively (Figure 3b). Two fitted characteristic peaks at 398.18 and 399.98 eV were observed in the N1s spectrum, indicating the existence of N−H and C−N (Figure 3c) [50]. The O1s spectrum was decomposed into two peaks at 530.58 and 532.18 eV, which were ascribed to C−O and C=O [51], respectively (Figure 3d). As shown in the Cl2p diagram, the two peaks were attributed to metal chlorides, suggesting their irrelevance to elements of N-CDs (Figure 3e) [52]. Above all, the results indicated that the surfaces of the N-CDs had multiple functional groups, including amino, carboxyl and hydroxyl groups.

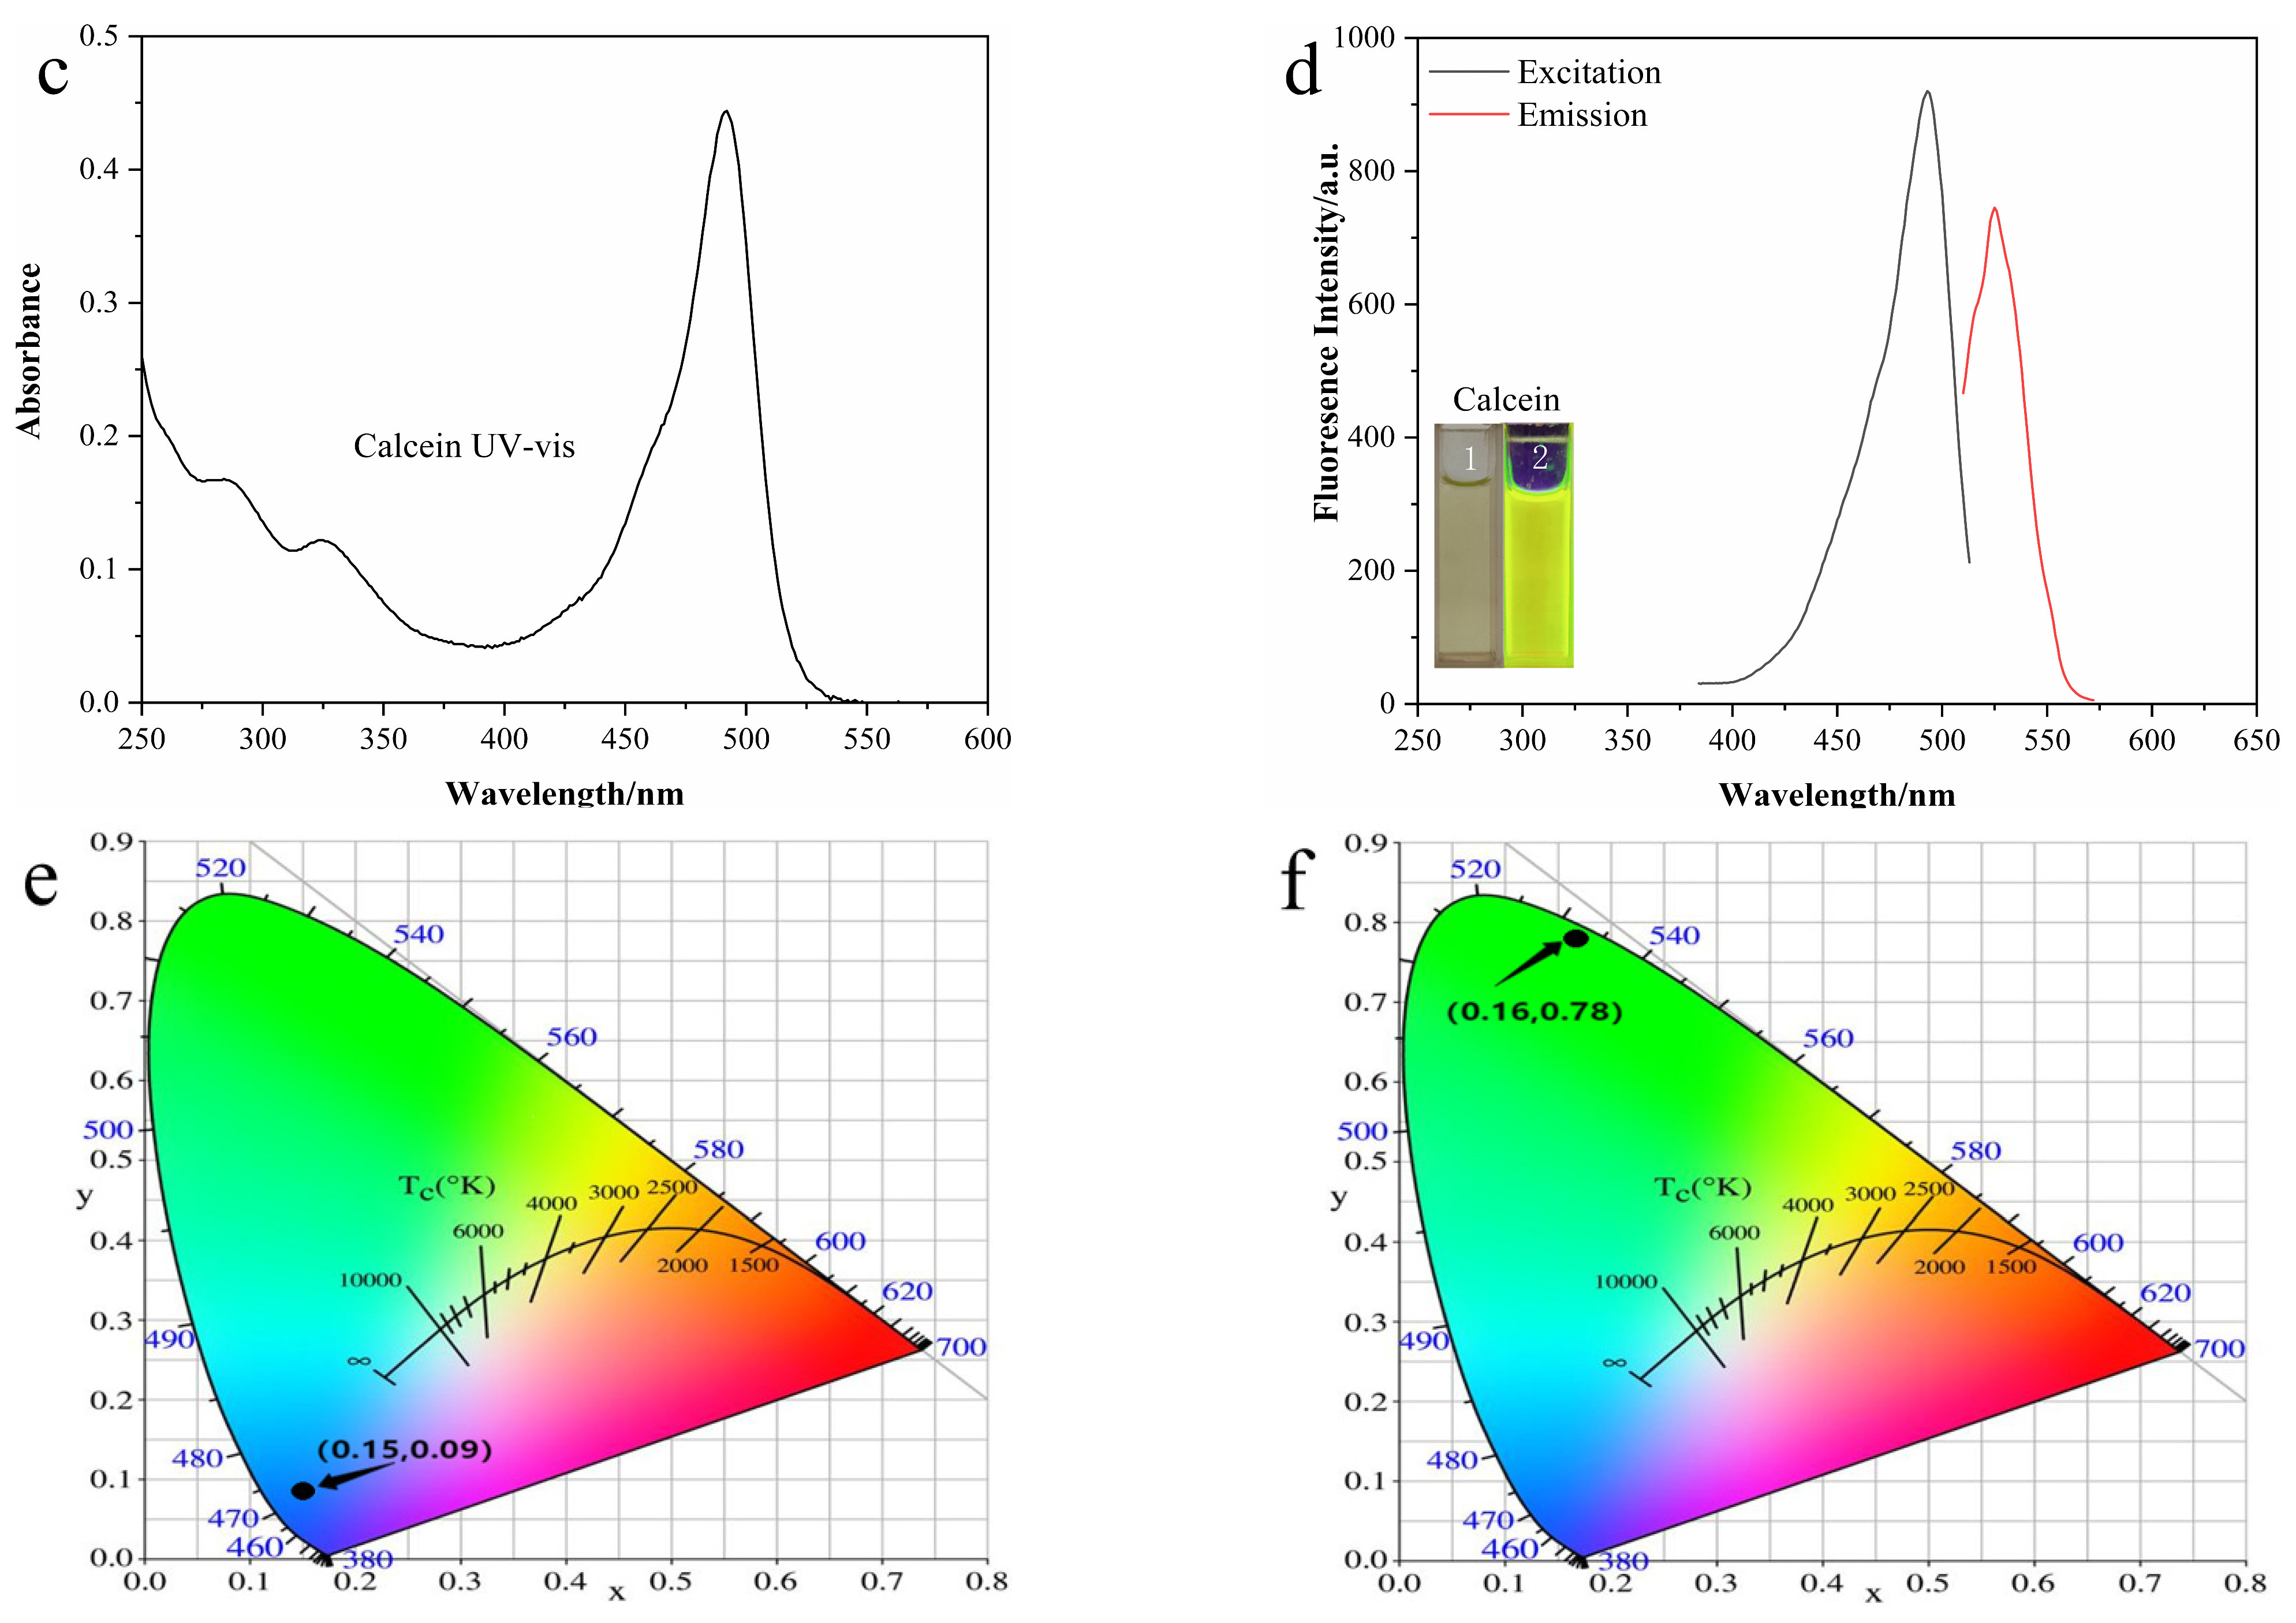
3.2. Optical Properties of N-CDs and Calcein

The fluorescence quantum yield of N-CDs measured by the reference method was as high as 68%, with an absorption peak at 370 nm (Figure 4a). Moreover, the λex and λem of N-CDs were observed at 370 and 435 nm, respectively (Figure 4b). Interestingly, the N-CD solution was colorless under sunlight and presented obvious blue fluorescence under ultraviolet light (365 nm) (Figure 4b inset). This phenomenon was consistent with the color range shown in CIE color coordinates (0.15, 0.09) (Figure 4e).
For calcein, a characteristic absorption peak was shown at 495 nm (Figure 4c), while the λex and λem were detected at 490 and 520 nm, respectively (Figure 4d). Furthermore, calcein presented a bright yellowish green fluorescence under a UV lamp (Figure 4d inset) and the CIE color coordinate was (0.20, 0.70) (Figure 4f).

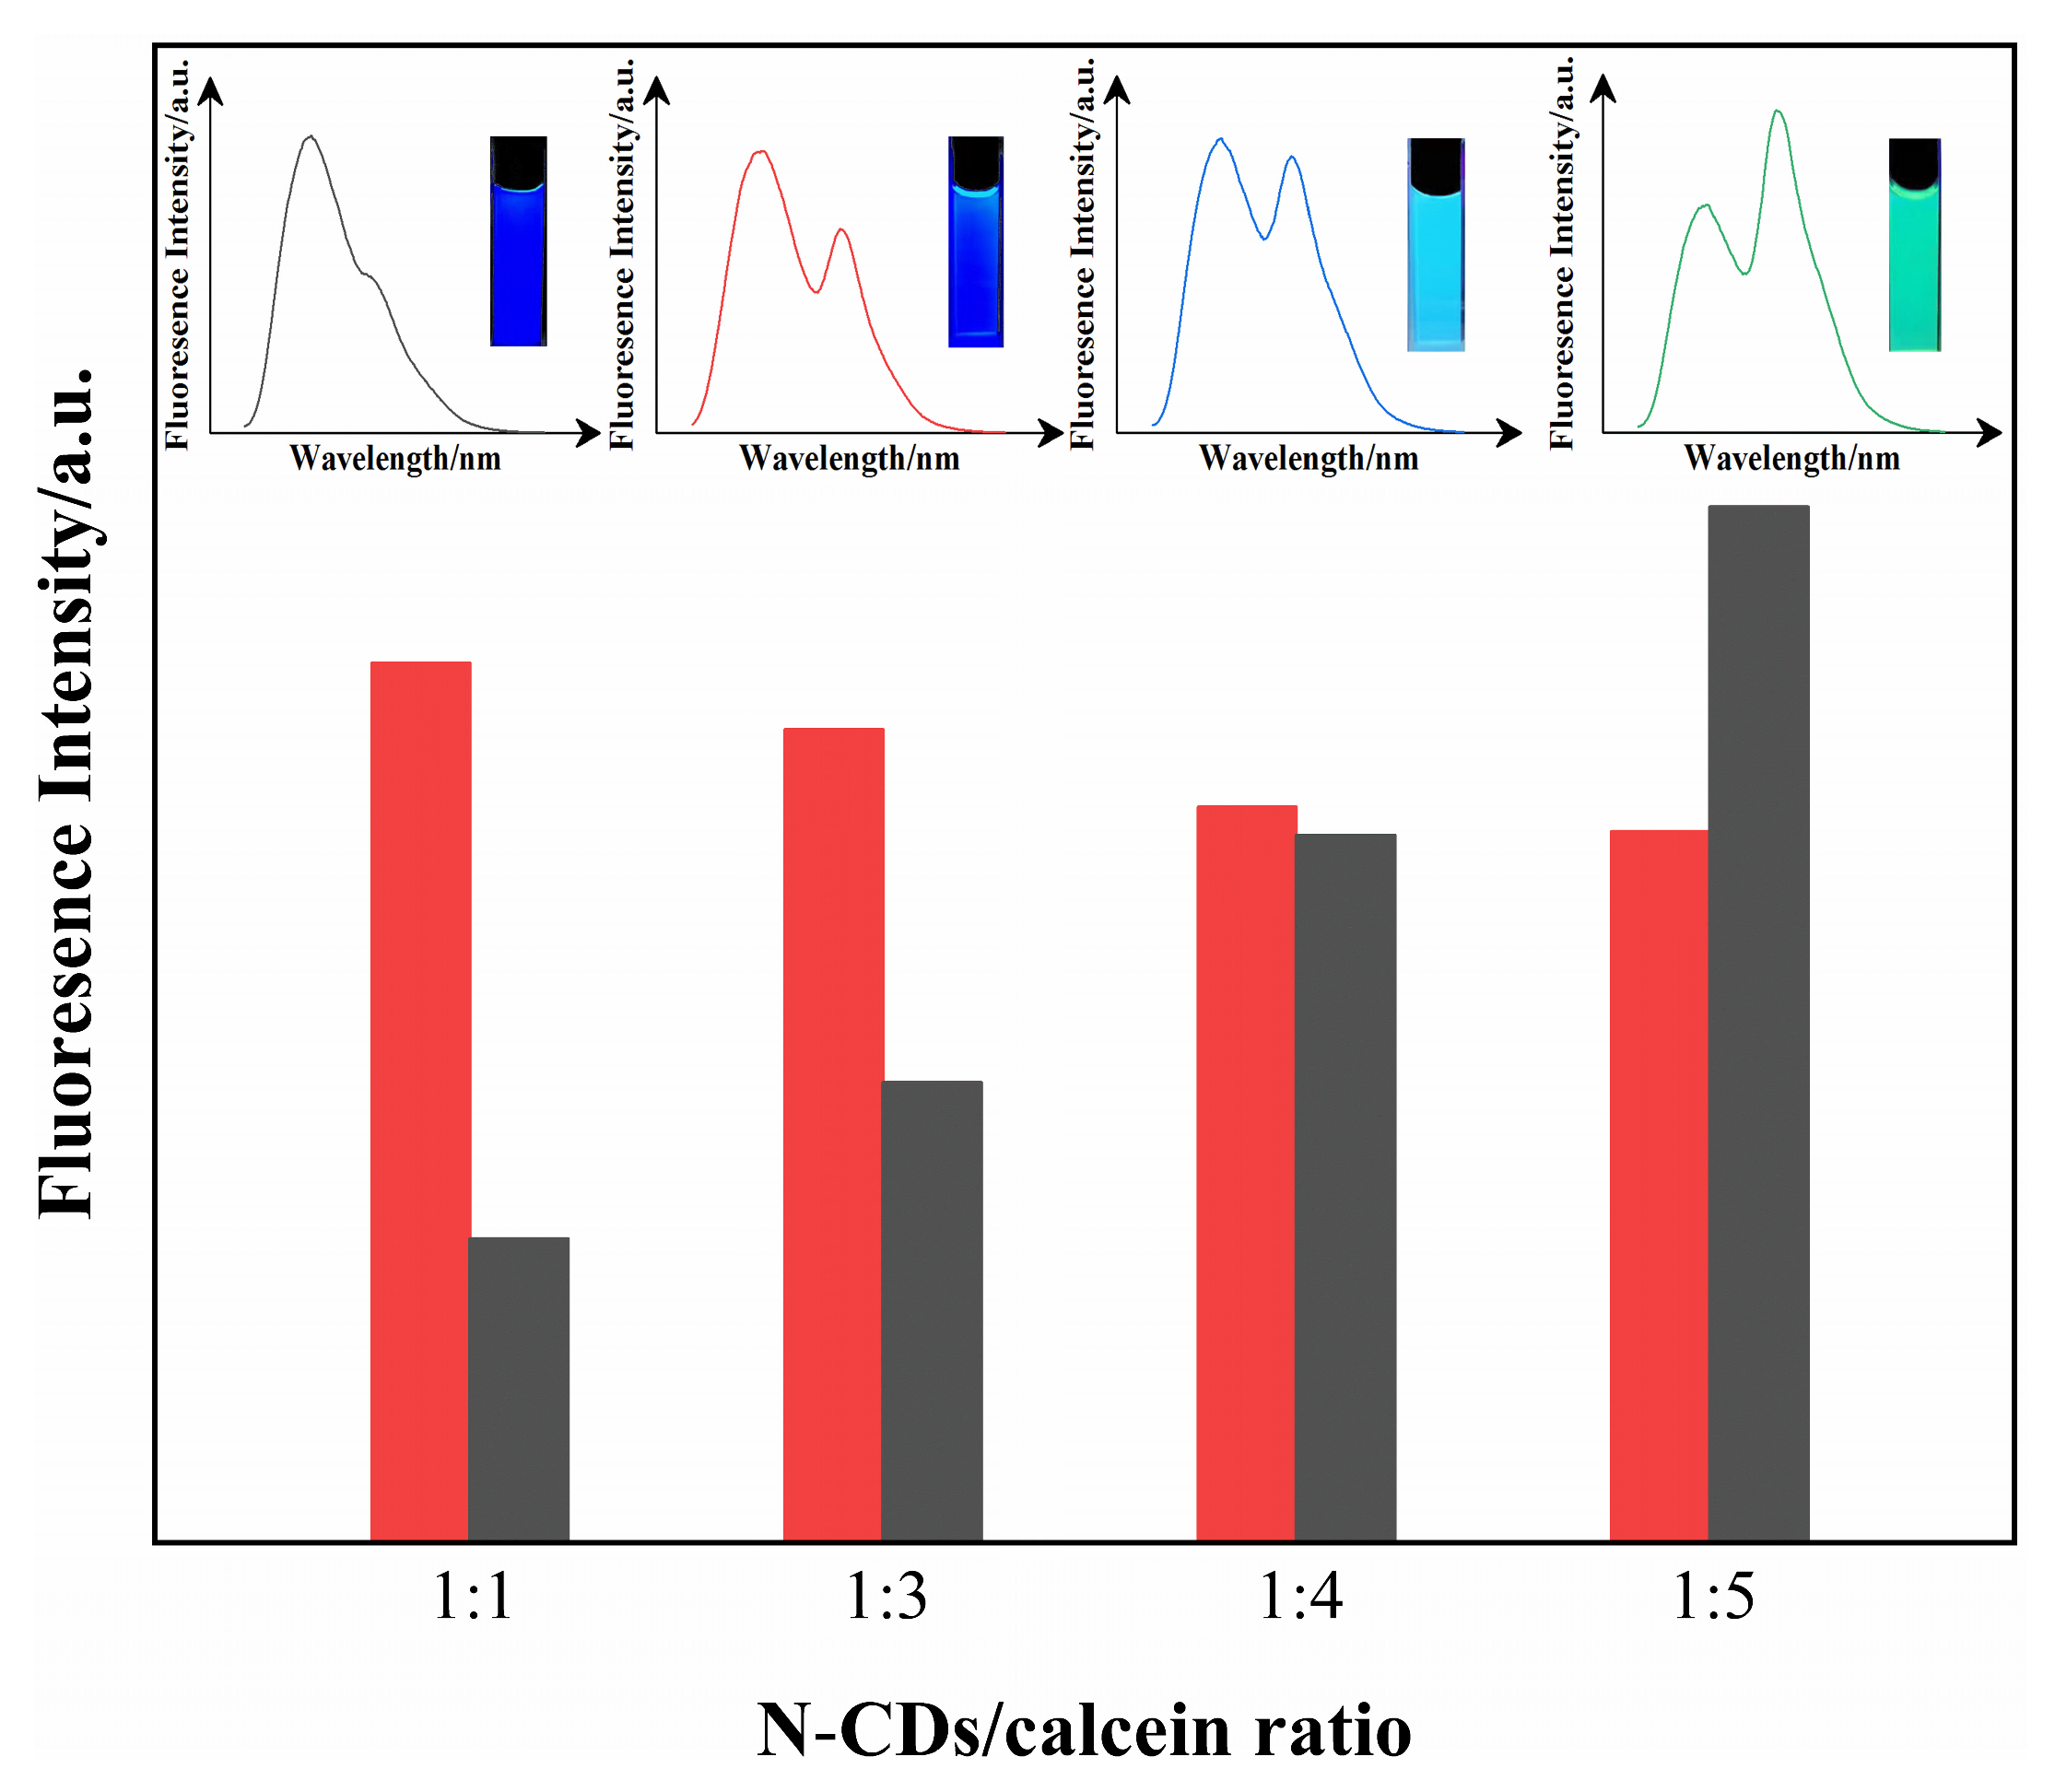
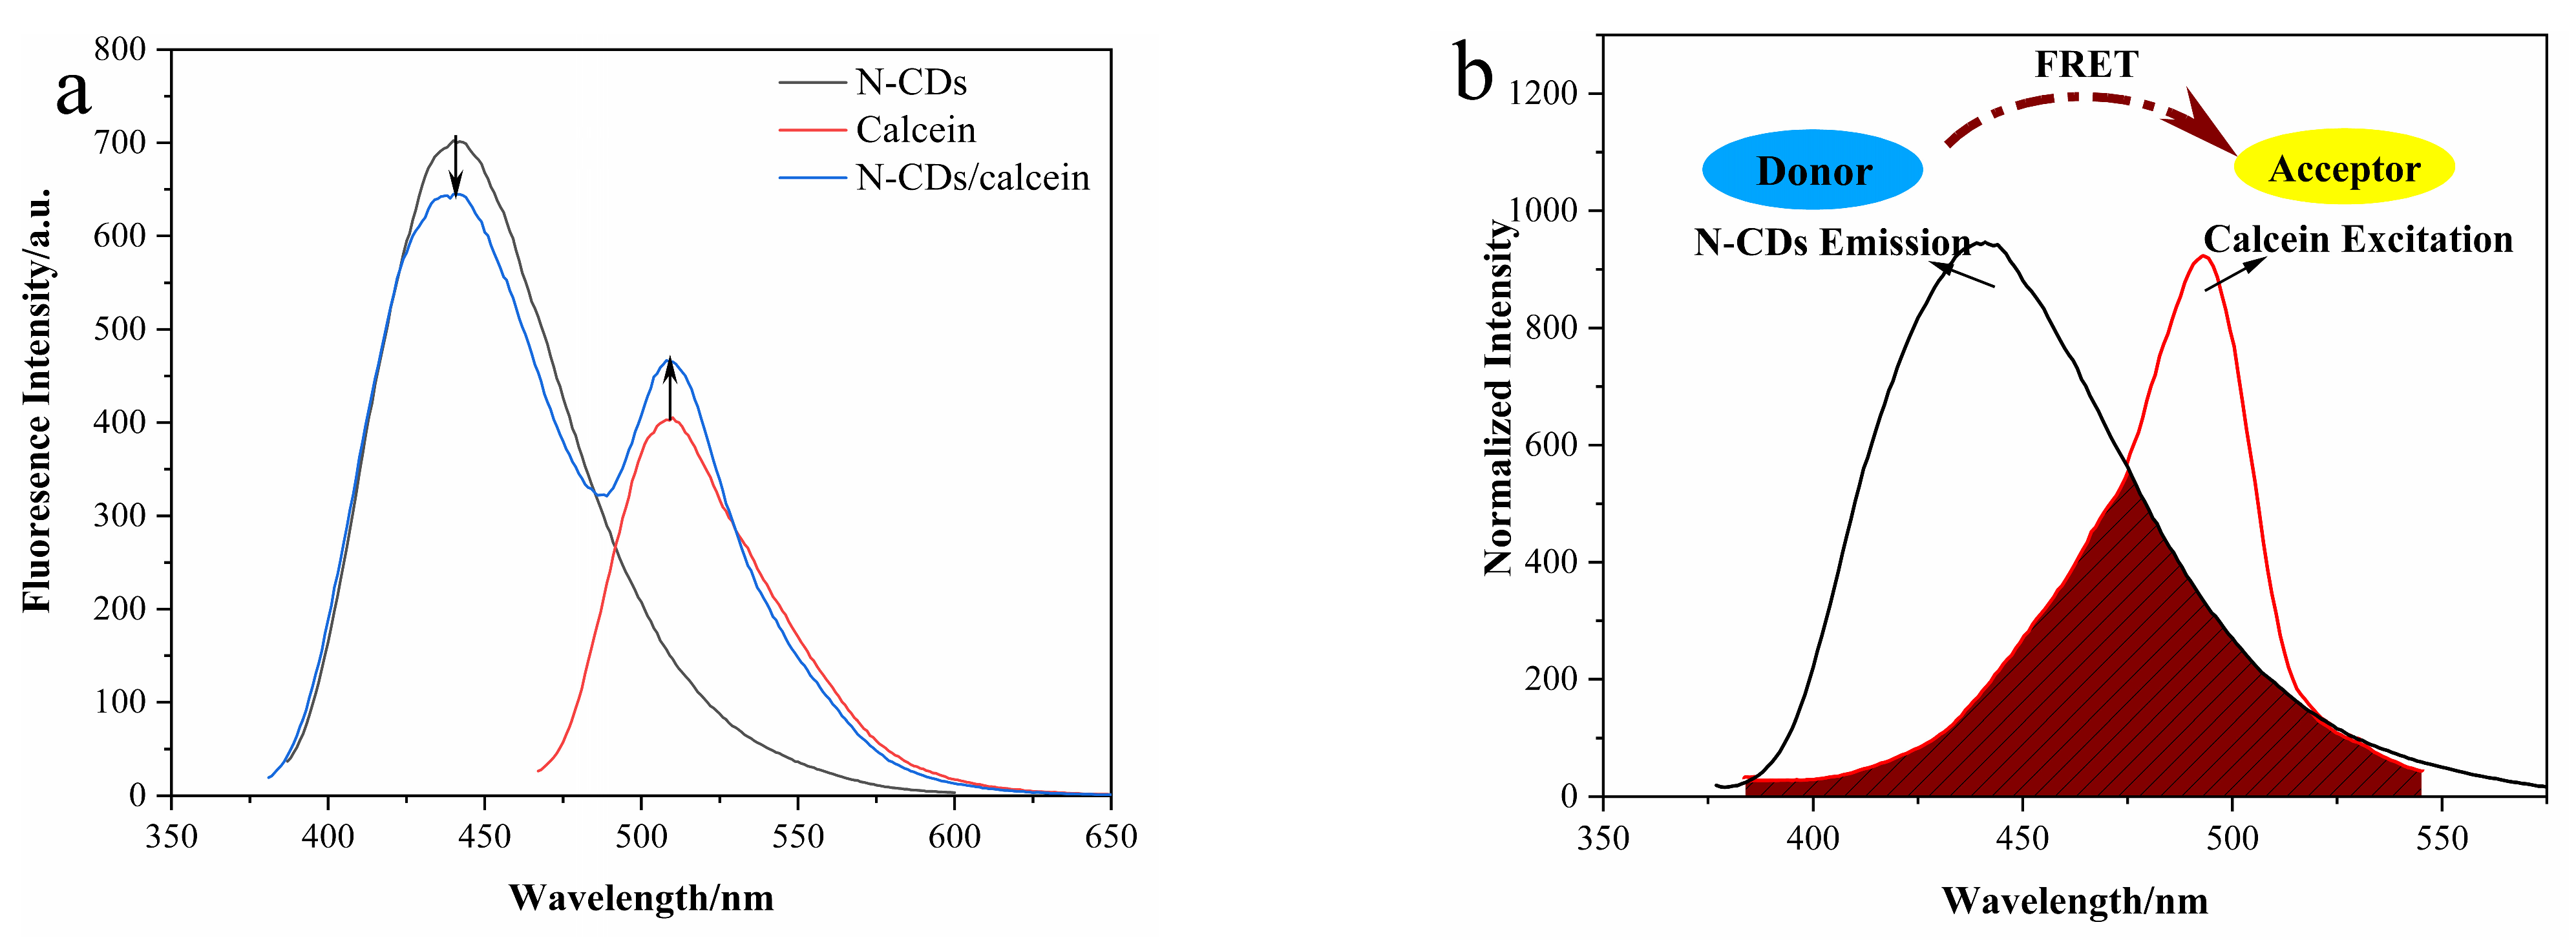
3.3. Construction of N-CD/Calcein Ratiometric Fluorescent Sensor

To construct the ratiometric fluorescent sensor that could generate two emissions under a single excitation, we mixed N-CD and calcein solutions. Since the fluorescence response of the ratiometric fluorescent sensor depended on the distribution ratio of its components, the optimal proportion of N-CDs and calcein in the N-CD/calcein sensor was studied.
When the ratio of N-CDs and calcein was 1:1, the yellowish green fluorescence of calcein was mostly covered by the blue fluorescence of N-CDs (Figure 5) because the two emission peaks were not separated well. On the other hand, the calcein fluorescence was so strong that the N-CDs’ fluorescence was hidden when the N-CD/calcein ratio was changed to 1:4 and 1:5. Therefore, these results suggested that the change in fluorescence would not be obvious if the amount of calcein was too low or too high. Surprisingly, the two emission peaks were isolated well and their emitted fluorescence intensities at 435 and 519 nm were in good proportion when the N-CD/calcein ratio was 1:3. This indicated a more agile fluorescence color range, and the ratio of 1:3 was used in the follow-up experiments to ensure its best performance.
Fluorescence energy resonance transfer (FRET) was developed previously and is widely used in the biomedical field. FRET refers to the phenomenon that energy between two fluorophores is transmitted from the donor to the acceptor in a non-radiative manner through dipole–dipole coupling [53]. FRET should satisfy the following three requirements: (1) the donor can emit fluorescence, (2) there is a certain overlap between the emission spectrum of the donor and the absorption spectrum of the acceptor, (3) the acceptor is close enough to the donor, and the action distance is generally 2–8 nm.
Accordingly, under a single excitation wavelength at 370 nm, the N-CD/calcein sensor displayed two obvious emission signal peaks at 435 and 519 nm, corresponding to N-CDs and calcein, respectively (Figure 6a). Specifically, the emission peak fluorescence intensity of N-CDs was reduced, while it was increased for calcein, indicating that we successfully constructed the N-CD/calcein ratiometric fluorescent sensor. Given its self-correcting performance, our ratiometric fluorescent sensor was found to be more accurate and reliable than its single component by avoiding the inaccuracy caused by certain external factors during the measurement.
Next, we explored the possible mechanism of our N-CD/calcein sensor. The N-CDs had a strong emission at 435 nm, while the calcein had its maximum excitation at 490 nm (Figure 6b). A great overlap between the emission of N-CDs and the excitation of calcein could be observed. Then, the FRET parameters were calculated: the overlap integral (J) was 1.71 × 10¹⁴ nm4 M−1 cm–1; the energy transfer efficiency (E) was 0.13; the critical distance (R0) was 3.53 nm, and the binding distance between donor and acceptor (r0) was 4.85 nm. According to the above data, it was implied that the FRET might have occurred between them.

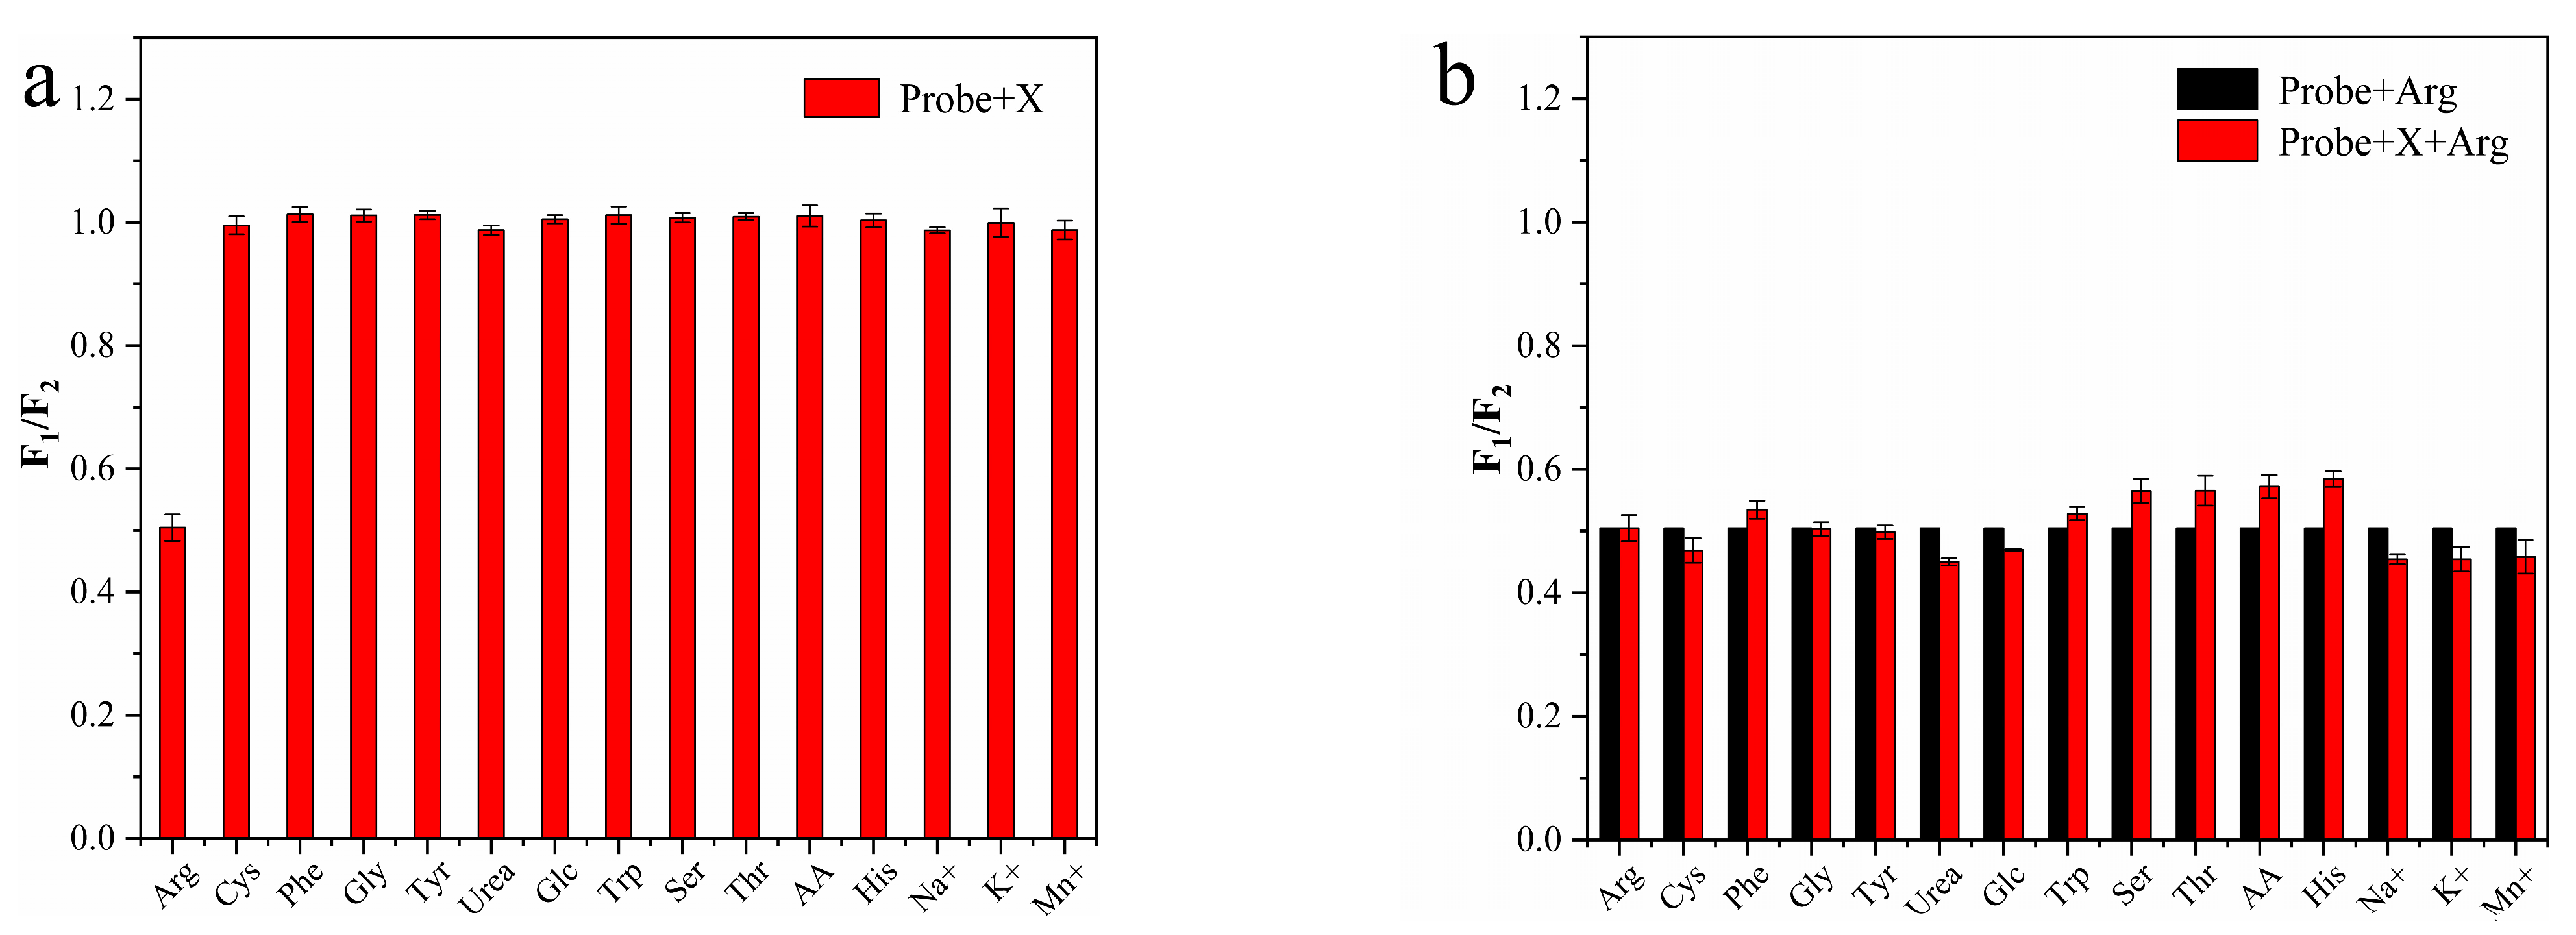
3.4. Characteristics of N-CD/Calcein Ratiometric Fluorescent Sensor

To investigate the characteristics of our N-CD/calcein sensor, we examined its performance under various conditions, including pH, ionic strength and illumination.
pH is one of the critical factors in actual detection and affects the fluorescence intensity of the sensor. Hence, we examined the appropriate pH for our sensor by the determination of pH effects on itself as well as on its components, N-CDs and calcein, individually. The fluorescence intensities of N-CDs and calcein were both elevated when the pH increased from 1 to 7 and reached their maximum strength at neutral pH at 7 (Figure 7). However, when the pH was greater than 7 and rose from 8 to 10, their intensities dramatically decreased. Meanwhile, we also calculated the ratio of the N-CD/calcein sensor (F1/F2). The results indicated that the ratio reached its lowest value at neutral pH at 7, and then increased when the pH was less than or greater than 7, suggesting that acidic and basic conditions both affected the performance of our N-CD/calcein sensor. Overall, we selected neutral pH at 7 for the subsequent experiments.
To examine the ionic strength effect of the fluorescence intensity, we explored its effects on N-CDs, calcein and the N-CD/calcein sensor (Figure 8). As shown in Figure 8, when the ionic strength was increased up to 1.0 mM, the fluorescence intensity of the N-CDs did not show a visible change, while the fluorescence intensity of calcein experienced a slight decrease at 0.8 and 1.0 mM. According to the calculation of the F1/F2 ratio, our N-CD/calcein sensor did not fluctuate; even the ionic strength was stable at 1.0 mM, indicating its tolerance to salinity.
Next, we sought to inspect the stability of our N-CD/calcein sensor. The intensity of N-CDs, calcein and the N-CD/calcein sensor remained stable for 60 min under ultraviolet light (365 nm) irradiation (Figure 9). This result suggested that our N-CD/calcein sensor overcame photobleaching and showed a benefit during analysis and testing over a long period of time.
Lastly, we examined the response time of the N-CD/calcein sensor to Arg and AP detection. With the existence of Arg, the fluorescence intensity started to decrease within 15 s and gradually dropped within 75 s; then, it remained steady until 120 s (Figure 10a). Instead, when AP was added to the N-CD/calcein/Arg complex system, the fluorescence intensity increased within 15 s and was elevated within 45 s, and it then remained constant until 90 s (Figure 10b). Therefore, 75 and 45 s were chosen for the subsequent experiments when detecting Arg and AP, respectively.

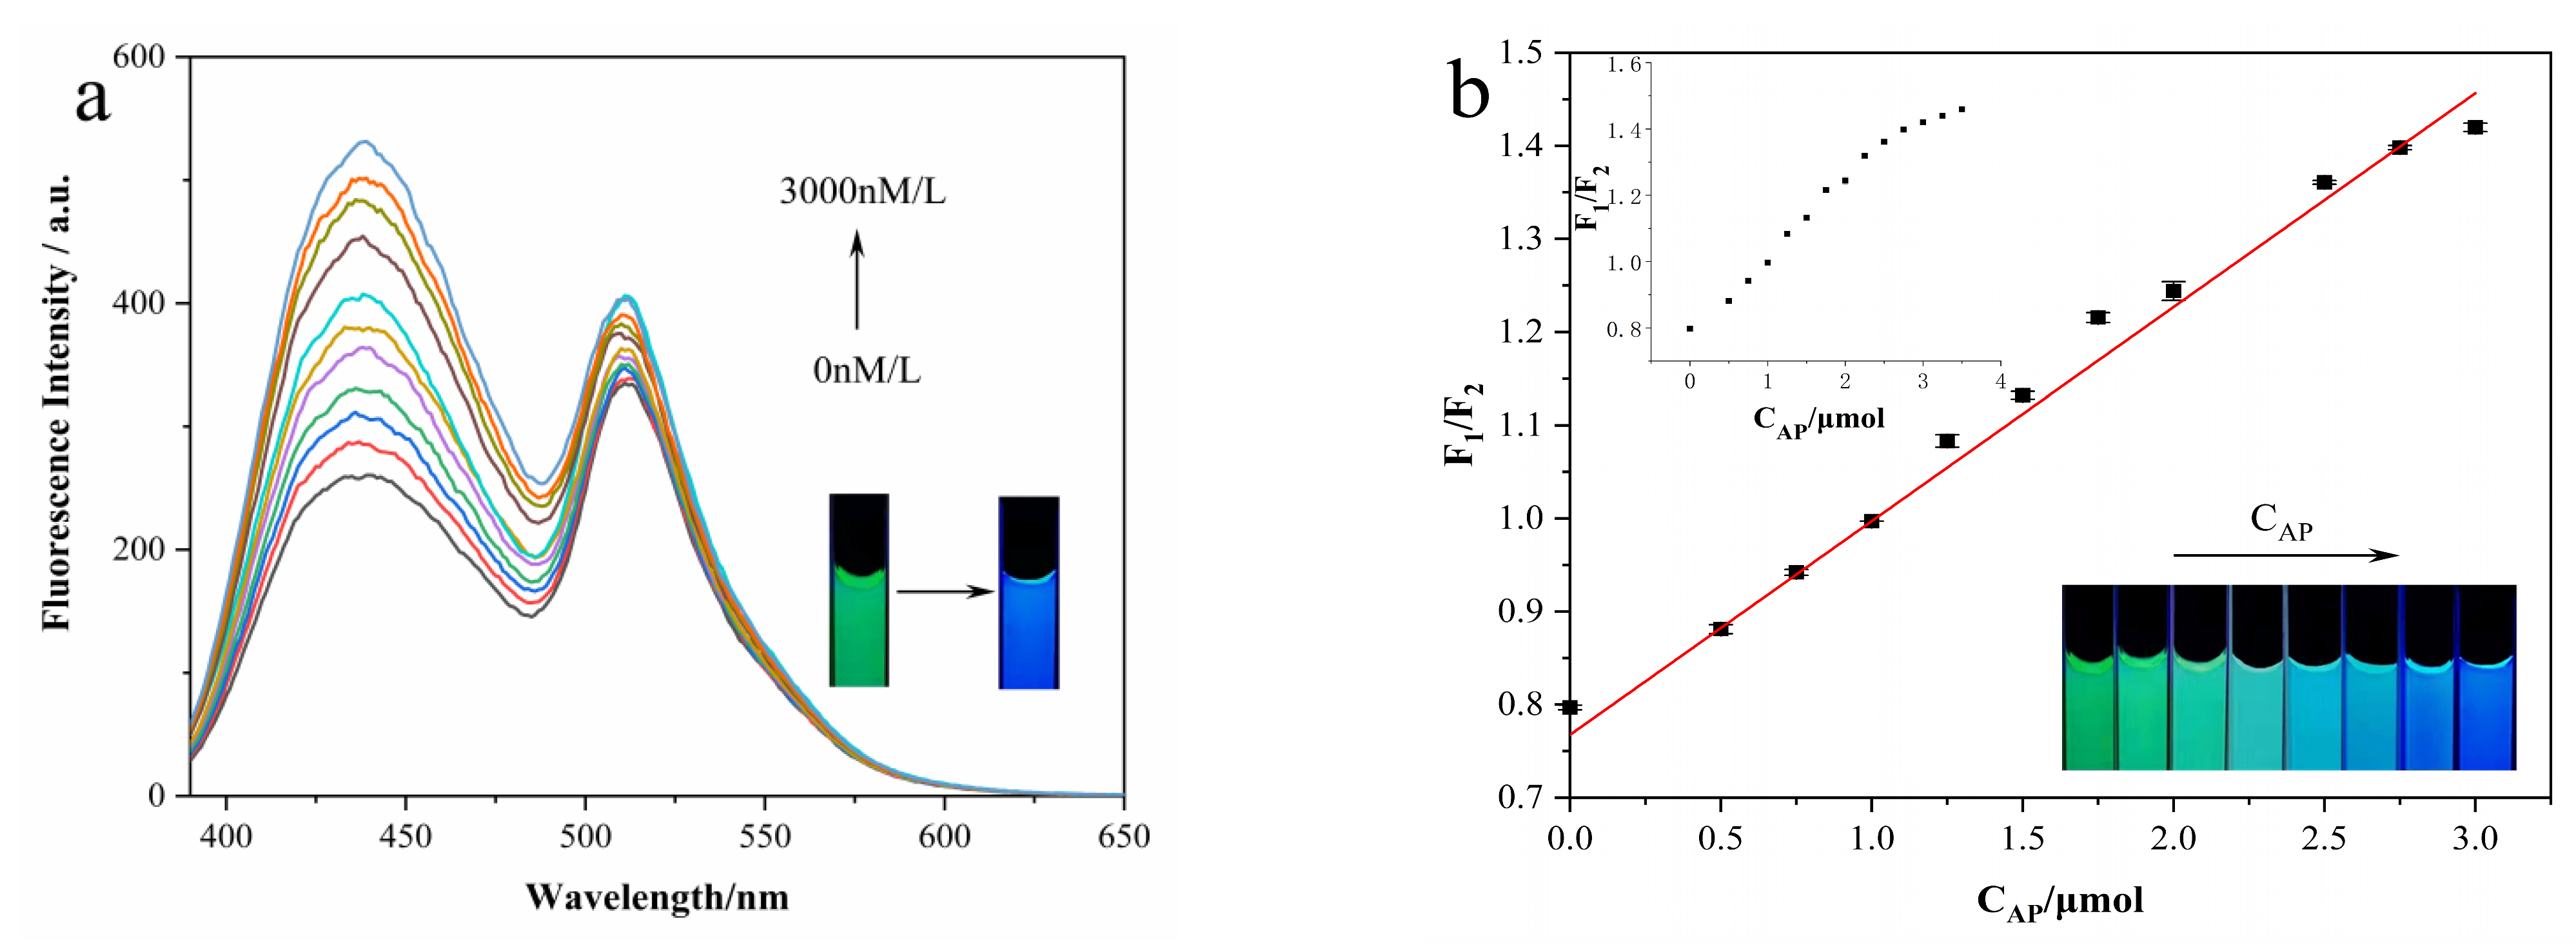
3.5. Ratiometric Fluorescence and Visual Detection of Arg and AP

To reveal the detailed information about Arg and AP detection, we examined the ratiometric fluorescence and color changes of our N-CD/calcein sensor under various concentrations of Arg and AP.
With the increasing concentration of Arg (CArg), the fluorescence intensity of the N-CD/calcein sensor remained decreased and reduced to only 35% of its original intensity when the CArg reached 100 μM (Figure 11a). Specifically, the emission peak of N-CDs at 435 nm decreased more obviously than that of calcein at 519 nm when the CArg was increased. Meanwhile, the fluorescence color of the N-CD/calcein sensor changed from blue to green with the addition of 100 μM Arg (Figure 11a insets). By calculation, there was a strong linear relationship between the F1/F2 ratio (F1/F2 ratio = 1.73) and CArg (in the range of 0.1 to 100 μM) (Figure 11b). In detail, the calculated linear regression equation was F1/F2 = −0.00828CArg + 1.77789 (R2 = 0.9966), and the detection limit (LOD, S/N = 3) was 0.08 μM. Moreover, with an increasing amount of Arg added to the N-CD/calcein sensor, the fluorescence color changed gradually from blue to green (Figure 11b insets). Furthermore, we contrasted the performance of our sensor with previous studies for Arg detection and concluded that our sensor presented a wide linear range with low LOD (Table 1).
To evaluate the specificity of the N-CD/calcein sensor for Arg detection, we evaluated its performance for other substances, including three metal ions (Na+, Mn2+ and K+) and various organic small molecules (tryptophan (Trp), threonine (Thr), glucose (Glc), cysteine (Cys), phenylalanine (Phe), glycine (Gly), tyrosine (Tyr), urea (Urea) and ascorbic acid (AA)). Among all substances, the N-CD/calcein sensor exhibited the largest change in fluorescence intensity only with the existence of Arg, indicating its high selectivity for Arg detection (Figure 12a). Moreover, when Arg was mixed with interference substances (1 mM), Arg still dominated the fluorescence change of the N-CD/calcein sensor and the effect caused by the coexistence of the interfering substance could be neglected (Figure 12b). Above all, this information suggested that our N-CD/calcein sensor had high specificity to detect Arg.
Next, we started to examine the performance of our N-CD/calcein sensor for AP detection. Firstly, we generated the N-CD/calcein/Arg complex system by the addition of 100 μM of Arg. Then, we added different concentrations of AP (CAP) into the complex system and recorded the changes in the fluorescence intensity. As shown in Figure 13a, when increased CAP was added, the fluorescence intensity of the N-CD/calcein/Arg complex system increased with the increased amount of AP and almost recovered to the original intensity when the concentration of AP reached 3 μM (Figure 13a). Briefly, the emission peak of N-CDs at 435 nm increased more obviously than that of calcein at 519 nm. As shown in the insets of Figure 13a, the mixed system displayed an obvious green color and then appeared blue after AP addition. Additionally, we also calculated the linear relationship between the CAP and F1/F2 ratio (F1/F2 ratio = 0.79) and discovered a strong linear relationship when the concentrations of AP ranged from 0.03 to 3 μM (Figure 13b). In detail, the fitted linear equation was plotted as F1/F2 = 0.22967CAP + 0.76752 (R2 = 0.9949) and the detection limit (LOD, S/N = 3) was 0.02 μM, indicating its sensitivity for AP detection. Simultaneously, when AP was added, the fluorescence color of the N-CD/calcein/Arg complex system changed gradually from green to blue (insets in Figure 13b). Moreover, we compared our N-CD/calcein/Arg complex system with previous studies and the comparison results are listed in Table 2.
Following AP detection, we next examined the performance of our N-CD/calcein/Arg complex system with various substances and found subtle fluorescence changes with the existence of other substances (Figure 14a). The quenched fluorescence was only recovered when AP was added into the complex system. When other substances (1 mM) were mixed with AP, their effects were inapparent, indicating the specificity of the N-CD/calcein/Arg complex system for AP detection (Figure 14b). Therefore, our N-CD/calcein/Arg complex system had high selectivity to AP.

3.6. Mechanism of the Ratiometric Sensing System

In this study, our N-CD/calcein ratiometric fluorescent sensor displayed the “on–off–on” pattern with the sequential addition of Arg and AP. Then, we explored the possible mechanism of the N-CD/calcein sensor for Arg and AP detection.
Due to the abundant hydroxyl and carboxyl on the surface, N-CDs had rich emission traps and the zeta potential analysis showed a negative potential (−11.3 mV) (Figure 15a) [62]. When Arg was mixed with our sensor, and the blue fluorescence of N-CDs from the N-CD/calcein sensor was quenched because Arg is a positively charged amino acid [63], and a guanidinium-carboxylate salt bridge was formed with the N-CDs based on the electrostatic interaction and hydrogen bond [64]. The structural change of N-CDs/Arg was demonstrated by FTIR spectrometry; compared to the FTIR spectrum of the N-CDs, the characteristic peak of carboxylate (1550 cm−1) appeared. The results further illustrated the formation of the guanidinium-carboxylate salt bridge (Figure 15b). Hence, it could be concluded that the reaction between carboxyl and guanidino groups was the main reason for the fluorescence quenching of N-CDs.
On the other hand, when AP was added into the N-CD/calcein/Arg complex system, as shown in Figure 15c, AP specifically incorporated with Arg through strongly interacting among O atoms from −COOH groups, N atoms from −NH2 and guanidine groups, forming the hydrogen and large unlocalized π bond [38]. Because of the stronger reactions between AP and Arg compared to those between Arg and the N-CDs, Arg was dissociated from the N-CD/calcein/Arg complex system and the blue fluorescence was recovered with the presence of AP.

3.7. Detection of Arg and AP in Bovine Serum

To assess the feasibility and practical application of the N-CD/calcein sensor, we decided to examine the Arg and AP content in bovine serum. The concentration of Arg was determined to be between 70.82 and 71.26 μM, which was consistent with previous reports. In addition, the concentration of Arg was re-calculated when three different concentrations (5, 15, 25 μM) of Arg were added into the bovine serum. As expected, the recovery rates were calculated to be as high as 95.5~104.4% (RSD < 0.7%) (Table 3). Furthermore, we also tested the ability of the N-CD/calcein/Arg complex system for AP detection. While the original AP content was not detected by the N-CD/calcein/Arg complex system, we were still able to detect the added AP and the recovery rates were measured to be within 99.3~102.0% (RSD < 2.7%) (Table 4). Altogether, these results indicated that our sensor has high practicability to detect Arg and AP in practical samples.

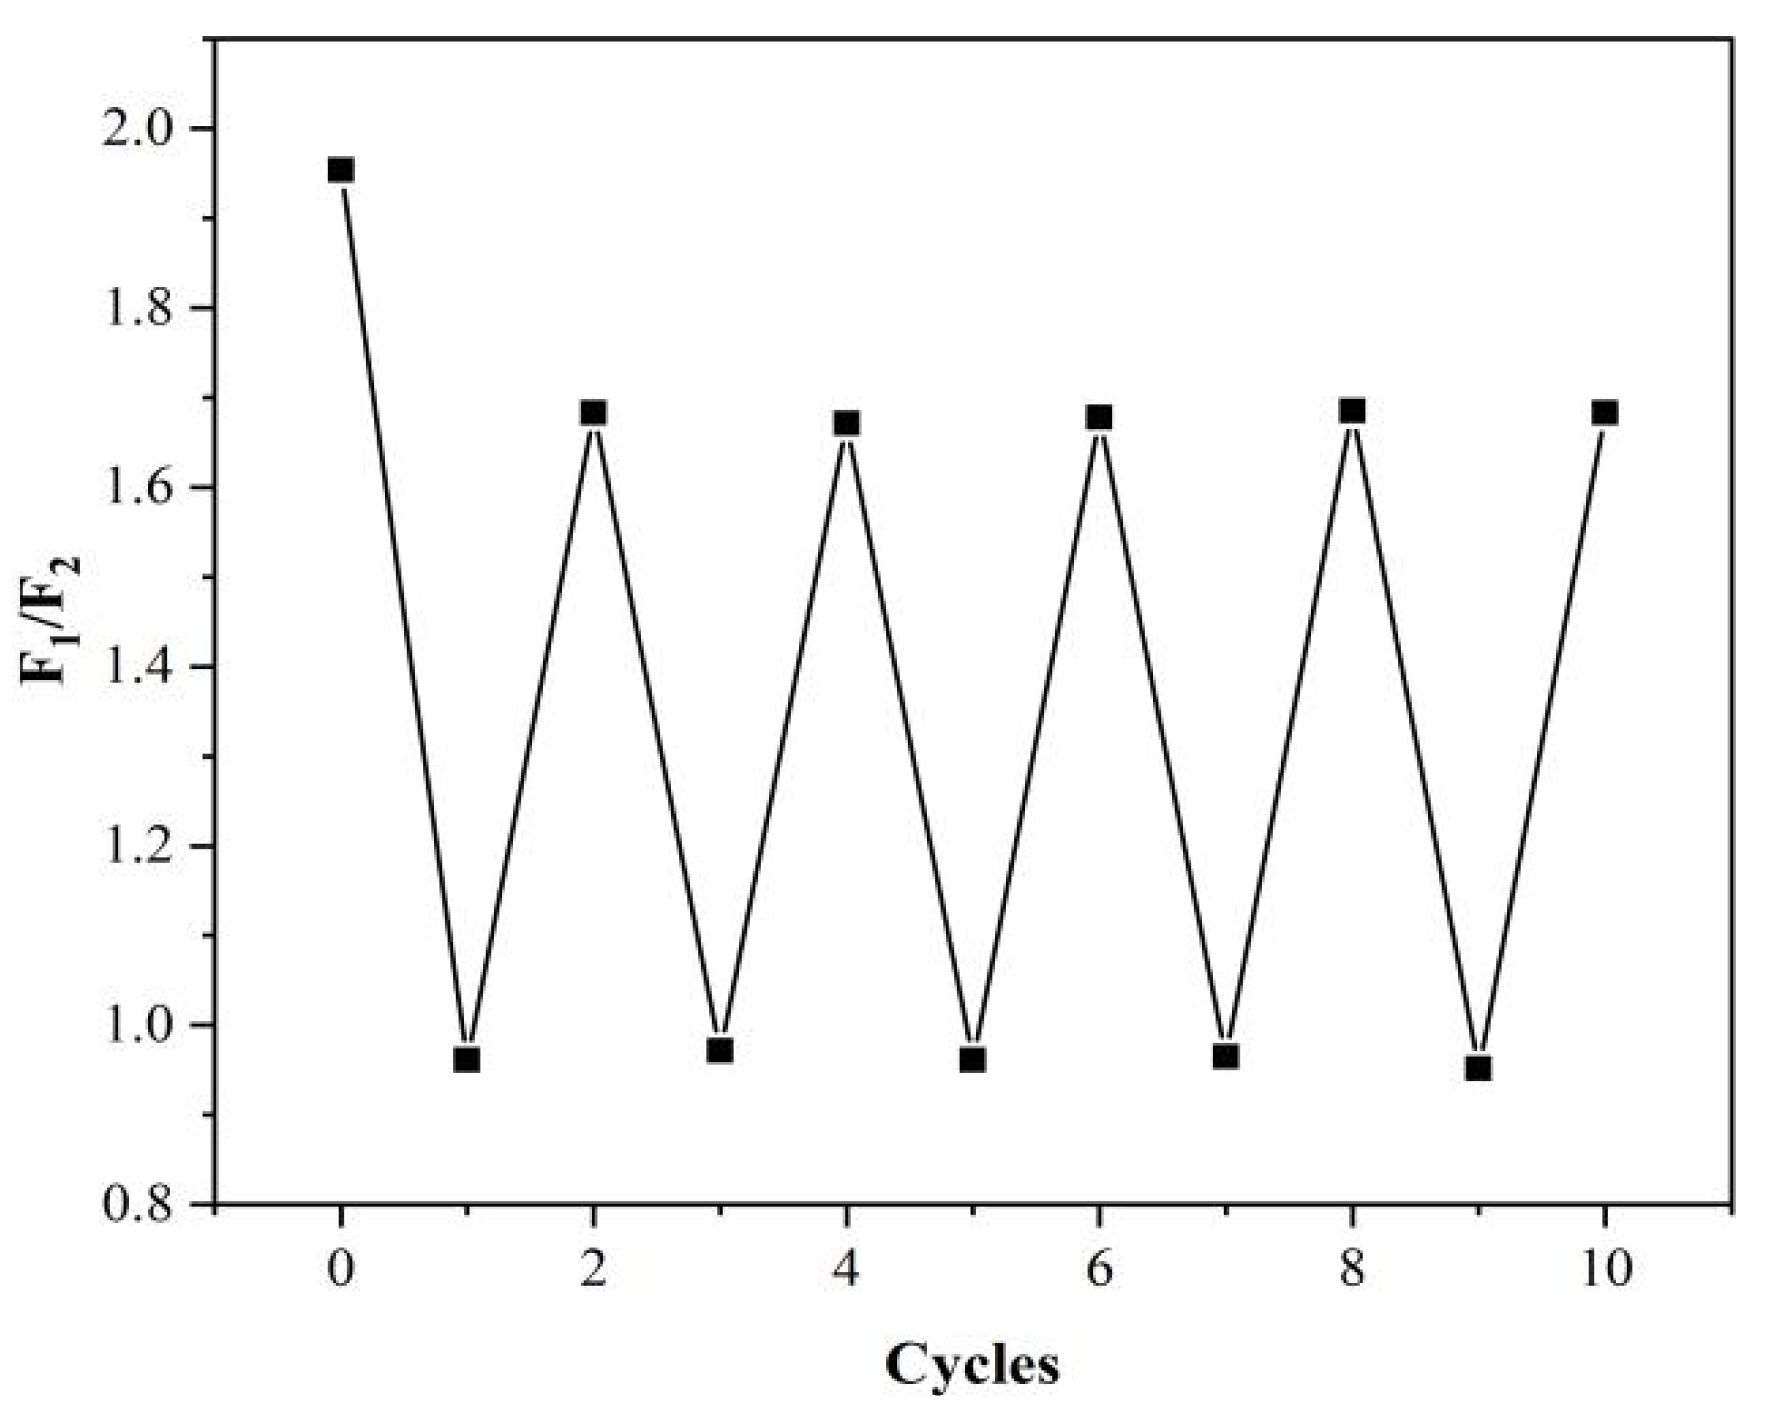
3.8. Logic Gate Application and Reversibility of N-CD/Calcein Sensor

As shown in Figure 16, we generated a fluorescent logic gate by considering Arg and AP as two inputs and the ratiometric fluorescence (F1/F2) as the output. The corresponding signs and the operation table of results were summarized (Figure 16a). Briefly, with regard to inputs, the existence of Arg and AP was defined as “1”, and absence was considered as “0”. As for the output, blue fluorescence indicated the “ON” state and was defined as “0”, while green fluorescence indicated the “OFF” state and was defined as “1”. When the inputs were in the (0, 0), (0, 1) and (1, 1) states, the sensor was “ON” and showed blue fluorescence. Instead, the sensor turned “OFF” and exhibited green fluorescence with only the existence of Arg when the input was in the (1, 0) state.
Reversibility is one of the most important characteristics for “on–off–on” fluorescent sensors. We added Arg and AP alternately to the N-CDs/calcein and recorded the intensity for estimating the reversibility of our sensor (Figure 17). Our N-CD/calcein sensor responded to the addition of Arg and AP within 10 cycles and the intensity changed regularly with each cycle, indicating its good reversibility.

4. Conclusions

In summary, we have prepared a novel ratiometric fluorescent (F1/F2) sensor through simply mixing N-CDs and calcein with possible FRET from N-CDs to calcein. The N-CD/calcein sensor was examined for the visual and ratiometric detection of Arg and AP, with the detection limits of 0.08 and 0.02 μM, respectively. Furthermore, we have proven that our N-CD/calcein sensor successfully examined the content of Arg and AP in bovine serum. In conclusion, our N-CD/calcein ratiometric fluorescent sensor could serve as a powerful tool for biological analysis and imaging in the future

Author Contributions

Conceptualization, Q.L. and H.Q.; Data curation, J.J.; Funding acquisition, H.Q., T.J., R.S. and M.H.; Investigation, Q.L. and K.A.I.; Software, A.H.A., C.L. and L.Q.; Supervision, H.Q., J.J. and R.S.; Writing—original draft preparation, Q.L. and J.J.; Writing—review and editing, H.Q. and R.S. All authors have read and agreed to the published version of the manuscript.

Funding

The work is funded by the National Natural Science Foundation of China (52172092); the Fundamental Research Funds in Heilongjiang Provincial Universities (145109507).

Institutional Review Board Statement

Not applicable.

Informed Consent Statement

Not applicable.

Data Availability Statement

Available upon request from the corresponding author.

Acknowledgments

Taif University Researchers Supporting Project Number (TURSP-2020/117), Taif University, Taif, Saudi Arabia. Princess Nourah bint Abdulrahman University Researchers Supporting Project Number (PNURSP2022R249), Princess Nourah bint Abdulrahman University, Riyadh, Saudi Arabia.

Conflicts of Interest

The authors declare no conflict of interest.

References

  1. Marius, D.M.; Patrick, C. The role of L-arginine metabolism in neurocritical care patients. Neural Regen. Res. 2022, 17, 1446–1453. [Google Scholar]
  2. Navaei, A.H.; Shekerdemian, L.S.; Mohammad, M.A. Derangement of arginine and related amino acids in children undergoing surgery for congenital heart disease with cardiopulmonary bypass. Crit. Care Explor. 2020, 2, e0150. [Google Scholar] [CrossRef]
  3. Luiking, Y.C.; Engelen, M.P.K.J.; Deutz, N.E.P. Regulation of nitric oxide production in health and disease. Curr. Opin. Clin. Nutr. Metab. Care 2010, 13, 97–104. [Google Scholar] [CrossRef] [Green Version]
  4. Xiao, S.; Wagner, L.; Mahaney, J. Uremic levels of urea inhibit L-arginine transport in cultured endothelial cells. Am. J. Physiol.-Ren. Physiol. 2001, 280, F989–F995. [Google Scholar] [CrossRef]
  5. Ghorai, A.; Mondal, J.; Patra, G.K. A new Schiff base and its metal complex as colorimetric and fluorescent-colorimetric sensors for rapid detection of arginine. New J. Chem. 2016, 40, 7821–7830. [Google Scholar] [CrossRef]
  6. Bologna, K.; Cesana-Nigro, N.; Refardt, J. Effect of arginine on the hypothalamic-pituitary-adrenal axis in individuals with and without vasopressin deficiency. J. Clin. Endocrinol. Metab. 2020, 105, E2327–E2336. [Google Scholar] [CrossRef]
  7. Goumas, G.; Tentolouris, C.; Tousoulis, D. Therapeutic modification of the L-arginine-eNOS pathway in cardiovascular diseases. Atherosclerosis 2001, 154, 255–267. [Google Scholar] [CrossRef]
  8. Maarsingh, H.; Bossenga, B.E.; Bos, I.S.T. L-Arginine deficiency causes airway hyperresponsiveness after the late asthmatic reaction. Eur. Resp. J. 2009, 34, 91–199. [Google Scholar] [CrossRef] [Green Version]
  9. Weaver, C.; Bishop, A.E.; Polak, J.M. Pancreatic changes elicited by chronic administration of excess L-arginine. Exp. Mol. Pathol. 1994, 60, 71–87. [Google Scholar] [CrossRef]
  10. Vukosavljevic, N.; Jaron, D.; Barbee, K.A. Quantifying the L-arginine paradox in vivo. Microvasc. Res. 2005, 71, 48–54. [Google Scholar] [CrossRef]
  11. Savelieva, K.V.; Kamensky, A.A.; Ashmarin, I.P. The excess of alimentary L-arginine impairs place learning with food reinforcement in rats. Zhurnal Vyss. Nervn. Deyatelnosti Im I P Pavlov 1996, 46, 301–308. [Google Scholar]
  12. Huang, H.S.; Ma, M.C.; Chen, J. Chronic L-arginine administration increases oxidative and nitrosative stress in rat hyperoxaluric kidneys and excessive crystal deposition. Am. J. Physiol.-Ren. Physiol. 2007, 295, F388–F396. [Google Scholar] [CrossRef] [PubMed] [Green Version]
  13. Chu, Q.; Jiang, L.; Tian, X. Rapid determination of acetaminophen and p-aminophenol in pharmaceutical formulations using miniaturized capillary electrophoresis with amperometric detection. Anal. Chim. Acta 2008, 606, 246–251. [Google Scholar] [CrossRef] [PubMed]
  14. Prabakar, S.J.R.; Narayanan, S.S. Amperometric determination of paracetomol by a surface modified cobalt hexacyanoferrate graphite wax composite electrode. Talanta 2007, 72, 1818–1827. [Google Scholar] [CrossRef]
  15. Henderson, A.J.; Shaheen, S.O. Acetaminophen and asthma. Paediatr. Respir. Rev. 2012, 14, 9–16. [Google Scholar] [CrossRef] [PubMed]
  16. Stern, S.T.; Bruno, M.K. Contribution of acetaminophen-cysteine to acetaminophen nephrotoxicity in CD-1 mice: I. enhancement of acetaminophen nephrotoxicity by acetaminophen-cysteine. Toxicol. Appl. Pharmacol. 2004, 202, 151–159. [Google Scholar] [CrossRef]
  17. Heard, K.; Green, J. Acetylcysteine Therapy for acetaminophen poisoning. Curr. Pharm. Biotechnol. 2012, 13, 1917–1923. [Google Scholar] [CrossRef]
  18. Gopalakrishnan, V.; Burton, P.J.; Blaschke, T.F. High-performance liquid chromatographic assay for the quantitation of L-arginine in human plasma. Anal. Chem. 1996, 68, 3520–3523. [Google Scholar] [CrossRef]
  19. Olson, D.L.; Lacey, M.E.; Webb, A.G. Nanoliter-volume H-1 NMR detection using periodic stopped-flow capillary electrophoresis. Anal. Chem. 1999, 71, 3070–3076. [Google Scholar] [CrossRef]
  20. Mira de Orduna, R. Quantitative determination of L-arginine by enzymatic end-point analysis. J. Agric. Food Chem. 2001, 49, 549–552. [Google Scholar] [CrossRef]
  21. Bahl, S.; Naqvi, S. Simple, rapid quantitative-determination of lysine and arginine by thin-layer chromatography. J. Agric. Food Chem. 1976, 24, 56–59. [Google Scholar] [CrossRef] [PubMed]
  22. Bastone, A.; Diomede, L.; Parini, R. Determination of argininosuccinate lyase and arginase activities with an amino-acid analyzer. Anal. Biochem. 1990, 191, 384–389. [Google Scholar] [CrossRef]
  23. Kauffman, J.F.; Batykefer, L.M. Raman detected differential scanning calorimetry of polymorphic transformations in acetaminophen. J. Pharm. Biomed. Anal. 2008, 48, 1310–1315. [Google Scholar] [CrossRef]
  24. Heard, K.; Anderson, V. Serum Acetaminophen Protein Adduct Concentrations in Pediatric Emergency Department Patients. J. Pediatr. Gastroenterol. Nutr. 2017, 64, 533–535. [Google Scholar] [CrossRef] [PubMed]
  25. Zhang, Z.T.; Fan, Z.F. Application of magnesium ion doped carbon dots obtained via hydrothermal synthesis for arginine detection. New J. Chem. 2020, 44, 4842–4849. [Google Scholar] [CrossRef]
  26. Xu, J.L.; Cui, C.K.; Gong, T.Y. Ultrasonic-assisted synthesis of N-doped, multicolor carbon dots toward fluorescent inks, fluorescence sensors, and logic gate operations. Nanomaterials 2022, 12, 312. [Google Scholar] [CrossRef]
  27. Chauhan, P.; Mundekkad, D.; Mukhenjee, A. Coconut carbon dots: Progressive large-scale synthesis, detailed biological activities and smart sensing aptitudes towards tyrosine. Nanomaterials 2022, 12, 162. [Google Scholar] [CrossRef]
  28. Ganguly, S.; Das, P. Microwave-synthesized polysaccharide-derived carbon dots as therapeutic cargoes and toughening agents for elastomeric gels. ACS Appl. Mater. Interfaces 2020, 12, 51940–51951. [Google Scholar] [CrossRef]
  29. Hou, L.; Chen, D.D.; Wang, R.T. Transformable honeycomb-like nanoassemblies of carbon dots for regulated multisite delivery and enhanced antitumor chemoimmunotherapy. Angew. Chem. Int. Ed. 2021, 60, 6581–6592. [Google Scholar] [CrossRef] [PubMed]
  30. Kumar, V.B.B.; Sahu, A. Refractive-index tuning of highly fluorescent carbon dots. ACS Appl. Mater. Interfaces 2017, 9, 28930–28938. [Google Scholar] [CrossRef] [PubMed]
  31. Gedanken, A.; Kumar, V.B. A hydrothermal reaction of an aqueous solution of BSA yields highly fluorescent N doped C-dots used for imaging of live mammalian cells. J. Mater. Chem. B 2016, 4, 2913–2920. [Google Scholar]
  32. Mu, X.W.; Jiang, X. Sensitive ratiometric fluorescence probe based on chitosan carbon dots and calcein for Alkaline phosphatase detection and bioimaging in cancer cell. Anal. Chim. Acta 2021, 1188, 339163. [Google Scholar] [CrossRef] [PubMed]
  33. Cui, L.; Ren, X.; Sun, M.T. Carbon Dots: Synthesis, properties and applications. Nanomaterials 2021, 11, 3419. [Google Scholar] [CrossRef] [PubMed]
  34. Ramanarayanan, R.; Sindhu, S. Synthesis and characterisation of green luminescent carbon dots from guava leaf extract. Mater. Today Proc. 2020, 33, 2223–2227. [Google Scholar] [CrossRef]
  35. Ahmed, S.R.; Kumar, S. Target specific sptamer- induced self -assembly of fluorescent graphene quantum dots on palladium nanoparticles for sensitive detection of tetracycline in raw milk. Food. Chem. 2021, 346, 128893. [Google Scholar] [CrossRef] [PubMed]
  36. Das, P.; Ganguly, S. Immobilization of heteroatom-doped carbon dots onto nonpolar plastics for antifogging, antioxidant, and food monitoring application. Langmuir 2021, 37, 3508–3520. [Google Scholar] [CrossRef]
  37. Syed, R.A.; Masoomeh, S. Nanozymatic detection of thiocyanate through accelerating the growth of ultra-small gold nanoparticles/graphene quantum dots hybrids. Food Chem. 2022, 379, 132152. [Google Scholar]
  38. Bu, X.N.; Fu, Y.X.; Jiang, X.W. Self-assembly of DNA-templated copper nanoclusters and carbon dots for ratiometric fluorometric and visual determination of arginine and acetaminophen with a logic-gate operation. Microchim. Acta 2020, 187, 154. [Google Scholar] [CrossRef]
  39. Wang, Y.Y.; Liu, H.X. Synthesis of dual-emission fluorescence carbon quantum dots and their ratiometric fluorescent detection for arginine in 100% water solution. New J. Chem. 2019, 43, 13234–13239. [Google Scholar] [CrossRef]
  40. Gan, X.Q.; Angelina, E. Arginine-malate-based dual-emission carbon dots for uric acid determination in human serum with a miniaturized device. J. Mater. Sci. 2022, 57, 576–588. [Google Scholar] [CrossRef]
  41. Le, T.H.; Kim, J.H.; Park, S.J. “Turn on” fluorescence sensor of glutathione based on inner filter effect of Co-doped carbon dot/gold nanoparticle composites. Nanomaterials 2022, 23, 190. [Google Scholar] [CrossRef] [PubMed]
  42. Molla, C.; Lee, H.; Ju, Y. Ratiometric fluorescence probe based on monochromaticdual-emission carbon nanodots with fluorescence cespectral change. Dyes Pigment. 2021, 197, 109883. [Google Scholar] [CrossRef]
  43. Xu, X.M.; Ren, D.D.; Chai, Y.Y. Dual-emission carbon dots-based fluorescent probe for ratiometric sensing of Fe(III) and pyrophosphate in biological samples. Sens. Actuators B Chem. 2019, 298, 126829. [Google Scholar] [CrossRef]
  44. Pang, S.; Liu, S.Y. Dual-emission carbon dots for ratiometric detection of Fe3+ ions and acid phosphatase. Anal. Chim. Acta 2020, 1105, 155–161. [Google Scholar] [CrossRef] [PubMed]
  45. Wang, Y.L.; Lao, S.Y.; Ding, W.J. A novel ratiometric fluorescent probe for detection of iron ions and zinc ions based on dual-emission carbon dots. Sens. Actuators B Chem. 2018, 284, 186–192. [Google Scholar] [CrossRef]
  46. Huang, S.; Yao, J.D. One-step facile synthesis of nitrogen-doped carbon dots: A ratiometric fluorescent probes for evaluation of acetylcholinesterase activity and detection of organophosphorus pesticides in tap water and food. J. Agric. Food Chem. 2019, 67, 11244–11255. [Google Scholar] [CrossRef] [PubMed]
  47. Sudhan, N.; Subramani, K.; Karnan, M. Biomass-derived activated porous carbon from rice straw for a high-energy symmetric supercapacitor in aqueous and nonaqueous electrolytes. Energy Fuels 2017, 31, 977–985. [Google Scholar] [CrossRef]
  48. Srinivasan, K.; Subramanian, K.; Murugan, K. Sensitive fluorescence detection of mercury (II) in aqueous solution by the fluorescence quenching effect of MoS2 with DNA functionalized carbon dots. Analyst 2016, 141, 6344–6352. [Google Scholar] [CrossRef]
  49. Mehta, V.N.; Jha, S.; Basu, H. One-step hydrothermal approach to fabricate carbon dots from apple juice for imaging of mycobacterium and fungal cells. Sens. Actuators B Chem. 2015, 213, 434–443. [Google Scholar] [CrossRef]
  50. Xu, X.W.; Zhang, K.; Zhao, L. Aspirin-based carbon dots, a good biocompatibility of material applied for bioimaging and anti-inflammation. ACS Appl. Mater. Interfaces 2016, 8, 32706–32716. [Google Scholar] [CrossRef] [PubMed]
  51. Zhang, Z.H.; Sun, W.H.; Wu, P.Y. Highly photoluminescent carbon dots derived from egg white: Facile and green synthesis, photoluminescence properties, and multiple applications. ACS Sustain. Chem. Eng. 2015, 3, 1412–1418. [Google Scholar] [CrossRef]
  52. Papirer, E.; Lacroix, R.; Donnet, J.B. XPS study of the halogenation of carbon-black 2. chlorination. Carbon 1995, 33, 63–72. [Google Scholar] [CrossRef]
  53. Liu, B.S.; Gao, J. Fluorescence resonance energy transfer between acridine orange and rhodamine 6G and fluorescence quenching of rhodamine 6G reaction for the determination of proteins. Chin. J. Chem. 2005, 33, 546–548. [Google Scholar]
  54. Soldatkina, O.V.; Soldatkin, O.O.; Velychko, T.P. Conductometric biosensor for arginine determination in pharmaceutics. Bioelectrochemistry 2018, 124, 40–46. [Google Scholar] [CrossRef] [PubMed]
  55. Kaviya, S. Rapid naked eye detection of arginine by pomegranate peel extract stabilized gold nanoparticles. King Saud Univ. Sci. 2017, 31, 864–868. [Google Scholar] [CrossRef]
  56. Pu, W.; Zhao, H.W.; Huang, C.Z. Visual detection of arginine based on the unique guanidino group-induced aggregation of gold nanoparticles. Anal. Chim. Acta 2012, 764, 78–83. [Google Scholar] [CrossRef] [PubMed]
  57. Jia, S.S.; Luo, B.; Zhao, Y. Determination of Glutamine and Argininein Human Serum by Capillary Electrophoresis with UV Detection. Asian J. Org. Chem. 2012, 24, 565–567. [Google Scholar]
  58. Wei, M.; Lu, W.B.; Liu, G.Q. Ni2P nanosheets: A high catalytic activity platform for electrochemical detection of acetaminophen. Chin. J. Chem. 2021, 39, 1849–1854. [Google Scholar] [CrossRef]
  59. Liang, W.C.; Ren, H.L.; Li, Y.G. A robust electrochemical sensing based on bimetallic metal-organic framework mediated Mo2C for simultaneous determination of acetaminophen and isoniazid. Anal. Chim. Acta 2020, 1136, 99–105. [Google Scholar] [CrossRef] [PubMed]
  60. Liang, W.C.; Liu, L.L.; Li, Y.G. Nitrogen-rich porous carbon modified electrochemical sensor for the detection of acetaminophen. J. Electroanal. Chem. 2019, 855, 113496. [Google Scholar] [CrossRef]
  61. Liu, C.D.; Zhang, N.; Huang, X. Fabrication of a novel nanocomposite electrode with ZnO-MoO3 and biochar derived from mushroom biomaterials for the detection of acetaminophen in the presence of DA. Microchem. J. 2020, 161, 105719. [Google Scholar] [CrossRef]
  62. Sahu, S.; Behera, B.; Maiti, T.K. Simple one-step synthesis of highly luminescent carbon dots from orange juice: Application as excellent bio-imaging agents. Chem. Commun. 2012, 48, 8835–8837. [Google Scholar] [CrossRef] [PubMed]
  63. Yeom, S.; Oh, J.; Lee, E.J. Positive charge of arginine residues on histone H4 tail is required for maintenance of mating type in saccharomyces cerevisiae. J. Microbiol. Biotechnol. 2018, 28, 1573–1579. [Google Scholar] [CrossRef] [PubMed]
  64. Ramirez-Herrera, D.E.; Tirado-Guizar, A. Ratiometric arginine assay based on FRET between CdTe quantum dots and Cresyl violet. Microchim. Acta 2017, 184, 1997–2005. [Google Scholar] [CrossRef]
Figure 1. Schematic diagram of the construction of N-CD/calcein fluorescent sensor and its “on–off–on” mode for Arg and AP detection.
Nanomaterials 12 00976 g001
Figure 2. (a) HRTEM image of N-CDs; (b) particle size distribution of N-CDs; (c) XRD pattern of N-CDs; (d) FTIR spectrum of N-CDs.
Nanomaterials 12 00976 g002aNanomaterials 12 00976 g002b
Figure 3. (a) XPS full spectrum; (be) high-resolution (b) C1s; (c) N1s; (d) O1s and (e) Cl2p XPS spectrum.
Nanomaterials 12 00976 g003aNanomaterials 12 00976 g003b
Figure 4. (a) UV–vis spectra of N-CDs; (b) fluorescence spectra of N-CDs; (c) UV–vis spectra of calcein; (d) fluorescence spectra of calcein; (e) calculated CIE coordinates according to the fluorescence spectrum of N-CDs; (f) calculated CIE coordinates according to the fluorescence spectrum of calcein. The insets show the corresponding fluorescence colors.
Nanomaterials 12 00976 g004aNanomaterials 12 00976 g004b
Figure 5. The corresponding fluorescence spectra and pictures under UV light (the inset) with different ratios of N-CDs and calcein in the N-CD/calcein mixture.
Nanomaterials 12 00976 g005
Figure 6. (a) FL spectra of N-CDs, calcein, N-CD/calcein (excited by 370 nm); (b) schematic diagram of possible FRET in N-CD/calcein sensor.
Nanomaterials 12 00976 g006
Figure 7. Effect of pH on the fluorescence intensity of N-CDs, calcein and N-CD/calcein sensor.
Nanomaterials 12 00976 g007
Figure 8. Effect of iconic strength on the fluorescence intensity of N-CDs, calcein and N-CD/calcein sensor.
Nanomaterials 12 00976 g008
Figure 9. Effect of light exposure time on the fluorescence intensity of N-CDs, calcein and N-CD/calcein sensor.
Nanomaterials 12 00976 g009
Figure 10. (a) The response time to Arg of our N-CD/calcein sensor; (b) the response time to AP of N-CD/calcein/Arg complex system.
Nanomaterials 12 00976 g010
Figure 11. (a) Fluorescence intensity emission spectra of N-CD/calcein sensor with Arg addition. Insets show fluorescence color change of N-CD/calcein sensor in the absence (left) and presence (right) of the addition of 100 μM Arg. (b) Fitting curve between F1/F2 and CArg. Insets show fluorescence color change of N-CD/calcein sensor with increased CArg (from left to right).
Nanomaterials 12 00976 g011
Figure 12. (a) F1/F2 ratio of N-CD/calcein sensor on Arg and other substances’ detection; (b) F1/F2 ratio of N-CD/calcein sensor on Arg detection with or without interference substances.
Nanomaterials 12 00976 g012
Figure 13. (a) Fluorescence intensity emission spectra of N-CD/calcein/Arg complex system with AP addition. Insets show fluorescence color change of N-CD/calcein/Arg complex system in absence (left) and presence (right) of the addition of 3 μM AP. (b) Fitting curve between F1/F2 and CAP. Insets show fluorescence color change of N-CD/calcein/Arg complex system with increased CAP (from left to right).
Nanomaterials 12 00976 g013
Figure 14. (a) F1/F2 ratio of N-CD/calcein/Arg complex system on AP and other substances’ detection; (b) F1/F2 ratio of N-CD/calcein/Arg complex system on AP detection with or without interference substances.
Nanomaterials 12 00976 g014
Figure 15. (a) Zeta potential of N-CDs; (b) FTIR spectra of N-CDs, N-CDs and Arg; (c) possible reaction mechanism of our N-CD/calcein sensor when detecting Arg and AP.
Nanomaterials 12 00976 g015
Figure 16. (a) Illustration of the fluorescent logic gates based on the N-CD/calcein sensor; (b) the histogram of logic gates with various inputs.
Nanomaterials 12 00976 g016
Figure 17. F1/F2 ratio of N-CD/calcein sensor with sequential addition of Arg and AP.
Nanomaterials 12 00976 g017
Table 1. Comparison of different sensors for Arg sensing.
SensorLinear RangeLODRef.
Mg-CDs0.3–130 μM0.15 μM[25]
DNA-CuNC/CDs0–100 μM0.35 μM[38]
Conductometric biosensor−2.5–500 μM−2.5 μM[54]
AuNPs1–6 μM10 μM[55]
Citrate-capped AuNPs0.08–13.2 μM0.02 μM[56]
Capillary30–1500 μM10 μM[57]
N-CDs/calcein0.1–100 μM0.08 μMThis work
Table 2. Comparison of different sensors for AP sensing.
SensorLinear RangeLOD Ref.
Ni2P nanosheets/GCE0.5~4500 μM0.11 μM[58]
DNA-CuNC/CDs0–100 μM0.26 μM[38]
Mo2C@BMZIFs/GCE0.1–300 μM0.03 μM[59]
P-NC/GCE3–110 μM0.5 μM[60]
ZnO-MoO3-C/GCE2.5–2000 μM1.14 μM[61]
N-CDs/calcein/Arg0.03–3 μM0.02 μMThis Work
Table 3. Determination of Arg in bovine serum.
SampleFound in Sample
(μM)
Added
(μM)
Measured
(μM)
Recovery
(%)
RSD
(%)
Serum70.82576.04104.40.7
72.041586.3795.50.2
70.912596.07100.60.4
Table 4. Determination of AP in bovine serum.
SampleFound in Sample
(μM)
Added
(μM)
Measured
(μM)
Recovery
(%)
RSD
(%)
Serum00.50.51102.00.8
01.51.4999.31.9
02.52.4999.62.7
Publisher’s Note: MDPI stays neutral with regard to jurisdictional claims in published maps and institutional affiliations.

